1
x
Appendi
Final Report
Appendix A
Quality Assurance Project Plan
(QAPP)
Furnace & Oldham Ponds
Watershed Restoration Project
Section 604b Project # 2009-07/ARRA 604
Prepared by
Comprehensive Environmental Inc. for
Town of Pembroke, MA
Prepared for
Massachusetts Department of
Environmental Protection
Massachusetts Executive Office of Energy and Environmental Affairs
Richard K. Sullivan Jr., Secretary
Department of Environmental Protection
Kenneth L. Kimmel, Commissioner
Bureau of Resource Protection
Ann Lowery, Acting Assistant Commissioner
Division of Municipal Services
Steven J McCurdy, Director
June 2011
Title: Pembroke Ponds QAPP
Revision Number: 4
Revision Date: 5/5/2010
Page 2 of 51
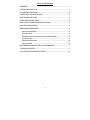
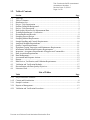
2. Table of Contents
1. Signature Page ..................................................................................................................................................... 1 2. Table of Contents ................................................................................................................................................. 2 3. Distribution List ................................................................................................................................................... 3 4. Project Organization and Responsibilities ........................................................................................................... 4 5. Problem Definition/Background .......................................................................................................................... 7 6. Project /Task Description ................................................................................................................................... 11 7. Data Quality Objectives ..................................................................................................................................... 17 8. Training Requirements....................................................................................................................................... 22 9. Documentation and Records .............................................................................................................................. 23 10. Sampling Process ............................................................................................................................................. 25 11. Sampling Method Requirements ...................................................................................................................... 26 12. Sample Handling and Custody Requirements.................................................................................................. 28 13. Analytical Methods Requirements ................................................................................................................... 29 14. Quality Control Procedures.............................................................................................................................. 30 15. Instrument/Equipment Inspection and Testing ................................................................................................ 31 16. Instrumentation Calibration and Frequency ..................................................................................................... 32 17. Inspection & Acceptance Requirements for Supplies ...................................................................................... 33 18. Data Acquisition Requirements ....................................................................................................................... 34 19. Data Management ............................................................................................................................................ 36 20. Assessment and Response Actions .................................................................................................................. 38 21. Reports ............................................................................................................................................................. 40 22. Data Review, Validation and Verification Requirements ................................................................................ 43 23. Validation and Verification Methods ............................................................................................................... 47 24. Reconciliation with Data Quality Objectives (DQO’s) ................................................................................... 49 25. Literature Cited ................................................................................................................................................ 51 Appendix A
Appendix B
Appendix C
Appendix D
Appendix E
Appendix F
Appendix G
PWA Water Quality Team
Training Process and Documentation
Water Sample Collection Data Sheet, Sample Bottle Label, Analytical Balance
Chain of Custody Form, Analytical Balance Certificate of Analysis, Qualification
/ Requalification Sampling Competency, QC Checklist, Calibration Log
Water Quality Testing and Qualification Procedure Manual
Analytical Balance State Certification, Mass DEP Certified Parameter List
Calibration/Maintenance SOPs for YSI-85 and YSI EcoSense pH100
QAPP Amendment 1 for Furnace & Oldham Pond Watershed Restoration Plan
Pembroke Watershed Association – Quality Assurance Project Plan 2
Title: Pembroke Ponds QAPP
Revision Number: 4
Revision Date: 5/5/2010
Page 3 of 51
3. Distribution List
Project Manager:
Frederick Baker Jr.
MA DEP Project Officer
Gary Gonyea, MA DEP
MA DEP Quality Assurance Officer
Richard Chase, MA DEP
US EPA Project Officer
Mary Jo Feuerbach, US EPA Region 1
US EPA Quality Assurance Officer
John Smaldone, US EPA Region 1
Program Monitoring Coordinator:
Charles Banks
Program Quality Assurance Officer:
Howard League
Modeling QA/QC Officer
Nick Cristofori, Comprehensive Environmental Inc.
Project Field Coordinator:
Patricia McCabe
Modeling Coordinator :
Dave Nyman, Comprehensive Environmental Inc.
Project Lab Coordinator:
Robert Bentley, Analytical Balance Labs
Pembroke Watershed Association:
www.pembrokeponds.org
Raymond Holman, President
Frederick Baker Jr. Vice-President
Elizabeth York Executive Secretary
William C McCabe, Treasurer
Mark Ames, Director
Arthur Boyle, Director
Patricia McCabe, Director
Dottie MacInnes, Director
Town of Pembroke
Edward Thorne, Town Manager
Department of Public Works
Eugene B. Fulmine, Director
Recreation Commission
Gregory Hanley, Chairman
Herring Brook Commission
Mark DiGiovanni, Chairman
Conservation Commission
Robert Clarke, Conservation Agent
Board of Health
Fred Leary, Health Agent
Pembroke Watershed Association – Quality Assurance Project Plan 3
Title: Pembroke Ponds QAPP
Revision Number: 4
Revision Date: 5/5/2010
Page 4 of 51
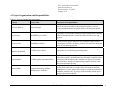
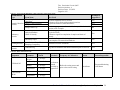
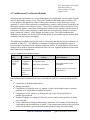
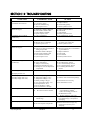
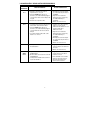
4. Project Organization and Responsibilities
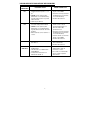
Table 4.1. Project Organization and Responsibilities
Name(s)
Project Title
Description of Responsibilities
Frederick Baker Jr.
Project Manager
Directs all project activities for the responsible agency, oversees
development &submission of QAPP; assists with writing the QAPP
Gary Gonyea
MassDEP Project Officer
Responsible for overall MA DEP project grant management including
technical and administrative supervision and final task review and
approval.
Richard Chase
MassDEP QA Officer
Reviews General QAPP Adoption Form, reads QA reports, confers
with program QA officer on quality control issues that arise during the
course of a monitoring program.
Mary Jo Feuerbach
US EPA Project Officer
Responsible for overall EPA grant management.
John Smaldone
US EPA Quality Assurance Officer
Charles Banks
Program Monitoring and Data
Management Coordinator
Responsible for review and comment on the Quality Assurance
Project Plan (QAPP). All modifications to the approved QAPP will be
documented and submitted to Mr. Smaldone for approval, including
but not limited to changes in sample design, sample collection, and
data assessment and reporting.
Oversees volunteer training & all elements of field monitoring &
assesses field performance; compiles field and analytical data into
comprehensive format, graphs and/or maps to correspond with format
compatible with the state; Develops reports including annual report;
Assists with writing the QAPP
Pembroke Watershed Association – Quality Assurance Project Plan 4
Title: Pembroke Ponds QAPP
Revision Number: 4
Revision Date: 5/5/2010
Page 5 of 51
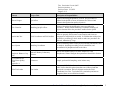
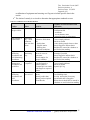
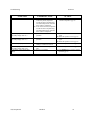
Name(s)
Project Title
Description of Responsibilities
Howard League
QA Officer
Assists with writing the QAPP & oversees QA procedures as
outlined in the QAPP to ensure all elements are followed and
evaluates data against data quality objectives
Nick Cristofori
Modeling QA/QC Officer
Assists with writing the QAPP and oversees modeling QA
procedures. Works with the Modeling Coordinator to ensure all
project elements follow the procedures outlined in the QAPP.
Patricia McCabe
Field Coordinator and Field Auditor
Responsible for training and supervising volunteers. Ensures field
forms are properly filled out and water samples and forms are
transported to analytical lab as needed. In collaboration with project
QA Officer, performs QC check Audit to make sure procedures are
followed, maintains QC Logs.
Dave Nyman
Modeling Coordinator
Oversees modeling efforts for the project including calculations, land
use analysis, hydrologic modeling, runoff calculations, and
determination of phosphorus loads to the lakes.
Robert E Bentley, Laboratory
Director
Directs and conducts analysis of water samples for Total
Phosphorous, Nitrate Nitrogen other parameters identified in Section
6
Analytical Balance Corp.
Labs
See Volunteers list:
PWA Water Quality
Team.
Appendix A
PWA Test Leader
Volunteers
Test Leader
Sample, perform field sampling, assist in data entry.
Reports to the Field Coordinator. Oversees actual tests on a particular
pond. Verifies that all required procedures are followed and that
paperwork is complete. Delivers all paperwork to the Field
Coordinator for review. Test leaders for a particular pond test are
designated, there are no official test leaders.
Pembroke Watershed Association – Quality Assurance Project Plan 5
Title: Pembroke Ponds QAPP
Revision Number: 4
Revision Date: 5/5/2010
Page 6 of 51
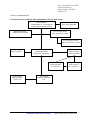
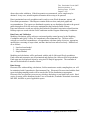
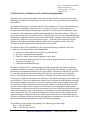
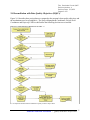
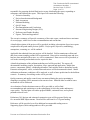
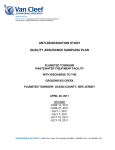
Table 4.2. Organizational Chart:
Lines between boxes indicate who communicates directly with whom
Project Manager
Frederick Baker Jr., Vice President,
Pembroke Watershed Association
MA DEP QA Officer
Richard Chase, MA DEP
MA DEP Project Officer
Gary Gonyea, MA DEP
U.S. EPA QA Officer
John Smaldone, U.S. EPA
U.S. EPA Project Officer
Mary Jo Feuerbach, U.S. EPA
Howard League,
Project QA Officer
Charles Banks, Program
Monitoring and Data
Management Coordinator
Patricia McCabe,
Field Coordinator
and Field Auditor
Robert Bentley,
Analytical Balance
Labs Director
Nick Cristofori
Modeling QA/QC
Officer, CEI
Test Leaders and
Field Volunteers
See Appendix A
Dave Nyman
Modeling Coordinator,
CEI
Pembroke Watershed Association – Quality Assurance Project Plan 6
Title: Pembroke Ponds QAPP
Revision Number: 4
Revision Date: 5/5/2010
Page 7 of 51
5. Problem Definition/Background
The Pembroke Watershed Association - www.pembrokeponds.org
The Pembroke Watershed Association (PWA) was created on September 25, 2004 with the
following mission statement:
To educate the public and restore and protect the Ponds of Pembroke for
clean and safe recreational, social and civic activities and to preserve
these unique resources for future generations.
The Pembroke Watershed Association implemented numerous programs for fundraising (fishing
derby, family fun day, raffles, cook-outs), community education and involvement (workshops,
lectures, public meetings, pamphlet distribution, pond cleanups, and school presentations) and
maintains a visible presence in the community through newspapers, website, and local cable
programming. They have partnered with the NSRWA to support education and low
impact/green solutions to growth and water management and have joined the Watershed Action
Alliance on the south shore to share best practices and continue to utilize experts in the area of
water quality and water management.
The PWA has developed an aggressive program of water quality monitoring for the five ponds in
our study group. Our initial water quality plan was based on input from other watersheds,
COLAP and Rivernet seminars, previous diagnostic surveys mentioned, and information from
the Massachusetts Waterwatch website. We selected sites based on previous studies and
potential for valuable information regarding non-point source pollution as well as identified sites
of pollution, such as bog return effluent or storm drains. We established a contract with
Analytical Balance Laboratories in Middleboro, MA to conduct chemical analysis and garnered
financial support from the town of Pembroke for chemical monitoring of the ponds. We
developed field testing forms, a training manual, created or obtained testing equipment (oxygen
meters from NSRWA, created a testing stick and Secchi discs). We also purchased a Hach
Quanta meter to allow us to obtain turbidity and DO readings immediately, but found the
equipment difficult to maintain, calibrate, and it needed repair multiple times; hence, we retired
the meter. In July 2007 we were granted the use of YSI Model 85 meters and Checkmite pH
meters which have been successfully integrated into our testing protocols. In 2009 we were
granted use of YSI EcoSense pH100 meters to replace the Checkmite meters. We have
maintained strict annual training and remediation standards to ensure that our water quality
testing processes are accurate and reliable.
Initially we obtained grab samples, Secchi disc readings, and recorded DO readings in shallow
water, often 2-3 feet in depth, with one deep hole sample area in each pond. We found our data
to be inconsistent and Secchi disc readings were only accurate in deeper areas. The team of
volunteer testers, the field monitoring coordinator, and the program monitoring coordinator
reviewed the field monitoring sheets and the testing procedures with each testing session, and
over time made decisions to improve the quality of the testing. The field monitoring sheets have
been revised multiple times, and now include specific directions for completion. We have
Pembroke Watershed Association – Quality Assurance Project Plan 7
Title: Pembroke Ponds QAPP
Revision Number: 4
Revision Date: 5/5/2010
Page 8 of 51
moved the sampling sites to deeper water and set a standard depth for all samples to be taken,
and have found the data collection to be more consistent over the expanse of the pond. We have
reduced the number of testing sites given the consistency of the data, and we have now included
field blanks and blind samples as part of the routine testing process on each pond. Our water
quality testing procedure manual has been revised multiple times to reflect the continuous quality
improvement processes and lessons learned along the way.
This program has provided a valuable data base for future comparisons and evaluation and has
provided the backbone for the volunteer training and water quality analysis SOP’s. It is available
on our web site www.pembrokeponds.org
The Value of Pembroke’s Ponds
The Ponds of Pembroke are a natural resource (drinking water, irrigation for cranberry bogs and
homes) as well as a water recharge system for the town wells. Furnace pond is a Class A. Public
water supply source for Brockton Water Works. The ponds provide and support aquatic and
wildlife habitats. Oldham and Furnace ponds provide herring spawning grounds. The ponds
provide aesthetic beauty and natural resources that are unique to Pembroke. They provide a
recreational resource for the town, including town beaches and fishing access and are a source of
additional tax revenue from waterfront properties. The ponds within the town are a valuable part
of either the South Coastal Watershed or Taunton Watershed and contribute to the Mass Bay
estuary.
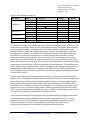
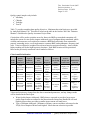
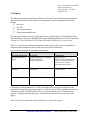
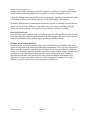
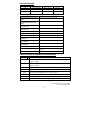
Description of Pembroke’s Ponds Project
Oldham Pond, Furnace Pond, Little Sandy Bottom Pond and Hobomock Pond are bodies of
water located within the town of Pembroke, Massachusetts and are part of the South Coastal
Watershed. In addition, Stetson Pond, also located within the boundaries of Pembroke,
Massachusetts is part of the Taunton River Watershed. These five ponds comprise the focus of
our study. A description of each pond in our study is as follows:
Name
Furnace Pond
WBID#
MA94043
Size
(acres)
103
Category
(2008)
5
Little Sandy Bottom
Pond
Oldham Pond
MA904085
56
2
MA94114
232
4c
Hobomock Pond
MA94177
13
2
Stetson Pond
MA62182
88
5
Reasons for study or
impairment
Impaired due to organic
enrichment / Low DO
Not Impaired, monitoring to
maintain status
Impairment from exotic species
Not Impaired, monitoring to
maintain status
Impaired due to Nutrients,
organic enrichment / low DO
and exotic species
Information from- the South Shore Watersheds Water Quality Assessment Report – 2001. Massachusetts Executive
Office of Energy and Environmental Affairs, Department of Environmental Protection (with updates as needed).
The categories are those identified in the Massachusetts Integrated List (2008). Category 5 are
“Waters requiring a TMDL”; Category 4c are waters where “Impairment not caused by a
Pembroke Watershed Association – Quality Assurance Project Plan 8
Title: Pembroke Ponds QAPP
Revision Number: 4
Revision Date: 5/5/2010
Page 9 of 51
pollutant”; Category 2 is no impairment, NR indicates Not Reported. Two of these ponds,
Oldham Pond and Furnace Pond have significant water quality problems with Oldham Pond
listed as Category 4c for exotic species on the Massachusetts 303(d) list of impaired waters and
Furnace Pond listed as Category 5 for organic enrichment and low dissolved oxygen. Oldham
Pond is approximately 220-acres in size, approximately twelve feet deep, and directly feeds
Furnace Pond. Furnace Pond is approximately 96-acres in size and approximately eight feet
deep. Historic water quality data for both ponds indicates significantly high total phosphorus
levels and turbidity likely lending to the excessive nuisance aquatic weeds and algal blooms.
Located in a relatively developed watershed, the shoreline of these ponds is dotted with full-time
residences and several commercial businesses.
Previous Studies
Previous studies include a Diagnostic Feasibility Study completed in 1993 for both Furnace and
Oldham Ponds (Baystate Environmental Consultants, Inc., 1993). This study was completed
under MGL Chapter 628, the Massachusetts Clean Lake Program that existed at that time.
Extensive water quality data in this survey indicates that Oldham and Furnace have high levels
of nutrient enrichment and invasive aquatic vegetation. Both ponds were also found to have
stormwater impacts, although at the time the study’s recommendations said little about how to
specifically deal with stormwater contamination. The study did recommend leaching catch basins
for the Furnace Pond drainage area. A subsequent study of Oldham Pond was completed under
the Department of Environmental Management’s (DEM now DCR) Lakes Program in the year
2000 (Comprehensive Environmental, Inc., 2000) while Furnace was completed under the same
program in 2001 (Comprehensive Environmental, Inc., 2001). These studies included additional
sampling data and updated recommendations based on the advancement of stormwater
technologies at the time.
As a result of these studies, beginning in 2001, the Town received and successfully completed
several MassDEP/EPA s.319 Nonpoint Source Pollution grant projects. Projects concentrated on
the lower reaches of the watershed by retrofitting 27 catch basins with leaching basins and using
a vacuum street sweeper adjacent to the ponds. More recently, the Town worked with the North
and South Rivers Water Association (NSRWA), the Pembroke Watershed Association (PWA)
and CEI to engineer and construct several Low Impact Development (LID) retrofit projects at the
Oldham Pond boat ramp and Town Hall. Since 2006, the PWA has collected significant water
quality data from both ponds and in 2008 began data collection under an approved Quality
Assurance Project Plan.
As the studies approach the 10 year mark, the Town and the PWA would like to prepare an
update that will evaluate watershed improvements completed to date, allow for the incorporation
of more recent development and water quality testing and provide more specific BMP
recommendations with quantifiable results to help guide future restoration efforts. Stakeholders
include the Town of Pembroke, watershed residents, citizens utilizing the public beach for
recreational purposes and swimming lessons and the dedicated members of the PWA.
Additionally, Furnace Pond (fed by Oldham Pond) is a back-up drinking water supply for the
City of Brockton. Stakeholders aim to gain over the next 10-years improved water quality to
Oldham and Furnace Pond, specifically reduced phosphorus and sediment inputs therefore
Pembroke Watershed Association – Quality Assurance Project Plan 9
Title: Pembroke Ponds QAPP
Revision Number: 4
Revision Date: 5/5/2010
Page 10 of 51
reducing algal blooms and nuisance aquatic weeds and decreasing fish kill events currently
resulting from low DO.
The PWA received approval for a 604b assessment grant to further assess non-point source
pollution in Oldham and Furnace in conjunction with Comprehensive Environmental Inc. The
primary purpose of the project is to develop a long-term watershed restoration plan for both
Oldham and Furnace Pond by utilizing a quantitative approach. This approach will prioritize
future watershed protection activities to obtain the most cost effective pollutant removal, while
estimating the anticipated improvements. The study will focus on where the pollutants, in this
case phosphorus, are coming from and how much of it needs to be removed under existing and
buildout conditions to reduce in-lake phosphorous levels to meet recreational goals. Ultimately,
the Town of Pembroke can use the plan to implement the most cost-effective BMPs to meet
water quality goals and to obtain future funds under the s319 grant program for implementation.
Monitoring and Data Use Objectives
This project will provide information related to the following issues:
9 Water Quality Monitoring
9 Data Assessment and recommendations for Best Management Practices (BMP)
9 As explained in the GENERAL QAPP, the monitoring objectives of this project include:
9 Provide quality-controlled data that support the assessment and restoration of the
watershed and critical habitats through the implementation of Commonwealth programs
such as:
9 DEP’s 305(b) water body health assessments and TMDL development for impaired
waters
9 EOEEA’s watershed action plans for the Taunton and South Coastal Watersheds
9 National Estuary Programs’ Comprehensive Management Plans
9 Leverage the Commonwealth’s funds to increase the collection of quality data
9 Water body/watershed health assessment
9 Impact assessment
9 Public education and outreach
Table 5.1. Data users and intended uses
User
Pembroke Municipal Boards
Pond Residents
MA Department of
Environmental Protection
Project Partners:
Recreation Committee
Herring Brook Commission
Conservation Commission
Intended Uses
To guide local control & restoration strategies & secure money to
implement projects. Prioritize management efforts as they relate
to non-point source pollution storm water management plan
To help understand the impact of actions within the watershed.
Understand aquatic vegetation & restoration efforts.
To provide information in future assessment & in
developing total maximum daily load strategies.
To support grant applications for sedimentation projects
& other non-point source pollution grants
Pembroke Watershed Association – Quality Assurance Project Plan 10
Title: Pembroke Ponds QAPP
Revision Number: 4
Revision Date: 5/5/2010
Page 11 of 51
6. Project /Task Description
Project Description
The Pembroke Watershed Association will organize and train volunteers to conduct water quality
monitoring in the five (5) designated ponds within the town of Pembroke in the South Coastal
and Taunton River watersheds. The monitoring will take place at the specific sites listed below
for each pond. Site selection was established with reference to those sites chosen in the 1993
diagnostic and feasibility study performed by Bay State Environmental Consultants Inc. and inhouse analysis by the Pembroke Watershed Association to identify addition sites for assessment.
Water quality monitoring teams test:
1. pH
2. Water Temperature
3. Dissolved Oxygen
4. Conductivity
5. Salinity
6. Water clarity (Secchi disk)
The grab sample is sent to Analytical Balance to test for:
1. Turbidity
2. Total Phosphorous
3. Alkalinity
4. Chloride
5. Nitrogen Series is tested once per year per pond
a. Nitrite
b. Nitrate
c. Ammonium Nitrate
d. TK Nitrogen
e. Total Nitrogen is calculated by the lab
Monitoring will be conducted June through September on a monthly basis for Oldham and
Furnace ponds, bi-monthly for Stetson pond and annually for Little Sandy Bottom pond as per
the schedule submitted by the Program Monitoring Coordinator. At present, testing on
Hobomock pond has been suspended due to the discovery of Hydrilla and will not be resumed
until authorized by the appropriate state agency. A specified number of sample sites have been
designated for each pond.
Currently, all grab samples are taken at a depth of 48 inches. The YSI /pH instrument
measurements are conducted at a depth of 48 inches and 84 inches to obtain a profile of the pond
and determine if the pond stratifies. Sampling in Oldham and Furnace Ponds will involve
collecting temperature and dissolved oxygen data at two-foot intervals at each deep hole
location. If stratification is found to occur in each of these two ponds, two phosphorus samples
will be collected, one from the epilimnion layer (surface) and one from the hypolimnion layer
(bottom). All test parameters listed above are evaluated and compared to state standards and
Pembroke Watershed Association – Quality Assurance Project Plan 11
Title: Pembroke Ponds QAPP
Revision Number: 4
Revision Date: 5/5/2010
Page 12 of 51
when applicable US EPA nutrient criteria. The information collected will be used as base line
data against which to assess future changes.
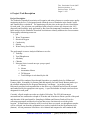
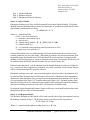
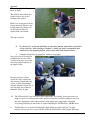
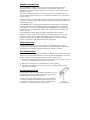
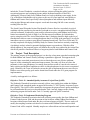
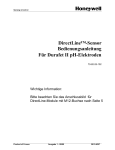
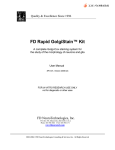
Pembroke Watershed Association: Water based testing
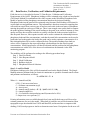
Using Google Earth view of our ponds we have included our testing sites, marked in yellow, on
each of the ponds. Site identification includes our identifier and the 1988 survey identifier for
the same site. We utilized GPS coordinates to determine and standardize our sites. We
identified our test sites in red on the following maps:
Map One: overall map that shows all of the ponds
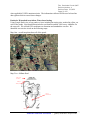
Map Two: Oldham Pond
Country Lane
(not shown)
Tributary A
Tributary B
O-08 SE
Pembroke Side
Outlet
Pembroke Watershed Association – Quality Assurance Project Plan 12
Title: Pembroke Ponds QAPP
Revision Number: 4
Revision Date: 5/5/2010
Page 13 of 51
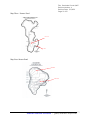
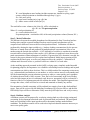
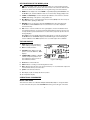
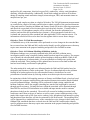
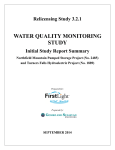
Map Three: Furnace Pond
F-08 South
Outlet
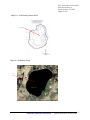
Map Four: Stetson Pond
S-04 North
S-05 South
Pembroke Watershed Association – Quality Assurance Project Plan 13
Title: Pembroke Ponds QAPP
Revision Number: 4
Revision Date: 5/5/2010
Page 14 of 51
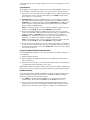
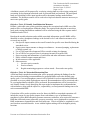
Map Five: Little Sandy Bottom Pond
LS-04 Central
Map Six: Hobomock Pond
H-02
Central
Pembroke Watershed Association – Quality Assurance Project Plan 14
Title: Pembroke Ponds QAPP
Revision Number: 4
Revision Date: 5/5/2010
Page 15 of 51
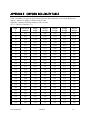
Table 6.1. GPS coordinates for sample sites
Waterbody
Oldham Pond
Furnace Pond
Stetson Pond
Little Sandy Pond
Hobomock Pond
Name
Tributary A
Tributary B
Country Lane
O-08
Outlet
F-08
Outlet
S-04
S-05
LS-04
H-02
Description
Upstream of culvert
Southeast
Pembroke Side
South
North
South
Central
Central
Latitude
420 04.217 N
420 04.172 N
420 04.496 N
420 03.645 N
420 03.550 N
420 03.233 N
420 03.186 N
420 01.882 N
420 01.741 N
420 02.495 N
420 03.393 N
Longitude
700 50.640 W
700 50.669 W
700 50.724 W
700 49.910 W
700 49.976 W
700 49.315 W
700 49.182 W
700 49.779 W
700 49.330 W
700 50.055 W
700 48.618 W
In conjunction with the field sampling measures at Furnace and Oldham Ponds, a land use based
model and a lake response model utilizing subwatershed characteristics and the Simple Method
to model pollutant loadings. Modeling will be performed for both existing conditions and
buildout conditions, while also roughly estimating how much of the load might be corrected
through specific measures. Existing land uses within the watershed will be obtained through
MassGIS files and local GIS information as available and input into the model to estimate
phosphorus loads from the watershed. The model will account for loadings associated with
stormwater runoff from each type of land use as well as septic systems within proximity of the
ponds. Other inputs such as flow from active cranberry bogs, phosphorus from internal recycling
and phosphorus from baseflow will also be estimated for use in the model. The modeling effort
will be supported by a windshield survey of the watershed to review changes in the Furnace and
Oldham Pond watersheds that have occurred since the 2000 and 2001 studies and to identify
specific pollution sources that may require more attention in the proposed modeling and possible
sites for BMP locations.
Realistic, achievable water quality goals that promote the recreational and wildlife use of the
ponds will be set for phosphorus within Oldham and Furnace Ponds. The required load reduction
to meet these goals under existing and buildout conditions will be calculated using the model.
Based on the needed reductions and available watershed information, specific BMPs will be
identified to reduce phosphorus loadings to the desired levels. 30% engineering designs will be
prepared for the top 3-5 structural improvements. Monthly and quarterly project status reports
will be prepared and submitted to MassDEP per the new ARRA reporting requirements, as well
as a final project report per grant guidelines and required copies.
A draft and final watershed restoration plan will be prepared outlining the findings and include
recommendations for proposed BMPs to meet the defined water quality goals. Costs and
phosphorus removal will be defined for each recommended BMP and presented as cost per
pound of phosphorus removed. Recommendations will be prioritized and a 10-year
implementation schedule will be performed for Oldham and Furnace Ponds.
Pembroke Watershed Association – Quality Assurance Project Plan 15
Title: Pembroke Ponds QAPP
Revision Number: 3
Revision Date: 4/16/2010
Page 16 of 51
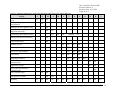
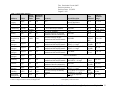
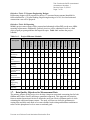
Table 6.2. Anticipated Schedule Please update and assume QAPP will be approved for January 2010 start.
Activity
Finalize General QAPP Adoption
Form
Meeting with agency
representatives
J
F
M
XX
XX
XX
A
M
J
J
A
S
O
N
D
Draft report and watershed
restoration plan
XX
XX
Engineering designs
XX
XX
XX
Meeting with Water Quality Team
XX
Equipment inventory, purchase,
inspection and testing
XX
Field training and database training
XX
XX
Meeting with analytical laboratory
XX
Field reconnaissance
XX
XX
XX –
Ongoing -- XX
XX
Sampling surveys
XX
XX
XX
XX
Data entry
XX
XX
XX
XX
XX
XX
XX
XX
XX
XX
XX
XX
XX
Data review and validation
Field audit(s)
XX
Modeling and analysis
XX
XX
Final report and watershed
restoration plan
XX
Prior year final report
XX
Data uploads to website
Reporting
J
XX
XX
XX
XX
XX
XX
XX
XX
XX
XX
XX
XX
XX
XX
XX
XX
Pembroke Watershed Association – Quality Assurance Project Plan 16
Title: Pembroke Ponds QAPP
Revision Number: 4
Revision Date: 5/5/2010
Page 17 of 51
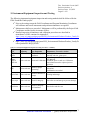
7. Data Quality Objectives
The following quality control measures and data quality objectives shall be employed for the
Pembroke Ponds Project .
Overall sampling precision will be estimated by the following
9 Taking duplicate field measurements (instruments) at least once per pond annually.
9 Collecting duplicate field samples at least once per pond annually.
9 Utilize QC procedures including field duplicates and duplicate measurements for meters
to validate readings
Accuracy of results will be estimated or confirmed by the following
9 All samples submitted to Analytical Balance Corp. Laboratories. Department of
Environmental Protection State Certification No. M-MA022 see certification in appendix
E
9 Review of all data and results to verify accuracy and identify discrepancies or outlier data
as outlined in section 23
Data Representativeness will be met by the following:
9 Test sites are selected to be representative of typical conditions for the water body. The
temperatures and oxygen levels at our four foot testing depth are likely to be affected by
nutrient uptake, temperature gradients and other factors
9 Any abnormal or episodic conditions that may affect the representativeness of sample
data are noted and maintained as metadata.
9 Other sites chosen as possible locations of point source contamination have been
identified and noted.
9 Results from all sites will not be extrapolated to other, unmonitored, portions of the water
body or watershed.
Comparability of project data among sites and with that of others will be enhanced by the
following:
9 Using established protocols
9 Documenting methods, analysis, sampling sites, times and dates, sample storage and
transfer, as well as laboratories and identification specialists used so that future surveys
can produce comparable data by following similar procedures.
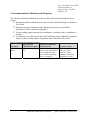
Data Completeness goals shall be:
9 At least 80% of the anticipated number of samples will be collected, analyzed and used
9 Tracked by keeping detailed and complete sample and survey records
9 Summarized via a report detailing number of anticipated samples, number of valid
results, and percent completion for each parameter
9 Tracking water quality control requirements by keeping accurate records
Pembroke Watershed Association – Quality Assurance Project Plan 17
Title: Pembroke Ponds QAPP
Revision Number: 4
Revision Date: 5/5/2010
Page 18 of 51
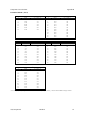
Data Completeness - Measurements Completed by PWA
Parameter
Number of valid measurements
anticipated
Number of valid
measurements needed to
reach 80% completeness
pH
Oldham 5 sites x 4 months
27
Water Temperature
Furnace 2 sites x 4 months
27
Stetson 2 sites x 2 months
Dissolved oxygen
Hobomock Suspended
Secchi Disk
Little Sandy 1 site x 1 month
Salinity
27
27
27
Total Anticipated measurements for each
parameter = 33
Conductivity
27
27
Additional field duplicates
of each measurement
Total Anticipated measurements for each
parameter = 24
24 Anticipate one QC per
pond
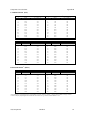
Data Completeness - Samples Collected and Delivered to Analytical Balance Labs.
Parameter per sample
bottle
Number of valid samples anticipated
Number of valid samples
needed to reach 80%
completeness
Chloride
Oldham 5 sites x 4 months
27
Total Phosphorous (P)
Furnace 2 sites x 4 months
27
Stetson 2 sites x 2 months
Turbidity
Hobomock Suspended
Alkalinity
Little Sandy 1 site x 1 month
27
27
Total Anticipated samples for each
parameter = 33
TK Nitrogen
20
Nitrogen series will be tested once per year
per pond There are 5 parameters with a
total of 4 anticipated samples for each
parameter =
Nitrite/nitrogen
Nitrate/nitrogen
Ammonia-nitrogen
20
20
20
A total of 20
Total Nitrogen
20
Calculated by the lab
Duplicate sample marked
as a blind sample
Total Anticipated samples for each
parameter = 16
16 - Anticipate one blind
duplicate sample per pond
A Duplicate sample will be collected and compared to results for an actual sample to verify
testing consistency and technique. Duplicate samples are blind to the lab.
Pembroke Watershed Association – Quality Assurance Project Plan 18
Title: Pembroke Ponds QAPP
Revision Number: 4
Revision Date: 5/5/2010
Page 19 of 51
Quality control samples only include:
9 Alkalinity
9 Chloride
9 Turbidity
9 Total P
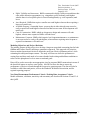
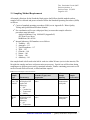
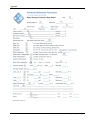
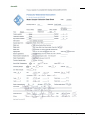
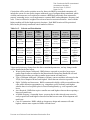
Table 7.1 provides sampling data quality objectives. Minimum detection limits were provided
by Analytical Balance Lab. This table is based on the table in the October 2001 MA Volunteer
Monitor’s Guidebook to Quality Assurance Project Plans
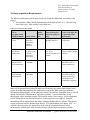
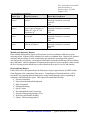
Criteria that will be used to prioritize areas for future site BMPs or watershed restoration will
include the extent of water quality impacts addressed, type of pollutant being remediated, public
visibility and awareness, area required to construct a BMP that sufficiently treats stormwater,
property ownership issues, cost to implement or construct BMP, and maintenance frequency and
costs. Criteria will then be weighted for each area based on associated benefits. Areas with the
highest ranking will be the highest priority locations. Each BMP location will be prioritized
based on the previously mentioned criteria ranked as follows:
Criteria and Prioritization
Point
Value
Water
Quality
Impact
Addressed
Type of
Pollutant
Addressed
3
Large
Improvement
Expected
Phosphorus
2
Moderate
Improvement
Expected
Nitrogen /
Dissolved
Oxygen
1
Minimal
Improvement
Expected
Turbidity
and Other
Pollutants
Public
Visibility
and
Awareness
High
Visibility
(downtown,
high profile)
Medium
Visibility
(e.g.
secondary
road)
Low
Visibility
(e.g. woods,
underground
BMP)
Area
Required
Minimal
Area
Required
(<0.25
acres)
Medium
Area
Required
(0.25 - 1
acre)
Large
Area
Required
(>1 acre)
Property
Ownership
Issues
Cost of
Design and
Construction
Owned by
Town,
Undeveloped
Highly Cost
Effective
Low (>5 year
frequency /
low cost)
Owned by
Other,
Undeveloped
Moderately
Cost
Effective
Medium (2- 5
year
frequency /
moderate
cost)
Developed
Land
Minimally
Cost
Effective
High (<1 - 2
year
frequency /
high cost)
Maintenance
Concerns
Values and criteria may change from the above-mentioned parameters, and any changes made
will be detailed in the final report.
• Water Quality Impact Addressed: BMPs that are expected to provide a larger water
quality improvement as outlined in the Massachusetts Stormwater Handbook will rank
highest whereas those providing a smaller improvement will rank lower.
• Type of Pollutant Addressed: pollutants of primary concern and those referenced on the
303(d) List of Impaired Waters rank highest. More than one selection is possible.
Pembroke Watershed Association – Quality Assurance Project Plan 19
•
•
•
•
•
Title: Pembroke Ponds QAPP
Revision Number: 4
Revision Date: 5/5/2010
Page 20 of 51
Public Visibility and Awareness: BMPs constructed in highly visible areas and those that
offer public education opportunities (e.g. raingardens, gravel wetland), rank highest
whereas those in a less public place or located underground (e.g. swirl separators) rank
lower.
Area Required: BMPs that require a smaller area rank highest whereas those requiring a
larger area rank lower.
Available Property / Ownership Issues: property that is either already town-owned or
easily acquired will rank highest whereas areas that have no room for development will
rank lower.
Cost of Construction: BMPs which are cheapest to design and construct will rank
highest, whereas more expensive BMPs will rank lower.
Maintenance Concerns: BMPs which require less frequent maintenance, or maintenance
is not expected to be costly will rank highest, whereas those requiring more frequent or
expensive maintenance will rank lower.
Modeling Objectives and Project Decisions
The primary purpose of this project is to develop a long-term watershed restoration plan for both
Oldham and Furnace Pond by utilizing a quantitative approach. This approach will prioritize
future watershed protection activities to obtain the most cost effective pollutant removal, while
estimating the anticipated improvements. The study will focus on where the pollutants are
coming from and how much need to be removed under both existing and buildout conditions to
reduce in-lake phosphorus levels to meet recreational goals.
Data will be used to assess the most appropriate sites for structural BMP construction in terms of
the beneficial impact on surface water quality. MA DEP will use the data to assess the
performance of projects it funds through their respective grant programs. The data will also be
available to other interested parties, such as the Pembroke Watershed Association, and for
regional reporting purposes.
New Data Measurement Performance Criteria / Existing Data Acceptance Criteria
Model calibration, validation, sensitivity and uncertainty are described in Sections 22 and 23 of
this QAPP.
Pembroke Watershed Association – Quality Assurance Project Plan 20
Title: Pembroke Ponds QAPP
Revision Number: 4
Revision Date: 5/5/2010
Page 21 of 51
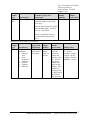
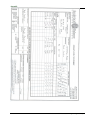
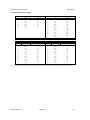
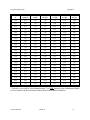
Table 7.1. Data Quality Objective
Indicator
Dissolved
Oxygen
Water Temp.
Units
Water
Quality
Limit
mg/l
6.01
0.0
+0.5
°F
0.0
+0.5 °
Conductivity
µS/cm
0.5
+ 5% of known QC standard.
10% RPD
N/A
pH
pH units
681
Background
6.5-8.31
Overall Precision
<0.5 mg/l Difference
between duplicates
+/- 0.5 °C
na
+ 0.2
N/A
Salinity
psu
2503
0.1
+0.2 of QC standard
80-120% recovery of seawater
standard of known conductivity
20% RPD
N/A
mg/l P
0.0082
0. 01
mg/l N
14
0.05
mg/l N
103
0.01
mg/l N
0.382
0.5
mg/L
0.322
Alkalinity
mg/l
203
4.0
Chloride
ug/l
2.92
2.0
AmmoniaNitrogen
mg/l
0.2543
0.10
Turbidity
NTU
3.042
0.25
Secchi disk
Transparency
ft
14.82
0.5
Total
Phosphorous
(water)
Nitrite
Nitrogen
Nitrate
Nitrogen
T. Kjeldahl
Nitrogen
Total
Nitrogen
Minimum
Detection
Limit
Accuracy
80-120% recovery for QC
standard and lab fortified matrix
80-120% recovery for QC
standard and lab fortified matrix
80-120% recovery for QC
standard and lab fortified matrix
80-120% recovery for QC
standard and lab fortified matrix
20% RPD
+/- 0.02 if <0.1 mg/l or 20%
RPD if > 0.1 mg/l
+/- 0.02 if <0.1 mg/l or 20%
RPD if > 0.1 mg/l
20% RPD
EPA
Method
Approx.
Potential
Range
N/A
0.5-15.0
N/A
0.0-90.0
10-2000
(fresh water)
4.0-10.0
SM
4500-P
B/E
SM
4110B
SM
4110B
EPA
351.2
0.01-0.50
0.05-3.0
.01-3.0
0.50-3.0
This is a calculation
80-120% recovery for QC
standard and lab fortified matrix
80-120% recovery of seawater
standard of known conductivity
80-120% recovery for QC
standard and lab fortified matrix
90-110% recovery of turbidity
standard
NA
1. 314 CMR 4.00 Massachusetts Surface Water Quality Standards.
2. EPA Eco-Region Nutrient Criteria, Eco-Region XIV.
+/- 2.0 mg/l if <20 mg/l or
20% RPD if > 20 mg/l
20% RPD
+/- 0.01 if <0.1 mg/l or 20%
RPD if > 0.1 mg/l
+/- 0.5 NTU if < 1 NTU or
20%RPD if > 1.0 NTU
+/- 0.5 ft for duplicate
readings
EPA
310.2
SM
4110B
EPA
350.1
SM
2130B
N/A
4.0-25.0
2.0-60.0
0.10-0.50
0-200
0.0-30.0
3. EPA National Recommended Water Quality Standards
4. EPA Quality Criteria for Water
Pembroke Watershed Association – Quality Assurance Project Plan 21
Title: Pembroke Ponds QAPP
Revision Number: 4
Revision Date: 5/5/2010
Page 22 of 51
8. Training Requirements
Training in the following general areas shall be conducted as part of the Pembroke Ponds Project
9
9
9
9
9
9
Field Safety
Water sample collection
Filling out field sheets
Recordkeeping and documentation
Electronic Meters
Instructor Training
Project training shall take place as specified in PWA Volunteer Training Manual see Appendix.
All training activities shall be documented by:
9 Training forms signed by the Instructors
9 Documented in a final report
9 Documented in a Water Quality Qualification Report
Data entry, database management, record keeping, documentation and report writing are under
the authority of the Program Monitoring Coordinator and Field Coordinator.
Modeling will be done by Comprehensive Environmental. Staff familiar with both landuse and
lake response models will perform modeling, including calculations, coefficient approximations,
and accuracy checks. Although no special training is required to perform modeling, experienced
personnel with knowledge of the underlying principles of the model will oversee development
and application of the spreadsheet model used in this study.
Pembroke Watershed Association – Quality Assurance Project Plan 22
Title: Pembroke Ponds QAPP
Revision Number: 4
Revision Date: 5/5/2010
Page 23 of 51
9. Documentation and Records
The following general documentation procedures will be followed to ensure that adequate and
acceptable level of records is kept:
9
9
9
9
9
Document survey and sample information using Field Sheets
Document sample custody at all times using Chain-of-Custody Forms, including lab
samples on ice/in fridge until lab delivery
Track sample identification using sample labels
Document lab results using lab reports
Document QC requirements using the water quality control checklist
The specific forms to be used for the PWA water project are listed and described in Table 9.1.
See sample forms in appendix. The Program Monitoring Coordinator will ensure that all sample
containers are acceptable for use.
Modeling Documentation
Documentation of this project will be kept on file by the MA DEP, the Town of Pembroke,
Pembroke Watershed Association, and Comprehensive Environmental Inc. (CEI). The Modeling
Coordinator will be responsible for assembling and maintaining project documents and records.
Modeling data will be stored in a Microsoft Excel spreadsheet. Summary data will be tabulated
into various tables and graphs and presented in the draft and final reports. Maps generated from
MassGIS, aerial, and other data sources will be stored in an electronic format. Hard copies will
be included in the final report. Other aspects of the modeling effort will be documented in a
narrative and stored in Microsoft Word format.
Monthly and quarterly reports will document work from the most recent reporting round. The
final report will document procedures and findings for the entire project. All reports will be
submitted to the Town of Pembroke, Pembroke Watershed Association, EPA and MA DEP for
approval.
Storage
The central storage location for all final project deliverables is the Comprehensive
Environmental office in Marlborough, MA. Files will be maintained at this location for a
minimum period of 5 years. Electronic files will be stored on servers at Comprehensive
Environmental. Servers are secure and backed up several times per week. Electronic data will
be stored for a minimum of five years.
QAPP Distribution
Upon approval by MA DEP and EPA, the approved QAPP will be distributed to those specified
on the Distribution List as outlined in Section 1.3. Distribution will be done via email, with
hardcopies available to CEI staff and the Pembroke Watershed Association. Any updates will be
sent via email.
Pembroke Watershed Association – Quality Assurance Project Plan 23
Title: Pembroke Ponds QAPP
Revision Number: 4
Revision Date: 5/5/2010
Page 24 of 51
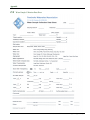
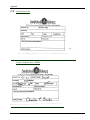
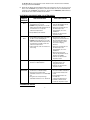
Table 9.1. Project-Specific Datasheets, Labels, Laboratory and Voucher Forms
Documentation
Type
Sample Collection
Records
Form Name
Water Sample Collection
Data Sheet
Quality Control checklist
Sample Bottle Label
Yes
All forms renumbered as to location.
Volunteers fill in forms with prompted questions.
Signed and witnessed, dated and timed
Yes
Yes
Monitoring program coordinator labels the cap of the bottle with
No
location code of sample
Monitoring program coordinator completes location and analysis
required sections
Yes
Volunteers signoff on completion of sample and chain of
custody
Returned to Program Monitoring Coordinator with analysis data
Yes
from samples to be entered into database.
Sample Bottle Cap
Laboratory
Records
Example in
Appendix C
How Used?
Analytical Balance
Chain of Custody
Laboratory report
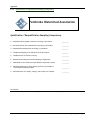
Training Records
Qualification / Requalification
Sampling Competency
Checklist for Field Coordinator
Yes
Calibration
Records
Calibration log
Log sheet to document instrument calibration prior to each test
Yes
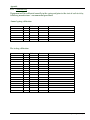
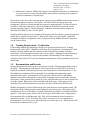
Table 9.2. Meter calibration records
Equipment
YSI Model 85
YSI EcoSense
pH100
Parameter
Dissolved
Oxygen
Acceptance
Criteria
Procedure
Frequency of Calibration
Corrective
Action
Person Responsible
Recalibrate
Program Monitoring
Coordinator
+/- 0.3 mg/l
Conductivity
+/- 0.005 mS/cm
Salinity
+/- 0.3 mg/l
Temperature
+/- 0.3 mg/l
pH
+/- 0.2
Temperature
+/- 0.3 mg/l
See Owners
manual
provided in
Appendix F
Before the testing season and
prior to the start of testing
Pembroke Watershed Association – Quality Assurance Project Plan 24
Title: Pembroke Ponds QAPP
Revision Number: 4
Revision Date: 5/5/2010
Page 25 of 51
10. Sampling Process
The following sampling safety and design principles shall be followed for the Pembroke Ponds
project:
Sampling Safety
9 Personal safety shall be a primary consideration in selection of sampling sites and dates.
9 No sampling shall occur when personal safety is thought to be compromised.
9 The Program Monitoring Coordinator/ Field Coordinator and Pond Captain shall confer
before each sampling event to decide whether conditions pose a threat to safety of field
volunteers, and will cancel/postpone sampling when necessary.
9 Sampling shall take place in teams of two or more.
9 Samplers shall wear life vests when sampling from boats
9 Samplers shall wear proper clothing to protect against the elements as applicable,
especially footwear and raingear.
9 Tests are conducted from boats provided by volunteers, who are responsible for safe
operation and their own maintenance. The operator also monitors proper positioning for
the testing, utilizing the GPS.
Rational for Selection of Sampling Sites
We had originally determined sampling sites for each pond to match those sites identified by
BayState Environmental Consultants Inc. in a diagnostic and feasibility study completed in 1993.
Other sites were chosen to monitor specific suspect point sources of pollution. Going forward
we have reevaluated our testing processes and selected sites that we now believe are more
representative of general pond conditions. Each site has been marked on bathymetric maps with
GPS coordinates -- see Section 6. It is believed that subsequent monitoring of each location
would give the broadest, most comprehensive profile of water quality for the desired parameters.
Types of Indicators
Chemical and physical indicators will be used in this study. Refer to Section 6 (Project/Task
Description) and Section 7 (Measurement Quality Objectives) for the specific data or
parameters forms see Appendix C (Water Sample Collection Data Sheet).
Sampling Frequency
The testing season will be during the period June through September. Sampling frequency is
determined by the Program Monitoring Coordinator. Current schedule is monthly for Oldham
and Furnace ponds, twice for Stetson and once for Little Sandy Bottom . Testing is suspended
on Hobomock pond. Actual waypoints will be located with a GPS unit. Other non scheduled
tests may be conducted throughout the year if deemed warranted. The entire testing schedule is
subject to weather conditions.
Site Access
Access to the ponds and sampling waypoints will be from private residences of the team
members using their own boats.
Pembroke Watershed Association – Quality Assurance Project Plan 25
Title: Pembroke Ponds QAPP
Revision Number: 4
Revision Date: 5/5/2010
Page 26 of 51
11. Sampling Method Requirements
All sample collections for the Pembroke Pond project shall follow detailed methods on how
samples will be collected and preserved and/or follow the Standard Operating Procedures (SOPs)
as follows
9
9
9
Copies of standard operating procedures (SOPs) are in Appendix D –Water Quality
Testing and Qualification Procedure Manual.
Pre-coordination will occur with project lab(s) to ensure that sample collection
procedures meet lab needs
Analytical Balance Corp. M-MA022 (Appendix E)
422 West Grove Street
Middleboro, MA 02346
Internal laboratory SOP numbers are as follows:
1. Turbidity – 109
2. Ammonia – 113
3. Total Phosphorus – 117
4. TKN – 139
5. Chloride – 140
6. Nitrate – 140
7. Nitrite – 140
8. Alkalinity – 141
One sample bottle is delivered to the lab for each site within 24 hours (on ice in the interim). The
lab splits the samples and uses acid preservation as necessary. Special care will be taken during
sampling not to spill any preservatives contained in bottles. Bottles containing preservatives will
not be inverted while uncovered, or filled and then emptied.
Table 11.1. Field Sample Collection Methods
Sample
Type
Meter YSI
Model 85
pH meter
YSI pH
100
Parameter(s)
Separate readings
are displayed for
each of the
following:
9 DO
9 Conductivity
9 Temperature
9 Salinity
Separate readings
are displayed for
each of the
following:
9 pH
9 Temperature
Container Type(s) and
Preparation
N/A - direct measurement with
probe
N/A - direct measurement with
probe
Minimum
Sample
Quantity
N/A - direct
measurement
with probe
N/A - direct
measurement
with probe
Sample
Preservation
N/A
N/A
Pembroke Watershed Association – Quality Assurance Project Plan 26
Title: Pembroke Ponds QAPP
Revision Number: 4
Revision Date: 5/5/2010
Page 27 of 51
Sample
Type
Secchi
Disk
Parameter(s)
Water Clarity
Container Type(s) and
Preparation
Secchi disk lowered from boat,
extinction depth recorded using
view scope.
Minimum
Sample
Quantity
N/A
Sample
Preservation
N/A
If Secchi disk is equal to or greater
than maximum depth - Secchi is
noted as “>max depth”
If there is significant current or
boat drift measurements is not
taken
Table 11.2. Laboratory Sample Collection Methods
Sample
Type
Grab
Parameter(s)
Water quality
indicators:
9 Nitrogen
series
9 Total
Phosphorus
9 Ammonia
9 Chloride
9 Turbidity
9 Alkalinity
Container
Type(s) and
Preparation
Lab provided
bottle and on
site rinsing.
Minimum
Sample
Quantity
1 Liter
Sample
bottle for
each site
Sample
Preservation
Holding Times
Coolers and ice Nitrogen: 48 hours
TP: 28 days
packs for
Ammonia: 28 days
immediate
Chloride: 28 days
storage and
Turbidity: 48 hours
delivery to the
Alkalinity: 14 days
lab. The lab
accepts the
samples and
splits out subsamples. These
samples are
acid preserved
by ABC Labs if
necessary per
their protocols.
Pembroke Watershed Association – Quality Assurance Project Plan 27
Title: Pembroke Ponds QAPP
Revision Number: 4
Revision Date: 5/5/2010
Page 28 of 51
12. Sample Handling and Custody Requirements
All sample handling and custody procedures shall be in compliance with project Standard
Operating Procedures for each indicator. The following procedures shall be followed for the
Pembroke Pond Project.
Sample container labels shall be attached to dry bottles, with the following information:
9 Site ID#
9 Sample type
9 Date and time
9 Name of sampler
9 Name of organization conducting sample.
9 Example of label is found in the Appendix C
9 Chain of custody forms shall be prepared and completed in all cases. (see Appendix C )
9 The whereabouts of all samples shall be known at all times.
The following steps shall be taken to avoid sample mislabeling.
9 Pre-labeled bottles checked by volunteer sampler before sampling session
9 Witness signs off each bottle after collection accomplished.
9 Sample bottle caps are marked with site number using permanent marker
9 A clean, dry label is completed and applied after bottle is wiped dry
The following steps shall be taken for sample handling
9 Samples are to be placed in a cooler with ice as soon as possible after being taken.
9 Samples are to be kept iced until delivered to lab.
Pembroke Watershed Association – Quality Assurance Project Plan 28
Title: Pembroke Ponds QAPP
Revision Number: 4
Revision Date: 5/5/2010
Page 29 of 51
13. Analytical Methods Requirements
All analytical methods used in the PWA ponds project, including methods used by laboratories
performing analyses for the project, shall be based on standardized laboratory methods.
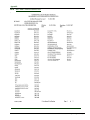
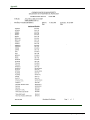
All analytical methods used for this project are provided in Appendix E (Certified Parameters
list). Analytical Balance Corp supplies this information with each sample report please see
Analytical Balance Manual on file with EPA-NE and MA DEP QA Officer. Analytical Balance
State Certification Number M-MA022 (see Appendix E )
Pembroke Watershed Association – Quality Assurance Project Plan 29
Title: Pembroke Ponds QAPP
Revision Number: 4
Revision Date: 5/5/2010
Page 30 of 51
14. Quality Control Procedures
The following quality control procedures for the Pembroke Pond Project shall be followed.
Water Quality samples
9 Program Monitoring Coordinator randomly designates that a blind duplicate sample will
be collected at the same site
Procedures for each QC step checked above are
9 The volunteer collects a grab sample , and a second volunteer collects another grab
sample at the same location and time
9 Lab QC protocols shall be discussed with the lab prior to sampling to ensure
acceptability
Water Quality measurements
9 Program Monitoring Coordinator randomly designates that duplicate measurements will
be taken
9 Program Monitoring Coordinator will designate sample sites where both meters are to be
used and results cross checked for QC.
9 In the event only one meter is available, QC will be accomplished by having two separate
testers perform the meter samples at the same site and compare results.
9 Meters are calibrated to manufacturer’s standards prior to each test cycle.
9 Secchi disk QC will be accomplished by taking a reading and immediately having a
different person taking another reading at the same site
9 A Quality Control checklist will be completed and turned in to the Field Monitoring
Coordinator ( See appendix C)
Pembroke Watershed Association – Quality Assurance Project Plan 30
Title: Pembroke Ponds QAPP
Revision Number: 4
Revision Date: 5/5/2010
Page 31 of 51
15. Instrument/Equipment Inspection and Testing
The following instrument/equipment inspection and testing methods shall be followed for the
PWA Pembroke Ponds project:
9
9
9
9
Prior to the testing season the Field Coordinator and Program Monitoring Coordinator
will calibrate and test all instruments and perform maintenance as required.
Maintenance shall occur as needed. Maintenance will be performed by the Project Field
Coordinator and the Quality Assurance Officer.
Detailed inspection, maintenance and calibration procedures are described in
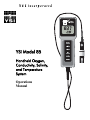
manufacture’s SOPs contained in Appendix F.
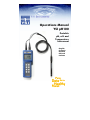
https://www.ysi.com/portal/page/portal/YSI_Environmental/Products/Product_Family/Pr
oduct?productID=WQS_85
https://www.ysi.com/portal/page/portal/YSI_Environmental/Products/Product_Family/Pr
oduct?productID=WQS_PH100
Table 15.1. Instrument/Equipment Inspection, Testing Procedures – Summary
Equipment Inspection
Type
Frequency
Type Inspection
Sample
Before each use Visual for integrity,
bottles
cleanliness
Meters
- YSI 85
- YSI 100
GPS
Maintenance, Corrective Action
Lab Prepped
Rinsed at each site prior to use
Proper Storage and Fresh Batteries as per
User Manuals
Before each use Visual and Calibration Recalibrate prior to each use. Calibration
stand solutions must be replaced prior to
expiration
Cleaned and stored as per users manual
Visual for proper
instructions
Before each use
sequencing.
Fresh batteries as needed
Secchi Disk Before each use
Visual for defects (as
Cleaning and storage
in rope)
View scope
Before each use Visual for integrity
Grab Sticks
Before each use
Visual for integrity,
and cleanliness
Rinse after use and storage to prevent damage
Rinse before and after use
Pembroke Watershed Association – Quality Assurance Project Plan 31
Title: Pembroke Ponds QAPP
Revision Number: 4
Revision Date: 5/5/2010
Page 32 of 51
16. Instrumentation Calibration and Frequency
The following instrument calibration procedures will be followed for the Pembroke Pond
Project:
9 Instruments shall be calibrated before each use by the Field Monitoring Coordinator or
Test Leader
9 Detailed inspection, maintenance and calibration procedures are described in
manufacture’s SOPs contained in appendix F.
9 If meter readings appear inconsistent, recalibration or retesting with a second meter is
required
9 A Calibration Log will be kept by the Field Coordinator noting calibrations completed,
when, by whom, and dates done; all problems with calibration will be noted
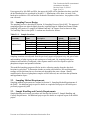
Table 16.1. Instrumentation Calibration Procedures
Instrument
YSI and pH
Meters
Inspection and
Calibration Frequency
Before each sampling
run
Standard of Calibration
Instrument Used
All solutions including
buffers, probe solutions and
external standards as per
user’s manual and training
SOPs-- see appendix
Corrective Action
Adjust instrument, clean
electrodes, replace
electrodes , replace
membranes, following
manufacturer’s SOPs
Pembroke Watershed Association – Quality Assurance Project Plan 32
Title: Pembroke Ponds QAPP
Revision Number: 4
Revision Date: 5/5/2010
Page 33 of 51
17. Inspection & Acceptance Requirements for Supplies
The following procedures for procurement, inspection and acceptance of sampling, analytical
and ancillary project supplies shall be followed for the Pembroke Pond Project:
A check is made to see that we have all the materials required to do the sampling that day.
Test items include:
9 Correct number of labeled bottles ( including spare bottles )
9 Field data sheets (see Appendix C)
9 Quality Control checklist if required (see Appendix C)
9 Cooler with ice or ice packs
9 Sharpie for recording data.
9 Copy of testing procedures (see Appendix D)
9 Maps of sample sites (GPS locations)
9 Necessary Data Sheets (see Appendix C)
9 Meters, GPS, Secchi Disk and tape measure
Table 17.1. Supplies Inspection, Acceptance Procedures
Inspection
Frequency
Type of
Inspection
Available Parts
Maintenance
Calibration Solutions
During
each use
Visual inspection
of quantity and
expiration date
Fresh bottles of
calibration
solutions
Replace as needed
referencing expiration
dates
Bottles and labels
Before
each use
Visual for
integrity and
damage
Spare bottles
and labels
Proper storage and
handling
Field and data sheets
Inspection
before
using
Visual
Spare copies
n/a
Life Jackets
Before
each use
Visual for
integrity and
damage
spares
As needed
cooler
Before
each use
Visual for
cleanliness and
ice or ice packs
n/a
As needed
Supplies
Pembroke Watershed Association – Quality Assurance Project Plan 33
Title: Pembroke Ponds QAPP
Revision Number: 4
Revision Date: 5/5/2010
Page 34 of 51
18. Data Acquisition Requirements
The following information will be provided for the Pembroke Watershed Association water
project:
9 External data validity shall be documented as described in Table 18.1. The following
data will be used. Data validity is described here:
Table 18.1. Non-Project Data Validity
Title or
descriptive name
of data document
2008 through
Present
Source of data
Pembroke
Watershed
Association
volunteer
collection
QAPP
written?
Y/N
Yes
Notes on known or
unknown quality of
data
QAPP approved by
MADEP and EPA
Planned restrictions
in use of the data due
to questions about
data quality
No planned
restrictions.
2005, 2006 and
2007 Water
Quality Data
Collected under
the SOPs of the
Pembroke
Watershed
Association
No
Same procedures as
now in use
Good Confidence as to
validity
Background Data for
future comparison and
analysis
2001 Survey by
Comprehensive
Environmental Inc
Independent
Consultants
No
Undetermined
Findings were used to
determine need for
further monitoring
1993 BayState
Environmental
Consultants Inc.
Independent
Consultants
No
Undetermined
Findings were used to
determine need for
further monitoring
Establishment of
monitoring waypoints
Maps will be prepared using MassGIS data layers to identify the general land features in the
region, including subwatershed, lake, and land use type areas. Data such as groundwater
information and topography will be obtained from the United States Geological Survey (USGS)
and the United States Department of Agriculture (USDA). Current and historic aerial
photographs will be obtained from the USGS and/or similar Town sources. Soils information
will be obtained from the National Resources Conservation Services (NRCS). Rainfall
information will be obtained from the NOAA National Weather Service website. Phosphorus
export coefficients will be obtained from Wetzel, 1975 and Reckhow and Chapra, 1983. As
available, the most up-to-date data will be used (with the exception of historic aerial
photographs), with an effort made to choose images with the highest resolution possible.
Pembroke Watershed Association – Quality Assurance Project Plan 34
Title: Pembroke Ponds QAPP
Revision Number: 4
Revision Date: 5/5/2010
Page 35 of 51
Precision, bias, representativeness, and completeness within each model will be discussed in the
final report. Calculations made, such as areas and land use sizes, will have little error as there is
a large amount of information and data available on these types of variables. Data such as soils
information is general in nature to a large area such as a watershed, and not necessarily specific
to the underlying area such as that found at a specific structural BMP location. These types of
data will have moderate error. Other assumptions, such as the use of coefficients, will have a
larger degree of error, as concrete numbers are not available. Assumptions will be made using
the best available information.
The above-referenced sources provide state or federal databases with accurate information
suitable for this study. Data collected during this project will be used to prioritize future water
quality improvements and used for comparison with future water quality monitoring efforts.
Additional field reconnaissance efforts will be performed by CEI staff familiar with the area and
experienced in conducting a watershed assessment. Watershed data such as land use types and
specific pollution sources that will require additional attention during modeling analysis will be
compared to existing MassGIS data and incorporated into the report. Staff will also review
changes in the watershed that have occurred since the completion of previous studies in 2001
that may be impacting the water quality of the ponds. Potential structural BMP locations will
also be mapped and incorporated into final reports and maps.
Pembroke Watershed Association – Quality Assurance Project Plan 35
Title: Pembroke Ponds QAPP
Revision Number: 4
Revision Date: 5/5/2010
Page 36 of 51
19. Data Management
The following data management activities shall be followed for the Pembroke Watershed
Association water project:
9 Field samplers shall record data on field sheets, review them, sign and turn over to field
coordinator.
9 Field Coordinator shall review sheets and discuss with sampling team discrepancies in
data acquisition, incompleteness of sheets, and provide needed corrective action.
9 Pond Captain or Designated test leader shall fill out the chain-of-custody form for
forwarding the processed samples to the laboratory.
9 Test Leader and each person who transports samples shall also sign the custody form
upon receipt of the samples.
9 Chain of custody forms will follow samples to the lab and back to Program Monitoring
Coordinator.
9 Once laboratory analyses are complete, the laboratory personnel shall mail lab results to
the Program Monitoring Coordinator or arrange for pickup.
9 The Program Monitoring Coordinator and/or Data Management Coordinator will enter
raw field and lab data into the project computer system.
9 Computer-entered data shall then be compared with field sheets for accuracy. After data
is entered by the Data Management Coordinator it is verified by the Field Auditor before
compiling reports This is completed for all
9 Original data sheets will be stored at central location for Pembroke Watershed
Association with copies to field coordinator
9 Disk back-ups and copies of the data sheets will be made and stored in a separate location
designated by the Program Monitoring Coordinator. Copies provided to Field
Coordinator.
9 Documentation of data recording and handling, including all problems and corrective
actions, shall be included in all preliminary and final reports.
9 Examples of data forms and checklists are provided in Appendix.
Data management systems - spreadsheets, databases, statistical or graphical software packages,
location of data records (paper and electronic), are described here:
Data is collected on a scheduled basis by teams of trained volunteers who follow specific
instructions on the collection and submission of the water quality information. Each team
collects samples from the same location in each pond, labels them with indelible marker and
places in an iced cooler for delivery to Analytical Balance Laboratory Corp. Samples must be
delivered to the lab within 24 hours.
Program Monitoring Coordinator reviews the data to determine if major changes have occurred
since the last sampling and if any errors have resulted from the testing. If there are errors or
discrepancies the Program Monitoring Coordinator will call the team who took the samples and
Pembroke Watershed Association – Quality Assurance Project Plan 36
Title: Pembroke Ponds QAPP
Revision Number: 4
Revision Date: 5/5/2010
Page 37 of 51
discuss the results with them. If the discrepancies are pronounced, a new sample may be
obtained. In any case, suitable inquiries determine the next step to be pursued.
Data is maintained on excel spreadsheet and is used to create Word documents, reports, and
PowerPoint presentations. Final Reports contain all the raw data, analytical graphs and
recommendations. The reports are distributed to parties on our distribution list and to the general
public through our Web Site and copies maintained at the Pembroke Public Library.
Paper and electronic records are stored at the Pembroke Watershed Association central location.
Backup copies are stored with the Field Coordinator and the Program Monitoring Coordinator.
Data Entry and Validation
Modeling calculations will be subject to an internal quality control process by the Modeling
Coordinator and QA/QC Officer at Comprehensive Environmental, Inc. The data will be
critically reviewed for reasonableness, correspondence with data quality objectives, appropriate
qualification, censoring of suspect data, and that data has been entered correctly. Models used
are as follows:
1. Land use based model
2. Lake response model
3. Simple Method
Modeling and calculations will be performed with the aid of a Microsoft Excel spreadsheet.
Final results and summaries may be maintained and displayed in a Microsoft Excel spreadsheet.
Final maps may be displayed in part by using ArcGIS maps if appropriate. The remainder of
data will be described in a narrative format.
Data Storage
Electronic files with modeling, calculations, field reconnaissance results, sampling data, etc. will
be maintained with Comprehensive Environmental, Inc. Electronic files associated with the final
report including sampling results will be stored with CEI for distribution as appropriate.
Electronic files are stored on secure servers which are backed up several times each week. Hard
copies of reports will be distributed to the Town of Pembroke, Pembroke Watershed Association,
MA DEP, and EPA as part of applicable reports.
Pembroke Watershed Association – Quality Assurance Project Plan 37
Title: Pembroke Ponds QAPP
Revision Number: 4
Revision Date: 5/5/2010
Page 38 of 51
20. Assessment and Response Actions
The Program Monitoring Coordinator, QA Officer and Field Coordinator will use the following
process to identify and effectively address any issues that affect data quality, personal safety, and
other important project components.
The Program Monitoring Coordinator and Field Coordinator will periodically check to see the
following:
9 Monitoring is occurring as planned;
9 Sufficient written commentary and/or supporting photographs exist;
9 Sufficient volunteers are available;
9 Volunteers have been observed as they sample their sites;
9 Samplers are collecting in accordance with project schedules;
9 Data sheets and custody control sheets are being properly completed and signed off;
9 Data are properly interpreted;
9 Plans for dealing with adverse weather are in place;
9 Retraining or other corrective action is implemented at the first hint of non compliance
with the QAPP or SOPs;
9 Labs are adhering to the requirements of the QAPP- use of State Certified Lab.
9 Data management is being handled properly, i.e. data are entered on a timely basis, are
properly backed up, are easily accessed, and raw data are properly stored in a safe place;
9 Procedure for developing and reporting the results exists.
The Program Monitoring Coordinator shall confer with the Field Coordinator and the QA Officer
as necessary to discuss any problems that occur and what corrective actions are needed to
maintain project integrity. The Program Monitoring Coordinator, Field Coordinator and QA
Officer shall meet at the end of the sampling season to review the draft report and discuss all
aspects of the program including identifying necessary program modifications for future
sampling activities. Corrections may include retraining volunteers, rewriting sampling
instructions, replacement of volunteers, altering of schedules, sites, or methods or any other
actions deemed necessary. If modifications require changes in the Quality Assurance Project
Plan, these changes shall be submitted in writing to the MassDEP for review.
The Modeling Coordinator and QA/QC Officer will be responsible for review, oversight and
follow-up on data quality and corrective actions throughout the project. Data assessments will be
performed during the project as part of the monthly reporting efforts as required by the MA DEP
604(b) program. Assessments to be performed during the project will include:
9 Evaluation of field reconnaissance observed issues
9 Existing and current data variations
9 Modeling assumption issues
9 Model comparison difficulties
Pembroke Watershed Association – Quality Assurance Project Plan 38
9
Title: Pembroke Ponds QAPP
Revision Number: 4
Revision Date: 5/5/2010
Page 39 of 51
Engineering design problem
The results of assessments will be documented and reported in the monthly and quarterly status
reports. The final report will contain a summary of assessments, as well as actions taken to
address issues. Reports will be provided to the Town of Pembroke, Pembroke Watershed
Association, MA DEP, and EPA for review. CEI will incorporate revisions to the final report,
based on review comments provided by these agencies.
Pembroke Watershed Association – Quality Assurance Project Plan 39
Title: Pembroke Ponds QAPP
Revision Number: 4
Revision Date: 5/5/2010
Page 40 of 51
21. Reports
The following reporting mechanisms will be used. The final report will describe the program's
goals, methods, quality control, results, data interpretation, and recommendations and will
include:
9 Raw data
9 QC data
9 Associated metadata
9 Flagged Questionable data
The final report will be sent to the QAPP and General QAPP Adoption Form distribution lists
and submitted to CZM and/or MassDEP following MassDEP guidelines CN 0.74 Recommended
Content of 3rd Party Data and CN 0.78 Data Deliverable Guidelines for Grant Projects.
Table 21.1 describes the reporting mechanism for this project’s data, who is responsible for
completion and distribution, and to whom each report will be distributed.
Table 21.1. Report Mechanisms, Responsibilities, and Distribution
Reporting Mechanism
Annual Water Quality
Report
By Whom
Program Monitoring Coordinator
Field Coordinator
Program QA Officer
Distribution
Distribution list.
Public by being posted on the
PWA web site, being shared
with the local media, by
donating to town library.
Web Site
Webmaster
General Public
Press Release
PWA Executive Secretary
General Public
Comprehensive Environmental Inc. (CEI) will produce project reports with input from the
Pembroke Watershed Association as required. Copies of reports will be distributed to the Town
of Pembroke, PWA, MA DEP and EPA for review and comment prior to finalization and
approval. Monthly and quarterly reports will document recent activities performed on the
project.
Table 21.2 lists the reports that will be produced as a result of this project.
Pembroke Watershed Association – Quality Assurance Project Plan 40
Title: Pembroke Ponds QAPP
Revision Number: 4
Revision Date: 5/5/2010
Page 41 of 51
Table 21.2. Reports to Management
Report Type
Monthly Progress
Reports
Report Frequency
Monthly for the duration of the
project.
Quarterly Progress
Reports
Draft Project
Report
Quarterly for the duration of the
project, due on December 21st,
March 20th, June 20th, and
September 20th.
At the conclusion of modeling
and design.
Final Project
Report
Upon receipt of comments on
Draft Project Report
Parties Receiving Report
-Town of Pembroke
-Pembroke Watershed Association
-MA DEP
-EPA
-Town of Pembroke
-Pembroke Watershed Association
-MA DEP
-EPA
-Town of Pembroke
-Pembroke Watershed Association
-MA DEP
-EPA
-Town of Pembroke
-Pembroke Watershed Association
-MA DEP
-EPA
Monthly and Quarterly Reports
Brief monthly and quarterly reports will document activities performed within the previous
reporting period. Reports will be submitted via email on a standard form. Reports will contain a
summary and percentage of work completed by task during the reporting period, planned
activities for the next quarter, a description of difficulties encountered and steps taken to address
those difficulties, and an explanation of significant discrepancies between progress achieved and
the level of progress that should have occurred based on the scope of services and timeline.
Draft and Final Reports
Final results will be incorporated into the final project report required by the MA DEP 604(b)
Grant Program at the completion of the project. Comprehensive Environmental Inc. will be
responsible for preparing the draft final project report, distributing the report, responding to
comments, and finalizing the report. This report will contain the following:
9 Executive Summary
9 Project Introduction and Background
9 Data Assessment
9 Pollutant Modeling
9 QA/QC Issues
9 Recommendations and Conclusions
9 Structural Engineering Designs (30%)
9 References and Further Reading
9 Figures, Tables and Appendices
Pembroke Watershed Association – Quality Assurance Project Plan 41
Title: Pembroke Ponds QAPP
Revision Number: 4
Revision Date: 5/5/2010
Page 42 of 51
Executive Summary
The executive summary will provide a summary of the entire report, condensed into a maximum
of several pages, with a focus on the recommendations and conclusions.
Project Introduction and Background
A detailed description of the project will be provided, including a description of previous reports
completed for the ponds under previous QAPPs. Project goals, objectives, methodology,
assumptions, reasoning, etc. will be outlined.
Data Assessment
Applicable data obtained from past projects will be detailed. Field reconnaissance efforts and
data from current sampling rounds will be summarized. Data such as watershed maps and sizes,
land use data, anticipated flow rates, etc. will be summarized. Data sources will be provided, as
well as the reasoning and methods used to acquire the data.
Pollutant Modeling
A detailed explanation of the pollutant modeling used will be provided. The report will
document the modeling purpose, description, scope, approach and application. Model data
sources, components, quality, validation performance, and variables used to obtain final results.
Parameter assumptions, values, excluded data and sources will be documented in detail. Model
calibration performance conditions will be analyzed, as well as future predictions for the buildout
scenario. A summary of modeling results will be provided.
QA/QC Issues
Quality assurance and quality control issues encountered during the project pertaining to
sampling or modeling will be summarized in narrative form. Methods taken to address issues
encountered will be addressed.
Recommendations and Conclusions
An evaluation of load reduction measures will be provided, as well as final
recommendations and conclusions to reduce phosphorus levels in the ponds and improve
water quality. The final plan will outline proposed BMPs, estimated costs, and expected
pollutant removal levels.
Structural Engineering Designs
Preliminary 30% designs and estimated construction costs will be prepared for the top
five structural BMP improvements. Detail will be sufficient for s.319 grant funding.
References and Further Reading
References will be provided, as well as additional recommended reading sources.
Figures, Tables and Appendices
Supporting figures, tables and appendices will be provided.
Pembroke Watershed Association – Quality Assurance Project Plan 42
Title: Pembroke Ponds QAPP
Revision Number: 4
Revision Date: 5/5/2010
Page 43 of 51
22. Data Review, Validation and Verification Requirements
All project data, metadata and quality control data shall be critically reviewed by the Program
Monitoring Coordinator and QA Officer to determine if there are any problems that compromise
data usability.
The Program Monitoring Coordinator and the Field Coordinator will review field and laboratory
data after each sampling run and take corrective actions if necessary. If there appears to be
inconsistent data the Program Monitoring Coordinator will discuss with the sampling team the
circumstances surrounding the sampling and what might have caused the problem. If they can
resolve the problem, this will end the concern. If the problem can’t be resolved then the Program
Monitoring Coordinator will discuss the issue with the Field Coordinator and the QA Officer and
together they will decide what remedial steps to take. At the end of the season the Program
Monitoring Coordinating will share all data with the Field Coordinator and QC Officer to
determine if the data appears to meet the objectives of the QAPP.
The following logs will be maintained by the Program Monitoring Coordinator and Field
Coordinator to track performance and documentation
9 Field sheets with results from Analytical, by pond and date
9 QC sheets completed during sampling
9 Chain of Custody forms with all signatures, times, dates
9 QC logs by date including all QC activities, such as flagged data issues, remediation,
corrective action plan, etc
9 Calibration and Maintenance log
Phosphorus loadings will be estimated using a land use based model (The Simple Method) in
combination with a lake response model (Reckhow Phosphorus Lake Model) to predict in-lake
phosphorus concentrations based on the projected loadings. Phosphorus loads into the pond will
be estimated using literature based loading coefficients for various land uses and pollutant
sources. This information is based on stormwater sampling data collected from runoff from
various types of land use and results in the total mass of phosphorus entering the pond from each
type of land use. There is not enough water quality data to compare the model predicted loadings
to the actual loadings to the pond, as an extensive amount of water quality and flow data would
be needed to accurately calculate the loads associated with flows into the pond. However, lakeresponse models can be used to estimate the relationship between phosphorus loads and lake
concentrations, such that the actual lake concentration can be used to predict the load to the pond
or the load to the pond can be used to estimate a concentration. It is this relationship that will be
used to calibrate the data. The modeled loadings from land use values will be compared to the
expected loadings calculated based on the actual in-pond concentrations. Model input factors
will then be adjusted until the predicted in-lake phosphorus concentrations are within 10% of the
observed concentrations documented via the field monitoring program.
The modeling will be performed according to the following procedural steps:
Step 1: Land Use Model
Step 2: Lake Response Model
Pembroke Watershed Association – Quality Assurance Project Plan 43
Title: Pembroke Ponds QAPP
Revision Number: 4
Revision Date: 5/5/2010
Page 44 of 51
Step 3: Model Calibration
Step 4: Buildout Analysis
Step 5: Phosphorus Removal Solutions
Step 1: Land Use Model
Phosphorus loadings to the Lake will be determined based on the Simple Method. The Simple
Method estimates pollutant loads for chemical constituents as a product of annual runoff volume
and pollutant concentration, as follows:
L = 0.226 * R * C * A
Where: L = Annual load (lbs)
0.226 = Unit conversion factor
C = Pollutant concentration (mg/l)
A = Area (acres)
R = Annual runoff (inches) = P * Pj * (0.05 + 0.9 * I / 100)
P = Annual rainfall (in)
Pj = % of rainfall events producing runoff (assumed to be 90%)
I = Impervious cover percent (%)
Existing information sources available through local, state and federal sources will be used to
estimate parameters for use in the model. Watershed (A) and lake area will be determined from
topographic maps downloaded from USGS and MassGIS, and inserted into a computer aided
drafting (CAD) based program or similar to determine actual areas. Precipitation for the area will
be estimated from the NOAA National Weather Service website for the area.
Pollutant concentrations (C) will be obtained from the Simple Method for each type of land use
(e.g., commercial, forest, high density residential, etc.) in the watershed. Areas for each land use
will be calculated through GIS computer software.
Phosphorus loadings from septic systems and atmospheric deposition (direct precipitation) will
be estimated from literature based coefficients for these sources. Phosphorus from atmospheric
deposition is determined from lake area and an assumed phosphorus concentration of 0.2 kg/hayr in precipitation from Wetzel, 1975 and Reckhow and Chapra, 1983. Potential loadings from
internal recycling will also be estimated using available inflow and outflow and Lake sampling
data and considering the methods used in the 1993 Diagnostic Feasibility study.
By using the Simple Method and literature based coefficients, a total runoff and associated total
phosphorus load to the Lake will be determined.
Step 2: Lake Response Model
The Reckhow Phosphorus Lake Model will be used to predict the in-lake concentration based on
the loadings estimated in Step 1. The Reckhow steady-state lake model is expressed as:
P = L / (11.6 + 1.2 * qs)
Where: L = annual areal phosphorus loading (g/m2-yr) = W / As
Pembroke Watershed Association – Quality Assurance Project Plan 44
Title: Pembroke Ponds QAPP
Revision Number: 4
Revision Date: 5/5/2010
Page 45 of 51
W = total phosphorus mass loading (includes stormwater, internal recycling, septic
systems, and precipitation as determined through Step 1) (g/yr)
As = lake area (acres)
qs = areal water loading (m/yr), qs = Q / As
Q = inflow water volume to lake (m3/yr)
The total inflow water volume to the Lake (Q) will be calculated as:
Q = P * AT – Evapotranspiration
Where: P = total precipitation (ft)
AT = total watershed area (sf)
Evapotranspiration = estimated at 40% of the total precipitation volume (Hanson, R.L.)
Step 3: Model Calibration
The difference between the modeled phosphorus load determined in Step 2 based on land use
loading values and the expected loadings based on actual in-pond concentrations will be
compared and a difference between observed and predicted noted. Calibration will then be
performed by altering the input variables (e.g., land use loading concentrations) by the percent
difference to match observed and predicted in-pond phosphorus concentrations close to one
another using the limited data available. A 10% alteration of variables is considered reasonable
to match observed and predicted values and/or a 10% difference in predicted versus observed inpond concentrations without adjustment of variables. If greater than 10% alteration is needed, the
reason for the greater alteration will be explored and explained. Model input reasoning will be
explained in the final report, as well as any changes made to the variables. Calibration will
continue until observed values vs. predicted values are within 10% of each other.
As the modeling approach presented in this QAPP is relying upon a simplistic model intended
for planning purposes, the importance is to establish a relationship between loadings and in-pond
concentrations on which to base decisions. This is a reliable method for comparing various areas
(e.g., subwatersheds) and land uses to one another, as well as various sources to one another and
also for determining the percent reduction necessary to achieve a water quality goal, regardless
of whether the mass load is 100% accurate. Thus, the level of uncertainty in the exact loading
value has little impact on how it is ultimately used; however, uncertainty will be evaluated as a
function of the level of adjustment needed to calibrate the model. This simplified approach uses
average data values, which will first be reviewed and examined to identify any outliers.
Documentation of model uncertainty will be outlined in a narrative form in the draft and final
report. Data will be reviewed by the Modeling Coordinator, EPA Project Officer, and the MA
DEP 604(b) Project Officer to determine if they meet the QAPP objectives and verify accuracy.
Step 4: Buildout Analysis
A buildout scenario will be prepared by overlaying existing land use with existing zoning and
accounting for development restrictions such as protected lands and wetlands. The anticipated
lands uses at buildout will be input into the model to determine loadings under buildout
conditions. The buildout scenario will be used to develop load reduction measures necessary to
meet water quality goals.
Pembroke Watershed Association – Quality Assurance Project Plan 45
Title: Pembroke Ponds QAPP
Revision Number: 4
Revision Date: 5/5/2010
Page 46 of 51
Step 5: Phosphorus Removal Solutions
Upon calibrating the model, the reductions necessary to meet water quality goals will be
determined by adjusting the loadings downward until the desired in-lake concentration is
achieved. CEI will tailor recommendations to meet these reductions, using literature based
removal efficiencies, such as provided in the Massachusetts Stormwater Handbook.
Pembroke Watershed Association – Quality Assurance Project Plan 46
Title: Pembroke Ponds QAPP
Revision Number: 4
Revision Date: 5/5/2010
Page 47 of 51
23. Validation and Verification Methods
All project data and metadata are reviewed and approved as usable data or as un-usable when the
data are questionable for any reason. The Field Coordinator and Monitoring coordinator will
review the data collection sheets within 24 hours and Laboratory results forms upon receipt
(generally 2 weeks) of data collection for completeness, accuracy, and precision according to the
data quality objectives described in section 7. Data will be compared to historical data to verify
reasonableness. Quality control data (field duplicates and meter QC readings) will also be used
to determine accuracy and consistency in data. Data that is unexpected or outside of expected
range, considered “outliers” will be flagged for further review. The Field coordinator and
Monitoring coordinator will decide if data is usable based on all available reports, unusual field
conditions, and may request resampling.
The Modeling Coordinator and QA/QC Officer will examine the data for logical consistency, as
presented in Table 23-1. The Modeling Coordinator is familiar with running these types of
scenarios and is experienced with computer simulation models. If inconsistencies are found, an
attempt will be made to determine whether the data is in error. Apparent problems will be noted
in the final reports as appropriate.
Table 23.1 Validation and Verification Procedures
Responsible
Party
Modeling
Coordinator /
QA/QC
Officer
When
When model
compilation
has been
completed.
Activity
Compare test results with targets
or expected values.
When model
calibration has
been
performed.
Check for outliers.
Spot-check calculations.
Possible Corrective Measures
and Notification
Re-run calculations.
Flag problems that are not
correctable.
Discuss outliers or errors in the
final narrative.
Data validation and verification will occur as described in Table 23.2, and will include checks
on:
9 Completion of all fields on data sheets
9 Missing data sheets
9 Completeness of sampling runs (e.g. number of sites visited/samples taken vs. number
proposed, were all parameters sampled/analyzed?)
9 Completeness of QC checks (e.g. number and type of QC checks performed vs.
number/type proposed)
9 Number of samples exceeding QC limits for accuracy and precision and how far limits
were exceeded.
9 Field Coordinator and Program Monitoring Coordinator will examine all data sheets for
completeness and reasonableness of results. If any inconsistent results are discovered, an
action plan decision is generated which could include retesting, remedial training,
Pembroke Watershed Association – Quality Assurance Project Plan 47
Title: Pembroke Ponds QAPP
Revision Number: 4
Revision Date: 5/5/2010
Page 48 of 51
9
recalibration of equipment and retesting or a flag not to include specific data in the
results.
The chain of custody is reviewed to determine that appropriate standards are met
Table 23.2 Validation and Verification Methods
Verifier
Field Coordinator
and QA Officer
When
Prior to testing
Activity
Calibration of meters
Pond Captain or
Team Leader
Monitoring
day – when
volunteers
turn over data
sheets
Program
Monitoring
Coordinator and
Field Monitoring
Coordinator
Data
Management
Coordinator and
QA Officer
At end of
Monitoring
Day
Program
Monitoring
Coordinator and
Field
Coordinator
When results
are received
Collect, review
volunteers field sheets
for
- Outlier data
- Illegible entries
- Missing data
- Unusual conditions
Review chain of custody
sheet for errors or
omissions.
Check samples for
proper condition.
Compare number of QC
tests performed vs.
number planned
Compare QC test results
with targets or expected
values.
Review results with field
sheets
Identify outlier data
Identify action required
Trend Results
When QC data
is reported
Possible Corrective measures and
notification
Maintain calibration log
If calibration fails
- recalibrate
- use an alternate meter
- return for repair or replacement
Discuss with volunteers.
Correct simple problems.
Retrain as needed
Locate missing sample sheets or data
Data is flagged to indicate that it
should not be entered in a database or
used for decision making.
Discuss with volunteers
Resample if possible
Data is flagged to indicate that it
should not be entered in a database or
used for decision making
Discuss with volunteers.
Correct simple problems.
Retrain as needed
Report in QC log
Check field sheets for conditions
Check holding times
Develop action plan if necessary
Questionable data is flagged to
indicate that it should not be entered in
a database or used for decision making
Pembroke Watershed Association – Quality Assurance Project Plan 48
Title: Pembroke Ponds QAPP
Revision Number: 4
Revision Date: 5/5/2010
Page 49 of 51
24. Reconciliation with Data Quality Objectives (DQO’s)
Figure 24.1 describes how project data are compared to the program’s data quality objectives and
the mechanisms used to accomplish it. The Project Management Coordinator, Project Field
Coordinator and Project QC Officer shall utilize the following decision tree as needed.
Figure 24.1 QAPP Data Review Decision Tree for PWA ***
*** As Adapted from Massachusetts Guidebook to Quality Assurance Project Plans
Pembroke Watershed Association – Quality Assurance Project Plan 49
Title: Pembroke Ponds QAPP
Revision Number: 4
Revision Date: 5/5/2010
Page 50 of 51
At the conclusion of the sampling season (i.e., after all in-season quality control checks,
assessment actions, validation and verification checks and corrective actions have been taken),
the resulting data set will be compared with the program’s data quality objectives (DQO’s).
This review will include, for each parameter, calculation of the following:
9 Completeness goals: overall % of samples completed compared to number planned
9 Percent of samples exceeding accuracy and precision limits
9 Average departure from accuracy and precision targets.
9 After reviewing these calculations, and taking into consideration such factors as clusters
of unacceptable data (e.g. whether certain parameters, sites, dates, volunteer teams etc.
produced poor results), the Program Monitoring Coordinator, QA Officer and TAC
members will evaluate overall program attainment of the program’s data quality
objectives and determine what limitations to place on the use of the data, or if a revision
of the DQO is allowable.
Pembroke Watershed Association – Quality Assurance Project Plan 50
Title: Pembroke Ponds QAPP
Revision Number: 4
Revision Date: 5/5/2010
Page 51 of 51
25. Literature Cited
The following studies were previously cited:
Baystate Environmental Consultants, Inc. (January 1993). Diagnostic/Feasibility Study for the
Management of the Pembroke Ponds, Oldham, Furnace, Little Sandy Bottom and Stetson,
Pembroke, Massachusetts.
Comprehensive Environmental, Inc. (November 2000). Oldham Pond Pollution Source
Investigation and BMP Identification.
Comprehensive Environmental, Inc. (December, 2001). Furnace Pond Pollution Source
Investigation and BMP Identification.
Pembroke Watershed Association – Quality Assurance Project Plan 51
QAPP Appendices
--
Pembroke Watershed Association
Table of Contents -- QAPP Appendices
A
PWA Water Quality Team
B
Training Process and Documentation
C
Water Sample Collection Data Sheet
Sample Bottle Label
Analytical Balance Chain of Custody Form
Analytical Balance Certificate of Analysis
Qualification / Requalification Sampling Competency
Quality Control Checklist
Calibration Log
D
Water Quality Testing and Qualification Procedure Manual
E
Analytical Balance State Certification
Mass DEP Certified Parameter List
F
YSI-85 Calibration / Maintenance SOP's
YSI EcoSense pH100 Calibration / Maintenance SOP's
Appendix
A
PWA Water Quality Team
Pembroke Watershed Association Water Quality Team
Chair of Water Quality Committee:
Patti McCabe
Data Quality Manager and Coordinator:
Charlie Banks
Pond Captains:
Furnace: Patti McCabe
Oldham: Charlie Banks
Little Sandy Bottom: Steve Downing
Stetson: Jim McClarnon and Fred Baker.
Hobomock: Andy Key
Qualified instructors for volunteer water quality training:
Charlie Banks, Patti McCabe. Jim McClarnon.
Qualified volunteer water samplers:
3 Instructors and 17 Volunteers
•
Oldham Pond
– Charlie Banks - Instructor
– Hal Johnson
– Tammy Stone
– Norm Shepherd
– Terry Banks
•
Furnace Pond
– Patti McCabe - Instructor
– Chuck McCabe
– Ray Holman
– Deb Tranberg
– Jerry Fusco
•
Stetson Pond
– Jim McLarnon - Instructor
– Mitchell Cahill
– Fred Baker
– David Spaulding
– Robert Shannon
•
Little Sandy Bottom Pond
– Arthur Boyle
– Steven Downing
– Becky Paul
•
Hobomock Pond
– Howard League
– Andy Key
– Jason Potrykus
Pembroke Watershed Association
-- QAPP Appendix
p.2
Appendix
B.
Training Process and Documentation
Pembroke Watershed Association
Water Quality Testing Qualification/Requalification Program
Part I: Land Based training
1.
2.
3.
4.
5.
Review of dissolved oxygen Meter calibration, set-up, and measurements
Review of Secchi disc measurements and use
Review of the sample forms for lab samples, DO, and Chain of Custody
Gather equipment and supplies for testing
Obtain and document preliminary information on sample forms
Part II: Safety Instruction
1. Describes and demonstrates standard boat safety with life preserver use,
adherence to boat safety rules, general protection measures.
2. Identifies unsafe testing conditions and documents on forms
3. During actual testing portion of qualification demonstrates safety awareness of
self and others on the boat and follows standard safety measures.
Part III: Obtain Samples and tests during actual tests, according to written procedures
1. Complete sample collection procedural requirements for a minimum of 3 sites
2. Complete DO tests for a minimum of 3 sites
3. Complete both sample and DO forms completely and properly for a minimum of 3
sites
4. Complete Secchi disc measurement and use of view scope for a minimum of 3 sites
5. Demonstrate proper use and storage of equipment and sampling bottles
6. Identify conditions in which sampling cannot be done
7. Act as tester, witness, and assistant in testing collection and documentation
Part IV: Documentation of Training
1. A member will be considered trained once they have successfully completed the
above training requirements.
2. A Qualification/Requalification Sampling Competency sheet will be competed and
signed by the instructor. It will then be turned in to the Field Monitoring
Coordinator.
3. The Field Monitoring Coordinator will send the original signed
Qualification/Requalification Sampling Competency sheet to PWA central storage
and keep a copy for reference.
Pembroke Watershed Association
-- QAPP Appendix
p.3
Appendix
Pembroke Watershed Association
Qualification / Requalification Sampling Competency:
1. Completed water sample collection according to procedure:
_________
2. Performed Secchi disc measurement according to procedure:
_________
3. Completed DO measurement according to procedure:
_________
4. Completed Sampling form and DO form per procedure:
_________
5. Completed role of witness correctly:
_________
6. Demonstrated safety and careful handling of equipment:
_________
7. Verbalized correct safety and team behavior expected on boat:
_________
8. Identified situations in which testing would not be possible or
would require alternative plan:
_________
9. Described chain of custody, storage, and transport of samples:
_________
Name:
_________________________________
Date ___________________
Instructor
____________________________________________________________
(print & sign)
Pembroke Watershed Association
-- QAPP Appendix
p.4
Appendix
C-1
Water Sample Collection Data Sheet
Pembroke Watershed Association
-- QAPP Appendix
p.5
Appendix
C-2
Sample Bottle Label
Sample Completed form – DEMO
Pembroke Watershed Association
-- QAPP Appendix
p.6
Appendix
C-3
Analytical Balance Chain of Custody Form
Pembroke Watershed Association
-- QAPP Appendix
p.7
Appendix
Sample Completed form – DEMO
Pembroke Watershed Association
-- QAPP Appendix
p.8
Appendix
C-4
Analytical Balance Certificate of Analysis
Pembroke Watershed Association
-- QAPP Appendix
p.9
Appendix
C-5
Qualification / Requalification Sampling Competency
Pembroke Watershed Association
Qualification / Requalification Sampling Competency:
1. Completed water sample collection according to procedure:
_________
2. Performed Secchi disc measurement according to procedure:
_________
3. Completed DO measurement according to procedure:
_________
4. Completed Sampling form and DO form per procedure:
_________
5. Completed role of witness correctly:
_________
6. Demonstrated safety and careful handling of equipment:
_________
7. Verbalized correct safety and team behavior expected on boat:
_________
8. Identified situations in which testing would not be possible or
would require alternative plan:
_________
9. Described chain of custody, storage, and transport of samples:
_________
Certified by:
Print Name and Signature
Water Quality Committee
Pembroke Watershed Association
-- QAPP Appendix
p.10
Appendix
C-6
Quality Control Checklist
Pembroke Watershed Association
Quality Control (QC) Checklist
One test sample per pond will be taken as quality control.
Water Sample QC;
• Sample Bottle is to be labeled “B” for Blind .
• Time on the bottle is to be the time when the tests were finished.
• Actual location and time are to be noted on our form.
Quality Control Sample # ____
Test date ________ Time _______
Pond ___________________________________________
Actual Test Site (O-01, F-03 etc)
________________
Water Quality QC sample taken by _______________________
At the same site where we take a water sample for QC, an instrument QC will be
completed. This will be accomplished by having two different testers do the Secchi disk
reading and the instrument readings on the DO and pH meter.
Secchi disk _______ ft DO _________mg/l ________ % Water temp _______
Conductivity: ____ pH ____ Salinity ____________
Instrument QC readings completed by __________________________________
Witness
_________________________________________________________
This form is to be completed and turned in to the Field Monitoring Coordinator
Modified 11/11/09
Pembroke Watershed Association
-- QAPP Appendix
p.11
Appendix
C-7
Calibration Log
Equipment will be calibrated annually in the spring and prior to the start of each test day,
following manufacturer’s recommended procedures
Annual spring calibration
Instrument
Date
Calibration
Person
Corrective action
Calibration
Person
Corrective action
Pre testing calibration
Instrument
Date
Pembroke Watershed Association
-- QAPP Appendix
p.12
Appendix
D
Water Quality Testing and Certification Procedural Manual
Pembroke Watershed Association
Water Quality Testing
And Qualification
Procedure Manual
Revised December, 2009
Pembroke Watershed Association
-- QAPP Appendix
p.13
Appendix
This page intentionally left blank
Pembroke Watershed Association
-- QAPP Appendix
p.14
Appendix
Pembroke Watershed Association
Protocols for Water Quality testing
General procedures
1. Water quality testing will be carried out by volunteers trained by the water
quality committee. Volunteers will complete training as outlined in this training
manual prior to performing water quality sampling. Testing will be carried out by
a minimum of two people. Personnel and responsibilities are as follows:
Program Monitoring Coordinator - Overall responsibility for the water quality
testing program
Field Monitoring Coordinator – Responsible for actual testing procedures and
Quality Control procedures.
Test Leader - The Field Monitoring Coordinator will appoint a Test Leader to
coordinate testing on a specific pond. Under the direction of the Field Monitoring
Coordinator the Test Leader is responsible for verification of testing procedures
and proper completion of all paperwork. The Test leader will sign all forms as
witness and sign the Chain of Custody forms. The Test Leader will also deliver all
forms to the Field Monitoring Coordinator for collection and review
Water Quality Team Member Tester - follows procedures to take the actual samples.
Assistant – Assists with Secchi Disk measurement or other testing as needed.
Completes paperwork and verifies accuracy
Data Management Coordinator – Maintains and verifies data integrity and accuracy.
Creates spreadsheets, presentations and reports.
Quality Assurance Officer - works with the Field Monitoring Coordinator to verify
that samples are taken properly and that Quality Control procedures are followed.
Boat Driver – Provides use of a privately owned boat to be used for testing.
Responsible for all maintenance and safety.
2. Safety must be a major concern. All participants are required to wear life jackets
whenever they are on board a boat that is under way and to follow the safety
guidelines.
3. In the event of inclement weather the Program Monitoring Coordinator, Field
Monitoring Coordinator or a properly appointed substitute will make the
determination on whether or not to conduct the tests. If any test sites are omitted
because of changes in conditions, the reasons must be documented.
Pembroke Watershed Association
-- QAPP Appendix
p.15
Appendix
4. Prior to the testing date, the Field Monitoring Coordinator will obtain purchase
orders for the testing and make arrangements for the samples to be carried to
Analytical Labs. Analytical Labs bottle labels and chain of custody forms are to be
used for all tests.
Test Sampling General Information:
The number of Water Quality tests has been determined at the beginning of the testing
year, depending on the condition and size of the ponds. In all cases we will conduct
testing at the specified number of sites.
Testing will be as follows:
1. DO, conductivity, temperature and salinity using the YSI model 85 meter
2. Secchi disk using the Secchi disk and the view scope
3. pH using the YSI EcoSense pH100 meter
4. Chemical Grab sample – using the sample stick
Maximum Depth at each sample site shall be determined using the supplied depth
finder. This depth is to be verified at one site by dropping the Secchi disk to the bottom
and measuring. Note: This must be done after all other sampling to avoid roiling the
bottom and contaminating the sample.
ALL water samples are to be placed in a cooler with ice or ice packs immediately after
being taken and kept iced until delivered to the lab.
The test schedule will be as determined by the Program Monitoring Coordinator in
cooperation with the Field Monitoring Coordinator.
See appendix # 1 for the current year testing schedule.
Test Sampling Procedure:
1.
Obtain preliminary information and document on forms: This information is
available on the following URL:
http://www.weather.com/outlook/homeandgarden/home/pastweather/02359?l
ocid=02359&when=-1
- Weather conditions for the day of the test, including rainfall, if any
- Weather conditions for the previous 2 days, including rainfall, if any
- Actual water level of the pond (note location)
2.
The testing equipment used for water quality testing is to be calibrated properly
utilizing the manufacturer’s calibration procedures. The test leader will work
with the Field Monitoring Coordinator to ensure that this is done.
3.
Utilize GPS to obtain correct location of test site. Sites are determined by the
water quality committee and all tests are to be completed unless there is a
safety issue. The test leader will make this determination. If a specific site or
sites are not tested, the full reasons why will be written on the forms.
Pembroke Watershed Association
-- QAPP Appendix
p.16
Appendix
4.
At test site: Obtain and document physical characteristics of the water, water
conditions, presence of weeds and algae, and document on the appropriate
form, using consensus and camera picture if necessary or significant.
5.
Surface water temperature, air temperature, and total water depth at sampling
area are to be collected and documented on the form.
6.
Test bottle identifier should be written on cap with marker.
a. Labeling of sampling bottle is to be completed and the bottle signed by the
tester.
b. To start the actual test the bottle is to be rinsed three times with surface
water on the opposite side of boat from sampling area.
c. The test stick must be rinsed clean before testing starts, with special
emphasis on removing any algae or weeds fragments.
7.
The following illustrates proper test procedures
First remove the cap and rinse
the bottle three times on the
opposite side of the boat.
place the bottle in the bottom of
the test grab stick, secure it and
place a cork in the mouth.
Note: sampler should be
cleaned of all plant fragments,
algal strands, etc. and rinsed
prior to use
Special care must be taken that
the inside of the cap and bottle
are never touched.
The Bottle is lowered to a depth
of 4 feet - all tests are to be
done at this depth. Testing is to
be done in a minimum of 6 feet,
determined by use of the depth
finder. This depth is to be cross
checked by use of the secchi
disk on one site.
If at a deep hole location and a
second phosphorus sample is
required, lower a second bottle to
a depth 6 to 8 inches off of the
bottom.
Pembroke Watershed Association
-- QAPP Appendix
p.17
Appendix
The string is pulled, filling the
bottle at depth.
The bottle is moved back and
forth to release any air and
brought to the surface.
Bottle is to be inspected for any
foreign material. If there is any
foreign matter, the bottle is to
be discarded and the test
retaken with a new bottle.
The cap is secured.
8.
Dry bottle off, write site identifier on top using marker and bottle is placed in
cooler with ice. After testing is finished, a clean dry label is completed and
attached to the sampling bottle, tester signs label and sampling form.
9.
Complete Secchi disc measurement: Done by two people:
One person lowers Secchi disc
straight down in water while
second person uses view scope
and notes when Secchi disc is
no longer visible.
First person places clip on
Secchi disc rope at that point
and measures length from clip
to disc - record measurement
and time on form. Secchi disc is
used on shady side of boat to
minimize effects of glare.
10.
The YSI model 85 is used to test for DO, conductance, and salinity. Lower the probe to a
depth of 4 feet. If at a deep hole location, perform temperature and DO readings at two-foot
intervals. Document each reading on forms with sample time, temperature, and depth.
A separate pH reading on the surface is required utilizing the YSI EcoSense pH100 meter.
11.
Total Depth at site is measured utilizing the depth finder provided in the kit. To verify
accuracy one site per test session will also utilize the Secchi disk to check depth. This must
Pembroke Watershed Association
-- QAPP Appendix
p.18
Appendix
be taken last so as not to stir up the bottom. Drop the Secchi disk down until it reaches the
bottom, mark and measure the depth using the tape measure
12.
The test leader will witness all data forms.
13.
The following tests should always be requested from Analytical labs. They are to be
entered on the Chain of custody form.
-
Turbidity
Total Phosphorous
Chloride
Alkalinity
We will request that Analytical Labs test the Nitrogen series once a year per pond
- Nitrate Nitrogen
- TK Nitrogen
- Nitrite Nitrogen
- Total Nitrogen - calculated by the lab
- Ammonia
Data Handling and Transporting Samples to the lab.
1. The test leader will verify completeness of all forms. All data forms are to be
filled in completely. Bottle labels are also to be filled in completely and the test
site number should be written on the top.
2. Sample bottles are to be placed in a cooler with ice or ice packs as soon as they
are collected. The samples are to be kept iced or refrigerated until delivered to
the lab.
3. All test sample forms are to be collected at the end of the tests for that pond. The
original forms are to be turned in to the Field Monitoring Coordinator, who will
then make copies and forward the original forms to central storage.
4. Chain of Custody forms are to be completed by the test leader. The purchase
order number will be provided and is entered on the form. The Chain of Custody
form MUST be signed by the test leader and whoever is transporting the samples. If
custody of the samples changes, the persons involved must both sign off on the
form. Once the samples reach the lab, they will return the pink copy of the form
to the transporter along with new bottles. These are to be returned to the Field
Monitoring Coordinator. The pink copy of the chain of custody will be turned over
to central storage. Addendum # 3 A completed example of the bottle label and
chain of custody forms is included in this document.
5. The test results will be mailed back to the PWA by the lab. Originals are to be
turned over to the Field Monitoring Coordinator, who will then make copies and
forward the original forms to central storage.
Pembroke Watershed Association
-- QAPP Appendix
p.19
Appendix
6. Copies of all test forms and results from Analytical will be given to the Data
Management Coordinator, who will input the data into the spreadsheet and
periodically provide copies for central storage.
Quality Control procedures:
We are required to take additional samples for quality control. We are taking a quality
control sample once per pond per year. Quality control sampling is scheduled to assure that
Test leaders and samplers have additional sampling bottles, the QC documentation forms,
and follow the QC procedure when sampling.
Quality control procedure:
Chemical quality control will be accomplished by collecting a duplicate sample at one site,
called a blind sample. This sample will be collected immediately after a sample has been
taken at that site, and will be collected by a second sampler.
Meter and Secchi disc quality control will be accomplished by having a second sampler
complete the meter readings and conduct the secchi disc reading. The first sampler acts as
assistant (dropping the secchi disc, dropping the meter probe to required depth).
Documentation of sample collection and meter readings should be noted on the QC
documentation form as well as the data sheet for that site.
“Blind” sample should be noted with time of collection on the chain of custody form.
Equipment and supplies needed for water quality testing:
The test leader should make visual inspection prior to testing to ensure that all required
equipment is present in each kit.
1.
2.
3.
4.
5.
6.
7.
8.
9.
10.
11.
12.
13.
14.
15.
16.
17.
18.
19.
20.
21.
Cooler for sampling storage include ice or frozen ice packs
GPS
DO meter (YSI model 85)
Sampling bottles (2 extra)
Marker for noting sampling area on cap
pens for documentation
testing stick - must be clean of all algae and weed fragments
tape measure for depth measurement
thermometer for air and surface water temperature measurements
Secchi disc
view scope
pH meter
clothes pin or clip
paper towels or towels for drying bottles
documentation forms for sampling and DO for all sites
chain of custody forms - include correct PO Number
clip board for forms
camera: take pictures of unusual or significant physical findings (prefer digital)
A copy of these testing procedures, sunscreen and beverages
Depth Finder and personal flotation device
Extra bottle labels
Pembroke Watershed Association
-- QAPP Appendix
p.20
Appendix
Pembroke Watershed Association
-- QAPP Appendix
p.21
Appendix
** http://www.weather.com/outlook/driving/interstate/pastweather/02359?from=36hr_topnav_driving
Pembroke Watershed Association
-- QAPP Appendix
p.22
Appendix
Pembroke Watershed Association
-- QAPP Appendix
p.23
Appendix
These are completed examples of the Bottle label
And the Chain of Custody form. Note that the purchase order number is required on the
form.
The chain of custody form must be signed by the responsible test leader and the transporter.
Each separate person who becomes responsible for the test samples MUST sign the form.
We will always request tests from Analytical Labs for:
- Turbidity
- Total Phosphorous
- Chloride
- Alkalinity
Nitrogen series
-
- to be taken once per pond per testing year
Nitrate Nitrogen
Nitrite Nitrogen
Ammonia
TK Nitrogen
Total Nitrogen - calculated by the lab
Conductance should only be included if necessary.
include the time of the sample
Note that Analytical labs requires us to
Pembroke Watershed Association
-- QAPP Appendix
p.24
Appendix
Pembroke Watershed Association
-- QAPP Appendix
p.25
Appendix
What are we testing for?
•
Nitrogen - is a fundamental nutrient and is required by all living plants and animals
for building proteins
Measured in mg/liter
– Natural range is between 0.1 and 2 mg/l
– For concentrations >5 mg/l negative impact is certain
•
Phosphorus - is normally scarce in a normal aquatic environment, is necessary for
plant growth, and is abundant on land.
Measured in mg/liter
– Concentration should be between .01 and .1 mg/l
– For concentrations >.05 mg/l impact is light
– For concentrations >.10 mg/l negative impact is certain
•
Note: marked increase in Nitrogen or Phosphorous loads in a pond will encourage the
proliferation of algae, fueling an overpopulation of bacteria that eat the decomposing
algae. Less light diffuses through the water, impacting aquatic plant life. Aquatic
life and algae compete for dissolved oxygen, and oxygen levels will plummet,
resulting in eutrophic conditions and loss of habitat.
•
Turbidity: The amount of suspended solids in the water.
– Measured in NTU (Nephelometric Turbidity units)
– Level should be between 1.0 and 10.0 NTU
– Turbidity directly effects transparency (clarity) of the water
•
Dissolved Oxygen (DO): The amount of oxygen in the water
– Measured in mg/liter
– Fish need a DO level >6.0 for warm water species, >7.0 for cold water species
– DO levels will be higher near the surface due to wind effects, therefore should
be measured at a minimum depth of 4 feet
•
pH and Alkalinity: ability of water to handle acid and basic solutions
– A pH of 7.0 is neutral, a higher pH means alkaline, a lower pH means acidic.
– Pond water pH should range between 6.5 and 8.5
– Alkalinity refers to the ability of the body of water to neutralize incoming acids
from precipitation or discharges. Low alkalinity indicates low buffering ability.
•
Secchi Disk Transparency: directly relates to turbidity, measures clarity.
– Measured in feet
– Water clarity: how far down can a Secchi disc be seen.
– Expected depth should be > 10 feet, with high water quality exceeding 16 feet
•
Other: Chloride, Salinity and Ammonia are also included
Pembroke Watershed Association
-- QAPP Appendix
p.26
Appendix
GPS Coordinates for Test Sites Determined by Field GPS
Oldham Pond
Tributary A
Tributary B
Country Lane
O-08
420 04.217 N
420 04.172 N
420 04.496 N
420 03.645 N
700 50.640 W
700 50.669 W
700 50.724 W
700 49.910 W
42 03.550 N
70 49.976 W
South
420 03.186 N
420 03.233 N
700 49.182 W
700 49.315 W
North
South
420 01.882 N
420 01.741 N
700 49.779 W
700 49.330 W
Central
420 02.495 N
700 50.055 W
Central
420 03.393 N
700 48.618 W
Upstream of culvert
Southeast
Pembroke Side
Outlet
Furnace Pond
Outlet
F-08
Stetson Pond
S-04
S-05
Little Sandy
Pond
LS-04
Hobomock Pond
H-02
Pembroke Watershed Association
-- QAPP Appendix
p.27
Appendix
Pembroke Watershed Association
Water Quality Testing Qualification/Requalification Program
Part I: Land Based training
Review of dissolved oxygen Meter calibration, set-up, and measurements
Review of Secchi disc measurements and use
Review of the sample forms for lab samples, DO, and Chain of Custody
Gather equipment and supplies for testing
Obtain and document preliminary information on sample forms
Part II: Safety Instruction
Describes and demonstrates standard boat safety with life preserver use, adherence
to boat safety rules, general protection measures.
Identifies unsafe testing conditions and documents on forms
During actual testing portion of qualification demonstrates safety awareness of self
and others on the boat and follows standard safety measures.
Part III: Obtain Samples and tests during actual tests, according to written procedures
Complete sample collection procedural requirements for a minimum of 3 sites
Complete DO tests for a minimum of 3 sites
Complete both sample and DO forms completely and properly for a minimum of 3 sites
Complete Secchi disc measurement and use of view scope for a minimum of 3 sites
Demonstrate proper use and storage of equipment and sampling bottles
Identify conditions in which sampling cannot be done
Act as tester, witness, and assistant in testing collection and documentation
Part IV: Documentation of Training
A member will be considered trained once they have successfully completed the
above training requirements.
A Qualification/Requalification Sampling Competency sheet will be competed and
signed by the instructor. It will then be turned in to the Field Monitoring Coordinator.
The Field Monitoring Coordinator will send the original signed
Qualification/Requalification Sampling Competency sheet to PWA central storage and
keep a copy for reference.
Pembroke Watershed Association
-- QAPP Appendix
p.28
Appendix
Addendum # 1
Testing schedule for the 2010 testing year (June 2010 – September 2010).
We will conduct a total of 33 tests
Furnace Pond (94085) – 103 Acres
3 test sites. This pond will be tested monthly from June through September. 12 tests
Oldham Pond (94114) - 232 Acres
4 test sites. This pond will be tested monthly from June through September.
16 tests
Stetson Pond (62182) – 88.2 Acres
2 test sites This pond will be tested in June and August . 4 tests
Hobomock Pond (94177) – Category 2 – 12.7 Acres
Testing is suspended due to Hydrilla infestation
Little Sandy Pond (94085)– Category 2 - 56.1 Acres
1 test site. This pond will be tested in August - 1 test
The following categories are those identified in the Massachusetts year 2008 Integrated
List of waters
Category 5 are “Waters requiring a TMDL”
Category 4c are waters where “Impairment not caused by a pollutant”
Category 2 “attaining some uses – others not assessed”
Furnace Pond (94085) – Category 5 - Organic enrichment/low DO
Oldham Pond (94114) – Category 4c - Exotic species
Stetson Pond (62182) – Category 5 – Nutrients, Organic enrichment/low DO, Exotic
species
Hobomock Pond (94177) – Category 2
Little Sandy Pond (94085)– Category 2
Pembroke Watershed Association
-- QAPP Appendix
p.29
Appendix
Addendum # 2
Pembroke Watershed Association
Qualification / Requalification Sampling Competency:
1. Completed water sample collection according to procedure:
_________
2. Performed Secchi disc measurement according to procedure:
_________
3. Completed DO measurement according to procedure:
_________
10. Completed Sampling form and DO form per procedure:
_________
11. Completed role of witness correctly:
_________
12. Demonstrated safety and careful handling of equipment:
_________
13. Verbalized correct safety and team behavior expected on boat:
_________
14. Identified situations in which testing would not be possible or
would require alternative plan:
_________
15. Described chain of custody, storage, and transport of samples:
_________
Name:
_________________________________
Date ___________________
Instructor
____________________________________________________________
(print & sign)
Pembroke Watershed Association
-- QAPP Appendix
p.30
Appendix
E-1
Analytical Balance State Certification
Pembroke Watershed Association
-- QAPP Appendix
p.31
Appendix
E-2
Mass DEP Certified Parameter List
Pembroke Watershed Association
-- QAPP Appendix
p.32
Appendix
Pembroke Watershed Association
-- QAPP Appendix
p.33
Appendix
Pembroke Watershed Association
-- QAPP Appendix
p.34
mg/L
C
YSI Model 85
Handheld Oxygen,
Conductivity, Salinity,
and Temperature
System
Operations
Manual
CONTENTS
SECTION 1 Introduction....................................................................................................................1
SECTION 2 Preparing The Meter....................................................................................................3
2.1
2.2
2.3
2.4
2.5
2.6
Unpacking.............................................................................................................................3
Warranty Card.......................................................................................................................3
Batteries ................................................................................................................................3
Calibration/Storage Chamber...............................................................................................5
Hand Strap ............................................................................................................................5
The Meter Case.....................................................................................................................5
SECTION 3 Preparing The Probe....................................................................................................7
3.1 Membrane Cap Installation ................................................................................................7
SECTION 4 Overview Of Operation................................................................................................9
SECTION 5 Calibration...................................................................................................................11
5.1 Calibration of Dissolved Oxygen.......................................................................................11
5.2 Calibration of Conductivity................................................................................................12
SECTION 6 Advanced Conductivity Setup...................................................................................15
6.1 Changing the Temperature Coefficient..............................................................................15
6.2 Changing the Reference Temperature ...............................................................................16
6.3 Changing from Autoranging to Manual Ranging .............................................................16
SECTION 7 Making Measurements ..............................................................................................17
7.1
7.2
7.3
7.4
Turning the Instrument On.................................................................................................17
The Measurement Modes of the Model 85........................................................................17
Autoranging and Range Searching ....................................................................................18
The Backlight......................................................................................................................18
SECTION 8 Saving Data...................................................................................................................21
8.1 Saving Data to Memory .....................................................................................................21
8.2 Recalling Stored Data.........................................................................................................21
8.3 Erasing Stored Data............................................................................................................22
SECTION 9 Maintenance ................................................................................................................23
9.1 Cleaning and Storage..........................................................................................................23
SECTION 10 Principles Of Operation............................................................................................25
10.1 Temperature Effect on Conductivity ...............................................................................25
i
SECTION 11 Discussion Of Measurement Errors........................................................................27
11.1 Dissolved Oxygen Measurement Errors..........................................................................27
11.2 Conductivity Measurement Errors...................................................................................29
11.3 Dissolved Oxygen Probe Precautions..............................................................................31
SECTION 12 Troubleshooting .........................................................................................................33
SECTION 13 Warranty And Repair...............................................................................................35
SECTION 14 Accessories And Replacement Parts .......................................................................40
APPENDIX A
APPENDIX B
APPENDIX C
APPENDIX D
APPENDIX E
APPENDIX F
Specifications ............................................................................................................45
Required Notice ........................................................................................................47
Temperature Correction Data ...............................................................................51
Conversion Chart.....................................................................................................53
Oxygen Solubility Table ..........................................................................................52
Calibration Values Table.........................................................................................54
ii
SECTION 1
INTRODUCTION
The YSI Model 85 Handheld Dissolved Oxygen, Conductivity, Salinity and Temperature System is
a rugged, micro-processor based, digital meter with an attached YSI combination conductivity and
dissolved oxygen probe.
The YSI Model 85 is designed for use in field, lab, and process control applications as well as for
environmental, aquaculture, and industrial uses. The Model 85 is available with cable lengths of
either 10, 25, 50 or 100 feet. The body of the probe has been manufactured with stainless steel to add
rugged durability and sinking weight. The probe also utilizes our easy to install cap membranes for
measuring dissolved oxygen.
The YSI Model 85 probe is a non-detachable, combination sensor designed specifically for the YSI
Model 85 Handheld System. The conductivity portion is a four-electrode cell with a cell constant of
5.0/cm ±4%. The dissolved oxygen portion is a polargraphic Clark type sensor.
The Model 85’s microprocessor allows the system to be easily calibrated for dissolved oxygen or
conductivity with the press of a few buttons. Additionally, the microprocessor performs a selfdiagnostic routine each time the instrument is turned on. The self-diagnostic routine provides you
with useful information about the conductivity cell constant and function of the instrument circuitry.
The system simultaneously displays temperature (in °C), along with one of the following
parameters: dissolved oxygen in either mg/L (milligrams per liter) or % air saturation; conductivity;
temperature compensated conductivity; (in µS/cm or mS/cm), and salinity (in parts per thousand
{ppt}).
The system requires only a single calibration regardless of which dissolved oxygen display you use.
The calibration of conductivity is not required but is available. A single calibration will adjust the
instrument, regardless if you are reading conductivity or temperature compensated conductivity.
You can switch between all of these parameters with the push of a single key.
A calibration\storage chamber is built into the instrument case. A small sponge in the chamber can
be moistened to provide a water saturated air environment that is ideal for air calibration of the
dissolved oxygen probe. This chamber also provides a convenient place to store the probe when the
system is not in use, and provides protection for the electrodes within the conductivity probe. The
Model 85 case is also waterproof (rated to IP65). You can operate your Model 85 in the rain without
damage to the instrument.
Six AA-size alkaline batteries power the instrument. A new set of alkaline batteries will provide
approximately 100 hours of continuous operation. When batteries need to be replaced, the LCD will
display a “LO BAT” message.
YSI, Incorporated
Model 85
1
Introduction
YSI, Incorporated
Section 1
Model 85
2
SECTION 2 PREPARING THE METER
2.1
UNPACKING
When you unpack your new YSI Model 85 Handheld Dissolved Oxygen, Conductivity, Salinity
and Temperature System for the first time, check the packing list to make sure you have received
everything you should have. If there is anything missing or damaged, call the dealer from whom
you purchased the Model 85. If you do not know which of our authorized dealers sold the system
to you, call YSI Customer Service at 800-765-4974 or 937-767-7241, and we'll be happy to help
you.
2.2
WARRANTY CARD
Before you do anything else, please complete the Warranty Card and return it to YSI. This will
record your purchase of this quality instrument in our computer system. Once your purchase is
recorded, you will receive prompt, efficient service in the event any part of your YSI Model 85
should ever need repair and we will be able to quickly verify the warranty period.
2.3
BATTERIES
There are a few things you must do to prepare your YSI Model 85 for use. First, locate the six AAsize alkaline batteries that were included in your purchase. Use a screwdriver or a small coin to
remove the thumbscrew on the bottom of the instrument. This thumbscrew holds the batterychamber cover in place. The battery-chamber cover is marked with the words "OPEN" and
"CLOSE."
Hand strap
Battery chamber
cover
Thumb screw
Polarity marking
O-rings
YSI, Incorporated
Model 85
3
Preparing the Meter
Section 2
NOTE: On some models, the battery cover thumbscrew may be unscrewed by hand (a screwdriver
may not be required).
There is a small label inside each of the two battery-chamber sleeves. These labels illustrate the
correct way to install the batteries into each sleeve of the battery-chamber.
NOTE: It is very important that the batteries be installed ONLY as illustrated. The instrument will
not function and may be damaged if the batteries are installed incorrectly.
YSI, Incorporated
Model 85
4
Preparing the Meter
Section 2
Turn the instrument on by pressing and releasing the ON/OFF button on the front of the instrument.
The liquid crystal display (LCD) should come on. Allow a few seconds for the instrument to
complete its diagnostic routine. Notice that the instrument will display the specific cell constant of
the conductivity probe during this diagnostic routine. If the instrument does not operate, consult the
section entitled Troubleshooting.
You may also want to take the instrument into a dark room and with the instrument ON, hold down
the LIGHT button. The instrument backlight should illuminate the LCD so that the display can be
easily read.
2.4
CALIBRATION/STORAGE CHAMBER
The Model 85 has a convenient calibration storage
chamber built into the instruments' side. This chamber
provides an ideal storage area for the probe during
transport and extended non-use. If you look into the
chamber you should notice a small round sponge in the
bottom of the chamber. Carefully put 3 to 6 drops of
clean water into the sponge. Turn the instrument over
and allow any excess water to drain out of the chamber.
The wet sponge creates a 100% water saturated air
environment for the probe, which is ideal for dissolved
oxygen calibration.
2.5
Calibration/Storage
Chamber
HAND STRAP
The hand strap is designed to allow comfortable operation of the Model 85 with minimum effort. If
the hand strap is adjusted correctly, it is unlikely that the instrument will be easily dropped or
bumped from your hand. See figure on previous page.
To adjust the hand strap on the back of the meter, unsnap the vinyl cover and pull the two Velcro
strips apart. Place your hand between the meter and the strap and adjust the strap length so that your
hand is snugly held in place. Press the two Velcro strips back together and snap the vinyl cover back
into place.
2.6
THE METER CASE
The meter case is sealed at the factory and is not intended to be opened, except by authorized service
technicians. Do not attempt to separate the two halves of the meter case as this may damage the
instrument, break the waterproof seal, and will void the manufacturer's warranty.
YSI, Incorporated
Model 85
5
Preparing the Meter
YSI, Incorporated
Section 2
Model 85
6
SECTION 3 PREPARING THE PROBE
The YSI Model 85 dissolved oxygen probe is shipped dry. The protective membrane cap on
the probe tip must be removed and replaced with KCl solution and a new membrane cap
before using the probe. Follow the instructions below to install KCl solution and the new
membrane cap.
3.1
MEMBRANE CAP INSTALLATION
To install a new membrane on your YSI Model 85 dissolved oxygen probe:
1.
2.
3.
4.
5.
6.
Unscrew and remove the probe sensor guard.
Unscrew and remove the old membrane cap.
Thoroughly rinse the sensor tip with distilled water.
Prepare the electrolyte according to the directions on the KCl solution bottle.
Hold the membrane cap and fill it at least 1/2 full with the electrolyte solution.
Screw the membrane cap onto the probe moderately tight. A small amount of
electrolyte should overflow.
7. Screw the probe sensor guard on moderately tight.
Fill Membrane
with KCL Solution
Unscrew Guard
Unscrew Cap
Screw Cap on
moderately tight
YSI, Incorporated
Screw Guard on
moderately tight
Model 85
7
Preparing the Probe
YSI, Incorporated
Section 3
Model 85
8
SECTION 4 OVERVIEW OF OPERATION
The following diagram is an overview of the operation of the Model 85. See the following sections
for details of operation.
YSI, Incorporated
Model 85
9
Overview of Operation
YSI, Incorporated
Section 4
Model 85
10
SECTION 5
5.1
CALIBRATION
CALIBRATION OF DISSOLVED OXYGEN
To accurately calibrate the YSI Model 85 you will need to know the approximate altitude of
the region in which you are located.
1. Ensure that the sponge inside the instrument's
calibration chamber is wet. Insert the probe into
the calibration chamber.
2. Turn the instrument on by pressing the
ON/OFF button on the front of the instrument.
Press the MODE button until dissolved oxygen
is displayed in mg/L or %. Wait for the
dissolved oxygen and temperature readings to
stabilize (usually 15 minutes is required).
Calibration/Storage
Chamber
3. Use two fingers to press and release both the
UP ARROW and DOWN ARROW buttons at the same time.
4. The LCD will prompt you to enter the local altitude in hundreds of feet. Use the arrow
keys to increase or decrease the altitude. When the proper altitude appears on the LCD, press
the ENTER button once.
EXAMPLE: Entering the number 12 here indicates 1200 feet.
5. The Model 85 should now display CAL in the lower left of the display, the calibration
value should be displayed in the lower right of the display and the current % reading (before
calibration) should be on the main display. Make sure that the current % reading (large
display) is stable, then press the ENTER button. The display should read SAVE then should
return to the Normal Operation Mode.
Each time the Model 85 is turned off, it may be necessary to re-calibrate before taking
measurements. All calibrations should be completed at a temperature which is as close as
possible to the sample temperature. Dissolved oxygen readings are only as good as the
calibration.
YSI, Incorporated
Model 85
11
Calibration
5.2
Section 5
CALIBRATION OF CONDUCTIVITY
IMPORTANT: System calibration is rarely required because of the factory calibration of the
YSI Model 85. However, from time to time it is wise to check the system calibration and make
adjustments when necessary.
Prior to calibration of the YSI Model 85, it is important to remember the
following:
1. Always use clean, properly stored, NIST traceable calibration solutions (see Accessories and
Replacement Parts). When filling a calibration container prior to performing the calibration
procedures, make certain that the level of calibrant buffers is high enough in the container to
cover the entire probe. Gently agitate the probe to remove any bubbles in the conductivity cell.
2. Rinse the probe with distilled water (and wipe dry) between changes of calibration solutions.
3. During calibration, allow the probe time to stabilize with regard to temperature (approximately
60 seconds) before proceeding with the calibration process. The readings after calibration are
only as good as the calibration itself.
4. Perform sensor calibration at a temperature as close to 25°C as possible. This will minimize any
temperature compensation error.
Follow these steps to perform an accurate calibration of the YSI Model 85:
1. Turn the instrument on and allow it to complete its self-test procedure.
2. Select a calibration solution that is most similar to the sample you will be measuring.
•
•
•
For sea water choose a 50 mS/cm conductivity standard (YSI Catalog# 3169)
For fresh water choose a 1 mS/cm conductivity standard (YSI Catalog# 3167)
For brackish water choose a 10 mS/cm conductivity standard (YSI Catalog # 3168)
3. Place at least 3 inches of solution in a clean glass beaker.
4. Use the MODE button to advance the instrument to display conductivity.
5. Insert the probe into the beaker deep enough so that the oval-shaped hole on the side of the probe
is completely covered. Do not rest the probe on the bottom of the container -- suspend it above
the bottom at least 1/4 inch.
6. Allow at least 60 seconds for the temperature reading to become stable.
7. Move the probe vigorously from side to side to dislodge any air bubbles from the electrodes.
8. Press and release the UP ARROW and DOWN ARROW buttons at the same time.
The CAL symbol will appear at the bottom left of the display to indicate that the instrument is now
in Calibration mode.
YSI, Incorporated
Model 85
12
Calibration
Section 5
10.00 µS
24.8 oC
CAL
9. Use the UP ARROW or DOWN ARROW button to adjust the reading on the display until it
matches the value of the calibration solution you are using.
10. Once the display reads the exact value of the calibration solution being used (the instrument will
make the appropriate compensation for temperature variation from 25°C), press the ENTER
button once. The word “SAVE” will flash across the display for a second indicating that the
calibration has been accepted.
The YSI Model 85 is designed to retain its last conductivity calibration permanently. Therefore,
there is no need to calibrate the instrument after battery changes or power down.
YSI, Incorporated
Model 85
13
Calibration
YSI, Incorporated
Section 5
Model 85
14
SECTION 6
ADVANCED CONDUCTIVITY SETUP
The default settings of the YSI Model 85 are appropriate for the vast majority of measurement
applications. However, some measurement applications require very specific measurement criteria.
For that reason, we have made the YSI Model 85 flexible to accommodate these “advanced users.”
If, for example, you are using the YSI Model 85 for a process control application that requires that
the conductivity readings be compensated to 20 oC instead of 25 oC -- this is the section to read. Or,
if your application for the YSI Model 85 involves the measurement of a very specific saline solution,
the default temperature coefficient may need to be changed to get the very best measurement of that
specific salt.
IMPORTANT: There is never a need to enter Advanced Setup Mode unless your special
measurement application calls for a change in reference temperature and or temperature coefficient.
Therefore, unless you are certain that your application requires a change to one or both of these
criteria, do not modify the default reference temperature (25oC) or the default temperature
coefficient (1.91%).
6.1
CHANGING THE TEMPERATURE COEFFICIENT
Follow these steps to modify the temperature coefficient of the Model 85.
1. Turn the instrument on and wait for it to complete its self-test procedure.
2. Use the MODE button to advance the instrument to display conductivity.
3. Press and release both the DOWN ARROW and the MODE buttons at the same time.
The CAL symbol will appear at the bottom left of the display. The large portion of the display will
show 1.91 % (or a value set previously using Advanced Setup).
4. Use the UP ARROW or DOWN ARROW button to change the value to the desired new
temperature coefficient.
5. Press the ENTER button. The word “SAVE” will flash across the display for a second to
indicate that your change has been accepted.
6. Press the MODE button to return to normal operation; the CAL symbol will disappear from the
display.
YSI, Incorporated
Model 85
15
Advanced Conductivity Setup
6.2
Section 6
CHANGING THE REFERENCE TEMPERATURE
Follow these steps to modify the reference temperature of the Model 85.
1. Turn the instrument on and wait for it to complete its self-test procedure.
2. Use the MODE button to advance the instrument to display conductivity.
3. Press and release both the DOWN ARROW and the MODE buttons at the same time.
The CAL symbol will appear at the bottom left of the display. The large portion of the display will
show 1.91 % (or a value set previously using Advanced Setup).
4. Press and release the MODE button; the large portion of the display will show 25.0C (or a
value set previously using Advanced Setup).
5. Use the UP ARROW or DOWN ARROW button to change the value to the desired new
reference temperature (any value between 15 oC and 25 oC is acceptable).
6. Press the ENTER button. The word “SAVE” will flash across the display for a second to
indicate that your change has been accepted.
7. The instrument will automatically return to normal operation mode.
6.3
CHANGING FROM AUTORANGING TO MANUAL RANGING
If your application is easier to perform using a manual range that you select, the YSI Model 85
allows you to turn off the default autoranging feature. While you are making conductivity or
temperature compensated conductivity measurements, simply press and release the UP ARROW
button. Each additional press of the UP ARROW button will cycle the Model 85 to a different
manual range until you return again to autoranging. Five pushes of the UP ARROW button will
cycle the Model 85 through the four manual ranges and return the instrument to autoranging.
NOTE: You may see an error message in some manual ranges if the manual range selected is not
adequate for the sample you are measuring. If this happens, simply press and release the UP
ARROW button again until a range is selected which is suitable for your sample. If you get lost and
don’t know if you’re in a manual range or autoranging, simply turn the instrument off and back on.
Also note that the conductivity units will flash while you are in manual range. The instrument will
always default to autoranging when first turned on.
The four ranges of the YSI Model 85 are:
Range 1
Range 2
Range 3
Range 4
0 to 499.9 µS/cm
0 to 4999 µS/cm
0 to 49.99 mS/cm
0 to 200.0 mS/cm
YSI, Incorporated
Model 85
16
SECTION 7 MAKING MEASUREMENTS
7.1
TURNING THE INSTRUMENT ON
Once the batteries are installed correctly, press the ON/OFF button. The instrument will activate all
segments of the display for a few seconds, which will be followed by a self-test procedure that will
last for several more seconds. During this power on self-test sequence, the instrument’s
microprocessor is verifying that the instrument is working properly. The Model 85 will display the
cell constant of the conductivity probe when the self-test is complete. If the instrument were to
detect an internal problem, the display would show a continuous error message. See the section
entitled Troubleshooting for a list of these error messages.
7.2
THE MEASUREMENT MODES OF THE MODEL 85
The Model 85 is designed to provide six distinct measurements:
¾ Dissolved Oxygen % -- A measurement of oxygen in percent of saturation.
¾ Dissolved Oxygen mg/L -- A measurement of oxygen in mg/L
¾ Conductivity -- A measurement of the conductive material in the liquid sample without regard
to temperature
¾ Specific Conductance -- Also known as temperature compensated conductivity which
automatically adjusts the reading to a calculated value which would have been read if the sample
had been at 25o C (or some other reference temperature which you choose). See Advanced
Setup.
¾ Temperature -- which is always displayed.
¾ Salinity -- A calculation done by the instrument electronics, based upon the conductivity and
temperature readings.
NOTE: When you turn the Model 85 off, it will “remember” which mode you used last and will
return to that mode the next time the instrument is turned on.
To choose one of the measurement modes above (temperature is always displayed) simply press and
release the MODE button. Carefully observe the small legends at the far right side of the LCD.
Dissolved Oxygen
in % with°C
YSI, Incorporated
Dissolved Oxygen
in mg/L with °C
Conductivity with
°C
Model 85
Specific
Conductance
with °C
Salinity with °C
17
Making Measurements
Section 7
If the instrument is reading Specific
Conductance the large numbers on the display
will be followed by either a µS or an mS.
Additionally the small portion of the display will
show the o C flashing on and off.
If the instrument is reading Conductivity (not
temperature compensated) the large numbers on
the display will be followed by either a µS or an
mS. Additionally the small portion of the display
will show the o C NOT flashing.
300.1
µS
23.4
o
C
If the instrument is reading Dissolved Oxygen the large numbers on the display will be followed by
either a mg/L or %. It is important to remember that the dissolved oxygen probe is stirring
dependent. This is due to the consumption of oxygen at the sensor tip during measurement. When
taking dissolved oxygen measurements the probe must be moved through the sample at a rate of 1
foot per second to provide adequate stirring.
If the instrument is reading Salinity the large numbers on the display will be followed by a ppt.
7.3
AUTORANGING & RANGE SEARCHING
The YSI Model 85 is an autoranging instrument. This means that regardless of the conductivity or
salinity of the solution (within the specifications of the instrument) all you need to do to get the most
accurate reading is to put the probe in the sample. This feature makes the Model 85 as simple as
possible to operate.
When you first place the Model 85 probe into a sample or calibration solution, and again when you
first remove the probe the instrument will go into a range search mode that may take as long as 5
seconds. During some range searches the instrument display will flash rANG to indicate its
movement from one range to another. The length of the range search depends on the number of
ranges that must be searched in order to find the correct range for the sample. During the range
search, the instrument will appear to freeze on a given reading for a few seconds then, once the
range is located, will pinpoint the exact reading on the display. The display may also switch to 00.0
for a second or two during a range search before it selects the proper range.
7.4
THE BACKLIGHT
At times it may be necessary to take measurements with the Model 85 in dark or poorly lit areas. To
help in this situation, the Model 85 comes equipped with a backlight that will illuminate the display
so that it can be easily read. To activate the backlight, press and hold the LIGHT button. The
display will remain lit as long as the button is depressed. When you release it, the light goes out to
preserve battery life.
YSI, Incorporated
Model 85
18
Making Measurements
YSI, Incorporated
Section 7
Model 85
19
Making Measurements
YSI, Incorporated
Section 7
Model 85
20
SECTION 8 SAVING DATA
The Model 85 is equipped with non-volatile memory that is capable of storing up to 50 different sets
of readings. Non-volatile means that you do not need to worry that your data will be lost due to a
power failure or power interrupt. The Model 85 will also assign a site identity number to each set of
readings to allow easy review of the data. This feature is useful in situations where transcribing data
is difficult or not available.
8.1
SAVING DATA TO MEMORY
1. While any parameter is displayed on the screen depress the ENTER button and hold for
approximately 2 seconds. The meter will flash SAVE on the display along with the current site
identity being used.
2. When all 50 sites are full the display will flash FULL on the screen. This message will remain on
the screen (even after power down) until a button is pushed.
Once you have acknowledged the memory is full, any subsequent saved data will begin overwriting
existing data starting with site #1.
8.2
RECALLING STORED DATA
1. To put the Model 85 into the RECALL mode depress the MODE button repeatedly until rcl is
displayed on the screen along with the site ID number in the lower right corner. (see figure #1)
2. Depress the ENTER button to review the last set
of data that was saved. The Model 85 will display the
dissolved oxygen in % saturation and temperature.
Another press of the ENTER button will display the
dissolved oxygen in mg/L and the temperature.
rcl
Depress the ENTER button again and again to
review the conductivity, specific conductivity and
salinity readings. All of which are displayed with the
temperature.
01
figure #1
3. Depress the UP ARROW button to increment through the saved sets of data.
4. Depress the DOWN ARROW button to decrement through the saved sets of data.
5. When the correct site ID# is displayed, press the ENTER button to display the data.
YSI, Incorporated
Model 85
21
Saving Data
Section 8
6. When you have finished recalling data, press the MODE button to return to normal operation.
NOTE: The Model 85 will recall data as a list. When the UP ARROW is depressed the Model 85
will display the Site ID# for the previously recorded date. For example: If you are reviewing Site
ID# 5 and the UP ARROW is depressed the Model 85 will display Site ID# 4. If you are reviewing
Site ID# 5 and Site ID# 5 was the last set of data stored the DOWN ARROW button will display
Site ID# 1.
Here is an example of the Model 85 memory.
Site ID #1
Site ID #2
Site ID #3
If the UP ARROW button was pressed the Model 85 would display Site ID #2
Site ID #4
Site ID #5
8.3
ERASING STORED DATA
1. To erase the data that is stored into the Model 85’s memory, depress the MODE button repeatedly
until the Model 85 displays ErAS on the screen. (see figure #2)
2. Depress and hold the DOWN ARROW and
ENTER buttons simultaneously for approximately 5
seconds.
3. The Model 85 flashing DONE on the display for 1
to 2 seconds indicates successful erasure. The
instrument will automatically change to normal
operation after completion.
ErAS
IMPORTANT: Data in all 50 site ID’s will be
erased completely and will be lost forever. Do not
use the erase function until all recorded data has been
transcribed to an archive outside the Model 85.
figure #2
YSI, Incorporated
Model 85
22
SECTION 9 MAINTENANCE
9.1
CLEANING AND STORAGE
The single most important requirement for accurate and reproducible results in conductivity
measurement is a clean cell. A dirty cell will change the conductivity of a solution by contaminating
it.
NOTE: ALWAYS RINSE THE CONDUCTIVITY CELL WITH CLEAN WATER AFTER
EACH USE.
To clean the conductivity cell:
1. Dip the cell in cleaning solution and agitate for two to three minutes. Any one of the foaming
acid tile cleaners, such as Dow Chemical Bathroom Cleaner, will clean the cell adequately.
When a stronger cleaning preparation is required, use a solution of 1:1 isopropyl alcohol and 1
N HCl. Remove the cell from the cleaning solution.
2. Use the nylon brush (supplied) to dislodge any contaminants from inside the electrode chamber.
3. Repeat steps one and two until the cell is completely clean. Rinse the cell thoroughly in
deionized, or clean tap water.
4. Store the conductivity cell in the meter storage chamber.
NOTE: See Section 11, Dissolved Oxygen Probe Precautions for instructions on cleaning the
dissolved oxygen electrodes.
YSI, Incorporated
Model 85
23
Maintenance
YSI, Incorporated
Section 9
Model 85
24
SECTION 10 PRINCIPLES OF OPERATION
The dissolved oxygen sensor utilizes an oxygen permeable membrane that covers an electrolytic cell
consisting of a gold cathode and a porous silver anode. This membrane acts as a diffusion barrier
and an isolation barrier preventing fouling of the cathode surface by impurities in the environment.
Upon entering the cell through the membrane, oxygen is reduced at an applied potential of -0.8 V
referenced to the silver electrode. The reduction current at the cathode is directly proportional to the
partial pressure of oxygen in liquid (expressed as %-air saturation) which is proportional to the
concentration of dissolved oxygen (in mg/L) at a particular temperature. Thus the same partial
pressure of oxygen (% air-saturation) in liquid gives different concentrations of dissolved oxygen
(mg/L) at different temperatures because of the different solubility’s of oxygen at different
temperatures.
The conductivity cell utilizes four pure nickel electrodes for the measurement of solution
conductance. Two of the electrodes are current driven, and two are used to measure the voltage drop.
The measured voltage drop is then converted into a conductance value in milli-Siemens (millimhos).
To convert this value to a conductivity (specific conductance) value in milli-Siemens per cm
(mS/cm), the conductance is multiplied by the cell constant that has units of reciprocal cm (cm-1).
The cell constant for the Model 85 conductivity cell is 5.0/cm + 4%. For most applications, the cell
constant is automatically determined (or confirmed) with each deployment of the system when the
calibration procedure is followed. Solutions with conductivity’s of 1.00, 10.0, 50.0, and 100.0
mS/cm, which have been prepared in accordance with recommendation 56-1981 of the Organisation
Internationale de Métrologie Légale (OIML) are available from YSI. The instrument output is in
µS/cm or mS/cm for both conductivity and specific conductance. The multiplication of cell constant
times conductance is carried out automatically by the software.
10.1 TEMPERATURE EFFECT ON CONDUCTIVITY
The conductivity of solutions of ionic species is highly dependent on temperature, varying as much
as 3% for each change of one degree Celsius (temperature coefficient = 3%/C). In addition, the
temperature coefficient itself varies with the nature of the ionic species present.
Because the exact composition of a natural media is usually not known, it is best to report a
conductivity at a particular temperature, e.g. 20.2 mS/cm at 14 C. However, in many cases, it is also
useful to compensate for the temperature dependence in order to determine at a glance if gross
changes are occurring in the ionic content of the medium over time. For this reason, the Model 85
software also allows the user to output conductivity data in either raw or temperature compensated
form. If "Conductivity" is selected, values of conductivity that are NOT compensated for
temperature are output to the display. If "Specific Conductance" is selected, the Model 85 uses the
temperature and raw conductivity values associated with each determination to generate a specific
conductance value compensated to a user selected reference temperature (see Advanced Setup)
between 15 C and 25 C. Additionally the user can select any temperature coefficient from 0% to 4%
(see Advanced Setup). Using the Model 85 default reference temperature and temperature
coefficient (25 C and 1.91%), the calculation is carried out as in equation (1) below:
YSI, Incorporated
Model 85
25
Principles of Operation
Section 10
Specific Conductance (25°C) = Conductivity
1 + TC * (T - 25)
As noted above, unless the solution being measured consists of pure KCl in water, this temperature
compensated value will be somewhat inaccurate, but the equation with a value of TC = 0.0191 will
provide a close approximation for solutions of many common salts such as NaCl and NH4Cl and for
seawater.
Salinity is determined automatically from the Model 85 conductivity readings according to
algorithms found in Standard Methods for the Examination of Water and Wastewater (ed. 1989).
The use of the Practical Salinity Scale 1978 results in values which are unitless, since the
measurements are carried out in reference to the conductivity of standard seawater at 15 C.
However, the unitless salinity values are very close to those determined by the previously-used
method where the mass of dissolved salts in a given mass of water (parts per thousand) was reported.
Hence, the designation "ppt" is reported by the instrument to provide a more conventional output.
For further information on conductivity and the above standard information, refer to the ASTM
document, Standard Methods of Test for Electrical Conductivity of Water and Industrial
Wastewater, ASTM Designation D1125-82, and OIML Recommendation Number 56. ASTM
symbols for conductivity, cell constant, and path length differ from those preferred in the general
literature and also from those used in this manual.
YSI, Incorporated
Model 85
26
SECTION 11 DISCUSSION OF MEASUREMENT ERRORS
11.1 DISSOLVED OXYGEN MEASUREMENT ERRORS
There are three basic types of error. Type 1 errors are related to limitations of instrument design and
tolerances of instrument components. These are chiefly the meter linearity and the resistor
tolerances. Type 2 errors are due to basic probe accuracy tolerances, chiefly background signal,
probe linearity, and variations in membrane temperature coefficient. Type 3 errors are related to the
operator's ability to determine the conditions at the time of calibration. If calibration is performed
against more accurately known conditions, type 3 errors are appropriately reduced.
The sample calculations that follow are for a near extreme set of conditions.
TYPE 1 ERRORS
A. Meter linearity error: ±1% of full scale reading, or ±0.15 mg/l
B. Component and circuitry error: ±0.05 mg/l
TYPE 2 ERRORS
A. Temperature compensation for membrane temperature coefficient: ±0.03 mg/l
B. Temperature measurement errors: A maximum ±0.2oC probe error is equal to ±0.14 mg/l
YSI, Incorporated
Model 85
27
Discussion of Measurement Errors
Section 11
TYPE 3 ERRORS
A. Altitude:
A 1000-foot change in altitude is equal to an error of approximately 3% at the 10
mg/l level.
B. Humidity:
Errors occur if calibration is performed at less than 100% humidity. The error varies
with the temperature as follows:
TEMPERATURE
ERROR
0oC
0.02 mg/l
10oC
0.05 mg/l
20oC
0.12 mg/l
30oC
0.27 mg/l
40oC
0.68 mg/l
APPROXIMATING THE ERROR
It is unlikely that the actual error in any measurement will be the maximum possible error. A better
error approximation is obtained using a root mean squared (r.m.s.) calculation:
r.m.s. error = ±[1a2 + 1b2 + 2a2 + 2b2 + 3a2 + 3b2]½ mg/l
YSI, Incorporated
Model 85
28
Discussion of Measurement Errors
Section 11
11.2 CONDUCTIVITY MEASUREMENT ERRORS
System accuracy for conductivity measurements is equal to the sum of the errors contributed by the
environment and the various components of the measurement setup. These include:
•
•
•
•
•
•
Instrument accuracy
Cell-constant error
Solution temperature offset
Cell contamination (including air bubbles)
Electrical noise
Galvanic effects
Only the first three are of major concern for typical measurements, although the user should also be
careful to see that cells are clean and maintained in good condition at all times.
Instrument Accuracy = ± .5% maximum
The accuracy specified for the range being used is the worst case instrument error.
Cell-Constant Error = ± .5% maximum
Although YSI cells are warranted to be accurate to within one percent, you should still determine the
exact cell constant of your particular cell. Contamination or physical damage to the cell can alter the
cell constant. Performing a calibration will eliminate any error that might arise because of cell
constant change.
YSI cells are calibrated to within one percent of the stated cell constant at a single point. We
consider these products to be usefully linear over most instrument ranges. The cell constant can be
calibrated to ±0.35% accuracy with YSI conductivity calibrator solutions.
Temperature Error = ± 1% maximum
The solution temperature error is the product of the temperature coefficient and the temperature
offset from 25 C, expressed as a percentage of the reading that would have been obtained at 25 C.
The error is not necessarily a linear function of temperature. The statement of error is derived from a
25 C temperature offset and a 3%/ C temperature coefficient.
Total Error
Considering only the above three factors, system accuracy under worst case conditions will be ±2%,
although the actual error will be considerably less if recommended and properly calibrated cells and
instrument ranges are used. Additional errors, which can essentially be eliminated with proper
handling, are described below.
Cell Contamination
This error is usually due to contamination of the solution being measured, which occurs when
solution is carried-over from the last solution measured. Thus, the instrument might be correctly
reporting the conductivity seen, but the reading does not accurately represent the value of the bulk
YSI, Incorporated
Model 85
29
Discussion of Measurement Errors
Section 11
solution. Errors will be most serious when low conductivity solutions are contaminated by carryover from high conductivity solutions, and can then be of an order of magnitude or more.
Follow the cleaning instructions carefully before attempting low conductivity measurements with a
cell of unknown history or one that has been previously used in higher value solutions.
An entirely different form of contamination sometimes occurs due to a buildup of foreign material
directly on cell electrodes. While rare, such deposits have, on occasion, markedly reduced the
effectiveness of the electrodes. The result is an erroneously low conductance reading.
Electrical-Noise Errors
Electrical noise can be a problem in any measurement range, but will contribute the most error and
be the most difficult to eliminate when operating in the lowest ranges. The noise may be either lineconducted or radiated or both, and may require, grounding, shielding, or both.
Galvanic and Miscellaneous Effects
In addition to the error sources described above, there is another class of contributors that can be
ignored for all but the most meticulous of laboratory measurements. These errors are always small
and are generally completely masked by the error budget for cell-constant calibration, instrument
accuracy, etc. Examples range from parasitic reactance associated with the solution container and its
proximity to external objects to the minor galvanic effects resulting from oxide formation or
deposition on electrodes. Only trial and error in the actual measurement environment can be
suggested as an approach to reduce such errors. If the reading does not change as the setup is
adjusted, errors due to such factors can be considered too small to see.
YSI, Incorporated
Model 85
30
Discussion of Measurement Errors
Section 11
11.3 DISSOLVED OXYGEN PROBE PRECAUTIONS
1. Membrane life depends on usage. Membranes will last a long time if installed properly and
treated with care. Erratic readings are a result of loose, wrinkled, damaged, or fouled
membranes, or from large (more than 1/8" diameter) bubbles in the electrolyte reservoir. If
erratic readings or evidence of membrane damage occurs, you should replace the membrane and
the KCl solution. The average replacement interval is two to four weeks.
2. If the membrane is coated with oxygen consuming (e.g. bacteria) or oxygen evolving organisms
(e.g. algae), erroneous readings may occur.
3. Chlorine, sulfur dioxide, nitric oxide, and nitrous oxide can affect readings by behaving like
oxygen at the probe. If you suspect erroneous readings, it may be necessary to determine if these
gases are the cause.
4. Avoid any environment that contains substances that may attack the probe materials. Some of
these substances are concentrated acids, caustics, and strong solvents. The probe materials that
come in contact with the sample include FEP Teflon, stainless steel, epoxy, polyetherimide and
the polyurethane cable covering.
5. For correct probe operation, the gold cathode must always be bright. If it is tarnished (which can
result from contact with certain gases) or plated with silver, the gold surface must be restored. To
restore the cathode, you may either return the instrument to the factory or clean it using the YSI
5238 probe reconditioning kit. Never use chemicals or abrasives not supplied with this kit.
NOTE: Model 85 probes built before July, 1996 (serial numbers starting with 96F or lower),
should be cleaned with the sanding disc mounted on a FLAT surface. Do NOT use the
curved tool provided in the 5238 probe reconditioning kit on these probes.
6. It is also possible for the silver anode to become contaminated, which will prevent successful
calibration. To clean the anode, remove the membrane and soak the probe overnight in 3%
ammonium hydroxide. Next, rinse the sensor tip with deionized water, add new KCl solution,
and install a new membrane. Turn the instrument on and allow the system to stabilize for at least
30 minutes. If, after several hours, you are still unable to calibrate, return the YSI Model 85
system to an authorized service center for service.
7. To keep the electrolyte from drying out, store the probe in the calibration chamber with the small
piece of sponge.
YSI, Incorporated
Model 85
31
Discussion of Measurement Errors
YSI, Incorporated
Section 11
Model 85
32
SECTION 12 TROUBLESHOOTING
SYMPTOM
POSSIBLE CAUSE
ACTION
1. Instrument will not turn on
A. Low battery voltage
B. Batteries installed wrong
C. Meter requires service
A. Replace batteries
B. Check battery polarity.
C. Return system for service
2. Instrument will not calibrate
(Dissolved Oxygen)
A. Membrane is fouled or damaged
B. Probe anode is fouled or dark
C. Probe cathode is tarnished
D. System requires service
A. Replace membrane & KCl
B. Clean anode
C. Clean cathode
D. Return system for service
3. Instrument will not calibrate
(Conductivity)
A. Cell is contaminated
A. See “Maintenance” Section
4. Instrument "locks up"
A. Instrument has rec'd a shock
B. Batteries are low or damaged
C. System requires service
A & B. Remove battery lid, wait 15
seconds for reset, replace lid.
C. Return system for service
5. Instrument readings are inaccurate
(Dissolved Oxygen)
A. Cal altitude is incorrect
B. Probe not in 100% O2 saturated air
during Cal procedure
C. Membrane fouled or damaged
D. Probe anode is fouled or dark
E. Probe cathode is tarnished
F. System requires service
A. Recalibrate w/correct value
B. Moisten sponge & place in Cal chamber
w/ probe & Recal
C. Replace membrane
D. Clean anode
E. Clean cathode
F. Return system for service
6. Instrument readings are inaccurate
(Conductivity)
A. Calibration is required
B. Cell is contaminated
C. Tempco is set incorrectly
D. Reference temperature incorrect
E. Readings are or are not temperature
compensated.
A. See “Calibration” Section
B. See “Maintenance” Section
C. See “Advanced Setup” Section
D. See “Advanced Setup” Section
E. See “Making Measurements”
Section
7..LCD displays "LO BAT"
A. Batteries are low or damaged
A. Replace batteries
A. Conductivity reading is >200 mS
B. Temperature reading is >65°C
C. Temperature reading is <-5°C
D. Salinity reading is >80 ppt
E. User cell constant cal K is >5.25
F. DO temperature is >46°C
G. DO % saturation is >200%
H. DO concentration is >20 mg/L
A. User cell constant cal K is <4.9
B. DO current too low to calibrate
In all cases, check calibration values and
procedures; check advanced setup settings.
Main display flashes “off”
8. Main Display reads “OVEr”
(Secondary display reads “ovr”)
(Secondary display reads “udr”)
9. Main display reads “Undr”
10. Main display reads “rErr”
A. Reading exceeds user selected
manual range.
11. Main display reads “PErr”
A. User cell constant cal K is 0.0
B. Incorrect sequence of keystrokes.
If each of these are set correctly,
return instrument for service.
A.
Recalibrate instrument using known
good conductivity standard.
Follow cell cleaning procedure in
the Maintenance section.
B. Replace membrane, clean probe
A. Use the mode key to select a higher or
lower manual range, or set system to
autoranging.
A. See “Advanced Setup” section.
B. Refer to manual section for step by step
instruction for the function you are
attempting.
YSI, Incorporated
Model 85
33
Troubleshooting
SYMPTOM
12. Main display reads “LErr”
Section 12
POSSIBLE CAUSE
13. Main display reads “Err”
(Secondary display reads “ra”)
A. In temperature compensated
conductivity mode, temperature
exceeds the values computed using
user defined temperature coefficient
and/or reference temperature.
B. In cell constant cal mode, temperature
exceeds the values computed using
user defined temperature coefficient
and/or reference temperature.
A. System has failed its RAM test check
procedure.
14. Main display reads “Err”
(Secondary display reads “ro”)
A. System has failed its ROM test check
procedure.
15. Secondary display reads “rEr”
A. Temperature jumper is set to °F and
reading is >199.9°F but <203°F.
A. EEPROM has failed to respond in
time.
A. Meter is in recall mode.
16. Main display reads “FAIL”
(Secondary display reads “eep”)
17. Readings on main display don’t
change
YSI, Incorporated
Model 85
ACTION
A. & B. Adjust user defined tempco or
reference temperature. (pg. 10)
A. Turn instrument OFF and back ON
again.
B. Return the system for service (pg. 26)
A. Turn instrument OFF and back ON
again.
B. Return the system for service (pg. 26)
A. Return the system for service. (pg. 26)
A. Return the system for service. (pg. 26)
A. Press MODE button to return to Normal
Operation (pg. 12)
34
SECTION 13 WARRANTY AND REPAIR
YSI Model 85 Handheld Meters are warranted for two years from date of purchase by the end user against
defects in materials and workmanship. YSI Model 85 probes and cables are warranted for one year from date
of purchase by the end user against defects in material and workmanship. Within the warranty period, YSI
will repair or replace, at its sole discretion, free of charge, any product that YSI determines to be covered by
this warranty.
To exercise this warranty, write or call your local YSI representative, or contact YSI Customer Service in
Yellow Springs, Ohio. Send the product and proof of purchase, transportation prepaid, to the Authorized
Service Center selected by YSI. Repair or replacement will be made and the product returned, transportation
prepaid. Repaired or replaced products are warranted for the balance of the original warranty period, or at least
90 days from date of repair or replacement.
Limitation of Warranty
This Warranty does not apply to any YSI product damage or failure caused by (i) failure to install, operate or
use the product in accordance with YSI’s written instructions, (ii) abuse or misuse of the product, (iii) failure
to maintain the product in accordance with YSI’s written instructions or standard industry procedure, (iv) any
improper repairs to the product, (v) use by you of defective or improper components or parts in servicing or
repairing the product, or (vi) modification of the product in any way not expressly authorized by YSI.
THIS WARRANTY IS IN LIEU OF ALL OTHER WARRANTIES, EXPRESSED OR IMPLIED, INCLUDING ANY
WARRANTY OF MERCHANTABILITY OR FITNESS FOR A PARTICULAR PURPOSE. YSI’s LIABILITY
UNDER THIS WARRANTY IS LIMITED TO REPAIR OR REPLACEMENT OF THE PRODUCT, AND THIS
SHALL BE YOUR SOLE AND EXCLUSIVE REMEDY FOR ANY DEFECTIVE PRODUCT COVERED BY THIS
WARRANTY. IN NO EVENT SHALL YSI BE LIABLE FOR ANY SPECIAL, INDIRECT, INCIDENTAL OR
CONSEQUENTIAL DAMAGES RESULTING FROM ANY DEFECTIVE PRODUCT COVERED BY THIS
WARRANTY.
YSI, Incorporated
Model 85
35
Warranty and Repair
Section 13
AUTHORIZED U.S. SERVICE CENTERS
Please visit www.ysi.com or contact YSI Technical Support for the nearest authorized service center.
YSI Incorporated • Technical Support • Phone: +1 937 767-7241 • 800 897-4151 • Fax: 937 767-1058 • Email: [email protected]
YSI, Incorporated
Model 85
36
Warranty and Repair
Section 13
CLEANING INSTRUCTIONS
NOTE: Before they can be serviced, equipment exposed to biological, radioactive, or toxic
materials must be cleaned and disinfected. Biological contamination is presumed for any
instrument, probe, or other device that has been used with body fluids or tissues, or with
wastewater. Radioactive contamination is presumed for any instrument, probe or other device
that has been used near any radioactive source.
If an instrument, probe, or other part is returned or presented for service without a Cleaning
Certificate, and if in our opinion it represents a potential biological or radioactive hazard, our
service personnel reserve the right to withhold service until appropriate cleaning,
decontamination, and certification has been completed. We will contact the sender for
instructions as to the disposition of the equipment. Disposition costs will be the responsibility of
the sender.
When service is required, either at the user's facility or at YSI, the following steps must be taken
to insure the safety of our service personnel.
1. In a manner appropriate to each device, decontaminate all exposed surfaces, including any
containers. 70% isopropyl alcohol or a solution of 1/4 cup bleach to 1-gallon tap water are
suitable for most disinfecting. Instruments used with wastewater may be disinfected with .5%
Lysol if this is more convenient to the user.
2. The user shall take normal precautions to prevent radioactive contamination and must use
appropriate decontamination procedures should exposure occur.
3. If exposure has occurred, the customer must certify that decontamination has been
accomplished and that no radioactivity is detectable by survey equipment.
4. Any product being returned to the YSI Repair Center, should be packed securely to prevent
damage.
5. Cleaning must be completed and certified on any product before returning it to YSI.
YSI, Incorporated
Model 85
37
Warranty and Repair
Section 13
PACKING INSTRUCTIONS
1. Clean and decontaminate items to insure the safety of the handler.
2. Complete and include the Cleaning Certificate.
3. Place the product in a plastic bag to keep out dirt and packing material.
4. Use a large carton, preferably the original, and surround the product completely with packing
material.
5. Insure for the replacement value of the product.
Cleaning Certificate
Organization
Department
Address
City
State
Country
Zip
Phone
Model No. of Device
Lot Number
Contaminant (if known)
Cleaning Agent(s) used
Radioactive Decontamination Certified?
(Answer only if there has been radioactive exposure)
Yes
No
Cleaning Certified By
Name
YSI, Incorporated
Date
Model 85
38
Warranty and Repair
YSI, Incorporated
Section 13
Model 85
39
SECTION 14
ACCESSORIES AND REPLACEMENT PARTS
The following parts and accessories are available from YSI or any Franchise Dealer authorized by
YSI.
YSI ORDER NUMBER
DESCRIPTION
YSI 5906
Replacement Membrane Cap Kit ( 6 each )
YSI 5238
Probe Reconditioning Kit
YSI 3161
Conductivity Calibration Solution 1,000 µ/cm (1 Quart)
YSI 3163
Conductivity Calibration Solution 10,000 µ/cm (1 Quart)
YSI 3165
Conductivity Calibration Solution 100,000 µ/cm (1 Quart)
YSI 3167
Conductivity Calibration Solution 1,000 µ/cm (8 pints)
YSI 3168
Conductivity Calibration Solution 10,000 µ/cm (8 pints)
YSI 3169
Conductivity Calibration Solution 50,000 µ/cm (8 pints)
YSI 5520
Carrying Case
YSI 118510
Replacement Probe & Cable Assembly (10 feet)
YSI 118522
Replacement Probe & Cable Assembly (25 feet)
YSI 118527
Replacement Probe & Cable Assembly (50 feet)
YSI 118519
Replacement Probe and Cable Assembly (100 feet)
YSI 038501
Replacement Front Case Cover
YSI 055242
Replacement Rear Case Cover
YSI 055244
Replacement Battery Cover Kit
YSI 055204
Replacement Case Gasket and Screw
YSI 055219
Storage Chamber Sponge
YSI 030156
Main Board Assembly
YSI 038213
Replacement Electrode Cleaning Brush
YSI, Incorporated
Model 85
40
Accessories and Replacements
YSI, Incorporated
Section 14
Model 85
41
APPENDIX A SPECIFICATIONS
Operating Environment
Medium: fresh, sea, or polluted water and most other liquid solutions.
Temperature: -5 to +65 °C
Depth: 0 to 10, 0 to 25, 0 to 50, or 0 to 100 feet (depending on cable length)
Storage Temperature: -10 to +50 °C
Material: ABS, Stainless Steel, and other materials
Dimensions:
Height:
Thickness:
Width:
Weight:
Display:
9.5 inches
2.2 inches
3.5 inches max.
1.7 pounds (w/ 10’ cable)
2.3”W x 1.5”L
(24.13 cm)
(5.6 cm)
(8.89 cm)
(.77 kg)
(5.8cm W x 3.8cm L)
Power: 9 VDC -6 AA-size Alkaline Batteries (included)
Approximately 100 hours operation from each new set of batteries
Water Tightness: Meets or exceeds IP65 standards
Extensive testing of the YSI Model 85 indicates the following typical performance:
Measurement
Conductivity
Salinity
Temperature
Dissolved Oxygen
Range
Resolution
0 to 499.9 µS/cm
0 to 4999 µS/cm
0 to 49.99 mS/cm
0 to 200.0 mS/cm
0 to 80 ppt
-5 to +65 °C
0 to 200 % Air Sat.
0 to 20 mg/L
0.1 µS/cm
1.0 µS/cm
.01 mS/cm
0.1 mS/cm
.1 ppt
0.1 °C
0.1% Air Saturation
0.01 mg/L
Accuracy
± .5% FS
± .5% FS
± .5% FS
± .5% FS
± 2%, or ± 0.1 ppt
± 0.1 °C (±1 lsd)
± 2% Air Saturation
± 0.3 mg/L
Adjustable Conductivity Reference Temperature: 15°C to 25°C
Adjustable Temperature Compensation Factor for Conductivity: 0% to 4%
Temperature Compensation: Automatic
Range: Autoranging for Dissolved Oxygen
User selected or Autoranging for Conductivity
YSI, Incorporated
Model 85
42
Specifications
YSI, Incorporated
Appendix A
Model 85
43
APPENDIX B - TEMPERATURE CORRECTION DATA
Temperature Correction Data for Typical Solutions
A. Potassium Chloride** (KCl)
Concentration: 1 x 10⁻¹ mole/liter
Concentration: 1 mole/liter
C
mS/cm
%/ C (to 25 C)
0
5
10
15
20
25
65.10
73.89
82.97
92.33
101.97
111.90
1.67
1.70
1.72
1.75
1.77
1.80
C
mS/cm
%/ C (to 25 C)
0
5
10
15
20
25
30
35
37.5
40
45
50
7.13
8.22
9.34
10.48
11.65
12.86
14.10
15.38
16.04
16.70
18.05
19.43
1.78
1.80
1.83
1.85
1.88
1.90
1.93
1.96
1.98
1.99
2.02
2.04
Concentration: 1 x 10⁻² mole/liter
Concentration: 1 x 10⁻³ mole/liter
C
mS/cm
%/ C (to 25 C)
0
5
10
15
20
25
30
35
37.5
40
45
50
0.773
0.892
1.015
1.143
1.275
1.412
1.553
1.697
1.771
1.845
1.997
2.151
1.81
1.84
1.87
1.90
1.93
1.96
1.99
2.02
2.03
2.05
2.07
2.09
C
mS/cm
%/ C (to 25 C)
0
5
10
15
20
25
30
35
37.5
40
45
50
0.080
0.092
0.105
0.119
0.133
0.147
0.162
0.178
0.186
0.194
0.210
0.226
1.84
1.88
1.92
1.96
1.99
2.02
2.05
2.07
2.08
2.09
2.11
2.13
** Charts developed by interpolating data from International Critical Tables, Vol. 6, pp. 229-253, McGraw-Hill Book Co., NY.
YSI, Incorporated
Model 85
44
Temperature Correction Data
Appendix B
B. Sodium Chloride* (NaCl)
Saturated solutions at all temperatures
Concentration: 0.5 mole/liter
C
mS/cm
%/ C (to 25 C)
0
5
10
15
20
25
30
134.50
155.55
177.90
201.40
225.92
251.30
277.40
1.86
1.91
1.95
1.99
2.02
2.05
2.08
C
mS/cm
%/ C (to 25 C)
0
5
10
15
20
25
30
35
37.5
40
45
50
25.90
29.64
33.61
37.79
42.14
46.65
51.28
56.01
58.40
60.81
65.65
70.50
1.78
1.82
1.86
1.90
1.93
1.96
1.99
2.01
2.02
2.02
2.04
2.05
Concentration: 1 x 10⁻¹ mole/liter
Concentration: 1 x 10⁻² mole/liter
C
mS/cm
%/ C (to 25 C)
0
5
10
15
20
25
30
35
37.5
40
45
50
5.77
6.65
7.58
8.57
9.60
10.66
11.75
12.86
13.42
13.99
15.14
16.30
1.83
1.88
1.92
1.96
1.99
2.02
2.04
2.06
2.07
2.08
2.10
2.12
C
mS/cm
%/ C (to 25 C)
0
5
10
15
20
25
30
35
37.5
40
45
50
0.632
0.731
0.836
0.948
1.064
1.186
1.312
1.442
1.508
1.575
1.711
1.850
1.87
1.92
1.97
2.01
2.05
2.09
2.12
2.16
2.17
2.19
2.21
2.24
Concentration: 1 x 10⁻³ mole/liter
C
mS/cm
%/ C (to 25 C)
0
5
10
15
20
25
30
35
37.5
40
45
50
0.066
0.076
0.087
0.099
0.111
0.124
0.137
0.151
0.158
0.165
0.180
0.195
1.88
1.93
1.98
2.02
2.07
2.11
2.15
2.19
2.20
2.22
2.25
2.29
* Charts developed by interpolating data from the CRC Handbook of Chemistry and Physics, 42nd ed., p. 2606, The Chemical Rubber Company, Cleveland.
YSI, Incorporated
Model 85
45
Temperature Correction Data
Appendix B
C. Lithium Chloride* (LiCl)
Concentration: 1 x 10⁻¹ mole/liter
Concentration: 1 mole/liter
C
mS/cm
%/ C (to 25 C)
0
5
10
15
20
25
30
35
37.5
40
45
50
39.85
46.01
52.42
59.07
65.97
73.10
80.47
88.08
91.97
95.92
103.99
112.30
1.82
1.85
1.89
1.92
1.95
1.98
2.02
2.05
2.07
2.08
2.11
2.15
C
mS/cm
%/ C (to 25 C)
0
5
10
15
20
25
30
35
37.5
40
45
50
5.07
5.98
6.87
7.75
8.62
9.50
10.40
11.31
11.78
12.26
13.26
14.30
1.87
1.85
1.85
1.85
1.85
1.86
1.88
1.91
1.92
1.94
1.98
2.02
Concentration: 1 x 10⁻² mole/liter
Concentration: 1 x 10⁻³ mole/liter
C
mS/cm
%/ C (to 25 C)
0
5
10
15
20
25
30
35
37.5
40
45
50
0.567
0.659
0.755
0.856
0.961
1.070
1.183
1.301
1.362
1.423
1.549
1.680
1.88
1.92
1.96
2.00
2.04
2.08
2.12
2.16
2.18
2.20
2.24
2.28
C
mS/cm
%/ C (to 25 C)
0
5
10
15
20
25
30
35
37.5
40
45
50
0.059
0.068
0.078
0.089
0.101
0.114
0.127
0.140
0.147
0.154
0.166
0.178
1.93
2.03
2.12
2.19
2.25
2.28
2.31
2.32
2.32
2.31
2.29
2.25
D. Potassium Nitrate** (KNO3)
Concentration: 1 x 10⁻¹ mole/liter
Concentration: 1 x 10⁻² mole/liter
C
mS/cm
%/ C (to 25 C)
0
5
10
15
20
25
30
35
37.5
40
45
50
6.68
7.71
8.75
9.81
10.90
12.01
13.15
14.32
14.92
15.52
16.75
18.00
1.78
1.79
1.81
1.83
1.85
1.87
1.90
1.92
1.94
1.95
1.97
2.00
C
mS/cm
%/ C (to 25 C)
0
5
10
15
20
25
30
35
37.5
40
45
50
0.756
0.868
0.984
1.105
1.229
1.357
1.488
1.622
1.690
1.759
1.898
2.040
1.77
1.80
1.83
1.86
1.88
1.90
1.93
1.95
1.96
1.97
1.99
2.01
* Charts developed by interpolating data from the CRC Handbook of Chemistry and Physics, 42nd ed., p. 2606, The Chemical Rubber Company, Cleveland.
** Charts developed by interpolating data from International Critical Tables, Vol. 6, pp. 229-253, McGraw-Hill Book Co., NY.
YSI, Incorporated
Model 85
46
Temperature Correction Data
Appendix B
E. Ammonium Chloride* (NH4Cl)
Concentration: 1 x 10⁻¹ mole/liter
Concentration: 1 mole/liter
C
mS/cm
%/ C (to 25 C)
0
5
10
15
20
25
64.10
74.36
83.77
92.35
100.10
107.00
1.60
1.53
1.45
1.37
1.29
1.21
C
mS/cm
%/ C (to 25 C)
0
5
10
15
20
25
30
35
37.5
40
45
50
6.96
7.98
9.09
10.27
11.50
12.78
14.09
15.43
16.10
16.78
18.12
19.45
1.82
1.88
1.93
1.97
2.00
2.03
2.06
2.07
2.08
2.08
2.09
2.09
Concentration: 1 x 10⁻² mole/liter
Concentration: 1 x 10⁻³ mole/liter
C
mS/cm
%/ C (to 25 C)
0
5
10
15
20
25
30
35
37.5
40
45
50
0.764
0.889
1.015
1.144
1.277
1.414
1.557
1.706
1.782
1.860
2.020
2.186
1.84
1.86
1.88
1.91
1.94
1.97
2.02
2.06
2.08
2.10
2.14
2.18
C
mS/cm
%/ C (to 25 C)
0
5
10
15
20
25
30
35
37.5
40
45
50
0.078
0.092
0.105
0.119
0.133
0.148
0.162
0.178
0.186
0.194
0.210
0.227
1.88
1.90
1.91
1.93
1.95
1.98
2.01
2.04
2.06
2.07
2.11
2.15
* Charts developed by interpolating data from the CRC Handbook of Chemistry and Physics, 42nd ed., p. 2606, The Chemical Rubber Company, Cleveland.
YSI, Incorporated
Model 85
47
APPENDIX C REQUIRED NOTICE
The Federal Communications Commission defines this product as a computing device and requires
the following notice:
This equipment generates and uses radio frequency energy and if not installed and used properly,
may cause interference to radio and television reception. There is no guarantee that interference will
not occur in a particular installation. If this equipment does cause interference to radio or television
reception, which can be determined by turning the equipment off and on, the user is encouraged to
try to correct the interference by one or more of the following measures:
•
•
•
•
re-orient the receiving antenna
relocate the computer with respect to the receiver
move the computer away from the receiver
plug the computer into a different outlet so that the computer and receiver are on
different branch circuits.
If necessary, the user should consult the dealer or an experienced radio/television technician for
additional suggestions. The user may find the following booklet, prepared by the Federal
Communications Commission, helpful: "How to Identify and Resolve Radio-TV Interference
Problems." This booklet is available from the U.S. Government Printing Office, Washington, D.C.
20402, Stock No. 0004-000-00345-4.
YSI, Incorporated
Model 85
48
Required Notice
YSI, Incorporated
Appendix C
Model 85
49
APPENDIX D CONVERSION CHART
TO CONVERT FROM
TO
EQUATION
Feet
Meters
Multiply by 0.3048
Meters
Feet
Multiply by 3.2808399
Degrees Celsius
Degrees Fahrenheit
(9/5
Degrees Fahrenheit
Degrees Celsius
5/9 (oF-32)
Milligrams per liter (mg/l)
Parts per million (ppm)
Multiply by 1
YSI, Incorporated
Model 85
o
C)+32
50
Conversion Chart
YSI, Incorporated
Appendix D
Model 85
51
APPENDIX E OXYGEN SOLUBILITY TABLE
Table A: Solubility of Oxygen in mg/l in Water Exposed to Water-Saturated Air at 760 mm Hg Pressure.
Salinity = Measure of quantity of dissolved salts in water.
Chlorinity = Measure of chloride content, by mass, of water.
S(0/00) = 1.80655 x Chlorinity (0/00)
Temp
o
C
Chlorinity:0
Salinity:0
5.0 ppt
9.0 ppt
10.0 ppt
18.1 ppt
15.0 ppt
27.1 ppt
20.0 ppt
36.1 ppt
25.0 ppt
45.2 ppt
0.0
14.62
13.73
12.89
12.10
11.36
10.66
1.0
14.22
13.36
12.55
11.78
11.07
10.39
2.0
13.83
13.00
12.22
11.48
10.79
10.14
3.0
13.46
12.66
11.91
11.20
10.53
9.90
4.0
13.11
12.34
11.61
10.92
10.27
9.66
5.0
12.77
12.02
11.32
10.66
10.03
9.44
6.0
12.45
11.73
11.05
10.40
9.80
9.23
7.0
12.14
11.44
10.78
10.16
9.58
9.02
8.0
11.84
11.17
10.53
9.93
9.36
8.83
9.0
11.56
10.91
10.29
9.71
9.16
8.64
10.0
11.29
10.66
10.06
9.49
8.96
8.45
11.0
11.03
10.42
9.84
9.29
8.77
8.28
12.0
10.78
10.18
9.62
9.09
8.59
8.11
13.0
10.54
9.96
9.42
8.90
8.41
7.95
14.0
10.31
9.75
9.22
8.72
8.24
7.79
15.0
10.08
9.54
9.03
8.54
8.08
7.64
16.0
9.87
9.34
8.84
8.37
7.92
7.50
17.0
9.67
9.15
8.67
8.21
7.77
7.36
18.0
9.47
8.97
8.50
8.05
7.62
7.22
19.0
9.28
8.79
8.33
7.90
7.48
7.09
20.0
9.09
8.62
8.17
7.75
7.35
6.96
21.0
8.92
8.46
8.02
7.61
7.21
6.84
22.0
8.74
8.30
7.87
7.47
7.09
6.72
23.0
8.58
8.14
7.73
7.34
6.96
6.61
YSI, Incorporated
Model 85
52
Oxygen Solubility Table
Appendix E
Temp
o
C
Chlorinity:0
Salinity:0
5.0 ppt
9.0 ppt
10.0 ppt
18.1 ppt
15.0 ppt
27.1 ppt
20.0 ppt
36.1 ppt
25.0 ppt
45.2 ppt
24.0
8.42
7.99
7.59
7.21
6.84
6.50
25.0
8.26
7.85
7.46
7.08
6.72
6.39
26.0
8.11
7.71
7.33
6.96
6.62
6.28
27.0
7.97
7.58
7.20
6.85
6.51
6.18
28.0
7.83
7.44
7.08
6.73
6.40
6.09
29.0
7.69
7.32
6.96
6.62
6.30
5.99
30.0
7.56
7.19
6.85
6.51
6.20
5.90
31.0
7.43
7.07
6.73
6.41
6.10
5.81
32.0
7.31
6.96
6.62
6.31
6.01
5.72
33.0
7.18
6.84
6.52
6.21
5.91
5.63
34.0
7.07
6.73
6.42
6.11
5.82
5.55
35.0
6.95
6.62
6.31
6.02
5.73
5.46
36.0
6.84
3.52
6.22
5.93
5.65
5.38
37.0
6.73
6.42
6.12
5.84
5.56
5.31
38.0
6.62
6.32
6.03
5.75
5.48
5.23
39.0
6.52
6.22
5.98
5.66
5.40
5.15
40.0
6.41
6.12
5.84
5.58
5.32
5.08
41.0
6.31
6.03
5.75
5.49
5.24
5.01
42.0
6.21
5.93
5.67
5.41
5.17
4.93
43.0
6.12
5.84
5.58
5.33
5.09
4.86
44.0
6.02
5.75
5.50
5.25
5.02
4.79
45.0
5.93
5.67
5.41
5.17
4.94
4.72
* This table is provided for your information only. It is NOT required when calibrating the Model
85 in accordance with the instructions outlined in the section entitled Calibration.
YSI, Incorporated
Model 85
53
APPENDIX F CALIBRATION VALUES TABLE
Table A: Calibration values for various atmospheric pressures and altitudes.
Note: This table is for your information only. It is not required for calibration.
Pressure
Inches of Hg
30.23
29.92
29.61
29.33
29.02
28.74
28.43
28.11
27.83
27.52
27.24
26.93
26.61
26.34
26.02
25.75
25.43
25.12
24.84
24.53
24.25
23.94
23.62
23.35
23.03
22.76
22.44
22.13
21.85
21.54
21.26
20.94
20.63
20.35
YSI, Incorporated
Pressure
mm Hg
768
760
752
745
737
730
722
714
707
699
692
684
676
669
661
654
646
638
631
623
616
608
600
593
585
578
570
562
555
547
540
532
524
517
Pressure
kPA
102.3
101.3
100.3
99.3
98.3
97.3
96.3
95.2
94.2
93.2
92.2
91.2
90.2
89.2
88.2
87.1
86.1
85.1
84.1
83.1
82.1
81.1
80.0
79.0
78.0
77.0
76.0
75.0
74.0
73.0
71.9
70.9
69.9
68.9
Model 85
Altitude
in feet
-276
0
278
558
841
1126
1413
1703
1995
2290
2587
2887
3190
3496
3804
4115
4430
4747
5067
5391
5717
6047
6381
6717
7058
7401
7749
8100
8455
8815
9178
9545
9917
10293
Altitude
in meters
-84
0
85
170
256
343
431
519
608
698
789
880
972
1066
1160
1254
1350
1447
1544
1643
1743
1843
1945
2047
2151
2256
2362
2469
2577
2687
2797
2909
3023
3137
Calibration
Value in %
101
100
99
98
97
96
95
94
93
92
91
90
89
88
87
86
85
84
83
82
81
80
79
78
77
76
75
74
73
72
71
70
69
68
54
Calibration Values Table
YSI, Incorporated
Appendix F
Model 85
55
1700/1725 Brannum Lane
Yellow Springs, Ohio 45387
+1 937 767-7241
800 765-4974 (US)
FAX (937) 767-9353
E-mail: [email protected]
Website: www.YSI.com
ITEM # 038503
DRW # A38503 - Web
Revision E - Web
November 1998
Operations Manual
YSI pH100
Portable
pH, mV and
Temperature
Instrument
•
•
•
•
•
English
Français
Español
Deutsch
Italiano
Pure
Data for a
Healthy
Planet.®
WARRANTY
The YSI pH100 Instrument is warranted for one year from date of purchase by the end user against
defects in materials and workmanship. YSI pH100 probes and cables are warranted for six months
from date of purchase by the end user against defects in material and workmanship. Within the
warranty period, YSI will repair or replace, at its sole discretion, free of charge, any product that YSI
determines to be covered by this warranty.
To exercise this warranty, write or call your local YSI representative, or contact YSI Customer Service
in Yellow Springs, Ohio. Send the product and proof of purchase, transportation prepaid, to the
Authorized Service Center selected by YSI. Repair or replacement will be made and the product
returned, transportation prepaid. Repaired or replaced products are warranted for the balance of the
original warranty period, or at least 90 days from date of repair or replacement.
Limitation of Warranty
This Warranty does not apply to any YSI product damage or failure caused by: (i) failure to install,
operate or use the product in accordance with YSI's written instructions; (ii) abuse or misuse of the
product; (iii) failure to maintain the product in accordance with YSI's written instructions or standard
industry procedure; (iv) any improper repairs to the product; (v) use by you of defective or improper
components or parts in servicing or repairing the product; or (vi) modification of the product in any
way not expressly authorized by YSI.
THIS WARRANTY IS IN LIEU OF ALL OTHER WARRANTIES, EXPRESSED OR IMPLIED,
INCLUDING ANY WARRANTY OF MERCHANTABILITY OR FITNESS FOR A PARTICULAR
PURPOSE. YSI's LIABILITY UNDER THIS WARRANTY IS LIMITED TO REPAIR OR
REPLACEMENT OF THE PRODUCT, AND THIS SHALL BE YOUR SOLE AND EXCLUSIVE
REMEDY FOR ANY DEFECTIVE PRODUCT COVERED BY THIS WARRANTY. IN NO
EVENT SHALL YSI BE LIABLE FOR ANY SPECIAL, INDIRECT, INCIDENTAL OR
CONSEQUENTIAL DAMAGES RESULTING FROM ANY DEFECTIVE PRODUCT COVERED
BY THIS WARRANTY.
CONTACT INFORMATION
YSI Environmental, Inc. • 1725 Brannum Lane • Yellow Springs OH, 45387
800-897-4151 • 937-767-7241 • Fax: 937-767-1058
Email: [email protected] • Website: www.ysi.com/environmental
1
CONTENTS
WARRANTY .................................................................................................... 1
CONTACT INFORMATION............................................................................. 1
GENERAL INTRODUCTION........................................................................... 3
INITIAL INSPECTION ..................................................................................... 3
SPLASH RESISTANCE .................................................................................. 3
BATTERY INSTALLATION ............................................................................. 3
KEY FUNCTIONS OF THE MODEL pH100.................................................... 4
THE LCD DISPLAY ......................................................................................... 4
OPERATIONAL PROCEDURES..................................................................... 4
Buffer Table Select..................................................................................... 4
pH Calibration............................................................................................. 5
Using the model pH160 Electrode Simulator ............................................. 5
pH Measurements ...................................................................................... 5
Temperature Measurements ...................................................................... 6
mV Measurements ..................................................................................... 6
TROUBLESHOOTING .................................................................................... 6
SPECIFICATIONS........................................................................................... 7
RECOMMENDED SPARE PARTS LIST......................................................... 7
2
GENERAL INTRODUCTION
The model pH100 is a precision tool that measures pH, mV and temperature. A built-in
microprocessor stores, calculates and compensates for all parameters related to pH
determinations including pH electrode temperature characteristics, electrode slope deviations
and buffer solutions.
This unit has a splash-proof IP65 case. The mechanical touch keys are highly reliable with
tactile and audio feedback. This meter uses one 9V battery. Re-calibration is not required when
power is restored.
The front of the meter has a large LCD that displays pH or mV and temperature simultaneously
along with user prompts and mode indicators. The unit prompts the user through calibration and
measurement procedures.
An AUTOLOCK feature for both pH and mV measurements enables the unit to automatically
sense the end point and "lock" the display to indicate the end point value of a measurement.
The pH100 can also be used in non-AUTOLOCK mode. AUTOLOCK and user prompts help
eliminate most errors in determining pH and mV values, resulting in precise, repeatable, errorfree measurements.
The model pH100 is available with pH, mV, ORP and ATC (Automatic Temperature
Compensation) probes. Other features include electrode offset recognition, electrode slope
recognition, electrode efficiency display, built-in buffer coefficients, automatic or manual
temperature compensation, long battery life, and 50/60 Hz AC noise rejection. This meter is
universal, user-friendly, for field, industrial and laboratory applications.
INITIAL INSPECTION
Carefully unpack the unit and accessories, and inspect for shipping damages. Compare
received parts with materials listed on the packing list. Notify YSI immediately of any damage or
missing parts. Save all packing materials until satisfactory operation is confirmed.
SPLASH RESISTANCE
Though the pH100 meter is housed in a watertight case, DO NOT use it underwater. The splashresistant case prevents permanent damage to the unit if accidentally dropped into non-corrosive
solutions. Follow these steps immediately if the unit is immersed in any solution:
1.
Rinse unit carefully with distilled water. After rinsing and drying, inspect and clean connectors
to remove all contaminants that may affect probe connections.
2.
Wait for the unit and probe to dry completely before resuming operation.
3.
If the unit does not function correctly after steps 1 and 2, call YSI for possible repair or
replacement (see Warranty).
BATTERY INSTALLATION
An initial display of “BAT” on the LCD indicates approximately one hour
of battery life for unit operation within specifications. Replace battery
when “BAT” appears on the LCD. (See Figure 1.)
To replace battery, remove the two battery cover screws and battery
cover and o-ring. Replace the 9V battery. Replace battery cover and
o-ring (align the o-ring properly to insure a good seal) and fasten the
two battery cover screws for the splash-resistant feature.
3
Figure 1.
Battery Installation
KEY FUNCTIONS OF THE MODEL pH100
1.
: Turns the unit ON or OFF. The pH calibration values are not erased when the unit is
turned off. The unit powers up in the same status as when it was turned off. When the unit
is not in use, turn it off to save battery life. For long term storage, remove the batteries.
2.
MODE: Selects display mode. Press MODE to sequentially display pH-AUTOLOCK , mVAUTOLOCK , pH, and mV. Calibration values are not affected by changing display mode.
3.
STAND and SLOPE Keys: Used for dual-point pH calibration of the unit. Press and hold
STAND while turning on the power to change buffer sets.
4.
∆ and ∇ Keys: Press to enter temperature values in manual (MAN) mode. These keys are
inoperative when operating in ATC mode.
5.
MEA./EFF.: Press to release the unit from AUTOLOCK status when operating in pHAUTOLOCK or mV-AUTOLOCK mode. Press and hold for 5 seconds to display the
electrode efficiency.
6.
ESC: Press to clear the unit when an error signal appears; it clears all calibration values
stored in internal memory. To prevent accidental clearing during normal use, the key does
not respond unless pressed and held for 2 seconds. The key responds only when an error
message displays.
When ESC is pressed, all LCD elements light. After about 2 seconds, the unit enters pHAUTOLOCK mode. “AUTOLOCK” displays and “STAND” begins to flash indicating the
need for calibration. Press ESC only when errors occur that require unit re-calibration.
THE LCD DISPLAY
1.
WAIT: Displays while unit waits for a
stable reading or end point sensing.
2.
BAT: Low battery indicator.
3.
ATC/MAN: “ATC” displays if an ATC
probe is connected. Otherwise, “MAN”
displays.
4.
STAND/SLOPE: “STAND” or “SLOPE”
remains steady if the parameter has
been calibrated. If either one has not
been calibrated, it flashes.
5.
AUTO: Autolock mode indicator.
6.
HOLD: Indicates a reading is frozen during Autolock mode.
7.
EFF%: Displays when the user views electrode efficiency. It is recommended to replace the
electrode when efficiency is less than 75%.
8.
pH/mV : Unit and mode indicators.
9.
Main display for pH, mV and probe efficiency values.
Figure 2. LCD Display
10. °C: Temperature display.
OPERATIONAL PROCEDURES
Buffer Table Select
This unit has two buffer sets: 7.00,4.01,10.01pH and 6.86,4.00,9.18pH. To change the buffer
set, turn off the unit, then press and hold STAND while turning on the unit again. If the unit is
4
uncalibrated and in pH mode, it displays “7.00” if the first set is active, and “6.86” if the second
set is active.
pH Calibration
The pH100 uses a 2-point calibration. The first point must be a 6.86/7.00 buffer, and the second
either a 4.00/4.01 or 9.18/10.01. These buffers can be purchased from a YSI representative.
1.
Turn the unit on. Connect the pH electrode to the BNC connector and the ATC/Temp probe
to the ATC/Temp connector of the unit; “ATC” displays. Press MODE until “pH” displays.
Autolock may be on or off as desired.
2.
AUTOLOCK ON: Place the pH and ATC/temp probes into the first buffer solution (either
7.00 or 6.98). Allow temperature readings to stabilize, then press “STAND” to calibrate. If
AUTOLOCK is off, the first point has been calibrated. If AUTOLOCK is on, “WAIT” flashes
until the unit detects a stable reading. Once the unit calibrates the first point, “STAND”
displays steadily, and “SLOPE” flashes.
NOTE: If no temperature probe is connected, adjust the temperature reading to that of the
first buffer using the ∆ or ∇ keys (0.0 to 60ºC) BEFORE pressing “STAND”.
3.
Rinse the pH and ATC/temp probes in distilled water, then place into the second buffer
solution (either 4.01/4.00 or 10.01/9.18). Allow temperature readings to stabilize, then press
“SLOPE” to calibrate. If AUTOLOCK is off, the second point has been calibrated. If
AUTOLOCK is on, “WAIT” flashes until the unit detects a stable reading. Once the unit
calibrates the second point, both “STAND” and “SLOPE” display steadily.
NOTE: If no temperature probe is connected, adjust the temperature reading to that of the
first buffer using the ∆ or ∇ keys (0.0 to 60ºC) BEFORE pressing “SLOPE”.
4. The unit calculates and compensates for the pH electrode slope deviation corresponding to
the values of the two calibration buffers. The unit is now dual-point calibrated and ready for
measurements. After calibration, press and hold MEA. /EFF. for about 5 seconds to display
the new electrode efficiency.
Using the model pH160 Electrode Simulator
The model pH160 Electrode Simulator can be used to confirm proper instrument calibration. To
use the simulator:
1. Install the 9V battery provided.
2.
Attach the pH160 to the pH100. Turn both units on. The pH160 has a small switch to the
right of the pH buttons.
3.
In pH measurement mode, press one of the pH buffer simulator buttons on the pH160. The
corresponding pH value should appear on both screens.
Note: Calibration with the pH simulator calibrates only the instrument - NOT the instrument and
probe. For best accuracy, calibrate the pH instrument and probe together using buffer solutions.
pH Measurements
To take pH measurements, “STAND” and “SLOPE” must display steadily, indicating the unit is
dual-point calibrated and ready for measurements. If “STAND” and “SLOPE” are blinking,
perform a pH calibration before taking measurements.
1.
Press MODE to enter pH mode with AUTOLOCK on or off as desired. For inherently
unstable samples, the unit will not AUTOLOCK. Turn AUTOLOCK off in this case.
2. Rinse the pH electrode and/or ATC/temp probe with distilled water and immerse in the
sample to be measured. Remove any air bubbles trapped around the probe by shaking or
stirring the probe. Allow the pH and/or temperature to stabilize. If no ATC/temp probe is
5
connected, “MAN” displays, indicating manual temperature compensation. Set unit to
display the sample temperature by pressing the ∆ and ∇ keys (-10.0 to 120°C). If an
ATC/temp probe is connected “ATC” displays along with the sample temperature.
3. If AUTOLOCK is off, the pH value of the sample displays on the screen. If both pH and
temperature readings are stable, take a reading. If AUTOLOCK is on, press MEA./EFF.
“WAIT” flashes until the unit determines a stable pH reading.
Temperature Measurements
The model pH100 can measure temperature independently with the ATC/Temp probe without
using the pH electrode. Place the ATC/Temp probe in the media to be measured. The
measured temperature displays.
mV Measurements
1.
Connect the optional combination mV electrode to the unit. Press MODE to enter mV mode
with AUTOLOCK on or off as desired. For inherently unstable samples, the unit will not
AUTOLOCK. Use mV mode with AUTOLOCK off in this case.
2.
Rinse electrode with distilled water and immerse it in sample to be measured. If AUTOLOCK
is off, the mV value of the sample will be displayed on the screen. If AUTOLOCK is on, press
MEA./EFF. “WAIT” flashes until the unit determines a stable mV reading.
TROUBLESHOOTING
MAIN
DISPLAY
Er 1
Er 2
POSSIBLE CAUSE
CORRECTIVE ACTION
• pH electrode offset is greater/less than
+/-1.5 pH.
• Replace the buffer and/or the
pH electrode. Press ESC.
• STAND was pressed before the
electrode and ATC/Temp probe settle to
within ±1.5 pH of the buffer value.
• Allow sufficient time for the
electrode and ATC/Temp probe
to stabilize.
• pH electrode is faulty
• Return for service.
• pH electrode slope is off by more than
30% of ideal slope.
• Check that the correct buffer is
used and that the electrode
slope is not off by more than
30% from the theoretical slope.
• SLOPE was pressed before the
electrode and ATC/Temp probe settled
to within 30% of the buffer value.
• Buffer 4.00, 4.01, 9.18 or 10.01 is not
correct.
• Allow sufficient time for the
electrode and ATC/Temp probe
to stabilize.
• Replace the buffer and/or the
pH electrode. Press ESC.
• Return for service.
Er 3
• Temperature is out of the 0.0 to 60.0 °C
range.
• Bring the buffer temperature
within range.
• Return for service.
OvEr/Undr
• Measured pH is out of the 16.00/-2.00
pH range.
• Measured mV is out of the 1250/-2000
mV range.
• Measured temperature is out of the
-10/120 °C range.
6
• Bring the out of range unit into
the correct measuring range.
• If units are within proper range,
return product for service.
SPECIFICATIONS
Display
pH
mV
Temperature °C
Range
-2.00 to 16.00 pH
-1999 to 1250 mV
-10.0 to 120 °C
Accuracy
±0.1%, ±2 lsd
±0.1%, ±1 lsd
±0.5 °C
Resolution
0.01 pH
1 mV
0.1 °C
pH Temp Compensation
AUTO/MANual -10.0 to 120.0 °C
pH Buffer Recognition
(4.01, 7.00 & 10.01) or (4.00, 6.86 & 9.18)
pH Buffer Calibration Temp. Range
0 to 60 °C
pH Electrode Offset Recognition
±90mV at pH 7.00 or 6.86
pH Electrode Slope Recognition
±30% at pH 4.00, 4.01, 9.18 or 10.01
Power
One 9V battery
Calibration Back-up
Yes
Audio Feedback
Yes, on all touch keys
Autolock Feature
Yes
Operating Temp. Range
0 to 50 °C
Operating Relative Humidity Range
up to 95%
ATC Probe
Thermistor, 10kΩ / 25 °C
Dimensions (W x D x H )
86 mm x 241 mm x 72 mm (3 in x 9.5 in x 2.8 in)
Weight (batteries included)
430 grams (1 lb)
RECOMMENDED SPARE PARTS LIST
PART #
DESCRIPTION
100-1
1-meter waterproof Y-cable with combo pH/reference junction & ATC
electrodes.
100-4
4-meter waterproof Y-cable with combo pH/reference junction & ATC
electrode.
110-1
pH electrode with 1-meter cable.
115-1
mV electrode with 1-meter cable.
130-1
ATC (temperature) electrode with 1-meter cable.
160
pH Simulator electrode.
180
pH carrying case, hard sided.
405
Instrument carrying case, soft sided.
Item #605367 • Drawing #A605367
Revision A • March 2003
7
GARANTIE
L'appareil YSI pH100 est garanti pour une période d'un an, à compter de la date d'achat par
l'utilisateur final, contre tout défaut matériel et de fabrication. Les sondes et les câbles de l'YSI pH100
sont garantis pour une période de six mois, à compter de la date d'achat par l'utilisateur final, contre
tout défaut matériel et de fabrication. Pendant la période de garantie, YSI s'engage à réparer ou à
remplacer, gratuitement et à sa discrétion, tout produit qu'YSI peut établir comme étant couvert par la
garantie.
Pour faire valoir cette garantie, écrivez ou appelez votre représentant YSI ou contactez le Service
clientèle d'YSI à Yellow Springs, Ohio, États-Unis. Envoyez le produit et son justificatif d'achat en
port payé au Centre de service homologué sélectionné par YSI. La réparation ou le remplacement
seront effectués et le produit vous sera retourné en port payé. Les produits réparés ou remplacés
sont garantis jusqu'à expiration de la période de garantie originale ou pour au moins 90 jours, à
compter de la date de réparation ou de remplacement.
Limitation de garantie
Cette garantie ne s'applique pas aux produits YSI endommagés ou présentant des
dysfonctionnements pour les raisons suivantes : (i) installation, exploitation ou utilisation du produit
d'une façon non conforme aux instructions écrites d'YSI ; (ii) abus ou mésusage du produit ; (iii)
manquement à l'entretien du produit conformément aux instructions écrites d'YSI ou aux procédures
industrielles normales ; (iv) réparation non conforme du produit ; (v) utilisation par vous de pièces ou
de composants défectueux ou non conformes lors de l'entretien ou de la réparation du produit, ou ;
(vi) modification du produit d'une façon non expressément autorisée par YSI.
CETTE GARANTIE REMPLACE TOUTES LES AUTRES GARANTIES, EXPRESSES OU
INDUITES, Y COMPRIS LES GARANTIES DE COMMERCIABILITÉ OU D'ADAPTATION À UN
USAGE PARTICULIER. LA RESPONSABILITÉ D'YSI SELON LES TERMES DE CETTE
GARANTIE SE LIMITE À LA RÉPARATION OU AU REMPLACEMENT DU PRODUIT,
CONSTITUANT VOTRE SEUL ET UNIQUE RECOURS POUR TOUT PRODUIT
DÉFECTUEUX COUVERT PAR CETTE GARANTIE. YSI NE POURRA EN AUCUN CAS
ÊTRE TENU RESPONSABLE DE DOMMAGES SPÉCIAUX, INDIRECTS, ACCIDENTELS OU
CONSÉCUTIFS RÉSULTANT DE L'UTILISATION DE TOUT PRODUIT DÉFECTUEUX
COUVERT PAR CETTE GARANTIE.
COMMENT NOUS CONTACTER
YSI Environmental, Inc. • 1725 Brannum Lane • Yellow Springs OH, 45387, États-Unis
800-897-4151 • 937-767-7241 • Télécopie : 937-767-1058
E-mail : [email protected] • Site Web : www.ysi.com/environmental
1
TABLE DES MATIÈRES
GARANTIE ...................................................................................................... 1
COMMENT NOUS CONTACTER ................................................................... 1
INTRODUCTION GÉNÉRALE ........................................................................ 3
INSPECTION INITIALE ................................................................................... 3
PROTECTION CONTRE LES ÉCLABOUSSURES........................................ 3
INSTALLATION DE LA PILE........................................................................... 4
FONCTIONNALITÉS CLÉS DU MODÈLE pH100 .......................................... 4
ÉCRAN À CRISTAUX LIQUIDES.................................................................... 5
PROCÉDURES D'UTILISATION..................................................................... 5
Sélection du jeu de tampons ...................................................................... 5
Étalonnage du pH....................................................................................... 5
Utilisation du simulateur d'électrode du modèle pH160 ............................. 6
Mesures du pH ........................................................................................... 6
Mesures de température ............................................................................ 7
Mesures de millivoltage.............................................................................. 7
DÉPANNAGE .................................................................................................. 7
SPÉCIFICATIONS........................................................................................... 8
LISTE DES PIÈCES DÉTACHÉES RECOMMANDÉES................................. 9
2
INTRODUCTION GÉNÉRALE
Le modèle pH100 est un instrument de précision mesurant le pH, les mV et la température. Un
microprocesseur incorporé stocke, calcule et compense tous les paramètres relatifs aux
déterminations liées au pH, y compris les caractéristiques de température de l'électrode de
détection du pH, les écarts de pente de l'électrode et les solutions tampons.
L'appareil est doté d'un boîtier de protection contre les éclaboussures conforme à la norme
IP65. Les touches mécaniques sont très fiables et produisent une réaction tactile et sonore. Cet
appareil de mesure utilise une pile de 9 V. Aucun réétalonnage n'est nécessaire lorsque
l'alimentation électrique est rétablie.
L'avant de l'appareil dispose d'un écran à cristaux liquides de grande taille affichant
simultanément les mesures de pH, de millivoltage et de température, ainsi que les invites
destinées à l'utilisateur et les indicateurs de mode. L'appareil émet des invites destinées à
l'utilisateur lors des procédures d'étalonnage et de mesure.
Une fonctionnalité de verrouillage automatique AUTOLOCK, applicable aux mesures de pH et
de millivoltage, permet à l'appareil de détecter automatiquement le point de virage et de
verrouiller l'affichage pour indiquer la valeur du point de virage de la mesure. Le pH100 peut
également être utilisé alors que le mode de verrouillage AUTOLOCK est désactivé. La
fonctionnalité de verrouillage automatique et les invites permettent d'éliminer la plupart des
erreurs de détermination des valeurs de pH et de millivoltage et d'obtenir des mesures
précises, fiables et pouvant être répétées.
Le modèle pH100 est disponible avec des sondes à pH, millivoltage, potentiel redox et
compensation automatique de la température (CAT). Parmi les autres fonctionnalités, on peut
compter la reconnaissance du décalage de l'électrode, la reconnaissance de la pente de
l'électrode, l'affichage de l'efficacité de l'électrode, des coefficients de tampon incorporés, la
compensation automatique ou manuelle de la température, une pile longue durée et un
dispositif d'atténuation du bruit C.A. à 50 ou 60 Hz. Cet appareil est convivial et particulièrement
souple dans les applications sur le terrain, industrielles et en laboratoire.
INSPECTION INITIALE
Déballez soigneusement l'appareil et les accessoires et vérifiez qu'ils n'ont pas été
endommagés lors de l'expédition. Comparez les pièces reçues aux matériaux répertoriés dans
le bordereau d'emballage. Notifiez immédiatement YSI s'il s'avère que des pièces sont
endommagées ou manquantes. Mettez de côté les matériaux d'emballage jusqu'à ce que le
fonctionnement correct de l'appareil soit confirmé.
PROTECTION CONTRE LES ÉCLABOUSSURES
Bien que le modèle pH100 soit enfermé dans un boîtier étanche, NE l'utilisez PAS sous l'eau. Le
boîtier résistant aux éclaboussures prévient les dommages permanents si l'appareil est
accidentellement immergé dans des solutions non corrosives. Suivez immédiatement ces étapes
si l'appareil est immergé dans une solution quelconque :
1.
Rincez soigneusement l'appareil avec de l'eau distillée. Après le rinçage et le séchage,
inspectez et nettoyez les connecteurs en vue d'éliminer tout contaminant pouvant affecter les
connexions de la sonde.
2.
Attendez que l'appareil et la sonde soient parfaitement secs avant de reprendre les
opérations.
3.
Si l'appareil ne fonctionne pas correctement après les étapes 1 et 2, appelez YSI en vue d'une
réparation ou d'un remplacement éventuels (voir la Garantie).
3
INSTALLATION DE LA PILE
Lorsque l'écran à cristaux liquides affiche pour la première fois « BAT »,
il reste environ une heure de fonctionnement sur pile selon les
spécifications. Remplacez la pile lorsque l'indication « BAT » s'affiche
sur l'écran. (Voir Figure 1.)
Pour remplacer la pile, enlevez les deux vis du compartiment ainsi que le
couvercle et le joint torique. Remplacez la pile de 9 V. Replacez le
couvercle et le joint torique (alignez le joint correctement afin
d'assurer une bonne étanchéité) et revissez les deux vis du
compartiment pour conserver une bonne résistance aux
éclaboussures.
Figure 1.
Installation de la pile
FONCTIONNALITÉS CLÉS DU MODÈLE pH100
1.
: Met l'appareil hors ou sous tension. Les valeurs d'étalonnage du pH ne sont pas
effacées lorsque l'appareil est mis hors tension. L'appareil démarre dans le même état que
lorsqu'il a été mis hors tension. Lorsque l'appareil n'est pas utilisé, mettez-le hors tension
pour économiser la pile. Enlevez les piles pour un entreposage prolongé.
2.
MODE : Permet de sélectionner le mode d'affichage. Appuyez plusieurs fois sur MODE
pour afficher successivement pH-AUTOLOCK (verrouillage automatique de la mesure du
pH), Mv-AUTOLOCK (verrouillage automatique de la mesure du millivoltage), pH et mV.
Les valeurs d'étalonnage ne sont pas affectées par le changement de mode d'affichage.
3.
Touches STAND et SLOPE : Utilisées pour l'étalonnage en deux points du pH de
l'appareil. Maintenez la touche STAND enfoncée tout en mettant l'appareil sous tension
pour changer les jeux de tampons.
4.
Touches ∆ et ∇ : Appuyez sur ces touches pour entrer les valeurs de température en
mode manuel (MAN). Ces touches sont inopérantes en mode CAT.
5.
MEA./EFF. : Appuyez sur cette touche pour désactiver le verrouillage automatique lorsque
l'appareil est en mode pH-AUTOLOCK ou mV-AUTOLOCK. Maintenez la touche enfoncée
pendant 5 secondes pour afficher l'efficacité de l'électrode.
6.
ESC : Appuyez sur cette touche pour effacer la mémoire de l'appareil lorsqu'un message
d'erreur apparaît. Toutes les valeurs d'étalonnage stockées en mémoire interne sont
effacées. Afin d'éviter un effacement accidentel lors d'un fonctionnement normal, la touche
doit être maintenue enfoncée pendant 2 secondes pour être active. La touche n'est active
que lorsqu'un message d'erreur est affiché.
Lorsque la touche ESC est enfoncée, tous les éléments de l'écran à cristaux liquide
s'allument. Au bout d'environ 2 secondes, l'appareil se met en mode pH-AUTOLOCK. La
mention « AUTOLOCK » s'affiche et la mention « STAND » commence à clignoter,
indiquant qu'un étalonnage est nécessaire. Appuyez sur la touche ESC uniquement lorsque
surviennent des erreurs nécessitant un réétalonnage.
4
ÉCRAN À CRISTAUX LIQUIDES
1.
WAIT : S'affiche lorsque l'appareil
attend une lecture stable ou la
détection d'un point de virage.
2.
BAT : Indicateur de pile déchargée.
3.
ATC/MAN : La mention « ATC »
s'affiche si une sonde à compensation
automatique de la température est
connectée. Sinon, la mention « MAN »
est affichée.
4.
STAND/SLOPE : Les mentions
Figure 4. Écran à cristaux liquides
« STAND » et « SLOPE » restent
allumées si le paramètre a été étalonné. Si l'un d'entre eux n'a pas été étalonné, la mention
clignote.
5.
AUTO : Indicateur de mode de verrouillage automatique.
6.
HOLD : Indique qu'une lecture est gelée en mode de verrouillage automatique.
7.
EFF% : S'affiche lorsque l'utilisateur vérifie l'efficacité de l'électrode. Nous vous
recommandons de remplacer l'électrode lorsque la valeur d'efficacité est inférieure à 75 %.
8.
pH/mV : Indicateurs d'unité et de mode.
9.
Affichage principal pour les mesures de pH, de millivoltage et d'efficacité de l'électrode.
10. °C : Affichage de la température.
PROCÉDURES D'UTILISATION
Sélection du jeu de tampons
Cet appareil dispose de deux jeux de tampons : 7.00,4.01,10.01pH et 6.86,4.00,9.18pH. Pour
changer de jeu de tampons, mettez l'appareil hors tension, puis maintenez la touche STAND
enfoncée tout en remettant l'appareil sous tension. Si l'appareil n'est pas étalonné et en mode
pH, il affiche « 7.00 » si le premier jeu est actif et « 6.86 » si le deuxième jeu est actif.
Étalonnage du pH
Le modèle pH100 utilise un étalonnage à deux points. Le premier point doit être le tampon
6.86/7.00 et le deuxième point 4.00/4.01 ou 9.18/10.01. Ces tampons peuvent être achetés
chez un représentant YSI.
1.
Mettez l'appareil sous tension. Connectez la sonde pH au connecteur BNC et la sonde
CAT/Temp au connecteur CAT/Temp de l'appareil. La mention « ATC » s'affiche. Appuyez
sur la touche MODE jusqu'à ce que la mention « pH » s'affiche. La fonction de verrouillage
automatique peut être indifféremment activée ou désactivée.
2.
VERROUILAGE AUTOMATIQUE ACTIVÉ : Placez les sondes pH et CAT/Temp dans la
première solution tampon (7,00 ou 6,98). Laissez la lecture de température se stabiliser,
puis appuyez sur la touche « STAND » pour étalonner. Si le verrouillage automatique
(AUTOLOCK) est désactivé, le premier point est étalonné. Si le verrouillage automatique
(AUTOLOCK) est activé, la mention « WAIT » clignote jusqu'à ce que l'appareil détecte
une lecture stable. Une fois que l'appareil a effectué l'étalonnage du premier point, la
mention « STAND » reste allumée et « SLOPE » clignote.
5
REMARQUE : Si aucune sonde de température n'est connectée, réglez la lecture de
température sur celle du premier tampon à l'aide des touches ∆ et ∇ (entre 0,0 et 60 °C)
AVANT d'appuyer sur « STAND ».
3.
Rincez les sondes pH et CAT/Temp avec de l'eau distillée, puis placez-les dans la
deuxième solution tampon (4,01/4,00 ou 10,01/9,18) Laissez la lecture de température se
stabiliser, puis appuyez sur la touche « SLOPE » pour étalonner. Si le verrouillage
automatique (AUTOLOCK) est désactivé, le deuxième point est étalonné. Si le verrouillage
automatique (AUTOLOCK) est activé, la mention « WAIT » clignote jusqu'à ce que
l'appareil détecte une lecture stable. Une fois que l'appareil a effectué l'étalonnage du
deuxième point, les mentions « STAND » et « SLOPE » restent toutes les deux allumées.
REMARQUE : Si aucune sonde de température n'est connectée, réglez la lecture de
température sur celle du premier tampon à l'aide des touches ∆ et ∇ (entre 0,0 et 60 °C)
AVANT d'appuyer sur « SLOPE ».
4. L'appareil calcule et compense l'écart de pente de l'électrode pH correspondant aux valeurs
des deux tampons d'étalonnage. L'appareil est maintenant étalonné en deux points et prêt
à la prise de mesure. Après l'étalonnage, maintenez la touche MEA. /EFF. enfoncée
pendant environ 5 secondes pour afficher la nouvelle efficacité de l'électrode.
Utilisation du simulateur d'électrode du modèle pH160
Le simulateur d'électrode du modèle pH160 peut être utilisé pour confirmer l'étalonnage correct
de l'appareil. Pour utiliser le simulateur :
1. Installez la pile de 9 V fournie.
2.
Connectez le pH160 au pH100. Mettez les deux appareils sous tension. Le pH160 est doté
d'un petit interrupteur, situé à droite des touches de pH.
3.
En mode de mesure du pH, appuyez sur une des touches de simulation de tampon pH du
pH160. La valeur de pH correspondante doit s'afficher sur l'écran des deux appareils.
Remarque : Le simulateur de pH permet seulement d'étalonner l'appareil, PAS l'appareil et la
sonde. Pour obtenir une meilleure précision, étalonnez le pH de l'appareil et de la sonde
simultanément à l'aide de solutions tampons.
Mesures du pH
Pour effectuer des mesures de pH, les mentions « STAND » et « SLOPE » doivent rester
allumées, indiquant que l'appareil a été étalonné en deux points et qu'il est prêt à effectuer des
mesures. Si les mentions « STAND » et « SLOPE » clignotent, effectuez l'étalonnage du pH
avant de prendre des mesures.
1.
Appuyez sur la touche MODE pour entrer en mode pH et activez ou désactivez la fonction
de verrouillage automatique, selon vos besoins. L'appareil ne pourra pas se verrouiller
automatiquement si les caractéristiques inhérentes de l'échantillon mesuré sont instables.
Dans ce cas, désactivez la fonction de verrouillage automatique.
2. Rincez l'électrode à pH et/ou la sonde CAT/Temp avec de l'eau distillée et plongez-la dans
l'échantillon devant être mesuré. Enlevez toute bulle d'air se trouvant autour de la sonde en
secouant ou en remuant la sonde. Laissez la lecture de pH et/ou de température se
stabiliser. Si aucune sonde CAT/Temp n'est connectée, la mention « MAN » s'affiche,
indiquant une compensation de température manuelle. Réglez l'appareil pour qu'il affiche la
température de l'échantillon en appuyant sur les touches ∆ et ∇ (-10,0 à 120 °C). Si une
sonde CAT/Temp est connectée, la mention « ATC » s'affiche avec la température de
l'échantillon.
3. Si la fonction de verrouillage automatique est désactivée, la valeur de pH de l'échantillon
s'affiche sur l'écran. Si les lectures de pH et de température sont toutes les deux stables,
6
notez les valeurs. Si la fonction de verrouillage automatique est activée, appuyez sur
MEA./EFF. La mention « WAIT » s'affiche jusqu'à ce que l'appareil détecte une lecture de
pH stable.
Mesures de température
Le modèle pH100 peut mesurer la température indépendamment avec la sonde CAT/Temp,
sans utiliser l'électrode à pH. Placez la sonde CAT/Temp dans le liquide devant être mesuré.
La mesure de température s'affiche.
Mesures de millivoltage
1.
Connectez l'électrode de millivoltage optionnelle à l'appareil. Appuyez sur la touche MODE
pour entrer en mode de mesure du millivoltage et activez ou désactivez la fonction de
verrouillage automatique, selon vos besoins. L'appareil ne pourra pas se verrouiller
automatiquement si les caractéristiques inhérentes de l'échantillon mesuré sont instables.
Dans ce cas, utilisez le mode de mesure du millivoltage sans la fonction de verrouillage
automatique.
2.
Rincez l'électrode avec de l'eau distillée et immergez-la dans l'échantillon à mesurer. Si la
fonction de verrouillage automatique est désactivée, la valeur de millivoltage de l'échantillon
s'affiche sur l'écran. Si la fonction de verrouillage automatique est activée, appuyez sur
MEA./EFF. La mention « WAIT » s'affiche jusqu'à ce que l'appareil détecte une lecture de
millivoltage stable.
DÉPANNAGE
AFFICHAG
CAUSE POSSIBLE
MESURE CORRECTIVE
E
PRINCIPAL
Er 1
• Le décalage de l'électrode à pH est
supérieur/inférieur à +/- 1,5 pH.
• La touche STAND a été enfoncée avant
que l'électrode et la sonde CAT/Temp
ne se stabilisent dans une fourchette de
±1,5 pH de la valeur du tampon.
• L'électrode à pH est défectueuse.
• Remplacez le tampon et/ou
l'électrode à pH. Appuyez sur
ESC.
• Attendez suffisamment
longtemps pour que l'électrode
et la sonde CAT/Temp se
stabilisent.
• Retournez l'appareil au centre
de service.
Er 2
• La pente de l'électrode à pH présente un
écart de plus de 30 % par rapport à la
pente idéale.
• La touche SLOPE a été enfoncée avant
que l'électrode et la sonde CAT/Temp
ne se stabilisent dans une fourchette de
30 % de la valeur du tampon.
• Le tampon 4,00, 4,01, 9,18 ou 10,01
n'est pas correct.
• Vérifiez que le tampon correct
est utilisé et que la pente de
l'électrode ne diffère pas de
plus de 30 % de la pente
théorique.
• Attendez suffisamment
longtemps pour que l'électrode
et la sonde CAT/Temp se
stabilisent.
• Remplacez le tampon et/ou
l'électrode à pH. Appuyez sur
ESC.
• Retournez l'appareil au centre
de service.
7
Er 3
• La température dépasse les limites de
0,0 à 60 °C.
• Modifiez la température du
tampon pour qu'elle soit dans
les limites.
• Retournez l'appareil au centre
de service.
OvEr/Undr
• Le pH mesuré est hors des limites de
16,00/-2,00 pH.
• Le millivoltage mesuré est hors des
limites de 1250/-2000 mV.
• Les températures mesurées sont hors
des limites de -10/120 C.
• Amenez l'appareil hors limite
dans les limites correctes de la
fourchette de mesure.
• Si les appareils se trouvent
dans la fourchette correcte,
retournez le produit au centre
de service.
SPÉCIFICATIONS
Affichage
pH
mV
Température °C
Fourchette
-2,00 à 16,00 pH
-1999 à 1250 mV
-10,0 à 120 °C
Compensation de la température et
du pH
Précision
±0,1 %, ±2 lsd
±0,1 %, ±1 lsd
±0,5 °C
Résolution
0,01 pH
1 mV
0,1 °C
AUTO/MANuel –10,0 à 120,0 °C
Reconnaissance du tampon à pH
(4,01, 7,00 et 10,01) ou (4,00, 6,86 et 9,18)
Fourchette de températures
d'étalonnage du tampon à pH
0 à 60 °C
Reconnaissance du décalage de
l'électrode à pH
±90 mV à 7,00 ou 6,86 pH
Reconnaissance de la pente de
l'électrode à pH
±30 % à 4,00, 4,01, 9,18 ou 10,01 pH
Alimentation
Une pile de 9 V
Sauvegarde de l'étalonnage
Oui
Touches sonores
Oui, toutes les touches tactiles
Fonction de verrouillage
automatique
Oui
Fourchette de températures de
fonctionnement
0 à 50 °C
Limite d'humidité relative lors du
fonctionnement
Jusqu'à 95 %
Sonde CAT
Thermistor, 10 kΩ / 25 °C
Dimensions (L x P x H)
86 mm x 241 mm x 72 mm
Poids (avec pile)
430 g
8
LISTE DES PIÈCES DÉTACHÉES RECOMMANDÉES
N° RÉF.
DESCRIPTION
100-1
Câble en Y étanche de 1 mètre avec combinaison d'électrodes à
pH/jonction de référence et CAT.
100-4
Câble en Y étanche de 4 mètres avec combinaison d'électrodes à
pH/jonction de référence et CAT.
110-1
Électrode à pH avec câble de 1 mètre.
115-1
Électrode à millivoltage avec câble de 1 mètre.
130-1
Électrode CAT (température) avec câble de 1 mètre.
160
Électrode de simulation de pH.
180
Sacoche de transport de solutions pH, flancs durs.
405
Sacoche de transport de l'appareil, flancs souples.
Article n° 605367 • Dessin n° A605367
Révision A • Mars 2003
9
GARANTÍA
El medidor YSI pH100 tiene un año de garantía contra defectos de materiales y fabricación, contado
a partir de la fecha de compra por el usuario final. Las sondas y cables del medidor pH100 tienen
seis meses de garantía contra defectos de materiales y fabricación, contados a partir de la fecha de
compra por el usuario final. Durante el período de garantía, YSI reparará o reemplazará, según su
criterio, sin coste alguno, cualquier producto que YSI determine que está cubierto por esta garantía.
Para hacer valer esta garantía, escriba o llame al representante local de YSI, o comuníquese con el
Servicio de atención al cliente de YSI en Yellow Springs, Ohio, EE.UU. Envíe el producto y la factura
de compra, con el flete prepagado, al centro de servicio técnico autorizado seleccionado por YSI. Se
realizará la reparación necesaria o el reemplazo y el producto será enviado de vuelta, con el flete
prepagado. Los productos reparados o reemplazados se garantizan durante el resto del período de
la garantía original, o al menos durante 90 días contados a partir de la fecha de reparación o
reemplazo.
Limitación de la garantía
Esta garantía no tendrá validez en caso de daños o fallos en el producto de YSI debido a lo
siguiente: (i) la instalación, funcionamiento o utilización del producto de manera contraria a las
instrucciones escritas suministradas por YSI; (ii) abuso o uso inadecuado del producto; (iii) falta de
mantenimiento del producto de acuerdo con las instrucciones escritas suministradas por YSI o con
los procedimientos estándares de la industria; (iv) cualquier reparación indebida realizada en el
producto; (v) utilización por parte del usuario de componentes o repuestos defectuosos o
inadecuados para el mantenimiento o reparación del producto; o (vi) cualquier modificación del
producto no autorizada de manera expresa por YSI.
ESTA GARANTÍA SE OTORGA EN LUGAR DE CUALQUIER OTRA GARANTÍA, EXPLÍCITA
O IMPLÍCITA, LO QUE INCLUYE TODA GARANTÍA DE COMERCIALIZACIÓN O IDONEIDAD
PARA UN PROPÓSITO ESPECÍFICO. DE CONFORMIDAD CON ESTA GARANTÍA, LA
RESPONSABILIDAD DE YSI SE LIMITA A LA REPARACIÓN O REEMPLAZO DEL
PRODUCTO, LO CUAL SERÁ LA SOLUCIÓN ÚNICA Y EXCLUSIVA QUE TENDRÁ EL
COMPRADOR POR CUALQUIER PRODUCTO DEFECTUOSO CUBIERTO POR ESTA
GARANTÍA. EN NINGÚN CASO YSI SERÁ RESPONSABLE POR NINGÚN DAÑO
CUANTIFICABLE, INDIRECTO, INCIDENTAL O CONSIGUIENTE QUE RESULTARA DE
ALGÚN PRODUCTO DEFECTUOSO CUBIERTO POR ESTA GARANTÍA.
INFORMACIÓN DE CONTACTO
YSI Environmental, Inc. • 1725 Brannum Lane • Yellow Springs OH, 45387. EE.UU.
800-897-4151 • 937-767-7241 • Fax: 937-767-1058
Correo electrónico: [email protected] • Página en Internet: www.ysi.com/environmental
1
CONTENIDO:
GARANTÍA ...................................................................................................... 9
INFORMACIÓN DE CONTACTO.................................................................... 1
INTRODUCCIÓN GENERAL .......................................................................... 3
INSPECCIÓN INICIAL..................................................................................... 3
RESISTENCIA A LAS SALPICADURAS......................................................... 3
INSTALACIÓN DE LA PILA ............................................................................ 4
FUNCIONES PRINCIPALES DEL MODELO pH100 ...................................... 4
PANTALLA DE CRISTAL LÍQUIDO ................................................................ 4
PROCEDIMIENTOS DE FUNCIONAMIENTO................................................ 5
Selección de la tabla de la solución tampón .............................................. 5
Calibración de pH....................................................................................... 5
Uso del simulador de electrodo del modelo pH160.................................... 6
Mediciones de pH....................................................................................... 6
Mediciones de temperatura........................................................................ 6
Mediciones de mV...................................................................................... 6
LOCALIZACIÓN Y RESOLUCIÓN DE PROBLEMAS .................................... 7
ESPECIFICACIONES ..................................................................................... 8
LISTA DE PIEZAS DE RECAMBIO RECOMENDADAS................................. 8
2
INTRODUCCIÓN GENERAL
El modelo pH100 es una herramienta de precisión que mide pH, mV y temperatura. Tiene un
microprocesador integrado que almacena, calcula y realiza la compensación de todos los
parámetros relacionados con la determinación del pH, incluso las características de
temperatura del electrodo de pH, desviaciones de la inclinación del electrodo y soluciones
tampón.
Esta unidad cuenta con un estuche IP65 resistente a salpicaduras. Las teclas de contacto
mecánico son muy confiables y al pulsarlas proporcionan una respuesta táctil y audible. Este
medidor utiliza una pila de 9 voltios. No requiere nueva calibración cuando se restablece la
corriente.
La parte delantera del medidor tiene una pantalla grande de cristal líquido que muestra
simultáneamente el pH o mV y temperatura, junto con las indicaciones para el usuario y los
indicadores del modo de funcionamiento. La unidad orienta al usuario durante los
procedimientos de calibración y medición.
La característica AUTOLOCK (autobloqueo) para las mediciones de pH y mV permite que la
unidad detecte automáticamente el punto terminal y que “fije” la pantalla para indicar el valor
del punto terminal de la medición. El pH100 también se puede utilizar sin el modo AUTOLOCK
(autobloqueo). El modo AUTOLOCK (autobloqueo) y las indicaciones para el usuario ayudan a
eliminar la mayoría de los errores al determinar los valores de pH y mV, lo que da como
resultado medidas precisas, repetibles y sin errores.
El modelo pH100 también está disponible con sondas para pH, mV, ORP y ATC
(compensación automática de temperatura). Entre otras características se incluyen el
reconocimiento de desfase del electrodo, reconocimiento de la inclinación del electrodo,
pantalla de eficiencia del electrodo, coeficientes incorporados de las soluciones tampón,
compensación automática o manual de temperatura, larga duración de la pila y rechazo de
ruido de CA de 50/60 Hz. Este medidor es universal y fácil de usar en aplicaciones in situ,
industriales y de laboratorio.
INSPECCIÓN INICIAL
Saque la unidad de su embalaje con cuidado y verifique que no haya sufrido daños durante el
envío. Compare las piezas recibidas con los materiales enumerados en la lista de embalaje.
Notifique inmediatamente a YSI en caso de que haya piezas faltantes o dañadas. Guarde todos
los materiales de embalaje hasta que confirme que la unidad funciona satisfactoriamente.
RESISTENCIA A LAS SALPICADURAS
Aunque el medidor pH100 se encuentra en un estuche a prueba de agua, NO lo utilice bajo agua.
Este tipo de estuche evita los daños permanentes en la unidad en caso de que caiga
accidentalmente en soluciones no corrosivas. Siga estos pasos de inmediato si la unidad se
inmerge en cualquier solución:
1.
Enjuague la unidad cuidadosamente con agua destilada. Después del enjuague y secado,
revise y limpie los conectores para eliminar cualquier contaminante que pueda afectar las
conexiones de la sonda.
2.
Espere hasta que la unidad y la sonda se sequen por completo antes de reanudar el
funcionamiento.
3.
Si la unidad no funciona correctamente después de realizar los pasos 1 y 2, comuníquese con
YSI para su posible reparación o reemplazo (consulte la garantía).
3
INSTALACIÓN DE LA PILA
En la pantalla de cristal líquido aparecerá el mensaje de “BAT” (pila)
para indicar que queda aproximadamente una hora de carga de la pila
para el funcionamiento de la unidad según las especificaciones.
Cambie la pila cuando aparezca el mensaje “BAT” (pila) en la pantalla
de cristal líquido. (Vea la figura 1).
Para cambiar la pila, saque los dos tornillos de la tapa y luego retire la
tapa y el aro tórico. Coloque una nueva pila de 9 voltios. Vuelva a
colocar la tapa y el aro tórico (alinee este aro correctamente para
garantizar un buen sellado) y ajuste los dos tornillos de la tapa
para que funcione la protección contra salpicaduras.
Figura 1.
Instalación de la pila
FUNCIONES PRINCIPALES DEL MODELO pH100
1.
: Para encender y apagar la unidad. Los valores de calibración de pH no se suprimen
cuando se apaga la unidad. La unidad se enciende en el mismo estado en que se
encontraba cuando se apagó. Cuando la unidad no esté en uso, apáguela para ahorrar
carga de la pila. Para el almacenamiento a largo plazo debe quitar las pilas.
2.
MODE: Selecciona el modo de la pantalla. Presione MODE para ver pH-AUTOLOCK, mVAUTOLOCK, pH y mV de manera secuencial. Los valores de calibración no se ven
afectados al cambiar el modo de la pantalla.
3.
Teclas STAND y SLOPE: Se utilizan para la calibración de pH de dos puntos de la unidad.
Pulse y mantenga pulsada la tecla STAND mientras enciende la energía para cambiar los
juegos de tampones.
4.
Teclas ∆ y ∇: Pulse para introducir los valores de temperatura en el modo manual (MAN).
Estas teclas no funcionan en el modo ATC.
5.
MEA./EFF.: Pulse para liberar la unidad del estado AUTOLOCK (autobloqueo) cuando
funciona en el modo pH-AUTOLOCK o mV-AUTOLOCK. Pulse y mantenga pulsada por 5
segundos para ver la eficiencia del electrodo.
6.
ESC: Presione para despejar la unidad cuando aparezca una señal de error y suprimirá los
valores de calibración almacenados en la memoria interna. Para evitar la supresión
accidental durante el uso normal, las teclas no funcionan a menos que se pulsen durante 2
segundos. La tecla funciona solamente cuando aparece un mensaje de error.
Cuando se pulsa ESC, todos los elementos de la pantalla de cristal líquido se iluminan.
Después de 2 segundos la unidad entra en el modo pH-AUTOLOCK. “AUTOLOCK” aparece y
“STAND” comienza a parpadear indicando la necesidad de realizar la calibración. Pulse ESC
sólo cuando se produzcan errores que requieran la recalibración de la unidad.
PANTALLA DE CRISTAL
LÍQUIDO
1.
WAIT: Aparece cuando la unidad
espera una lectura estable o medición
del punto terminal.
2.
BAT: Indicador de pila agotada.
3.
ATC/MAN: “ATC” aparece si la sonda
ATC está conectada. De lo contrario,
aparece “MAN”.
4
Figura 2. Pantalla de cristal líquido
4.
STAND/SLOPE: “STAND” o “SLOPE” permanecen fijamente si el parámetro se calibró. Si
alguno de los dos no se ha calibrado, parpadea.
5.
AUTO: Indicador del modo Autolock (autobloqueo).
6.
HOLD: Indica que la lectura se mantiene durante el modo Autolock (autobloqueo).
7.
EFF%: Aparece cuando el usuario visualiza la eficiencia del electrodo. Se recomienda
reemplazar el electrodo cuando la eficiencia es inferior a 75%.
8.
pH/mV: Indicadores de la unidad y de modo.
9.
Pantalla principal para los valores de pH, mV y eficiencia de la sonda.
10. °C: Indicador de la temperatura.
PROCEDIMIENTOS DE FUNCIONAMIENTO
Selección de la tabla de la solución tampón
La unidad cuenta con dos juegos de tampones: 7,00, 4,01, 10,01 pH y 6,86, 4,00, 9,18 pH.
Para cambiar el juego de la solución tampón, apague la unidad, luego pulse y mantenga
pulsado STAND mientras enciende la unidad de nuevo. Si la unidad está calibrada y en el
modo pH, muestra “7,00” si el primer juego está activo y “6,86”, si el segundo está activo.
Calibración de pH
El pH100 utiliza calibración de 2 puntos. El primer punto debe ser el tampón 6,86/7,00 y el
segundo debe ser 4,00/4,01 ó 9,18/10,01. Estas soluciones tampón se pueden comprar al
representante de YSI.
1.
Encienda la unidad. Conecte el electrodo de pH en el conector BNC y la sonda ATC/Temp
en el conector ATC/Temp en la unidad; aparece “ATC”. Pulse MODE hasta que aparezca
“pH”. Autolock (autobloqueo) puede estar encendido o apagado según lo desee.
2.
AUTOLOCK ENCENDIDO: Coloque las sondas pH y ATC/Temp en la primera solución
tampón (7,00 ó 6,98). Deje que las lecturas de temperatura se estabilicen, luego pulse
“STAND” para calibrar. Si AUTOLOCK (autobloqueo) está apagado, el primer punto se ha
calibrado. Si AUTOLOCK (autobloqueo) está encendido, “WAIT” parpadea hasta que la
unidad detecta una lectura estable. Cuando la unidad calibra el primer punto, “STAND” no
parpadea, pero “SLOPE” sí.
NOTA: Si no está conectada la sonda de temperatura, ajuste la lectura de temperatura al
nivel de la primera solución tampón utilizando la tecla ∆ o ∇ (0,0 a 60° C) ANTES de pulsar
“STAND”.
3.
Enjuague las sondas pH y ATC/Temp con agua destilada, luego colóquelas en la segunda
solución tampón (4,01/4,00 ó 10,01/9,18). Deje que las lecturas de temperatura se
estabilicen, luego pulse “SLOPE” para calibrar. Si AUTOLOCK (autobloqueo) está
apagado, el segundo punto se ha calibrado. Si AUTOLOCK (autobloqueo) está encendido,
“WAIT” parpadea hasta que la unidad detecta una lectura estable. Cuando la unidad calibra
el segundo punto, tanto “STAND” como “SLOPE” no parpadean.
NOTA: Si no está conectada la sonda de temperatura, ajuste la lectura de temperatura al
nivel de la primera solución tampón utilizando la tecla ∆ o ∇ (0,0 a 60° C) ANTES de pulsar
“SLOPE”.
4. La unidad calcula y compensa la desviación de inclinación del electrodo de pH
correspondiente a los valores de las dos soluciones tampón de calibración. La unidad
ahora cuenta con dos puntos calibrados y está lista para realizar mediciones. Después de
la calibración, pulse y mantenga pulsado MEA. /EFF. por 5 segundos para ver la nueva
eficiencia del electrodo.
5
Uso del simulador de electrodo del modelo pH160
El simulador de electrodo del modelo pH160 se puede utilizar para confirmar la calibración
apropiada del medidor. Para utilizar el simulador:
1. Instale la pila de 9 voltios proporcionada.
2.
Conecte el pH160 al pH100. Encienda ambas unidades. El pH160 tiene un interruptor
pequeño a la derecha de los botones de pH.
3.
En el modo de medición de pH, pulse uno de los botones de simulador de solución tampón
de pH en el pH160. El valor correspondiente de pH debe aparecer en ambas pantallas.
Nota: La calibración con el simulador de pH sólo se hace en el medidor y NO en el medidor y
la sonda. Para obtener la mejor precisión, calibre el medidor de pH y la sonda juntos utilizando
las soluciones tampón.
Mediciones de pH
Para tomar mediciones de pH, “STAND” y “SLOPE” no deben parpadear, lo que indica que la
unidad está calibrada en dos puntos y está lista para realizar mediciones. Si “STAND” y
“SLOPE” parpadean, realice la calibración de pH antes de tomar las mediciones.
1.
Pulse MODE (modo) para entrar en el modo pH con AUTOLOCK (autobloqueo) encendido
o apagado, como lo desee. Para las muestras naturalmente inestables, la unidad no
entrará en AUTOLOCK (autobloqueo). En este caso debe apagar AUTOLOCK
(autobloqueo).
2. Enjuague el electrodo de pH y/o sonda ATC/Temp con agua destilada y sumérjala en la
muestra que será medida. Saque las burbujas de aire atrapadas alrededor de la sonda
sacudiendo o agitando la sonda. Deje que el pH y/o la temperatura se estabilicen. Si la
sonda ATC/Temp no está conectada, aparece “MAN”, lo que indica que se utiliza la
compensación manual de temperatura. Fije la unidad para que indique la temperatura de la
muestra pulsando las teclas ∆ y ∇ (-10,0 a 120° C). Si la sonda ATC/Temp está conectada,
aparece “ATC” junto a la temperatura de la muestra.
3. Si AUTOLOCK (autobloqueo) está apagado, el valor de pH de la muestra aparece en la
pantalla. Si las lecturas de pH y temperatura son estables, tome la lectura. Si AUTOLOCK
(autobloqueo) está encendido, pulse MEA./EFF. “WAIT” parpadea hasta que la unidad
detecta una lectura estable de pH.
Mediciones de temperatura
El modelo pH100 puede medir temperatura de manera independiente con la sonda ATC/Temp,
sin utilizar el electrodo de pH. Ponga la sonda ATC/Temp en el medio a ser medido. Aparecerá
la medición de temperatura.
Mediciones de mV
1.
Conecte el electrodo opcional de combinación mV en la unidad. Pulse MODE (modo) para
entrar en el modo mV con AUTOLOCK (autobloqueo) encendido o apagado, como lo
desee. Para las muestras naturalmente inestables, la unidad no entrará en AUTOLOCK
(autobloqueo). En este caso utilice el modo mV con AUTOLOCK (autobloqueo) apagado.
2.
Enjuague el electrodo con agua destilada y sumérjalo en la muestra a ser medida. Si
AUTOLOCK (autobloqueo) está apagado, el valor de mV de la muestra aparece en la
pantalla. Si AUTOLOCK (autobloqueo) está encendido, pulse MEA./EFF. “WAIT” parpadea
hasta que la unidad detecta una lectura estable de mV.
6
LOCALIZACIÓN Y RESOLUCIÓN DE PROBLEMAS
PANTALLA
CAUSAS POSIBLES
ACCIÓN CORRECTIVA
PRINCIPAL
Er 1
• El desfase del electrodo de pH es
mayor/inferior a +/-1,5 pH.
• Se pulsó STAND antes de que el
electrodo y la sonda ATC/Temp lleguen
cerca del valor de la solución tampón de
±1,5 pH.
• El electrodo de pH tiene fallos
• Reemplace la solución tampón
y/o el electrodo de pH. Pulse la
tecla ESC.
• Deje transcurrir suficiente
tiempo para que el electrodo y
la sonda ATC/Temp se
estabilicen.
• Envíelo al servicio técnico.
Er 2
• La inclinación del electrodo de pH está a
más de 30% de la inclinación ideal.
• Se pulsó SLOPE antes de que el
electrodo y la sonda ATC/Temp lleguen
cerca del 30% del valor de la solución
tampón.
• La solución tampón 4,00, 4,01, 9,18 ó
10,01 no es correcta.
• Verifique el uso de la solución
tampón correcta y que la
inclinación del electrodo no sea
superior al 30% de la
inclinación teórica.
• Deje transcurrir suficiente
tiempo para que el electrodo y
la sonda ATC/Temp se
estabilicen.
• Reemplace la solución tampón
y/o el electrodo de pH. Pulse la
tecla ESC.
• Envíelo al servicio técnico.
Er 3
• La temperatura está fuera de la escala
de 0,0 a 60,0° C.
• Haga que la temperatura de la
solución tampón esté dentro de
la escala.
• Envíelo al servicio técnico.
OvEr/
Undr
• El pH medido está fuera de la escala de
16,00/-2,00 pH.
• El mV medido está fuera de la escala de
1250/-2000 mV.
• La temperatura medida está fuera de la
escala de -10/120° C.
7
• Haga que la unidad fuera de
escala entre en la escala de
medición correcta.
• Si las unidades se encuentran
dentro de la escala correcta,
devuelva el producto para
obtener servicio técnico.
ESPECIFICACIONES
Pantalla
pH
mV
Temperatura en
°C
Escala
-2,00 a 16,00 pH
-1999 a 1250 mV
-10,0 a 120° C
Precisión
±0,1%, ±2 lsd
±0,1%, ±1 lsd
±0,5° C
Resolución
0,01 pH
1 mV
0,1° C
Compensación de pH temperatura
AUTO/MANual –10,0 a 120,0 °C
Reconocimiento de pH de solución
tampón
(4,01, 7,00 y 10,01) o (4,00, 6,86 y 9,18)
Escala de temperatura de
calibración de pH de la solución
tampón
0 a 60° C
Reconocimiento de desfase del
electrodo de pH
±90 mV a pH 7,0 ó 6,86
Reconocimiento de inclinación del
electrodo de pH
±30% a pH 4,00, 4,01, 9,18 ó 10,01
Energía
Una pila de 9 voltios
Respaldo de la calibración
Sí
Respuesta audible
Sí, en todas las teclas
Característica Autolock
(autobloqueo)
Sí
Escala de temperatura de
funcionamiento
0 a 50° C
Escala de humedad relativa de
funcionamiento
Hasta 95%
Sonda ATC
Termistor, 10kΩ / 25° C
Dimensiones (anc x prof x alt)
86 mm x 241 mm x 72 mm (3 pulg. x 9,5 pulg. x
2,8 pulg.)
Peso (con la pila)
430 gramos (1 libra)
LISTA DE PIEZAS DE RECAMBIO RECOMENDADAS
PIEZA No
DESCRIPCIÓN
100-1
Cable Y hidrófugo de 1 metro con combinación de electrodos pH/unión de
referencia y ATC.
100-4
Cable Y hidrófugo de 4 metros con combinación de electrodos pH/unión de
referencia y ATC.
110-1
Electrodo de pH con cable de 1 metro.
115-1
Electrodo de mV con cable de 1 metro.
130-1
Electrodo de ATC (temperatura) con cable de 1 metro.
160
Electrodo simulador de pH.
180
Estuche portátil de pH, de lados rígidos
405
Estuche portátil para medidor, no rígido
Artículo #605367 • Ilustración #A605367
Revisión A • Marzo de 2003
8
GARANTIE
Für das Instrument YSI pH100 wird für den Zeitraum von einem (1) Jahr ab dem Datum des Kaufs
durch den Endbenutzer eine Garantie bezüglich Material- und Fabrikationsfehlern gewährt. Für YSI
pH100-Sonden und -Kabel wird für den Zeitraum von sechs (6) Monaten ab dem Datum des Kaufs
durch den Endbenutzer eine Garantie bezüglich Material- und Fabrikationsfehlern gewährt. Innerhalb
der Garantiefrist wird YSI jedes Produkt, für das diese Garantie gilt, nach eigenem Ermessen
entweder kostenlos reparieren oder ersetzen.
Setzen Sie sich schriftlich oder telefonisch mit Ihrem örtlichen YSI-Vertreter in Verbindung oder
kontaktieren Sie den YSI-Kundendienst in Yellow Springs (Ohio/USA), um diese Garantie in
Anspruch zu nehmen. Schicken Sie das Produkt mit dem Kaufnachweis unter Vorauszahlung der
Frachtkosten an das von YSI ausgewählte Vertragskundendienstzentrum. Dort wird die Reparatur
oder der Ersatz vorgenommen und das Produkt anschließend frachtfrei an Sie zurückgesandt. Für
reparierte oder ersetzte Produkte erstreckt sich die Garantie über die Restlaufzeit des ursprünglichen
Garantiezeitraums, mindestens jedoch über 90 Tage ab dem Datum der Reparatur oder des
Ersatzes.
Garantiebegrenzung
Diese Garantie gilt nicht für irgendwelche Beschädigungen oder Ausfälle eines YSI-Produkts, die
durch Folgendes verursacht werden: (i) Versäumnis, das Produkt in Übereinstimmung mit den
schriftlichen Instruktionen von YSI zu installieren, in Betrieb zu nehmen oder zu benutzen; (ii)
Missbrauch oder Zweckentfremdung des Produkts; (iii) Versäumnis, das Produkt in Übereinstimmung
mit den schriftlichen Instruktionen von YSI oder einem branchenüblichen Verfahren in Stand zu
halten; (iv) unsachgemäße Reparaturen am Produkt; (v) eine von Ihnen vorgenommene Verwendung
defekter oder ungeeigneter Komponenten oder Teile bei der Wartung oder Reparatur des Produkts;
oder (vi) die Abänderung des Produkts in irgendeiner Weise, die nicht ausdrücklich von YSI
genehmigt ist.
DIESE GARANTIE TRITT AN DIE STELLE ALLER ANDEREN GEWÄHRLEISTUNGEN,
GLEICHGÜLTIG, OB VERTRAGLICH ODER GESETZLICH ZUGESICHERT,
EINSCHLIESSLICH JEGLICHER ZUSICHERUNG ALLGEMEINER
GEBRAUCHSTAUGLICHKEIT ODER EIGNUNG FÜR EINEN BESTIMMTEN ZWECK. DIE
HAFTUNG VON YSI GEMÄSS DIESER GARANTIE BESCHRÄNKT SICH AUF DIE
REPARATUR ODER DEN ERSATZ DES PRODUKTS, UND DIES STELLT IHREN EINZIGEN
UND AUSSCHLIESSLICHEN RECHTSBEHELF FÜR JEDES DEFEKTE PRODUKT DAR, FÜR
DAS DIESE GARANTIE GILT. YSI HAFTET AUF KEINEN FALL FÜR IRGENDWELCHE
BESONDEREN, MITTELBAREN, BEILÄUFIG ENTSTANDENEN ODER FOLGESCHÄDEN,
DIE AUS IRGENDEINEM DEFEKTEN PRODUKT RESULTIEREN, FÜR DAS DIESE
GARANTIE GILT.
KONTAKTINFORMATION
YSI Environmental, Inc. • 1725 Brannum Lane • Yellow Springs, OH 45387, USA
800-897-4151 (gebührenfrei in den USA) • 937-767-7241 • Fax: 937-767-1058
Email: [email protected] • Website: www.ysi.com/environmental
1
INHALTSVERZEICHNIS
GARANTIE ...................................................................................................... 1
KONTAKTINFORMATION .............................................................................. 1
ALLGEMEINE EINLEITUNG ........................................................................... 3
INSPEKTION VOR DEM EINSATZ................................................................. 3
SPRITZWASSERSCHUTZ.............................................................................. 3
EINSETZEN DER BATTERIE ......................................................................... 4
HAUPTFUNKTIONEN DES MODELLS pH100............................................... 4
DAS LCD-ANZEIGEFELD............................................................................... 4
BEDIENUNGSVERFAHREN........................................................................... 5
Wahl der Puffertabelle................................................................................ 5
pH-Kalibrierung .......................................................................................... 5
Verwendung des Elektrodensimulators Modell pH160............................... 6
pH-Messungen ........................................................................................... 6
Temperaturmessungen .............................................................................. 6
mV-Messungen .......................................................................................... 6
AUFFINDEN UND BESEITIGEN VON STÖRUNGEN.................................... 7
TECHNISCHE DATEN .................................................................................... 7
LISTE EMPFOHLENER ERSATZTEILE ......................................................... 8
2
ALLGEMEINE EINLEITUNG
Das MODELL pH100 ist ein Präzisionsinstrument, das pH, mV und die Temperatur misst. Ein
eingebauter Mikroprozessor speichert, berechnet und kompensiert alle Parameter im
Zusammenhang mit der pH-Bestimmung, einschließlich der Temperaturcharakteristika der
Elektrode, Neigungsabweichungen der Elektrode und Pufferlösungen.
Dieses Gerät besitzt ein spritzwasserfestes Gehäuse gemäß der Schutzklasse IP65. Die
mechanischen Berührungstasten mit fühlbarem und hörbarem Feedback sind äußerst
zuverlässig. Das Instrument wird von einer 9 Volt-Batterie gespeist. Es ist keine erneute
Kalibrierung notwendig, wenn die Stromversorgung wiederhergestellt wird.
Auf der Vorderseite des Instruments befindet sich ein großes LCD-Anzeigefeld, das gleichzeitig
die pH- oder mV-Werte sowie die Temperatur mit Bedienerhinweisen/Eingabeaufforderungen
und die Betriebsart anzeigt. Das Gerät führt den Benutzer durch die Kalibrierungs- und
Messverfahren.
Mit einer AUTOLOCK-Funktion für pH- und mV-Messwerte kann das Gerät automatisch den
Umschlagspunkt wahrnehmen und die Anzeige „festschreiben“, um den Wert des
Umschlagspunkts einer Messung anzuzeigen. Das pH100-Gerät kann auch ohne AUTOLOCKBetriebsmodus benutzt werden. AUTOLOCK und Bedienerhinweise/Eingabeaufforderungen
tragen dazu bei, die meisten Fehler bei der Bestimmung von pH- und mV-Werten zu
eliminieren. Das Ergebnis sind präzise, wiederholbare und fehlerfreie Messungen.
Das Modell pH100 ist mit pH-, mV-, ORP- und ATC-Sonden (Automatische
Temperaturkompensation) erhältlich. Zu den weiteren Merkmalen gehören ElektrodenoffsetErkennung, Elektrodenneigungs-Erkennung, Elektrodeneffizienz-Anzeige, eingebaute
Pufferkoeffizienten, automatische oder manuelle Temperaturkompensation, eine lange
Batterielebensdauer und eine hohe 50/60 Hz WS-Störgeräuschunterdückung. Das Instrument
ist vielseitig, benutzerfreundlich und für Anwendungen in der Feldforschung, Industrie und im
Labor geeignet.
INSPEKTION VOR DEM EINSATZ
Packen Sie das Gerät und sein Zubehör sorgfältig aus und untersuchen Sie alle Teile auf
eventuelle Transportschäden. Vergleichen Sie die erhaltenen Teile mit den Gegenständen, die
auf dem Packzettel aufgeführt sind. Benachrichtigen Sie YSI unverzüglich über irgendwelche
Schäden oder fehlende Teile. Bewahren Sie das Verpackungsmaterial auf, bis der einwandfreie
Betrieb des Geräts bestätigt ist.
SPRITZWASSERSCHUTZ
Obwohl das pH100-Messinstrument in einem spritzwassergeschützten Gehäuse untergebracht ist,
DARF ES NICHT unter Wasser eingesetzt werden. Das spritzwassergeschützte Gehäuse
verhindert permanente Schäden am Gerät, falls es versehentlich in nichtätzende Lösungen fällt.
Im Falle eines Eintauchens in eine Flüssigkeit müssen sofort die folgenden Schritte ausgeführt
werden:
1.
Spülen Sie das Gerät sorgfältig mit destilliertem Wasser ab. Nach dem Abspülen und Trocknen
sollten Sie die Anschlussstücke inspizieren und säubern, um alle verunreinigenden Substanzen
zu entfernen, die die Sondenanschlüsse angreifen könnten.
2.
Warten Sie, bis das Gerät und die Sonde völlig trocken sind, bevor Sie das Gerät wieder in
Betrieb nehmen.
3.
Falls das Gerät nach den Schritten 1 und 2 nicht korrekt funktionieren sollte, rufen Sie YSI
wegen einer möglichen Reparatur oder eines Ersatzes an (siehe Garantie).
3
EINSETZEN DER BATTERIE
Eine anfängliche Anzeige von „BAT” auf dem LCD bedeutet, dass das Gerät noch ca. 1 Stunde
innerhalb der Spezifizierungen mit der Batterie betrieben werden kann. Wechseln Sie die
Batterie aus, wenn „BAT” auf dem LCD-Anzeigefeld erscheint. (Siehe
Abbildung 1)
Zum Austausch der Batterie entfernen Sie die beiden Schrauben für
die Batterieabdeckung, die Batterieabdeckung und den O-Ring.
Wechseln Sie die 9 Volt-Batterie aus. Setzen Sie die
Batterieabdeckung und den O-Ring wieder ein (achten Sie auf die
korrekte Ausrichtung des O-Rings für eine gute Abdichtung) und
ziehen Sie die beiden Schrauben für die Batterieabdeckung fest,
damit das Gerät spritzwassergeschützt bleibt.
HAUPTFUNKTIONEN DES MODELLS pH100
Abbildung 1.
Einsetzen der Batterie
1.
: Schaltet das Gerät EIN oder AUS. Die pHKalibrierungswerte werden nicht gelöscht, wenn das Gerät ausgeschaltet wird. Das Gerät
schaltet sich im selben Status wie beim Ausschalten ein. Wenn das Gerät nicht benutzt
wird, schalten Sie es aus, um die Batterie zu schonen. Entfernen Sie die Batterien im Falle
einer längeren Lagerung.
2.
MODE: Wählt den Anzeigemodus. Drücken Sie auf MODE, um nacheinander pHAUTOLOCK, mV-AUTOLOCK, pH und mV anzuzeigen. Die Änderung des Anzeigemodus
wirkt sich nicht auf die Kalibrierungswerte aus.
3.
STAND- und SLOPE-Tasten: Werden zur Zwei-Punkte-pH-Kalibrierung des Geräts
verwendet. Drücken Sie auf die STAND-Taste, während Sie den Strom anschalten, um die
Puffersätze zu ändern.
4.
∆ und ∇ Tasten: Drücken Sie auf diese Tasten, um die Temperaturwerte manuell (MANModus) einzugeben. Diese Tasten funktionieren im ATC-Betriebsmodus nicht.
5.
MEA./EFF.: Drücken Sie diese Taste, um den AUTOLOCK-Status aufzuheben, wenn das
Gerät im pH-AUTOLOCK- oder mV-AUTOLOCK-Modus betrieben wird. Drücken Sie die
Taste 5 Sekunden lang, um die Elektrodeneffizienz anzuzeigen.
6.
ESC: Drücken Sie auf diese Taste, wenn eine Fehlermeldung angezeigt wird; es werden
alle Kalibrierungswerte im internen Speicher gelöscht. Die Taste reagiert nur, wenn sie
mindestens 2 Sekunden lang gedrückt wird. Somit wird eine unbeabsichtigte Löschung
während des normalen Gebrauchs verhindert. Die Taste reagiert nur dann, wenn eine
Fehlermeldung gezeigt wird.
Wenn die ESC-Taste gedrückt wird, leuchten alle LCD-Elemente auf. Nach ungefähr 2
Sekunden wird der pH-AUTOLOCK-Modus aufgerufen. „AUTOLOCK“ wird angezeigt und
„STAND“ beginnt zu blinken; dies weist darauf hin, dass eine Kalibrierung erforderlich ist.
Drücken Sie nur dann auf die ESC-Taste, wenn Fehler auftreten, die eine Neukalibrierung
des Geräts erforderlich machen.
DAS LCD-ANZEIGEFELD
1.
WAIT: Wird angezeigt, während das
Gerät auf einen stabilen Messwert
oder die Wahrnehmung des
Umschlagspunkts wartet.
2.
BAT: Anzeige für niedrigen
Batteriestand.
4
Abbildung 2. LCD-Anzeigefeld
3.
ATC/MAN: „ATC“ wird angezeigt, falls eine ATC-Sonde angeschlossen ist. Andernfalls wird
„MAN“ angezeigt.
4.
STAND/SLOPE: „STAND“ oder „SLOPE“ bleiben konstant, falls der Parameter kalibriert
wurde. Die Anzeige blinkt, falls keiner der Parameter kalibriert wurde.
5.
AUTO: Anzeige des Autolock-Modus.
6.
HOLD: Zeigt an, dass ein Messwert während des Autolock-Modus festgeschrieben ist.
7.
EFF%: Wird angezeigt, wenn der Benutzer die Elektrodeneffizienz abliest. Es wird
empfohlen, die Elektrode auszuwechseln, wenn die Effizienz unter 75% fällt.
8.
pH/mV: Einheits- und Modusanzeigen.
9.
Hauptanzeige für pH-, mV- und Sondeneffizienz-Werte.
10. °C: Temperaturanzeige.
BEDIENUNGSVERFAHREN
Wahl der Puffertabelle
Dieses Gerät hat zwei Puffersätze: 7.00, 4.01, 10.01 pH und 6.86, 4.00, 9.18 pH. Schalten Sie
das Gerät ab und halten dann die STAND-Taste niedergedrückt, während Sie das Gerät wieder
anschalten, um den Puffersatz zu ändern. Falls das Gerät nicht kalibriert ist und sich im pHModus befindet, wird „7.00“ angezeigt, falls der erste Satz aktiv ist, und „6.86“, falls der zweite
Satz aktiv ist.
pH-Kalibrierung
Das Modell pH100 verwendet eine Zweipunkt-Kalibrierung. Der erste Punkt muss ein 6.86/7.00Puffer und der zweite Punkt entweder ein 4.00/4.01- oder ein 9.18/10.01-Puffer sein. Diese
Puffer können bei einem YSI-Vertreter gekauft werden.
1.
Schalten Sie das Gerät ein. Schließen Sie die pH-Elektrode an den BNC-Anschluss und die
ATC/Temp-Sonde an den ATC/Temp-Anschluss des Geräts an; „ATC“ wird angezeigt.
Drücken Sie auf MODE, bis „pH“ angezeigt wird. Autolock kann je nach Wunsch ein- oder
ausgeschaltet sein.
2.
AUTOLOCK ON: Tauchen Sie die pH- und ATC/Temp-Sonden in die erste Pufferlösung
(entweder 7.00 oder 6.98). Warten Sie, bis sich die Temperaturwerte stabilisiert haben, und
drücken Sie dann zur Kalibrierung auf „STAND“. Falls AUTOLOCK abgeschaltet ist, wurde
der erste Punkt kalibriert. Falls AUTOLOCK angeschaltet ist, blinkt „WAIT“, bis das Gerät
einen stabilen Messwert erkennt. Sobald das Gerät den ersten Punkt kalibriert hat, wird
„STAND“ konstant angezeigt und „SLOPE“ blinkt auf.
HINWEIS: Falls keine Temperatursonde angeschlossen ist, müssen Sie mit den ∆- oder ∇Tasten (0,0 bis 60 ºC) den Temperaturmesswert an den des ersten Puffers angleichen,
BEVOR Sie auf „STAND” drücken.
3.
Spülen Sie die pH- und ATC/Temp-Sonden in destilliertem Wasser ab, und geben Sie sie
dann in die zweite Pufferlösung (entweder 4.01/4.00 oder 10.01/9.18). Warten Sie, bis sich
die Temperaturwerte stabilisiert haben, und drücken Sie dann zur Kalibrierung auf
„STAND“. Falls AUTOLOCK ausgeschaltet ist, wurde der zweite Punkt kalibriert. Falls
AUTOLOCK angeschaltet ist, blinkt „WAIT“, bis das Gerät einen stabilen Messwert
wahrnimmt. Sobald das Gerät den zweiten Punkt kalibriert, werden sowohl „STAND“ als
auch „SLOPE“ konstant angezeigt.
HINWEIS: Falls keine Temperatursonde angeschlossen ist, müssen Sie mit den ∆- oder ∇Tasten (0,0 bis 60 ºC) den Temperaturmesswert an den des ersten Puffers angleichen,
BEVOR Sie auf „SLOPE” drücken.
5
4. Entsprechend den Werten der beiden Kalibrierungspuffer berechnet das Gerät die pHElektrodenneigungs-Abweichung und nimmt einen Ausgleich vor. Das Gerät ist jetzt mit
zwei Punkten kalibriert und einsatzbereit für Messungen. Nach der Kalibrierung drücken Sie
die Taste MEA./EFF. ungefähr 5 Sekunden lang, um die neue Elektrodeneffizienz
anzuzeigen.
Verwendung des Elektrodensimulators Modell pH160
Der Elektrodensimulator Modell pH160 kann zur Bestätigung der ordnungsgemäßen
Kalibrierung des Instruments verwendet werden. So benutzen Sie den Simulator:
1. Legen Sie die mitgelieferte 9 V-Batterie in das Batteriefach.
2.
Bringen Sie den pH160 am pH100 an. Schalten Sie beide Geräte ein. Der pH160 hat einen
kleinen Schalter rechts neben den pH-Tasten.
3.
In der Betriebsart für die pH-Messung drücken Sie auf eine der pH-Puffersimulatortasten
am pH160. Der entsprechende pH-Wert sollte auf beiden Bildschirmen erscheinen.
Hinweis: Die Kalibrierung mit dem pH-Simulator kalibriert nur das Messgerät – NICHT das
Messgerät und die Sonde. Für die größte Genauigkeit sollten Sie das pH-Messgerät und die
Sonde gemeinsam mit Pufferlösungen kalibrieren.
pH-Messungen
„STAND“ und „SLOPE“ müssen konstant angezeigt werden, um pH-Messungen vorzunehmen.
Dies zeigt an, dass das Gerät an zwei Punkten kalibriert und einsatzbereit für Messungen ist.
Falls „STAND“ und „SLOPE“ blinken, müssen Sie vor Messungen eine pH-Kalibrierung
durchführen.
1.
Drücken Sie auf MODE, um den pH-Modus aufzurufen, wobei AUTOLOCK je nach Wunsch
ein- oder ausgeschaltet sein kann. Für Proben, die inhärent instabil sind, kann
derAUTOLOCK-Modus nicht aufgerufen werden. In diesem Fall sollten Sie AUTOLOCK
ausschalten.
2. Spülen Sie die pH-Elektrode und/oder ATC/Temp-Sonde mit destilliertem Wasser ab und
tauchen Sie sie in die zu messende Probe ein. Schütteln Sie die Sonde oder schwenken
Sie sie, um Luftblasen an der Sonde zu entfernen. Warten Sie, bis sich der pH-Wert
und/oder die Temperatur stabilisiert haben. Falls keine ATC/Temp-Sonde angeschlossen
ist, erscheint „MAN“ für die manuelle Temperaturkompensation. Stellen Sie das Gerät mit
den Tasten ∆ und ∇ (-10,0 bis 120 °C) ein, um die Temperatur der Probe anzuzeigen. Falls
eine ATC/Temp-Sonde angeschlossen ist, wird „ATC“ zusammen mit der Temperatur der
Probe angezeigt.
3. Falls AUTOLOCK ausgeschaltet ist, wird der pH-Wert der Probe auf dem Bildschirm
angezeigt. Falls sowohl der pH- als auch der Temperaturwert stabil sind, lesen Sie die
Messwerte ab. Falls AUTOLOCK eingeschaltet ist, drücken Sie auf MEA./EFF. „WAIT“
blinkt auf, bis das Gerät einen stabilen pH-Messwert bestimmt.
Temperaturmessungen
Das Modell pH100 kann die Temperatur mit der ATC/Temp-Sonde unabhängig ohne die pHElektrode messen. Tauchen Sie die ATC/Temp Sonde in das zu messende Element. Die
gemessene Temperatur wird angezeigt.
mV-Messungen
1.
Schließen Sie die wahlweise einsetzbare mV-Kombinationselektrode an das Gerät an.
Drücken Sie auf MODE, um den mV-Modus aufzurufen, wobei AUTOLOCK je nach
Wunsch ein- oder ausgeschaltet sein kann. Für Proben, die inhärent instabil sind, kann der
6
AUTOLOCK-Modus nicht aufgerufen werden. Benutzen Sie in diesem Fall den mV-Modus
mit ausgeschaltetem AUTOLOCK.
2.
Spülen Sie die Elektrode mit destilliertem Wasser ab und tauchen Sie sie in die zu messende
Probe. Falls AUTOLOCK ausgeschaltet ist, wird der mV-Wert der Probe auf dem Bildschirm
angezeigt. Falls AUTOLOCK eingeschaltet ist, drücken Sie auf MEA./EFF. „WAIT“ blinkt auf,
bis das Gerät einen stabilen mV-Messwert bestimmt.
AUFFINDEN UND BESEITIGEN VON STÖRUNGEN
HAUPTANZEIGE
Er 1
MÖGLICHE URSACHE
• pH-Elektrodenausgleich ist
größer/kleiner als +/-1,5 pH.
• STAND wurde gedrückt, bevor sich die
Elektrode und die ATC/Temp-Sonde auf
einen Bereich von ±1,5 pH des
Pufferwerts einpendelten.
• Die pH-Elektrode ist fehlerhaft.
ABHILFSMASSNAHME
• Wechseln Sie den Puffer
und/oder die pH-Elektrode aus.
Drücken Sie auf ESC.
• Geben Sie der Elektrode und
der ATC/Temp-Sonde
genügend Zeit, um sich zu
stabilisieren.
• Schicken Sie das Gerät zur
Inspektion zurück.
Er 2
• Die pH-Elektrodenneigung weicht mehr
als 30% von der Idealneigung ab.
• SLOPE wurde gedrückt, bevor sich die
Elektrode und die ATC/Temp-Sonde auf
einen Bereich innerhalb von 30% des
Pufferwerts einpendelten.
• Puffer 4.00, 4.01, 9.18 oder 10.01 sind
nicht richtig.
• Überprüfen Sie, dass der
richtige Puffer benutzt wird und
dass die Elektrodenneigung
nicht mehr als 30% von der
theoretischen Neigung
abweicht.
• Geben Sie der Elektrode und
der ATC/Temp-Sonde
genügend Zeit, um sich zu
stabilisieren.
• Wechseln Sie den Puffer
und/oder die pH-Elektrode aus.
Drücken Sie auf ESC.
• Schicken Sie das Gerät zur
Inspektion zurück.
Er 3
• Die Temperatur liegt außerhalb des
Bereichs von 0,0 bis 60,0 °C.
• Bringen Sie die
Puffertemperatur in den
angegebenen Bereich.
• Schicken Sie das Gerät zur
Inspektion zurück.
OvEr/Undr
• Der gemessene pH-Wert liegt außerhalb
des Bereichs von 16,00/-2,00 pH.
• Der gemessene mV-Wert liegt
außerhalb des Bereichs von 1250/-2000
mV.
• Die gemessene Temperatur liegt
außerhalb des Bereichs von –10/120 °C.
TECHNISCHE DATEN
7
• Bringen Sie die außerhalb des
Bereichs befindliche Maßeinheit
in den korrekten Messbereich
zurück.
• Falls die Maßeinheiten sich
innerhalb des
ordnungsgemäßen Bereichs
befinden, schicken Sie das
Produkt zur Inspektion zurück.
Anzeige
pH
mV
Temperatur °C
Bereich
-2,00 bis 16,00 pH
-1999 bis 1250 mV
-10,0 bis 120 °C
Genauigkeit
±0,1%, ±2 lsd
±0,1%, ±1 lsd
±0,5 °C
Auflösung
0,01 pH
1 mV
0,1 °C
pH-Temperaturkompensation
AUTO/MANuell -10,0 bis 120,0 °C
pH-Puffererkennung
(4.01, 7.00 & 10.01) oder (4.00, 6.86 & 9.18)
Temperaturbereich der pHPufferkalibrierung
0 bis 60 °C
pH-Elektrodenoffset-Erkennung
±90 mV bei pH 7.00 oder 6.86
pH-Elektrodenneigungs-Erkennung
±30% bei pH 4.00, 4.01, 9.18 oder 10.01
Stromquelle
Eine 9 Volt-Batterie
Sicherung der Kalibrierungsdaten
Ja
Audio-Feedback
Ja, auf allen Tasten
Autolock-Funktion
Ja
Betriebstemperaturbereich
0 bis 50 °C
Relative Luftfeuchtigkeit
Betriebsbereich
bis zu 95%
ATC-Sonde
Thermistor, 10 kΩ / 25 °C
Abmessungen (B x T x H)
86 mm x 241 mm x 72 mm (3 in x 9.5 in x 2.8 in)
Gewicht (mit Batterie)
430 Gramm (1 lb)
LISTE EMPFOHLENER ERSATZTEILE
Artikelnumm
er
BESCHREIBUNG
100-1
1 Meter langes wasserdichtes Y-Kabel mit kombinierter
pH-/Referenzverbindung & ATC-Elektroden.
100-4
4 Meter langes wasserdichtes Y-Kabel mit kombinierter
pH-/Referenzverbindung & ATC-Elektrode.
110-1
pH-Elektrode mit 1 Meter langem Kabel.
115-1
mV-Elektrode mit 1 Meter langem Kabel.
130-1
ATC (Temperatur)-Elektrode mit 1 Meter langem Kabel.
160
pH-Simulatorelektrode
180
pH-Tragekoffer, Hartschale
405
Instrument-Tragetasche, weich
Artikel-Nr. 605367 • Zeichnung-Nr. A605367
Revision A • März 2003
8
GARANZIA
Il misuratore YSI pH100 è coperto da garanzia per un anno dai difetti di manodopera e di materiali a
partire dalla data di acquisto dell'utente finale. Le sonde e i cavi di YSI pH100 sono coperti da
garanzia per sei mesi dai difetti di manodopera e di materiali a partire dalla data di acquisto
dell'utente finale. Durante il periodo di validità della garanzia, Entro il periodo della garanzia, YSI si
assume la responsabilità di riparare o sostituire, a sua discrezione, gratuitamente, qualsiasi prodotto
che YSI ritenga coperto da garanzia.
Per esercitare il diritto alla garanzia, scrivere o contattare il rappresentante di zona YSI, oppure il
Servizio Assistenza Clienti a Yellow Springs, in Ohio. Inviare il prodotto e la prova d'acquisto, con
trasporto a proprio carico, al Centro Assistenza autorizzato scelto da YSI. Una volta effettuata la
riparazione o la sostituzione il prodotto verrà rinviato, sempre con trasporto a proprie spese. I prodotti
riparati o sostituti sono coperti da garanzia per il rimanente periodo di validità della garanzia originale,
o per almeno 90 giorni dalla data di riparazione o sostituzione.
Limitazione della garanzia
Questa garanzia non si applica ai prodotti YSI il cui danno o cattivo funzionamento è dovuto a: (i)
installazione, messa in funzione o utilizzo del prodotto non conformi alle istruzioni scritte di YSI; (ii)
abuso o uso improprio del prodotto; (iii) mancato rispetto delle istruzioni scritte di YSI o delle
procedure standard dell'industria; (iv) eventuali riparazioni improprie del prodotto; (v) utilizzo da parte
dell'utente di parti o componenti impropri o difettosi in fase di manutenzione o riparazione del
prodotto; o (vi) eventuali modifiche del prodotto in modalità non espressamente autorizzate da YSI.
QUESTA GARANZIA SOSTITUISCE TUTTE LE ALTRE, ESPLICITE O IMPLICITE,
COMPRESE QUELLE DI COMMERCIABILITÀ O IDONEITÀ AD UNO SCOPO
PARTICOLARE. LA RESPONSABILITÀ DI YSI SECONDO QUESTA GARANZIA SI LIMITA
ESCLUSIVAMENTE ALLA RIPARAZIONE O ALLA SOSTITUZIONE DEL PRODOTTO CHE
COSTITUIRÀ L'UNICA ED ESCLUSIVA FORMA DI RIMBORSO PER EVENTUALI DIFETTI
COPERTI DA QUESTA GARANZIA. IN NESSUN CASO YSI SARÀ RESPONSABILE DI
EVENTUALI DANNI SPECIALI, INDIRETTI, INCIDENTALI O CONSEQUENZIALI DERIVANTI
DA EVENTUALI DIFETTI DEL PRODOTTO COPERTO DA QUESTA GARANZIA.
REFERENTE
YSI Environmental, Inc. • 1725 Brannum Lane • Yellow Springs, Ohio, 45387
800-897-4151 • 937-767-7241 • Fax: 937-767-1058
E-mail: [email protected] • sito Web: www.ysi.com/environmental
1
INDICE
GARANZIA ...................................................................................................... 1
REFERENTE................................................................................................... 1
INTRODUZIONE GENERALE ........................................................................ 3
ISPEZIONE INIZIALE...................................................................................... 3
TENUTA STAGNA .......................................................................................... 3
INSTALLAZIONE DELLA BATTERIA.............................................................. 4
FUNZIONI CHIAVE DEL MODELLO pH100................................................... 4
IL DISPLAY LCD ............................................................................................. 4
PROCEDURE DI FUNZIONAMENTO ............................................................ 5
Selezione della tabella buffer ..................................................................... 5
Calibrazione pH.......................................................................................... 5
Utilizzo del simulatore dell'elettrodo modello pH160 .................................. 6
Misurazioni pH............................................................................................ 6
Misurazioni della temperatura .................................................................... 6
Misurazioni mV........................................................................................... 6
INDIVIDUAZIONE E RISOLUZIONE DEI PROBLEMI.................................... 7
SPECIFICHE ................................................................................................... 8
ELENCO DEI PEZZI DI RICAMBIO RACCOMANDATI.................................. 8
2
INTRODUZIONE GENERALE
Il modello pH100 è uno strumento di precisione che misura pH, mV e la temperatura. Un
microprocessore incorporato memorizza, calcola e compensa tutti i parametri relativi alle
determinazioni del pH comprese le caratteristiche della temperatura dell'elettrodo pH, le
deviazioni di pendenza dell'elettrodo e le soluzioni buffer.
Questa unità ha un alloggiamento IP65 a tenuta stagna. I tasti a sfioramento meccanico sono
estremamente affidabili grazie alla conferma di azionamento tattile e acustica. Questo
misuratore utilizza una batteria da 9V. Quando viene ripristinata l'alimentazione non è richiesta
alcuna ricalibrazione.
La parte anteriore del misuratore presenta un ampio display LCD che visualizza
simultaneamente pH o mV e la temperatura insieme ai prompt per l'utente e agli indicatori di
modalità. L'unità avvisa l'utente attraverso procedure di calibrazione e di misurazione.
Una funzione AUTOLOCK per le misurazioni pH e mV consente all'unità di rilevare
automaticamente il punto finale e di "bloccare" il display per indicare il valore del punto finale di
una misurazione. È possibile utilizzare pH100 anche in modalità non-AUTOLOCK. La funzione
AUTOLOCK e i prompt per l'utente aiutano a eliminare la maggior parte degli errori di
determinazione dei valori pH e mV, effettuando misurazioni precise, riproducibili e senza errori.
Il modello pH100 è disponibile con le sonde pH, mV, ORP e ATC (CAT: Compensazione
automatica della temperatura). Le altre funzioni includono il riconoscimento offset dell'elettrodo,
quello della pendenza dello stesso, il display di rendimento dell'elettrodo, i coefficienti del buffer
incorporati, la compensazione automatica o manuale della temperatura, una lunga durata utile
della batteria e un filtraggio CA 50/60 Hz. Questo misuratore è universale, di facile utilizzo, per
applicazioni su campo, industriali e di laboratorio.
ISPEZIONE INIZIALE
Disimballare accuratamente l'unità e gli accessori e valutare la presenza di eventuali danni da
trasporto. Controllare se i pezzi ricevuti corrispondono ai materiali elencati nella distinta di
spedizione. Informare immediatamente YSI di eventuali parti danneggiate o mancanti.
Conservare tutti i materiali di imballaggio fino al corretto funzionamento.
TENUTA STAGNA
Sebbene il misuratore pH100 sia montato in un alloggiamento a tenuta stagna, NON utilizzarlo
sott'acqua. L'alloggiamento a tenuta stagna impedisce danni permanenti all'unità nel caso cada
accidentalmente in soluzioni non corrosive. Seguire immediatamente queste procedure se l'unità
viene immersa in qualsiasi tipo di soluzione:
1.
Risciacquare accuratamente l'unità con acqua distillata. Dopo il risciacquo e l'asciugatura,
ispezionare e pulire i connettori per rimuovere tutte le eventuali sostanze contaminanti che
potrebbero danneggiare i collegamenti della sonda.
2.
Attendere che l'unità e la sonda siano completamente asciutte prima di riprendere il
funzionamento.
3.
Se l'unità non funziona correttamente dopo le fasi 1 e 2, rivolgersi a YSI per eventuali
riparazioni o per la sostituzione (vedere Garanzia).
3
INSTALLAZIONE DELLA BATTERIA
Un messaggio iniziale di “BAT” sul display indica un tempo residuo di
funzionamento a batteria pari a circa un'ora, entro le specifiche. Sostituire
la batteria quando sul display appare “BAT”. (Vedere Figura 1.)
Per la sostituzione, rimuovere i due coprivite della batteria, il dispositivo di
copertura della batteria e l'o-ring. Sostituire la batteria da 9V. Rimettere il
dispositivo di copertura della batteria e l'o-ring (allineare l'o-ring
correttamente per garantire un'adeguata chiusura) e stringere i due
coprivite della batteria per conservare l'ermeticità.
FUNZIONI CHIAVE DEL MODELLO pH100
Figura 1
Installazione della
batteria
1.
: Accende e spegne l'unità. I valori di calibrazione del pH non si cancellano quando l'unità
viene spenta. Una volta riattivata, l'unità presenta lo stesso stato di quando è stata spenta.
Quando l'unità non è in uso, spegnerla per prolungare la durata utile della batteria. Per un
immagazzinaggio a lungo termine, rimuovere le batterie.
2.
MODALITÀ: seleziona la modalità display. Premere MODE per visualizzare in successione
pH-AUTOLOCK , mV-AUTOLOCK , pH, e mV. I valori di calibrazione non vengono
influenzati dal cambiamento di modalità del display.
3.
Tasti STAND e SLOPE: utilizzati per una calibrazione pH a doppio punto dell'unità.
Mantenere premuto STAND durante l'accensione per modificare le impostazioni del buffer.
4.
Tasti ∆ e ∇: premere per inserire i valori della temperatura in modalità (MAN) manuale.
Questi tasti sono inattivi in modalità ATC.
5.
MEA./EFF.: Premere per disabilitare lo stato AUTOLOCK quando si opera in modalità pHAUTOLOCK o mV-AUTOLOCK. Mantenere premuto per 5 secondi per visualizzare il
rendimento dell'elettrodo.
6.
ESC: premere per azzerare l'unità quando appare un segnale di errore; questo azzera tutti i
valori di calibrazione conservati nella memoria interna. Per prevenire azzeramenti
accidentali durante il normale utilizzo, il tasto non risponde a meno che non venga premuto
per 2 secondi. Il tasto risponde solo quando viene visualizzato un messaggio di errore.
Quando viene premuto ESC, tutti gli elementi LCD si illuminano. Dopo circa 2 secondi,
l'unità entra in modalità pH-AUTOLOCK. Si visualizza “AUTOLOCK” e “STAND” comincia a
lampeggiare indicando la necessità della calibrazione. Premere ESC esclusivamente
quando si verificano errori che richiedono la ricalibrazione dell'unità.
IL DISPLAY LCD
1.
WAIT: si visualizza quando l'unità è in
attesa di una lettura stabile o di un
rilevamento del punto finale.
2.
BAT: indicatore di batteria scarica.
3.
ATC/MAN: si visualizza “ATC” se una
sonda ATC è collegata.. Altrimenti si
visualizza "MAN".
4.
STAND/SLOPE: “STAND” o “SLOPE”
rimane stabile se il parametro è stato
calibrato. Se uno dei due non è stato
calibrato, questo lampeggia.
5.
Figura 2. Display LCD
AUTO: indicatore della modalità Autolock .
4
6.
HOLD: indica che una lettura è congelata durante la modalità Autolock.
7.
EFF%: si visualizza quando l'utente visualizza il rendimento dell'elettrodo. Si raccomanda di
sostituire l'elettrodo quando il rendimento è inferiore al 75%.
8.
pH/mV: unità e indicatori di modalità.
9.
Il display principale per i valori pH, mV e di rendimento della sonda.
10. °C: display della temperatura.
PROCEDURE DI FUNZIONAMENTO
Selezione della tabella buffer
Questa unità ha due impostazioni buffer: 7.00,4.01,10.01pH e 6.86,4.00,9.18pH. Per modificare
l'impostazione del buffer, spegnere l'unità, quindi tenere premuto STAND durante la
riaccensione dell'unità. Se l'unità non è calibrata e in modalità pH, si visualizza "7,00" se la
prima impostazione è attiva e "6,86" se è la seconda quella attiva.
Calibrazione pH
Il pH100 utilizza una calibrazione del 2-punto. Il primo punto deve essere un buffer 6,86/7,00 e
il secondo uno di 4,00/4,01 o 9,18/10,01. È possibile acquistare questi buffer presso il
rappresentante di zona YSI.
1.
Accendere l'unità. Collegare l'elettrodo pH al connettore BNC e la sonda ATC/Temp al
connettore ATC/Temp dell'unità; si visualizza "ATC". Premere MODE fino a quando non si
visualizza "pH". Autolock potrebbe essere acceso o spento, come si desidera.
2.
AUTOLOCK ON: posizionare le sonde pH e ATC/temp nella soluzione del primo buffer
(7,00 o 6,98). Consentire la stabilizzazione delle letture della temperatura, quindi premere
"STAND" per calibrare. Se AUTOLOCK è off, il primo punto è stato calibrato. Se
AUTOLOCK è on, "WAIT" lampeggia fino a quando l'unità non rileva una lettura stabile.
Dopo che l'unità ha calibrato il primo punto, "STAND" si visualizza stabilmente e "SLOPE"
lampeggia.
NOTA: se non è collegata alcuna sonda della temperatura, regolare la lettura della
temperatura in base a quella del primo buffer utilizzando i tasti ∆ o ∇ (0,0 a 60ºC) PRIMA di
premere "STAND".
3.
Risciacquare le sonde pH e ATC/temp in acqua distillata, quindi immergerle nella soluzione
del secondo buffer (4,01/4,00 o 10,01/9,18). Consentire la stabilizzazione delle letture della
temperatura, quindi premere "SLOPE" per calibrare. Se AUTOLOCK è off, il secondo
punto è stato calibrato. Se AUTOLOCK è on, "WAIT" lampeggia fino a quando l'unità non
rileva una lettura stabile. Una volta che l'unità calibra il secondo punto, "STAND" e
"SLOPE" si visualizzano stabilmente.
NOTA: se la sonda della temperatura non è collegata, regolare la lettura della temperatura
in base a quella del primo buffer utilizzando i tasti ∆ o ∇ (0,0 a 60ºC) PRIMA di premere
"SLOPE".
4. L'unità calcola e compensa per la deviazione della pendenza dell'elettrodo pH
corrispondente ai valori dei due buffer della calibrazione. L'unità è adesso calibrata a
doppio punto e pronta per le misurazioni. Dopo la calibrazione, tenere premuto MEA. /EFF.
per 5 secondi per visualizzare il nuovo rendimento dell'elettrodo.
5
Utilizzo del simulatore dell'elettrodo modello pH160
È possibile utilizzare il Simulatore dell'elettrodo pH160 per confermare la giusta calibrazione del
misuratore. Per utilizzare il simulatore:
1. Installare la batteria da 9V in dotazione.
2.
Fissare pH160 a pH100. Accendere entrambe le unità. Il pH160 presenta un piccolo
interruttore sulla destra dei pulsanti pH.
3.
In modalità misurazione pH, premere uno dei pulsanti del simulatore buffer pH sul pH160. Il
valore pH corrispondente appare su entrambi gli schermi.
Nota: la calibrazione con il simulatore pH calibra esclusivamente il misuratore - NON il
misuratore e la sonda. Per una maggiore precisione, calibrare il misuratore pH e la sonda
insieme utilizzando le soluzioni buffer.
Misurazioni pH
Per effettuare misurazioni di pH, "STAND" e "SLOPE" devono essere visualizzati in maniera
stabile, indicando che l'unità è calibrata a doppio punto e pronta per le misurazioni. Se
"STAND" e "SLOPE" lampeggiano, eseguire una calibrazione pH prima di eseguire le
misurazioni.
1.
Premere MODE per inserire la modalità pH con AUTOLOCK on o off come desiderato. Per
campioni intrinsecamente instabili, l'unità non passerà in AUTOLOCK. Disattivare
AUTOLOCK in questo caso.
2. Risciacquare l'elettrodo pH e/o la sonda ATC/temp con acqua distillata e immergere nel
campione da misurare. Rimuovere eventuali bolle d'aria intrappolate intorno alla sonda
agitando o muovendo la sonda. Consentire la stabilizzazione del pH e/o della temperatura.
Se non è collegata alcuna sonda ATC/temp, si visualizza "MAN", ad indicare la
compensazione della temperatura manuale. Impostare l'unità per visualizzare la
temperatura del campione premendo i tasti ∆ e ∇ (-10,0 a 120°C). Se è collegata una
sonda ATC/temp, si visualizza "ATC", insieme alla temperatura del campione.
3. Se AUTOLOCK è off, il valore pH del campione si visualizza sullo schermo. Se entrambe le
letture del pH e della temperatura sono stabili, effettuare una lettura. Se AUTOLOCK è on,
premere MEA./EFF. "WAIT" lampeggia fino a quando l'unità determina una lettura pH
stabile.
Misurazioni della temperatura
Il modello pH100 può misurare la temperatura indipendentemente con la sonda ATC/Temp
senza utilizzare l'elettrodo pH. Posizionare la sonda ATC/Temp nel fluido da misurare. Si
visualizza la temperatura misurata.
Misurazioni mV
1.
Collegare l'elettrodo mV di combinazione opzionale all'unità. Premere MODE per inserire la
modalità mV con AUTOLOCK on o off come desiderato. Per campioni intrinsecamente
instabili, l'unità non passerà in AUTOLOCK. Utilizzare la modalità mV con AUTOLOCK off
in questo caso.
2.
Risciacquare l'elettrodo con acqua distillata e immergerlo nel campione da misurare. Se
AUTOLOCK è off, il valore mV del campione viene visualizzato sullo schermo. Se
AUTOLOCK è on, premere MEA./EFF. "WAIT" lampeggia fino a quando l'unità determina una
lettura mV stabile.
6
INDIVIDUAZIONE E RISOLUZIONE DEI PROBLEMI
DISPLAY
PRINCIPALE
Er 1
POSSIBILE CAUSA
• L'offset dell'elettrodo pH è
maggiore/inferiore rispetto a +/- 1,5
pH
• STAND era stato premuto prima
dell'elettrodo e la sonda ATC/Temp
regolata all’interno dello ±1,5 pH del
valore del buffer.
AZIONE CORRETTIVA
• Sostituire il buffer e/o l'elettrodo
del pH. Premere ESC.
• Consentire un tempo sufficiente
di stabilizzazione per l'elettrodo
e la sonda ATC/Temp.
• Restituire all'assistenza.
• l'elettrodo pH è difettoso
Er 2
• La pendenza dell'elettrodo pH devia
oltre il 30% della pendenza ideale.
• SLOPE era stato premuto prima
dell'elettrodo e la sonda ATC/Temp
regolata all'interno del 30% del valore
del buffer.
• Buffer 4,00, 4,01, 9,18 o 10,01 non è
corretto.
• Controllare che venga utilizzato
il buffer corretto e che la
pendenza dell'elettrodo non
devii oltre il 30% dalla
pendenza teorica.
• Consentire un tempo sufficiente
di stabilizzazione per l'elettrodo
e la sonda ATC/Temp.
• Sostituire il buffer e/o l'elettrodo
del pH. Premere ESC.
• Restituire all'assistenza.
Er 3
• La temperatura è fuori dall'intervallo
0,0 - 60,0 °C.
• Portare la temperatura del
buffer nell'intervallo.
• Restituire all'assistenza.
OvEr/Undr
• Il pH misurato è fuori dall'intervallo
16,00/-2,00 pH.
• L'mV misurato è fuori dall'intervallo
1250/-2000 mV.
• La temperatura misurata è fuori
dall'intervallo 10/120 °C.
7
• Portare l'unità fuori
dall'intervallo in quello di
misurazione corretto.
• Se le unità sono nell'intervallo
giusto, restituire il prodotto
all'assistenza.
SPECIFICHE
Display
pH
mV
Temperatura °C
Intervallo
-2,00 – 16,00 pH
-1999 – 1250 mV
-10,0 - 120 °C
Precisione
±0,1%, ±2 lsd
±0,1%, ±1 lsd
±0,5 °C
Risoluzione
0,01 pH
1 mV
0,1 °C
Compensazione Temp pH
AUTO/MANuale –10,0 – 120,0 °C
Riconoscimento buffer pH
(4,01, 7,00 e 10,01) o (4,00, 6,86 e 9,18)
Temp. calibrazione buffer pH
Intervallo
0 - 60 °C
Riconoscimento offset elettrodo
pH
±90mV a pH 7,00 o 6,86
Riconoscimento pendenza
elettrodo pH
±30% a pH 4,00, 4,01, 9,18 o 10,01
Potenza
Una batteria da 9V
Back up di calibrazione
Sì
Feedback audio
Sì, su tutti i tasti a sfioramento
Funzione Autolock
Sì
Intervallo temp. di funzionamento
0 - 50 °C
Intervallo di umidità relativa al
funzionamento
fino al 95%
Sonda ATC
Termistore, 10kΩ / 25 °C
Dimensioni (L x P x A)
86 mm x 241 mm x 72 mm (3 in x 9,5 in x 2,8 in)
Peso (batterie incluse)
430 grammi (1 lb)
ELENCO DEI PEZZI DI RICAMBIO RACCOMANDATI
N. PEZZO
DESCRIZIONE
100-1
cavo Y da 1 metro resistente all'acqua con combo pH/giunto freddo ed
elettrodi ATC.
100-4
cavo Y da 4 metri resistente all'acqua con combo pH/giunto freddo ed
elettrodo ATC.
110-1
elettrodo pH con cavo da 1 metro.
115-1
elettrodo mV con cavo da 1 metro.
130-1
elettrodo ATC (temperatura) con cavo da 1 metro.
160
elettrodo simulatore pH.
180
contenitore per il trasporto pH, rigido.
405
Contenitore per il trasporto del misuratore, morbido.
N. di pezzo 605367 • N. disegno A605367
Revisione A • marzo 2003
8
Title: Pembroke QAPP Amendment
Amendment Number: 1
Revision Date: 5/5/2010
Page 2 of 18
1.2.
Table of Contents
1.1.
1.2.
1.3.
1.4.
1.5.
1.6.
1.7.
1.8.
1.9.
2.1.
2.2.
2.3.
2.4.
2.5.
2.6.
2.7.
2.8
2.9.
2.10.
3.1.
3.2.
4.1.
4.2.
4.3.
4.4.
Section
Page
Title Page .............................................................................................................................1
Table of Contents .................................................................................................................2
Distribution List ...................................................................................................................3
Project / Task Organization .................................................................................................3
Problem Definition/Background ..........................................................................................3
Project / Task Description ....................................................................................................4
Data Quality Objectives for Measurement Data ..................................................................7
Training Requirements / Certification .................................................................................9
Documentation and Records ................................................................................................9
Sampling Process Design ...................................................................................................10
Sampling Method Requirements........................................................................................10
Sample Handling and Custody Requirements ...................................................................10
Analytical Methods Requirements .....................................................................................11
Quality Control Requirements ...........................................................................................11
Equipment Testing, Inspection, and Maintenance Requirements ......................................11
Instrument Calibration and Frequency Requirements .......................................................11
Inspection / Acceptance Requirements of Supplies and Consumables .............................11
Data Acquisition Requirements .........................................................................................11
Data Management ..............................................................................................................12
Assessment and Response Actions ....................................................................................12
Reports ...............................................................................................................................13
Data Review, Verification, and Validation Requirements.................................................15
Validation and Verification Methods.................................................................................17
Reconciliation with Data Quality Objectives ....................................................................18
Literature Cited ..................................................................................................................18
List of Tables
Table
1.6-1
1.6-2
2.1-1
3.2-1
4.2-1
Page
Project Milestone Schedule..................................................................................................7
Criteria and Prioritization ....................................................................................................8
Sample Locations ...............................................................................................................10
Reports to Management .....................................................................................................13
Validation and Verification Procedures .............................................................................17
Furnace and Oldham Pond Watershed Restoration Plan
Title: Pembroke QAPP Amendment
Amendment Number: 1
Revision Date: 5/5/2010
Page 3 of 18
1.3.
Distribution List
A complete project distribution list is provided in Section 3, Distribution List of the draft QAPP.
1.4.
Project / Task Organization
Project / Task Organization is provided in Section 4, Project Organization and Responsibilities of
the draft QAPP.
1.5.
Problem Definition/Background
The Town of Pembroke, Massachusetts has a number of ponds within its boundaries. Two of
these ponds, Oldham Pond and Furnace Pond have significant water quality problems with
Oldham Pond listed as Category 4c for exotic species on the Massachusetts 303(d) list of
impaired waters and Furnace Pond listed as Category 5 for organic enrichment and low dissolved
oxygen. Oldham Pond is approximately 220-acres in size, approximately eight feet deep, and
directly feeds Furnace Pond. Furnace Pond is approximately 96-acres in size and approximately
twelve feet deep. Historic water quality data for both ponds indicates significantly high total
phosphorus levels and turbidity likely lending to the excessive nuisance aquatic weeds and algal
blooms. Located in a relatively developed watershed, the shoreline of these ponds is dotted with
full-time residences and several commercial businesses.
Previous studies include a Diagnostic Feasibility Study completed in 1993 for both Furnace and
Oldham Ponds. This study was completed under MGL Chapter 628, the Massachusetts Clean
Lake Program that existed at that time. Extensive water quality data in this survey indicates that
Oldham and Furnace have high levels of nutrient enrichment and invasive aquatic vegetation.
Both ponds were also found to have stormwater impacts, although at the time the study’s
recommendations said little about how to specifically deal with stormwater contamination. The
study did recommend leaching catch basins for the Furnace Pond drainage area. A subsequent
study of Oldham Pond was completed under the Department of Environmental Management’s
(DEM now DCR) Lakes Program in the year 2000 (Comprehensive Environmental, Inc., 2000)
while Furnace was completed under the same program in 2001 (Comprehensive Environmental,
Inc., 2001). These studies included additional sampling data and updated recommendations
based on the advancement of stormwater technologies at the time.
As a result of these studies, beginning in 2001, the Town received and successfully completed
several MassDEP/EPA s.319 Nonpoint Source Pollution grant projects. Projects concentrated on
the lower reaches of the watershed by retrofitting 27 catch basins with leaching basins and using
a vacuum street sweeper adjacent to the ponds. More recently, the Town worked with the North
and South Rivers Water Association (NSRWA), the Pembroke Watershed Association (PWA)
and CEI to engineer and construct several Low Impact Development (LID) retrofit projects at the
Oldham Pond boat ramp and Town Hall. Since 2006, the PWA has collected significant water
quality data from both ponds and in 2008 began data collection under an approved Quality
Assurance Project Plan.
As the studies approach the 10 year mark, the Town and the PWA would like to prepare an
update that will evaluate watershed improvements completed to date, allow for the incorporation
of more recent development and water quality testing and provide more specific BMP
recommendations with quantifiable results to help guide future restoration efforts. Stakeholders
Furnace and Oldham Pond Watershed Restoration Plan
Title: Pembroke QAPP Amendment
Amendment Number: 1
Revision Date: 5/5/2010
Page 4 of 18
include the Town of Pembroke, watershed residents, citizens utilizing the public beach for
recreational purposes and swimming lessons and the dedicated members of the PWA.
Additionally, Furnace Pond (fed by Oldham Pond) is a back-up drinking water supply for the
City of Brockton. Stakeholders aim to gain over the next 10-years improved water quality to
Oldham and Furnace Pond, specifically reduced phosphorus and sediment inputs therefore
reducing algal blooms and nuisance aquatic weeds and decreasing fish kill events currently
resulting from low DO.
The South Coastal Watershed Action Plan identifies Furnace Pond as a waterbody in critical
condition with the pond having lost much of its depth to excessive eutrophication and filling in
with soft sediments. It indicates a great need for restoration (along with Oldham) and is being
limited recreationally by lack of depth. Low DO has stressed conditions for fish and other
species using the pond. The Action Plan indicates that 1) dredging should be high on the list of
remediation actions to remove existing phosphorus that is recycling in the pond and 2) it calls for
immediate corrective actions to stop inputs of untreated stormwater. The Town, PWA and CEI
recently completed a Dredging Feasibility Study for Furnace Pond and are currently completing
a hydrologic analysis related to potential dredging impact to groundwater. With this effort
already underway, the proposed project will address the second issue outlined in the Action Plan
which will prioritize restoration efforts in a long-term plan for both Oldham and Furnace Pond.
1.6.
Project / Task Description
The primary purpose of the proposed project is to develop a long-term watershed restoration plan
for both Oldham and Furnace Pond by utilizing a quantitative approach. This approach will
prioritize future watershed protection activities to obtain the most cost effective pollutant
removal, while estimating the anticipated improvements. The study will focus on where the
pollutants, in this case phosphorus, are coming from and how much of it needs to be removed
under existing and buildout conditions to reduce in-lake phosphorous levels to meet recreational
goals. Ultimately, the Town of Pembroke can use the plan to implement the most cost-effective
BMPs to meet water quality goals and to obtain future funds under the s319 grant program for
implementation.
A task-by-task approach is as follows:
Objective / Task #1: Amended Quality Assurance Project Plan (QAPP)
The Pembroke Watershed Association currently collects water quality data within the Oldham
and Furnace Pond watersheds under an approved December 31, 2007 Quality Assurance Project
Plan (QAPP). This QAPP will be amended to incorporate the proposed water quality modeling to
be performed under this project as described under Task 4 and any changes to the existing
monitoring program discussed under Task 2. Currently approved QAPP is attached.
Objective / Task #2: Implement Monitoring Program
The Pembroke Watershed Association has been collecting water quality data from Oldham and
Furnace Ponds between 2008 and the present at four locations within Oldham Pond and three
locations within Furnace Pond under the above referenced approved QAPP. The new study will
modify the sampling locations such that five locations within Oldham Pond and two within
Furnace Pond will be sampled. Monthly samples are collected between June and September and
Furnace and Oldham Pond Watershed Restoration Plan
Title: Pembroke QAPP Amendment
Amendment Number: 1
Revision Date: 5/5/2010
Page 5 of 18
analyzed for pH, temperature, dissolved oxygen (DO), conductivity, salinity, total phosphorus,
alkalinity, chloride and turbidity. Additionally, Secchi disk readings are taken at all locations
during all sampling rounds and nitrite nitrogen, nitrate nitrogen, TKN, and ammonia nitrate are
analyzed once per year.
Currently, grab samples are taken at a depth of 48 inches. The YSI /pH instrument measurements
are conducted at a depth of 48 inches and 84 inches to obtain a profile of the pond and determine
if the pond stratifies. Sampling in Oldham and Furnace Ponds will involve collecting temperature
and dissolved oxygen data at two-foot intervals at each deep hole location. If stratification is
found to occur, two phosphorus samples will be collected, one from the epilimnion layer
(surface) and one from the hypolimnion layer (bottom). All test parameters listed above are
evaluated and compared to state standards and when applicable US EPA nutrient criteria. The
information collected will be used as base line data against which to assess future changes.
Objective / Task #3: Field Reconnaissance
A windshield survey of the watershed will be performed to review changes in the watershed that
have occurred since the 2000 and 2001 studies and to identify specific pollution sources that may
require more attention in the proposed modeling and possible sites for BMP locations.
Objective / Task #4: Pollutant Modeling & Buildout Analysis
Phosphorus loadings were previously estimated in the 2000 and 2001 pollution source
investigation studies using a simplistic loading model based on impervious surfaces. The purpose
was to identify the subwatersheds with the greatest loadings to help target BMPs. While it did
allow for comparisons of subwatersheds, it was not calibrated to existing water quality data
within the watershed. These loadings will be updated based on more recent land use data and
land use based loading coefficients for phosphorus.
The subwatersheds for each pond were delineated under the 2000 and 2001 studies based on
topography and locations of inlets to the ponds. The use of subwatersheds allows the pollutant
loadings to be broken up based on key subwatershed features, which allows for easier
prioritization of needed actions by focusing on those areas that require the most attention.
In conjunction with the field sampling measures at Furnace and Oldham Ponds, a land use based
model and a lake response model utilizing subwatershed characteristics and the Simple Method
to model pollutant loadings. Modeling will be performed for both existing conditions and
buildout conditions, while also roughly estimating how much of the load might be corrected
through specific measures. Existing land uses within the watershed will be obtained through
MassGIS files and local GIS information as available and input into the model to estimate
phosphorus loads from the watershed. The model will account for loadings associated with
stormwater runoff from each type of land use as well as septic systems within proximity of the
ponds. Other inputs such as flow from active cranberry bogs, phosphorus from internal recycling
and phosphorus from baseflow will also be estimated for use in the model. The modeling effort
will be supported by a windshield survey of the watershed to review changes in the Furnace and
Oldham Pond watersheds that have occurred since the 2000 and 2001 studies and to identify
specific pollution sources that may require more attention in the proposed modeling and possible
sites for BMP locations.
Furnace and Oldham Pond Watershed Restoration Plan
Title: Pembroke QAPP Amendment
Amendment Number: 1
Revision Date: 5/5/2010
Page 6 of 18
A buildout scenario will be prepared by overlaying existing land use with existing zoning and
accounting for development restrictions such as protected lands and wetlands. The anticipated
lands uses at buildout will be input into the model to determine loadings under buildout
conditions. The buildout scenario will be used to develop load reduction measures necessary to
meet water quality goals.
Objective / Task #5: Identify Load Reduction Measures
Realistic, achievable water quality goals that promote the recreational and wildlife use of the
ponds will be set for phosphorus within the ponds. The required load reduction to meet these
goals under existing and buildout conditions will be calculated using the lake response model
established under Task 4.
Based on the needed reductions and available watershed information, specific BMPs will be
identified to reduce phosphorus loadings to the desired levels. Load reduction measures to be
reviewed may include:
a. Site-specific improvements such as runoff controls for specific areas identified during the
watershed review
b. Septic system improvements or changes to ordinances – increased pumping, replacement
of failing systems, etc.
c. Use of Low Impact Development (LID) to retrofit existing development
d. Use of LID for new projects (how to encourage/incentivize/regulate LID)
e. Street sweeping and maintenance of catch basins and other stormwater controls
f. Public education improvements and focus
g. In-lake measures where applicable
h. Other measures
i. Invasive species controls
ii. Erosion controls
iii. Regular monitoring program to evaluate trends – flows and water quality
Objective / Task #6: Watershed Restoration Plan
A draft and final watershed restoration plan will be prepared outlining the findings from the
above tasks and including recommendations for proposed BMPs to meet the defined water
quality goals. Costs and phosphorus removal will be defined for each recommended BMP and
presented as cost per pound of phosphorus removed. Recommendations will be prioritized and a
10-year implementation schedule will be performed. Recommendations will be presented in a
user friendly format, clearly identifying the steps needed to implement the recommendations
with milestones, along with the objectives, responsibility, cost and potential funding sources for
each recommended BMP.
Criteria that will be used to prioritize areas for future site BMPs or watershed restoration will
include the extent of water quality impacts from each tributary, type of pollutant being
remediated, will the BMP adequately promote stormwater awareness, area required to construct a
BMP that sufficiently treats stormwater, property ownership, cost to implement or construct
BMP, maintenance responsibilities and associated costs. Criteria will then be weighted for each
area based on associated benefits. Areas with the highest ranking will be the highest priority
locations.
Furnace and Oldham Pond Watershed Restoration Plan
Title: Pembroke QAPP Amendment
Amendment Number: 1
Revision Date: 5/5/2010
Page 7 of 18
Objective / Task #7: Prepare Engineering Designs
Engineering designs will be prepared for the top 3-5 structural improvements identified for
future submittal for s.319 grant funding. Engineering drawings to a 30% level and estimated
construction costs will be prepared.
Objective / Task #8: Reporting
Monthly project status reports will be prepared and submitted to MassDEP per the new ARRA
reporting requirements. Additionally, quarterly invoices will be submitted as well as a final
project report per grant guidelines and required copies. Table 1.6-1 outlines the project
schedule.
Table 1.6-1. Project Milestone Schedule
1.7.
x
x
x
x
x
x
Mar 2011
x
x
x
x
x
x
x
x
x
Feb 2011
x
Jan 2011
x
Dec 2010
x
Nov 2010
x
x
Oct 2010
x
x
Sep 2010
x
Aug 2010
x
Jul 2010
x
Jun 2010
x
May 2010
Mar 2010
x
Apr 2010
Feb 2010
Task 1:
QAPP
Task 2:
Monitoring
Program
Task 3:
Field
Reconnaissance
Task 4:
Pollutant
Modeling
Task 5:
Load Reduction
Measures
Task 6:
Watershed
Restoration Plan
Task 7:
Prepare
Engineering
Designs
Task 8:
Reporting
Month
Jan 2010
Task
Description
x
x
x
x
x
x
x
x
x
Data Quality Objectives for Measurement Data
The primary purpose of this project is to develop a long-term watershed restoration plan for both
Oldham and Furnace Pond by utilizing a quantitative approach. This approach will prioritize
future watershed protection activities to obtain the most cost effective pollutant removal, while
estimating the anticipated improvements. The study will focus on where the pollutants are
coming from and how much need to be removed under both existing and buildout conditions to
reduce in-lake phosphorus levels to meet recreational goals.
Furnace and Oldham Pond Watershed Restoration Plan
Title: Pembroke QAPP Amendment
Amendment Number: 1
Revision Date: 5/5/2010
Page 8 of 18
Criteria that will be used to prioritize areas for future site BMPs or watershed restoration will
include the extent of water quality impacts addressed, type of pollutant being remediated, public
visibility and awareness, area required to construct a BMP that sufficiently treats stormwater,
property ownership issues, cost to implement or construct BMP, and maintenance frequency and
costs. Criteria will then be weighted for each area based on associated benefits. Areas with the
highest ranking will be the highest priority locations. Each BMP location will be prioritized
based on the previously mentioned criteria ranked as follows:
Table 1.6-2. Criteria and Prioritization
Point
Value
Water
Quality
Impact
Addressed
Type of
Pollutant
Addressed
3
Large
Improvement
Expected
Phosphorus
2
Moderate
Improvement
Expected
Nitrogen /
Dissolved
Oxygen
1
Minimal
Improvement
Expected
Turbidity
and Other
Pollutants
Public
Visibility
and
Awareness
High
Visibility
(downtown,
high profile)
Medium
Visibility
(e.g.
secondary
road)
Low
Visibility
(e.g. woods,
underground
BMP)
Area
Required
Minimal
Area
Required
(<0.25
acres)
Medium
Area
Required
(0.25 - 1
acre)
Large
Area
Required
(>1 acre)
Property
Ownership
Issues
Cost of
Design and
Construction
Owned by
Town,
Undeveloped
Highly Cost
Effective
Low (>5 year
frequency /
low cost)
Owned by
Other,
Undeveloped
Moderately
Cost
Effective
Medium (2- 5
year
frequency /
moderate
cost)
Developed
Land
Minimally
Cost
Effective
High (<1 - 2
year
frequency /
high cost)
Maintenance
Concerns
Values and criteria may change from the above-mentioned parameters, and any changes made
will be detailed in the final report.
• Water Quality Impact Addressed: BMPs that are expected to provide a larger water
quality improvement as outlined in the Massachusetts Stormwater Handbook will rank
highest whereas those providing a smaller improvement will rank lower.
• Type of Pollutant Addressed: pollutants of primary concern and those referenced on the
303(d) List of Impaired Waters rank highest. More than one selection is possible.
• Public Visibility and Awareness: BMPs constructed in highly visible areas and those that
offer public education opportunities (e.g. raingardens, gravel wetland), rank highest
whereas those in a less public place or located underground (e.g. swirl separators) rank
lower.
• Area Required: BMPs that require a smaller area rank highest whereas those requiring a
larger area rank lower.
• Available Property / Ownership Issues: property that is either already town-owned or
easily acquired will rank highest whereas areas that have no room for development will
rank lower.
• Cost of Construction: BMPs which are cheapest to design and construct will rank
highest, whereas more expensive BMPs will rank lower.
Furnace and Oldham Pond Watershed Restoration Plan
Title: Pembroke QAPP Amendment
Amendment Number: 1
Revision Date: 5/5/2010
Page 9 of 18
•
Maintenance Concerns: BMPs which require less frequent maintenance, or maintenance
is not expected to be costly will rank highest, whereas those requiring more frequent or
expensive maintenance will rank lower.
Data will be used to assess the most appropriate sites for structural BMP construction in terms of
the beneficial impact on surface water quality. MA DEP will use the data to assess the
performance of projects it funds through their respective grant programs. The data will also be
available to other interested parties, such as the Pembroke Watershed Association, and for
regional reporting purposes. Model calibration, validation, sensitivity and uncertainty are
described in Sections 4.1 and 4.2 of the QAPP.
Field data quality objectives are consistent with measures described under a previously approved
QAPP and are provided under Section 7, Data Quality Objectives of the QAPP. Both Data
Completeness tables were updated to reflect 5 proposed sites in Oldham Pond and 2 proposed
sites at Furnace Pond.
1.8.
Training Requirements / Certification
Field training methods for sampling by the PWA are provided under Section 8, Training
Requirements of the QAPP. Modeling will be done by Comprehensive Environmental. Staff
familiar with both landuse and lake response models will perform modeling, including
calculations, coefficient approximations, and accuracy checks. Although no special training is
required to perform modeling, experienced personnel with knowledge of the underlying
principles of the model will oversee development and application of the spreadsheet model used
in this study.
1.9.
Documentation and Records
Detailed documentation and records are provided in Section 9, Documentation and Records of
the QAPP. Documentation of this project will be kept on file by the MA DEP, the Town of
Pembroke, Pembroke Watershed Association, and Comprehensive Environmental Inc. (CEI).
The Modeling Coordinator will be responsible for assembling and maintaining project
documents and records. Modeling data will be stored in a Microsoft Excel spreadsheet.
Summary data will be tabulated into various tables and graphs and presented in the draft and
final reports. Maps generated from MassGIS, aerial, and other data sources will be stored in an
electronic format. Hard copies will be included in the final report. Other aspects of the
modeling effort will be documented in a narrative and stored in Microsoft Word format.
Monthly and quarterly reports will document work from the most recent reporting round. The
final report will document procedures and findings for the entire project. All reports will be
submitted to the Town of Pembroke, Pembroke Watershed Association, EPA and MA DEP for
approval. The central storage location for all final project deliverables is the Comprehensive
Environmental office in Marlborough, MA. Files will be maintained at this location for a
minimum period of 5 years. Electronic files will be stored on servers at Comprehensive
Environmental. Servers are secure and backed up several times per week. Electronic data will
be stored for a minimum of five years.
Furnace and Oldham Pond Watershed Restoration Plan
Title: Pembroke QAPP Amendment
Amendment Number: 1
Revision Date: 5/5/2010
Page 10 of 18
Upon approval by MA DEP and EPA, the approved QAPP will be distributed to those specified
on the Distribution List as outlined in Section 1.3. Distribution will be done via email, with
hardcopies available to CEI staff and the Pembroke Watershed Association. Any updates will be
sent via email.
2.1.
Sampling Process Design
The sampling process is described in Section 10, Sampling Process of the QAPP. The proposed
sampling program was altered slightly from the original design for Oldham and Furnace Ponds.
Sampling will consist of 5 samples in Oldham Pond and 2 in Furnace Pond as shown in Map
Two and Map Three in the QAPP. Locations are described as follows:
Table 2.1-1. Sample Locations
Waterbody
Oldham Pond
Furnace Pond
Name
Tributary A
Tributary B
Country Lane
O-08
Outlet
F-08
Outlet
Description
Upstream of culvert
Southeast
Pembroke Side
South
Latitude
420 04.217 N
420 04.172 N
420 04.496 N
420 03.645 N
420 03.550 N
420 03.233 N
420 03.186 N
Longitude
700 50.640 W
700 50.669 W
700 50.724 W
700 49.910 W
700 49.976 W
700 49.315 W
700 49.182 W
Sampling locations were adjusted from the previously approved program to try and gain a better
understanding of what is going in and coming out of each pond. By sampling both major
tributaries and outfalls of each pond, a lake response model can be developed to replicate
phosphorus impacts and potential solutions.
This modified sampling program will also involve collecting samples from the deep hole
locations in each pond. To determine whether or not the pond stratifies, DO and temperature
readings will be performed at two-foot intervals throughout the water column. Should
stratification be observed, phosphorus samples will be collected, one each from the epilimnion
and hypolimnion layers.
2.2.
Sampling Method Requirements
Sampling method requirements are outlined in Section 11, Sampling Method Requirements of
the QAPP. No additional project-specific details are required as this project will build upon a
previously approved QAPP.
2.3.
Sample Handling and Custody Requirements
Sample handling and custody procedures are described in Section 12, Sample Handling and
Custody Requirements. No additional project-specific details are required as part of the ARRA
project.
Furnace and Oldham Pond Watershed Restoration Plan
Title: Pembroke QAPP Amendment
Amendment Number: 1
Revision Date: 5/5/2010
Page 11 of 18
2.4.
Analytical Methods Requirements
Field and Laboratory analytical method requirements are outlined in Section 13, Analytical
Methods Requirements.
2.5.
Quality Control Requirements
Quality control procedures are outlined in Section 14, Quality Control Procedures of the QAPP.
No additional project-specific details are required as part of the ARRA project.
2.6.
Equipment Testing, Inspection, and Maintenance Requirements
Equipment testing, inspection and maintenance is outlined in Section 15, Instrument/Equipment
Inspection and Testing of the QAPP. No additional project-specific details are required as part
of the ARRA project.
2.7.
Instrument Calibration and Frequency Requirements
Instrument calibration is provided in Section 16, Instrument Calibration Frequency of the QAPP.
No additional project-specific details are required as part of the ARRA project.
2.8
Inspection / Acceptance Requirements of Supplies and Consumables
Inspection and acceptance requirements for supplies and consumables are detailed under Section
17, Inspection & Acceptance Requirements for Supplies in the QAPP. No additional projectspecific details are required as part of the ARRA project.
2.9.
Data Acquisition Requirements
Field data acquisition requirements are provided under Section 18, Data Acquisition
Requirements of the QAPP for previous data sources. Maps will be prepared using MassGIS
data layers to identify the general land features in the region, including subwatershed, lake, and
land use type areas. Data such as groundwater information and topography will be obtained
from the United States Geological Survey (USGS) and the United States Department of
Agriculture (USDA). Current and historic aerial photographs will be obtained from the USGS
and/or similar Town sources. Soils information will be obtained from the National Resources
Conservation Services (NRCS). Rainfall information will be obtained from the NOAA National
Weather Service website. Phosphorus export coefficients will be obtained from Uttormark et al.
(1974) and Reckhow et al. (1980). As available, the most up-to-date data will be used (with the
exception of historic aerial photographs), with an effort made to choose images with the highest
resolution possible.
Precision, bias, representativeness, and completeness within each model will be discussed in the
final report. Calculations made, such as areas and land use sizes, will have little error as there is
a large amount of information and data available on these types of variables. Data such as soils
information is general in nature to a large area such as a watershed, and not necessarily specific
to the underlying area such as that found at a specific structural BMP location. These types of
data will have moderate error. Other assumptions, such as the use of coefficients, will have a
larger degree of error, as concrete numbers are not available. Assumptions will be made using
the best available information.
Furnace and Oldham Pond Watershed Restoration Plan
Title: Pembroke QAPP Amendment
Amendment Number: 1
Revision Date: 5/5/2010
Page 12 of 18
The above-referenced sources provide state or federal databases with accurate information
suitable for this study. Data collected during this project will be used to prioritize future water
quality improvements and used for comparison with future water quality monitoring efforts.
Additional field reconnaissance efforts will be performed by CEI staff familiar with the area and
experienced in conducting a watershed assessment. Watershed data such as land use types and
specific pollution sources that will require additional attention during modeling analysis will be
compared to existing MassGIS data and incorporated into the report. Staff will also review
changes in the watershed that have occurred since the completion of previous studies in 2001
that may be impacting the water quality of the ponds. Potential structural BMP locations will
also be mapped and incorporated into final reports and maps.
2.10. Data Management
The field data management is described in Section 19, Data Management of the QAPP.
Modeling calculations will be subject to an internal quality control process by the Modeling
Coordinator and QA/QC Officer at Comprehensive Environmental, Inc. The data will be
critically reviewed for reasonableness, correspondence with data quality objectives, appropriate
qualification, censoring of suspect data, and that data has been entered correctly. Models used
are as follows:
1. Land use based model
2. Lake response model
3. Simple Method
Modeling and calculations will be performed with the aid of a Microsoft Excel spreadsheet.
Final results and summaries may be maintained and displayed in a Microsoft Excel spreadsheet.
Final maps may be displayed in part by using ArcGIS maps if appropriate. The remainder of
data will be described in a narrative format.
Electronic files with modeling, calculations, field reconnaissance results, sampling data, etc. will
be maintained with Comprehensive Environmental, Inc. Electronic files associated with the final
report including sampling results will be stored with CEI for distribution as appropriate.
Electronic files are stored on secure servers which are backed up several times each week. Hard
copies of reports will be distributed to the Town of Pembroke, Pembroke Watershed Association,
MA DEP, and EPA as part of applicable reports.
3.1.
Assessment and Response Actions
Field assessment and response actions are detailed under Section 20, Assessment and Response
Actions in the QAPP. The Modeling Coordinator and QA/QC Officer will be responsible for
review, oversight and follow-up on data quality and corrective actions throughout the project.
Data assessments will be performed during the project as part of the monthly reporting efforts as
required by the MA DEP 604(b) program. Assessments to be performed during the project will
include:
9 Evaluation of field reconnaissance observed issues
9 Existing and current data variations
9 Modeling assumption issues
Furnace and Oldham Pond Watershed Restoration Plan
Title: Pembroke QAPP Amendment
Amendment Number: 1
Revision Date: 5/5/2010
Page 13 of 18
9
9
Model comparison difficulties
Engineering design problem
The results of assessments will be documented and reported in the monthly and quarterly status
reports. The final report will contain a summary of assessments, as well as actions taken to
address issues. Reports will be provided to the Town of Pembroke, Pembroke Watershed
Association, MA DEP, and EPA for review. CEI will incorporate revisions to the final report,
based on review comments provided by these agencies.
3.2.
Reports
Comprehensive Environmental Inc. (CEI) will produce project reports with input from the
Pembroke Watershed Association as required. Copies of reports will be distributed to the Town
of Pembroke, PWA, MA DEP and EPA for review and comment prior to finalization and
approval. Monthly and quarterly reports will document recent activities performed on the
project. The draft and final report will document the entire project. Table 3.2-1 lists the reports
that will be produced as a result of this project.
Table 3.2-1. Reports to Management
Report Type
Monthly Progress
Reports
Report Frequency
Monthly for the duration of the
project.
Quarterly Progress
Reports
Draft Project
Report
Quarterly for the duration of the
project, due on December 21st,
March 20th, June 20th, and
September 20th.
At the conclusion of modeling
and design.
Final Project
Report
Upon receipt of comments on
Draft Project Report
Parties Receiving Report
-Town of Pembroke
-Pembroke Watershed Association
-MA DEP
-EPA
-Town of Pembroke
-Pembroke Watershed Association
-MA DEP
-EPA
-Town of Pembroke
-Pembroke Watershed Association
-MA DEP
-EPA
-Town of Pembroke
-Pembroke Watershed Association
-MA DEP
-EPA
Brief monthly and quarterly reports will document activities performed within the previous
reporting period. Reports will be submitted via email on a standard form. Reports will contain a
summary and percentage of work completed by task during the reporting period, planned
activities for the next quarter, a description of difficulties encountered and steps taken to address
those difficulties, and an explanation of significant discrepancies between progress achieved and
the level of progress that should have occurred based on the scope of services and timeline.
Final results will be incorporated into the final project report required by the MA DEP 604(b)
Grant Program at the completion of the project. Comprehensive Environmental Inc. will be
Furnace and Oldham Pond Watershed Restoration Plan
Title: Pembroke QAPP Amendment
Amendment Number: 1
Revision Date: 5/5/2010
Page 14 of 18
responsible for preparing the draft final project report, distributing the report, responding to
comments, and finalizing the report. This report will contain the following:
9 Executive Summary
9 Project Introduction and Background
9 Data Assessment
9 Pollutant Modeling
9 QA/QC Issues
9 Recommendations and Conclusions
9 Structural Engineering Designs (30%)
9 References and Further Reading
9 Figures, Tables and Appendices
The executive summary will provide a summary of the entire report, condensed into a maximum
of several pages, with a focus on the recommendations and conclusions.
A detailed description of the project will be provided, including a description of previous reports
completed for the ponds under previous QAPPs. Project goals, objectives, methodology,
assumptions, reasoning, etc. will be outlined.
Applicable data obtained from past projects will be detailed. Field reconnaissance efforts and
data from current sampling rounds will be summarized. Data such as watershed maps and sizes,
land use data, anticipated flow rates, etc. will be summarized. Data sources will be provided, as
well as the reasoning and methods used to acquire the data.
A detailed explanation of the pollutant modeling used will be provided. The report will
document the modeling purpose, description, scope, approach and application. Model data
sources, components, quality, validation performance, and variables used to obtain final results.
Parameter assumptions, values, excluded data and sources will be documented in detail. Model
calibration performance conditions will be analyzed, as well as future predictions for the buildout
scenario. A summary of modeling results will be provided.
Quality assurance and quality control issues encountered during the project pertaining to
sampling or modeling will be summarized in narrative form. Methods taken to address issues
encountered will be addressed.
An evaluation of load reduction measures will be provided, as well as final
recommendations and conclusions to reduce phosphorus levels in the ponds and improve
water quality. The final plan will outline proposed BMPs, estimated costs, and expected
pollutant removal levels.
Preliminary 30% designs and estimated construction costs will be prepared for the top
five structural BMP improvements. Detail will be sufficient for s.319 grant funding.
References will be provided, as well as additional recommended reading sources.
Supporting figures, tables and appendices will be provided.
Furnace and Oldham Pond Watershed Restoration Plan
Title: Pembroke QAPP Amendment
Amendment Number: 1
Revision Date: 5/5/2010
Page 15 of 18
4.1.
Data Review, Verification, and Validation Requirements
Field data review is described in Section 22, Data Review, Validation and Verification
Requirements of the QAPP. Phosphorus loadings will be estimated using a land use based model
(The Simple Method) in combination with a lake response model (Reckhow Phosphorus Lake
Model) to predict in-lake phosphorus concentrations based on the projected loadings.
Phosphorus loads into the pond will be estimated using literature based loading coefficients for
various land uses and pollutant sources. This information is based on stormwater sampling data
collected from runoff from various types of land use and results in the total mass of phosphorus
entering the pond from each type of land use. There is not enough water quality data to compare
the model predicted loadings to the actual loadings to the pond, as an extensive amount of water
quality and flow data would be needed to accurately calculate the loads associated with flows
into the pond. However, lake-response models can be used to estimate the relationship between
phosphorus loads and lake concentrations, such that the actual lake concentration can be used to
predict the load to the pond or the load to the pond can be used to estimate a concentration. It is
this relationship that will be used to calibrate the data. The modeled loadings from land use
values will be compared to the expected loadings calculated based on the actual in-pond
concentrations. Model input factors will then be adjusted until the predicted in-lake phosphorus
concentrations are within 10% of the observed concentrations documented via the field
monitoring program.
The modeling will be performed according to the following procedural steps:
Step 1: Land Use Model
Step 2: Lake Response Model
Step 3: Model Calibration
Step 4: Buildout Analysis
Step 5: Phosphorus Removal Solutions
Step 1: Land Use Model
Phosphorus loadings to the Lake will be determined based on the Simple Method. The Simple
Method estimates pollutant loads for chemical constituents as a product of annual runoff volume
and pollutant concentration, as follows:
L = 0.226 * R * C * A
Where: L = Annual load (lbs)
0.226 = Unit conversion factor
C = Pollutant concentration (mg/l)
A = Area (acres)
R = Annual runoff (inches) = P * Pj * (0.05 + 0.9 * I / 100)
P = Annual rainfall (in)
Pj = % of rainfall events producing runoff (assumed to be 90%)
I = Impervious cover percent (%)
Existing information sources available through local, state and federal sources will be used to
estimate parameters for use in the model. Watershed (A) and lake area will be determined from
topographic maps downloaded from USGS and MassGIS, and inserted into a computer aided
drafting (CAD) based program or similar to determine actual areas. Precipitation for the area will
Furnace and Oldham Pond Watershed Restoration Plan
Title: Pembroke QAPP Amendment
Amendment Number: 1
Revision Date: 5/5/2010
Page 16 of 18
be estimated from the NOAA National Weather Service website for the area.
Pollutant concentrations (C) will be obtained from the Simple Method for each type of land use
(e.g., commercial, forest, high density residential, etc.) in the watershed. Areas for each land use
will be calculated through GIS computer software.
Phosphorus loadings from septic systems and atmospheric deposition (direct precipitation) will
be estimated from literature based coefficients for these sources. Phosphorus from atmospheric
deposition is determined from lake area and an assumed phosphorus concentration of 0.2 kg/hayr in precipitation from Wetzel, 1975 and Reckhow and Chapra, 1983. Potential loadings from
internal recycling will also be estimated using available inflow and outflow and Lake sampling
data and considering the methods used in the 1993 Diagnostic Feasibility study.
By using the Simple Method and literature based coefficients, a total runoff and associated total
phosphorus load to the Lake will be determined.
Step 2: Lake Response Model
The Reckhow Phosphorus Lake Model will be used to predict the in-lake concentration based on
the loadings estimated in Step 1. The Reckhow steady-state lake model is expressed as:
P = L / (11.6 + 1.2 * qs)
Where: L = annual areal phosphorus loading (g/m2-yr) = W / As
W = total phosphorus mass loading (includes stormwater, internal recycling, septic
systems as determined through Step 1) (g/yr)
As = lake area (acres)
qs = areal water loading (m/yr), qs = Q / As
Q = inflow water volume to lake (m3/yr)
The total inflow water volume to the Lake (Q) will be calculated as:
Q = P * AT – Evapotranspiration
Where: P = total precipitation (ft)
AT = total watershed area (sf)
Evapotranspiration = estimated at 40% of the total precipitation volume (Hanson, R.L.)
Step 3: Model Calibration
The difference between the modeled phosphorus load determined in Step 2 based on land use
loading values and the expected loadings based on actual in-pond concentrations will be
compared and a difference between observed and predicted noted. Calibration will then be
performed by altering the input variables (e.g., land use loading concentrations) by the percent
difference to match observed and predicted in-pond phosphorus concentrations close to one
another using the limited data available. A 10% alteration of variables is considered reasonable
to match observed and predicted values and/or a 10% difference in predicted versus observed inpond concentrations without adjustment of variables. If greater than 10% alteration is needed, the
reason for the greater alteration will be explored and explained. Model input reasoning will be
Furnace and Oldham Pond Watershed Restoration Plan
Title: Pembroke QAPP Amendment
Amendment Number: 1
Revision Date: 5/5/2010
Page 17 of 18
explained in the final report, as well as any changes made to the variables. Calibration will
continue until observed values vs. predicted values are within 10% of each other.
As the modeling approach presented in this QAPP is relying upon a simplistic model intended
for planning purposes, the importance is to establish a relationship between loadings and in-pond
concentrations on which to base decisions. This is a reliable method for comparing various areas
(e.g., subwatersheds) and land uses to one another, as well as various sources to one another and
also for determining the percent reduction necessary to achieve a water quality goal, regardless
of whether the mass load is 100% accurate. Thus, the level of uncertainty in the exact loading
value has little impact on how it is ultimately used; however, uncertainty will be evaluated as a
function of the level of adjustment needed to calibrate the model. This simplified approach uses
average data values, which will first be reviewed and examined to identify any outliers.
Documentation of model uncertainty will be outlined in a narrative form in the draft and final
report. Data will be reviewed by the Modeling Coordinator and QA/QC Officer as well as the
MA DEP 604(b) Project Officer and QA Officer to determine if they meet the QAPP objectives
and verify accuracy.
Step 4: Buildout Analysis
A buildout scenario will be prepared by overlaying existing land use with existing zoning and
accounting for development restrictions such as protected lands and wetlands. The anticipated
lands uses at buildout will be input into the model to determine loadings under buildout
conditions. The buildout scenario will be used to develop load reduction measures necessary to
meet water quality goals.
Step 5: Phosphorus Removal Solutions
Upon calibrating the model, the reductions necessary to meet water quality goals will be
determined by adjusting the loadings downward until the desired in-lake concentration is
achieved. CEI will tailor recommendations to meet these reductions, using literature based
removal efficiencies, such as provided in the Massachusetts Stormwater Handbook.
4.2.
Validation and Verification Methods
Field data review is described in Section 23, Validation and Verification Methods of the QAPP.
The Modeling Coordinator and QA/QC Officer will examine the data for logical consistency, as
presented in Table 4.2-1. The Modeling Coordinator is familiar with running these types of
scenarios and is experienced with computer simulation models. If inconsistencies are found, an
attempt will be made to determine whether the data is in error. Apparent problems will be noted
in the final reports as appropriate.
Table 4.2-1 Validation and Verification Procedures
Responsible
Party
Modeling
Coordinator /
QA/QC
Officer
Possible Corrective Measures
When
When model
compilation
has been
completed.
Activity
Compare test results with targets
or expected values.
Spot-check calculations.
Furnace and Oldham Pond Watershed Restoration Plan
and Notification
Re-run calculations.
Flag problems that are not
correctable.
Title: Pembroke QAPP Amendment
Amendment Number: 1
Revision Date: 5/5/2010
Page 18 of 18
Responsible
Party
Possible Corrective Measures
When
When model
calibration has
been
performed.
4.3.
Activity
Check for outliers.
and Notification
Discuss outliers or errors in the
final narrative.
Reconciliation with Data Quality Objectives
Data quality objectives are described in Section 24, Reconciliation with Data Quality Objectives
(DQO’s). No additional project-specific details are required as part of the ARRA project.
4.4.
Literature Cited
The following studies were previously cited:
Baystate Environmental Consultants, Inc. (January 1993). Diagnostic/Feasibility Study for the
Management of the Pembroke Ponds, Oldham, Furnace, Little Sandy Bottom and Stetson,
Pembroke, Massachusetts.
Comprehensive Environmental, Inc. (November 2000). Oldham Pond Pollution Source
Investigation and BMP Identification.
Comprehensive Environmental, Inc. (December, 2001). Furnace Pond Pollution Source
Investigation and BMP Identification.
Furnace and Oldham Pond Watershed Restoration Plan