1
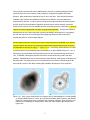
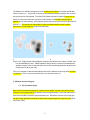
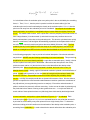
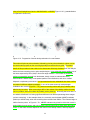
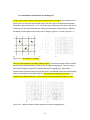
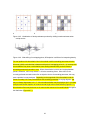
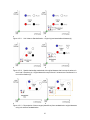
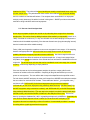
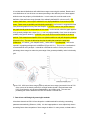
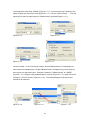
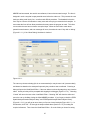
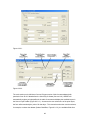
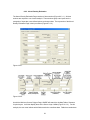
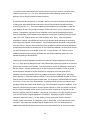
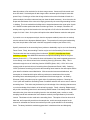
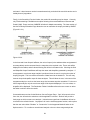
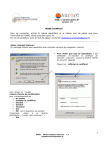
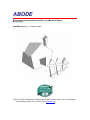
They are both extensions that can be added easily to ArcView, a software package that has
previously been the most commonly used package for ecological Geographic Information
Systems. Many studies have reported the use of one or the other. Since ArcGIS 8x became
available, many research and academic institutions have started to use this software as a
replacement for ArcView. It was my goal to provide home range freeware that could be used in
ArcGIS, which fully documented the algorithms and techniques used in analyses, and which
would use the elements from the available ArcView extensions that were most helpful. I aimed to
improve on certain analyses that I felt were not implemented optimally. Though many software
discrepancies do exist, and no estimator (certainly not ABODE) will be perfect, it is suggested
that the user read some of the following points highlighting differences that could have a
considerable effect on a home range analysis.
One discrepancy between currently favored home range estimators and ABODE is the ability to
deal with ‘islands’ and ‘donuts’ (for a terrestrial species these may be features such as lakes or
uninhabitable areas within the range). In Figure 2.2.1.a., a commonly used estimator is not able
to eliminate areas of low probability within the distribution, as does ABODE (Figure 2.2.1.b.). In
both figures, the user defined fixed smoothing factor was 32m, and both had a grid cell size of
15m. In ABODE, a biweight kernel was used, with a normal kernel being used in the other
package. Standardization was not implemented in either package. Both figures are displayed at
the same scale, and clearly there are not only differences in the extent of smoothing given the
same inputs, but also in the ability to distinguish probability differences at a fine resolution.
a
b
Figure 2.2.1. 95% Volume fixed kernel home ranges using no standardization, a normal (AMAE)
or biweight (ABODE) kernel, h=32m, and 15m grid in software AMAE (red line), and ABODE
(blue line). Orange points are a hypothetical set of location estimates. Blue cells in the grid
indicate 100% probability (no density value), while dark cells indicate higher density than
lighter cells.
5