1
Measured data management and time-oriented
evaluation and visualisation as hydrographs and
contour lines
GGU-TIME-GRAPH
VERSION 7
Last revision:
September 2008
Copyright:
GGU Zentrale Verwaltung mbH, Braunschweig
Technical implementation and sales: Civilserve GmbH, Steinfeld
Contents:
1 Preface .................................................................................................................................. 5
2 Licence protection and installation .................................................................................... 5
3 Language selection............................................................................................................... 6
4 Starting the program ........................................................................................................... 6
5 Description of menu items................................................................................................... 7
5.1 File menu.......................................................................................................................... 7
5.1.1 "New" menu item..................................................................................................... 7
5.1.2 "Load" menu item .................................................................................................... 7
5.1.3 "Append" menu item................................................................................................ 7
5.1.4 "Save" menu item .................................................................................................... 7
5.1.5 "Save as" menu item ................................................................................................ 7
5.1.6 "Import ASCII data" menu item .............................................................................. 7
5.1.7 "Export ASCII data" menu item .............................................................................. 9
5.1.8 "Printer preferences" menu item .............................................................................. 9
5.1.9 "Print and export" menu item .................................................................................. 9
5.1.10 "Batch print" menu item ........................................................................................ 11
5.1.11 "Exit" menu item.................................................................................................... 11
5.1.12 "1, 2, 3, 4" menu items........................................................................................... 11
5.2 Hydrographs menu ......................................................................................................... 12
5.2.1 "Editor 1" menu item ............................................................................................. 12
5.2.1.1 Start dialogue box.......................................................................................... 12
5.2.1.2 Editor box for selected measuring point........................................................ 13
5.2.1.3 "Edit measured data" button.......................................................................... 15
5.2.1.4 "Modify hydrograph" button ......................................................................... 16
5.2.1.5 "Import ASCII file" button............................................................................ 17
5.2.1.6 "Statistics" button .......................................................................................... 17
5.2.1.7 "Special" button............................................................................................. 20
5.2.1.8 "Monthly values" button ............................................................................... 21
5.2.2 "Editor 2" menu item ............................................................................................. 21
5.2.3 "Date axis" menu item ........................................................................................... 22
5.2.4 "Measured data axis etc." menu item..................................................................... 22
5.2.5 "Select hydrographs" menu item............................................................................ 23
5.2.6 "Display hydrograph" menu item .......................................................................... 23
5.3 Contours menu ............................................................................................................... 24
5.3.1 "Display" menu item.............................................................................................. 24
5.3.1.1 Select date for contours visualisation ............................................................ 24
5.3.1.2 Select type of contours .................................................................................. 25
5.3.1.3 "Display contours" button ............................................................................. 26
5.3.1.4 "Presentation format (contours)" button........................................................ 27
5.3.1.5 "Display gradients" button ............................................................................ 28
5.3.1.6 "Presentation format (gradients)" button....................................................... 29
5.3.1.7 "Coloured contours" button........................................................................... 30
5.3.1.8 "3D contours" button..................................................................................... 31
5.3.1.9 "3D contours (array)" button......................................................................... 33
GGU-TIME-GRAPH User Manual
Page 2 of 57
September 2008
5.3.2 "Automatic triangle mesh" menu item................................................................... 33
5.3.3 "Manually" menu item........................................................................................... 33
5.3.4 "Round off" menu item.......................................................................................... 34
5.3.5 "Test" menu item ................................................................................................... 34
5.3.6 "Display" menu item.............................................................................................. 35
5.3.7 "Delete" menu item................................................................................................ 35
5.3.8 "Save" menu item .................................................................................................. 35
5.3.9 "Load" menu item .................................................................................................. 35
5.3.10 "Test coordinates" menu item ................................................................................ 35
5.3.11 "Edit coordinates" menu item ................................................................................ 36
5.3.12 "Labelling x and y axes" menu item ...................................................................... 36
5.4 Section menu .................................................................................................................. 37
5.4.1 General notes on sections ...................................................................................... 37
5.4.2 "Define" menu item ............................................................................................... 37
5.4.2.1 Define section course .................................................................................... 37
5.4.2.2 Select date for section visualisation .............................................................. 38
5.4.3 "Preferences" menu item........................................................................................ 39
5.4.4 "Pens (section)" menu item.................................................................................... 41
5.5 Graphics preferences menu ............................................................................................ 41
5.5.1 "Refresh and zoom" menu item ............................................................................. 41
5.5.2 "Zoom info" menu item ......................................................................................... 42
5.5.3 "Pen colour and width" menu item ........................................................................ 42
5.5.4 "Legend font selection" menu item........................................................................ 43
5.5.5 "Mini-CAD toolbar" and "Header toolbar" menu items ........................................ 44
5.5.6 "Toolbar preferences" menu item .......................................................................... 44
5.5.7 "3D toolbar" menu item ......................................................................................... 45
5.5.8 "General legend" menu item.................................................................................. 45
5.5.9 "Hydrographs legend" menu item.......................................................................... 46
5.5.10 "Section course legend" menu item ....................................................................... 47
5.5.11 "Date legend" menu item ....................................................................................... 47
5.5.12 "Move objects" menu item..................................................................................... 48
5.5.13 "Load graphics preferences" menu item ................................................................ 48
5.5.14 "Save graphics preferences" menu item................................................................. 48
5.6 Page size + margins menu .............................................................................................. 49
5.6.1 "Page sizes and margins" menu item ..................................................................... 49
5.6.2 "Auto-resize" menu item........................................................................................ 50
5.6.3 "Auto-resize date axis" menu item......................................................................... 50
5.6.4 "Auto-resize measured data axis" menu item ........................................................ 50
5.6.5 "Manual resize (editor)" menu item....................................................................... 50
5.6.6 "Manual resize (mouse)" menu item...................................................................... 51
GGU-TIME-GRAPH User Manual
Page 3 of 57
September 2008
5.7 ? menu ............................................................................................................................ 52
5.7.1 "Copyright" menu item .......................................................................................... 52
5.7.2 "Maxima" menu item ............................................................................................. 52
5.7.3 "Help" menu item .................................................................................................. 52
5.7.4 "GGU on the web" menu item ............................................................................... 52
5.7.5 "GGU support" menu item..................................................................................... 52
5.7.6 "Meteorology + pedology" menu item................................................................... 52
5.7.7 "What’s new?" menu item ..................................................................................... 52
5.7.8 "Language preferences" menu item ....................................................................... 52
6 Tips...................................................................................................................................... 53
7 Index.................................................................................................................................... 55
GGU-TIME-GRAPH User Manual
Page 4 of 57
September 2008
1 Preface
The GGU-TIME-GRAPH program allows management, evaluation and graphical visualisation
of measured data in the form of hydrographs and contour lines. The time component is at the forefront of these considerations. For example, we can represent long-term (years) gauge measurements as hydrographs and perform statistical evaluations for the measurement duration.
If the x- and y-coordinates of the data points are known, the measured data for any given point in
time can be visualised as position-oriented graphics. You can select from the following graphical
formats for your data:
• Hydrographs
• Contour lines
• Colour-filled contour lines
• Colour-filled 3D graphics
Using GGU-TIME-GRAPH, each data point can be allocated up to 50,000 value pairs in the
form of a date, a time and a corresponding value (e.g. groundwater level).
Data input is in accordance with conventional WINDOWS operations and can therefore be learned
almost entirely without the use of a manual. Graphic output supports the true-type fonts supplied
with WINDOWS, so that excellent layout is guaranteed. Colour output and any graphics (e.g. files
in formats BMP, JPG, PSP, TIF, etc.) are supported. DXF files can also be imported by means of
the integrated Mini-CAD module (see the Mini-CAD manual).
The program has been thoroughly tested. No faults have been found. Nevertheless, liability for
completeness and correctness of the program and the manual, and for any damage resulting from
incompleteness or incorrectness, cannot be accepted.
2 Licence protection and installation
In order to guarantee a high degree of quality, a hardware-based copy protection system is used
for the GGU-TIME-GRAPH program.
The GGU software protected by the CodeMeter copy protection system is only available in
conjunction with the CodeMeter stick copy protection component (hardware for connection to the
PC, "CM stick"). Because of the way the system is configured, the protected software can only be
operated with the corresponding CM stick. This creates a fixed link between the software licence
and the CM stick copy protection hardware; the licence as such is thus represented by the CM
stick. The correct Runtime Kit for the CodeMeter stick must be installed on your PC.
Upon start-up and during running, the GGU-TIME-GRAPH program checks that a CM stick is
connected. If it has been removed, the program can no longer be executed.
For installation of GGU software and the CodeMeter software please refer to the information in
the Installation notes for GGU Software International, which are supplied with the program.
GGU-TIME-GRAPH User Manual
Page 5 of 57
September 2008
3 Language selection
GGU-TIME-GRAPH is a bilingual program. The program always starts with the language setting applicable when it was last ended.
The language preferences can be changed at any time in the "?" menu, using the menu item
"Spracheinstellung" (for German) or "Language preferences" (for English).
4 Starting the program
After starting the program, you will see two menus at the top of the window:
• File
• ?
After going to the "File" menu, you can either load an existing file by means of the "Load" menu
item, or create a new one using "New". Seven menus then appear at the top of the window:
• File
• Hydrographs
• Contours
• Section
• Graphics preferences
• Page size + margins
• ?
After clicking one of these menus, the so-called menu items roll down, allowing you access to all
program functions.
The program works on the principle of What you see is what you get. This means that the screen
presentation represents, overall, what you will see on your printer. In the last consequence, this
would mean that the screen presentation would have to be refreshed after every alteration you
make. For reasons of efficiency and as this can take several seconds for complex screen contents,
the GGU-TIME-GRAPH screen is not refreshed after every alteration.
If you would like to refresh the screen contents, press either [F2] or [Esc]. The [Esc] key additionally sets the screen presentation back to your current zoom, which has the default value 1.0, corresponding to an A3 format sheet.
GGU-TIME-GRAPH User Manual
Page 6 of 57
September 2008
5 Description of menu items
5.1
5.1.1
File menu
"New" menu item
All current measured data will be deleted. You can then enter new data points and the corresponding data.
5.1.2
"Load" menu item
Using this menu item, you can load a file, which was created and saved at a previous sitting. The
information on data points and values contained in the file can now be edited.
5.1.3
"Append" menu item
Using this menu item, you can append an existing file to the file already open. The data points and
corresponding values contained in the added file will be appended to the current file. In this way,
it is possible to merge files.
However, note that the settings for the page format, image coordinates and header data are
taken from the last appended file.
5.1.4
"Save" menu item
You can save data entered or edited during program use to a file, in order to have them available at
a later date, or to archive them. The data is saved without prompting with the name of the current
file. Loading again later creates exactly the same presentation as was present at the time of saving.
5.1.5
"Save as" menu item
You can save data entered during program use to an existing file or to a new file, i.e. using a new
file name. For reasons of clarity, it makes sense to use ".gis" as file suffix, as this is the suffix used
in the file requester box for the "File/Load" or "File/Append" menu items. If you choose not to
enter an extension when saving, ".gis" will be used automatically.
5.1.6
"Import ASCII data" menu item
If the coordinates of the data points and the corresponding data are available as an ASCII file, this
data can be read into the program. You can either read the data as "new" values (the current data
will be deleted) or append it to the current data. Decimal fractions must have a point and not a
comma.
After selecting the ASCII file, you will see the following dialogue box:
GGU-TIME-GRAPH User Manual
Page 7 of 57
September 2008
The current line of the ASCII file is shown at the top. You can move through the file using the
arrow buttons on the right. In the "Name column:", "Date column" and "Value column:" you
enter the column number in which the respective data is located. Using the "Import coordinates"
check box it is possible to enable import of easting and northings. If all the information is correct,
the results for the current row are shown in the corresponding dialogue boxes. Otherwise, "Error"
appears.
You may need to change the column delimiter.
If the file contains invalid as well as valid rows of data, these will simply be skipped during import. After the "Import data" button has been pressed and the data successfully imported, you
will see a message box with the number of imported values and character strings. You can now
process the data further or move on to evaluation.
The program decides on the allocation of data based on the name of the data point. For example, if
data has already been entered before the ASCII data were imported and valid rows with existing
data point names occur in the ASCII data, the data are allocated to this data point, i.e. appended to
the existing record.
If you import eastings and northings and inadvertently have different ASCII data in a number of rows but for the same data point, the last valid value will be imported.
In the ASCII file the data for a given data point need not be in sequential rows. The time for all
imported values is set to "0:00".
If you want to import ASCII data for a single point only, please read Section 0.
GGU-TIME-GRAPH User Manual
Page 8 of 57
September 2008
5.1.7
"Export ASCII data" menu item
This menu item allows you to save the current data in ASCII format. The data exported in this way
can be read and further processed in other applications, e.g. in spreadsheets. A "space" is used as
delimiter.
5.1.8
"Printer preferences" menu item
You can edit printer preferences (e.g. swap between portrait and landscape) or change the printer
in accordance with WINDOWS conventions.
5.1.9
"Print and export" menu item
You can select your output format in a dialogue box. You have the following possibilities:
• "Printer"
allows graphic output of the current screen to the WINDOWS standard printer or to any
other printer selected using the menu item "File/Printer preferences". But you may also
select a different printer in the following dialogue box by pressing the "Printer
prefs./change printer" button.
In the upper group box, the maximum dimensions which the printer can accept are given.
Below this, the dimensions of the image to be printed are given. If the image is larger than
the output format of the printer, the image will be printed to several pages (in the above example, 4). In order to facilitate better re-connection of the images, the possibility of entering an overlap for each page, in x and y direction, is given. Alternatively, you also have
the possibility of selecting a smaller zoom factor, ensuring output to one page ("Fit to page" button). Following this, you can enlarge to the original format on a copying machine,
to ensure true scaling. Furthermore, you may enter the number of copies to be printed..
GGU-TIME-GRAPH User Manual
Page 9 of 57
September 2008
• "DXF file"
allows output of the graphics to a DXF file. DXF is a common file format for transferring
graphics between a variety of applications.
• "GGUCAD file"
allows output of the graphics to a file, in order to enable further processing with the
GGUCAD program. Compared to output as a DXF file this has the advantage that no loss
of colour quality occurs during export.
• "Clipboard"
The graphics are copied to the WINDOWS clipboard. From there, they can be imported
into other WINDOWS programs for further processing, e.g. into a word processor. In order
to import into any other WINDOWS program you must generally use the "Edit/Paste"
function of the respective application.
• "Metafile"
allows output of the graphics to a file in order to be further processed with third party software. Output is in the standardised EMF format (Enhanced Metafile format). Use of the
Metafile format guarantees the best possible quality when transferring graphics.
If you select the "Copy/print area" tool
from the toolbar, you can copy parts of
the graphics to the clipboard or save them to an EMF file. Alternatively you can send
the marked area directly to your printer.
Using the "Mini-CAD" program module you can also import EMF files generated using other GGU applications into your graphics.
• "MiniCAD"
allows export of the graphics to a file in order to enable importing to different GGU applications with the MiniCAD module.
• "GGUMiniCAD"
allows export of the graphics to a file in order to enable processing in the GGUMiniCAD
program.
• "Cancel"
Printing is cancelled.
GGU-TIME-GRAPH User Manual
Page 10 of 57
September 2008
5.1.10
"Batch print" menu item
If you would like to print several appendices at once, select this menu item. You will see the following dialogue box:
Create a list of files for printing using "Add" and selecting the files required. The number of files
is displayed in the dialogue box header. You can mark and delete selected individual files from the
list using the "Delete" button. You can compile a new list after selecting the "Delete all" button.
The printer and printer preferences are selected by pressing the "Printer" button.
You then start printing by using the "Print" button. In the dialogue box which then appears you
can select further preferences for printer output such as, for example, the number of copies. These
preferences will be applied to all files in the list.
5.1.11
"Exit" menu item
After a confirmation prompt, you can quit the program.
5.1.12
"1, 2, 3, 4" menu items
The "1, 2, 3, 4" menu items show the last four files worked on. By selecting one of these menu
items the listed file will be loaded. If you have saved files in any other folder than the program
folder, you can save yourself the occasionally onerous rummaging through various sub-folders.
GGU-TIME-GRAPH User Manual
Page 11 of 57
September 2008
5.2
Hydrographs menu
5.2.1
"Editor 1" menu item
5.2.1.1
Start dialogue box
All information associated with an individual data point can be entered using this menu item. If
you go to this menu item you will first see the following dialogue box:
Seven data points (wells) are already present in this example. The data point designation is given
on the respective buttons ("Bo 1", "Bo 2", ... ). The following operations are possible:
• "Menu bar"
You return to the original menu bar.
• "New"
A new data point is created. You can now enter the data for a new point.
• "Delete all"
After a confirmation prompt all existing data points are deleted.
• "Forw." and "Back"
If more than 105 data points have been entered, the points following 105 can be accessed
by clicking these buttons.
• "Bo 1", "Bo 2", ...
By clicking the buttons labelled with data point names you can edit the data for the corresponding data point.
GGU-TIME-GRAPH User Manual
Page 12 of 57
September 2008
5.2.1.2
Editor box for selected measuring point
After clicking "New" or one of the buttons of an existing data point the following dialogue box
opens.
At the top of this dialogue box you can enter the name of the data point and edit the x- and
y-ordinates. By clicking the "Done" button you return to the previous dialogue box; any changes
will be accepted. Using the "Cancel" button you leave the dialogue box and any editing is rejected.
If the measured values you are dealing with are groundwater levels, you can activate the "Values
as depth-to-water" check box. In the activated "TOC:" box (top of casing) you enter the m AD
height for the top of the casing of the well. When subsequently entering the measured values you
can simply give the water level on the water level sounding light in metres. The program converts
the groundwater levels automatically to [m AD] for hydrograph visualisation and displays them.
The values entered remain unchanged. Only the hydrograph visualisation on the screen (or
printed) is adjusted accordingly.
Preferences for visualisation of the hydrograph of the current data point, such as colour, width and
type of dash, are defined in the bottom group box ("Pen").
GGU-TIME-GRAPH User Manual
Page 13 of 57
September 2008
In addition to the buttons described in more detail in sections 5.2.1.3 to 5.2.1.8 , the following
operations can be carried out here:
• "Delete hydrograph"
The currently displayed data point can be deleted. If a triangle mesh has been generated to
enable contour line display based on the existing data points, it will also be deleted.
• "Duplicate hydrograph"
The currently displayed data point can be copied. All current data will be copied. You will
then find yourself in the box for the duplicated data point, titled "New".
• "Edit measured data"
A description of this button can be found in Section 5.2.1.3.
• "Delete measured data"
After a confirmation prompt you can delete all measured values for this point.
• "Modify hydrograph"
A description of this button can be found in Section 5.2.1.4.
• "Import MDS data"
Measured data collected using a data acquisition system (e.g. MDS cells) can be imported
as ".dst" files and be further processed by the program.
• "Load measured data"
You can load measured data from a GGU-TIME-GRAPH data file (".gng" extension). If
you select "New", the current data are deleted. In order to add data to the current record, select "Append".
• "Save measured data"
The measured data for the current point are saved in a special data format with the ".gng"
extension.
• "Import ASCII file"
A description of this button can be found in Section 0.
• "Export to ASCII file"
The measured values can be saved as an ASCII file with the ".txt" extension and then edited, for example with a text editor.
• "Import ASCII (DWD)""
Measured data provided in ASCII format by the DWD (Deutsche Wetterdienst - German
Meteorological Service) can be imported into the program and processed.
• "Evapotranspiration (Haude)"
You can have the evapotranspiration calculated after Haude. You must either enter one hydrograph with the temperature data and one with the humidity data or import an appropriate
ASCII file.
You must generate a new hydrograph for the evapotranspiration values. Allocate the hydrographs to the appropriate drop-down list boxes to calculate the values. The evapotranspiration values are calculated from the temperature and humidity values and transferred to
your hydrograph as new values.
• "Statistics"
A description of this button can be found in Section 5.2.1.6
• "Special"
A description of this button can be found in Section 5.2.1.7.
• "Import SEBA file"
Measured data saved in ASCII format by SEBA automatic recording instruments can be
imported into the program and processed.
GGU-TIME-GRAPH User Manual
Page 14 of 57
September 2008
• "Monthly values"
A description of this button can be found in Section 5.2.1.8.
5.2.1.3
"Edit measured data" button
In the following dialogue box you can either enter or edit the data for the current point.
• "Edit no. of values"
In the example shown here 44 measured values have already been entered. By pressing the
button you arrive at a further dialogue box for editing the number of measured values.
GGU-TIME-GRAPH User Manual
Page 15 of 57
September 2008
If no values have been entered (new data point), the box will contain a "0". Measured values can be added by increasing the number, and values at the end of the list deleted by decreasing the number of values.
In order to delete measured data within an existing list, remove the corresponding date
and then click the "Sort" button.
• "OK"/"Cancel"
You return to the previous dialogue box. All changes made to the data will be accepted
with "OK" and rejected with "Cancel".
• "Sort"/"Info on sorting"
Intermediate values can be inserted or deleted from the list using the sort function. You can
read more detailed information on the sort function by clicking the "Info on sorting" button.
• "Time"
You can define a new time for all measured values.
• "Info on date input"
A number of short-cuts are available to avoid complete date input for every day when entering new data. Information on abbreviated date input can be read by pressing this button.
• "Delete measured data"
A dialogue box opens allowing measured data or data ranges to be deleted by defining a
start and end date or a start and end time.
5.2.1.4
"Modify hydrograph" button
You can edit all data for the current point using a constant. For example, assume that all groundwater levels were given with an error of one metre; by adding a "Constant 1.00" all measured
data can be corrected.
The four basic mathematical operations can be used. Additionally, the modifications can be limited to certain measured data ranges by activating the "Modify measured data from Date (1) to
Date (2)" check box.
GGU-TIME-GRAPH User Manual
Page 16 of 57
September 2008
5.2.1.5
"Import ASCII file" button
If measured data have been previously processed (in a text editor, for example) they can be imported after clicking the button. Here, too, it is possible to open new data or to append to the existing record using the "Append" button.
The current line of the ASCII file is shown at the top. You can move through the file using the
arrow buttons on the right. Enter the column number in which the respective data is located in the
"Date column" and "Value column". The "With time" check box allows the time to also be imported. Otherwise a time of 00.00 is allocated.
If all the information is correct, the result for the row is shown at the bottom right of the dialogue
box. Otherwise, "Error" appears. You may need to change the column delimiter. If the file contains invalid as well as valid rows, these will simply be skipped during import.
After the "Import data" button has been pressed and the data successfully imported, you will see
a message box with the number of values and character strings read. You can now process the data
further or move on to evaluation.
5.2.1.6
"Statistics" button
A dialogue box for statistical evaluation of the stored values at this point opens. The statistical
evaluation is carried out for the data range specified for the time axis of the hydrograph visualisation (see Section 0). If only a portion is visualised, only this portion will be taken into consideration in the statistics. In this case, however, a warning is issued beforehand, allowing the complete
data range to be used in the evaluation.
A statistical evaluation is all the more meaningful the more measured data is available. It is
therefore always more expedient to work with the complete data range.
GGU-TIME-GRAPH User Manual
Page 17 of 57
September 2008
Minimum and maximum values, variance and standard deviation, as well as extreme events and
probabilities, can be calculated for a given number of months or years by means of a further dialogue box.
For example, if you select the "Month(extreme)" button in the "Extreme events" line, you must
first enter the recurrence interval to be calculated.
The number shown in the box above, for instance, means a recurrence interval of "once in 100
years". The values are then calculated and displayed.
GGU-TIME-GRAPH User Manual
Page 18 of 57
September 2008
The "Print" button facilitates data output to a printer or, alternatively, to a file. The date values are
then positioned at the 15th of each month. They are printed again for the whole period every time
you press the print button.
The results for "Minimum", "Maximum" or "Mean" can be allocated directly to a hydrograph
via the "As new value for hydrograph:" button; the hydrograph can be specified in the dropdown list box beside the button.
For direct allocation a hydrograph must be previously defined (e.g. using "Hydrographs/Editor 1" button "New"), because only existing hydrographs are listed in the dropdown list box.
The hydrographs for "Mean", "Max 100 year" and "Min 100 year" in the "Example_02e_statistics.gis" file were calculated from the gauge hydrograph in this manner.
GGU-TIME-GRAPH User Manual
Page 19 of 57
September 2008
5.2.1.7
"Special" button
You see a command box that allows you to perform a whole range of further analyses with the
current data.
The operations are started directly after data input without further confirmation.
These operations directly affect your measured data!
Before you work with them you should always duplicate your hydrograph; this allows you
to keep a hydrograph containing the original data.
GGU-TIME-GRAPH User Manual
Page 20 of 57
September 2008
5.2.1.8
"Monthly values" button
If long-term data series' (several years) are available and new measured data is regularly accrued,
selected statistical evaluations can be performed more quickly or updated using this button: The
following dialogue box appears, for example
Select the evaluations to be performed by activating the appropriate "Use" check boxes. Enter a
description of the evaluation in the text boxes, which at the same time will be the name of the
respective new hydrograph. If the evaluation needs to be updated, for example because the measured data has been supplemented, activate the "Delete existing hydrographs with same name"
check box. The newly generated evaluation can then be saved again as a hydrograph with the
same name.
5.2.2
"Editor 2" menu item
If existing data needs to be edited for several data points, it is often a chore to open each point
individually. Using this menu item you can enter a common date and time in a dialogue box, either
new for all hydrographs, or by way of editing old values.
GGU-TIME-GRAPH User Manual
Page 21 of 57
September 2008
A numerical value need not be entered for every data point. If one of the data input boxes is left
empty, a new value will not be generated for this hydrograph. If the date and time coincide with an
existing value the old one will be replaced.
5.2.3
"Date axis" menu item
You can influence the appearance of the date axis in the graphical visualisation.
The various preferences can be selected after activation of the check boxes "Show days", "Show
month names" and "Show years". The date can be rotated by 90° using the "Show complete
date" check box.
Labelling is foregone if there is not enough room for your chosen visualisation.
For example, if you have selected "Show days" and "Label every 1st day" (every day), the
space available is generally insufficient. It is then better to label at every 7th day.
5.2.4
"Measured data axis etc." menu item
Using this menu item you can define the format of the hydrographs visualisation for the userdefined data points in a dialogue box (horizontal reference lines, measured data axis font size,
markers preferences).
A logarithmic measured data axis can also be defined. It is also possible to visualise the hydrographs as a bar chart, e.g. to visualise precipitation data. The measured data axis can also be labelled in this menu item's dialogue box.
GGU-TIME-GRAPH User Manual
Page 22 of 57
September 2008
5.2.5
"Select hydrographs" menu item
The data points for the hydrograph visualisation can be selected in the following dialogue box.
The complete range of measuring points to be activated using the "All" button and deactivated
using the "None" button. Individual measuring points can be switched on or off by clicking the
respective check boxes. If individual measuring points are activated, as shown in the dialogue box,
and a second hydrograph visualisation is needed to display the previously unmarked measuring
points, click the "Reverse" button.
If there are a large amount of data points you can navigate through the list using the "Forw." And
"Back" buttons.
5.2.6
"Display hydrograph" menu item
This menu item activates the hydrograph visualisation on the screen.
GGU-TIME-GRAPH User Manual
Page 23 of 57
September 2008
5.3
Contours menu
5.3.1
"Display" menu item
5.3.1.1
Select date for contours visualisation
Using this menu item the measured data can be visualised as contour lines. After completing new
input and before using this menu item, a triangle mesh (interpolation mesh) must be defined (see
the following Sections 5.3.2 pp). The program utilises this triangle mesh as the basis for interpolation between the individual data points.
After going to the "Contours/Display" menu item you have to select the date for the data visualisation.
In the so-called "Combo box" (top right) all dates can be selected for which data is available at all
wells. After selecting a date using the combo box it is displayed in the "Selected date:" input box.
Alternatively, you can enter a date by hand in the "Selected date:" input box. If data is not available at all wells for this date the missing values will be determined by linear interpolation. Further
details are explained by the text in the dialogue box.
The hydrograph visualisation also allows a time of day to be taken into consideration. Only
daily values can be taken into consideration for the visualisation using contour lines.
If, when editing the hydrograph, several measured data are available for a given date, the
mean of all data is used for the contour line visualisation.
GGU-TIME-GRAPH User Manual
Page 24 of 57
September 2008
5.3.1.2
Select type of contours
After selecting the required date the following dialogue box opens allowing the type of contour
visualisation to be specified, preferences for visualisation in general or the data to be output for
other applications.
In addition to the buttons described in more detail in Sections 5.3.1.3 - 5.3.1.9, the following operations can be carried out here:
• "Contours and gradients"
Allows combined presentation of contours and gradients. The settings for contour line representation are described in Section 5.3.1.4. The description of gradient representation can
be found in Section 5.3.1.6.
• "Edit font sizes"
You define the font sizes for axes labelling, etc.
• "Calculate area and volume"
The program computes the area and volume resulting from the data measured within the
defined triangle mesh. If data smaller than zero is present, negative volume will also be
computed. If the appropriate measured data are entered (e.g. ground level, thickness of topsoil, location of the excavation level) excavation volumes can also be computed.
• "Export to ASCII file"
You can generate an ASCII file with the current data, which can subsequently be processed
further, for example in a spreadsheet. The coordinates of the triangle mesh and the corresponding measured values are exported.
• "Export to GGU-GEO-GRAPH file"
You can generate an GGU-GEO-GRAPH fileto facilitate exporting the measured data to
the GGU-GEO-GRAPH application in order to process them further.
• "Cancel"
You exit the "Contours/Display" menu item.
GGU-TIME-GRAPH User Manual
Page 25 of 57
September 2008
5.3.1.3
"Display contours" button
The measured data can be displayed as lines of equal value, e.g. groundwater isohypses. A dialogue box opens allowing you to define preferences for contour line visualisation.
The program shows the existing smallest and largest values and the separation of the contour lines.
If you want the visualisation to begin with a different value, the initial value can be entered here.
You can also vary the spacing, in order to reduce the number of contour lines drawn for example.
If you select the "Contours" button in the previous dialogue box, the settings displayed here are
always those automatically selected by the program. Using the "Old values" button, the preferences used for the previous contour line diagram are adopted. This information is saved with the
record.
You can also select from three smoothing out procedures:
• "Do not smooth"
As a linear method is implemented within the triangle elements, this will provide analysis
results without smoothing performed by the program.
• "Method 1" and "Method 2"
these smoothing out procedures employ two different Bezier splines. Smoothing out intensities can be given for both in order to acquire smooth contour lines. Method 2 creates very
"round" contours, with the danger that the true results may be falsified.
Ther is no optimum method.
Method suitability depends on the type of data.
You can specify the type of visualisation for the contour lines by means of the "Dash preferences" and "Further preferences" buttons. These settings can also be adjusted in advance by
means of the "Presentation format (contours)" button (see Section 5.3.1.4).
GGU-TIME-GRAPH User Manual
Page 26 of 57
September 2008
If the preferences are confirmed by pressing "OK" the contours are displayed on the screen. The
colour defined in "Graphics preferences/Pen colour + width" is used. If the contours need to be
visualised in a different colour, the colour can be adapted to suit your requirements here (see Section 5.5.3).
5.3.1.4
"Presentation format (contours)" button
In the dialogue box you can specify preferences for the type of presentation and for contour line
labelling.
• "Frame triangle mesh"
A thin line is drawn around the outer edge of the mesh.
• "Show triangle mesh"
All triangles in the mesh are drawn.
• "Show data points"
The points and corresponding point names are displayed.
• "Show measured data"
The measured data at the corresponding points are displayed.
• "Label contours"
The contours are labelled, the text is positioned approximately in the centre of the contour
lines.
• "Label contours twice"
The contours are labelled at both ends.
• "Heading"
You can enter a text here to be displayed in the General legend.
• "Date in heading"
If you activate this check box the selected date for the contour line visualisation is automatically inserted after the heading text in the General legend.
GGU-TIME-GRAPH User Manual
Page 27 of 57
September 2008
If nothing has been defined as a heading and the "Date in heading" check box is deactivated, the General legend will only be displayed if one of the file name display check
boxes in the dialogue box is activated (see Section 5.5.8).
In addition, the number of decimal places and the font size can be defined for contour labelling, as
well as the font sizes for the measuring point labelling.
The "Dash preferences" button opens the following dialogue box
For example, if you want to display groundwater diagrams depicting large areas, the contour labelling may be very widely spaced. The settings in the above dialogue box would lead to the following contour lines for a selected contour spacing of 0.25 m.
5.3.1.5
"Display gradients" button
Using this button you can generate a gradient field. The gradients are computed from the three
values, one at each corner, for each triangle respectively. The length of the gradients can be controlled in the dialogue box.
GGU-TIME-GRAPH User Manual
Page 28 of 57
September 2008
Further gradient presentation format and labelling preferences can be specified by means of the
"Presentation format (gradients)" button in the above dialogue box (see the following Section
5.3.1.6).
5.3.1.6
"Presentation format (gradients)" button
In the dialogue box you can specify preferences for the type of presentation and for gradient labelling.
• "Frame triangle mesh"
A thin line is drawn around the outer edge of the mesh.
• "Show triangle mesh"
All triangles in the mesh are drawn.
• "Show data points"
The points and corresponding point names are displayed.
• "Show measured data"
The measured data at the corresponding points are displayed.
• "Label gradients"
The gradients are labelled with the gradient value.
• "Rotate text by 90 degrees"
Depending on the orientation of the gradient arrows, the labelling may be above the arrows.
It may be useful for clear visualisation to rotate the labelling by 90°.
•
"Fill arrows"
The gradient arrowheads are colour-filled with the colour given for gradients in the "Graphics preferences/Pen colour and width" menu item. If a different colour is required it
must be specified here (see Section 5.5.3).
• "Heading"
You can enter a text here to be displayed in the General legend.
• "Date in heading"
If you activate this check box the selected date for the gradient visualisation is automatically inserted after the heading text in the General legend.
GGU-TIME-GRAPH User Manual
Page 29 of 57
September 2008
If nothing has been defined as a heading and the "Date in heading" check box is deactivated, the General legend will only be displayed if one of the file name display check
boxes in the dialogue box is activated (see Section 5.5.8).
In addition, the number of decimal places and the font size can be defined for contour labelling, as
well as the font sizes for the measuring point labelling.
5.3.1.7
"Coloured contours" button
Using this button contour lines can be drawn with a colour fill.
• "Contour data" group box
The "Determine extreme values …" button computes the minimum and maximum values
and enters them into the appropriate input boxes. However, you need not retain these values, but can also define your own. If, based on the example shown in the dialogue box
above, you set the minimum value to 94.50 and the maximum value to 106.00, you will get
a colour change every 50 cm using 24 colours.
No smoothing of the contour lines can be performed here.
• "Colour fill" group box
Using "No. of colours" you can control the colour subdivisions of the contour line diagram. In the example above, 16 colours will be displayed between "Colour 1" and "Colour
2". The default setting uses a colour course from red to blue. These colours can be edited as
wished after selecting the "Colour 1" and "Colour 2" buttons, or simply reverse the choice
by selecting "Change colour series".
GGU-TIME-GRAPH User Manual
Page 30 of 57
September 2008
• "Further preferences" group box
In addition to the colour presentation you can also have the triangle mesh and/or the outline
displayed. Additional contour lines can also be drawn. Line labelling preferences can be
defined by means of the "Labelling preferences" button.
• "OK"
The colours will be drawn after confirmation.
A colour bar at the right edge of the sheet allows correlation between the colour and the corresponding value. If this colour bar is drawn in the right page margin, specify a larger value for the
right plotting margin (e.g. 25 mm) in the "Page size + margins/Page size and margins" menu
item (see Section 5.6.1).
5.3.1.8
"3D contours" button
Using this button contours are visualised as a three dimensional image.
First, select the point of observation (position of the "eye" in x, y and z coordinates), the type of
projection and the zero level of the 3D presentation. The values are displayed above and below the
zero level (z ordinate) in three dimensions. The program will generally make sensible suggestions
for the input values in the dialogue box, so you will not normally need to make alterations.
After leaving the dialogue box by pressing "OK" you will see the following dialogue box. It
greatly resembles the box shown in the "Contours/Display" menu item "Coloured contours"
button (see Section 0).
GGU-TIME-GRAPH User Manual
Page 31 of 57
September 2008
You can also specify whether an enclosing cube should be displayed; in some cases this improves
the 3D effect. The "Shade from colour 1 to colour 2" check box represents a bit of a special
effect. If this check box is activated a light source is simulated in the region of the eye. The angle
between the light beam and the respective 3D surface represents a measure of the reflection. The
area is shaded in accordance with colours 1 and 2. A good choice of colours, for example, would
be dark grey for colour 1 and pale grey for colour 2.
If the triangle mesh is very irregular in plan, the 3D impression will probably not be optimum. You should then use the "3D in rectangle array" button.
GGU-TIME-GRAPH User Manual
Page 32 of 57
September 2008
5.3.1.9
"3D contours (array)" button
The 3D effect is usually lost in an irregular triangle mesh. The contours are then presented as a
three dimensional image in a rectangular array. The following dialogue box opens where you can
define the array by selecting the number of x and y subdivisions (plates):
The program interpolates the values to be represented at the array points from the underlying triangle mesh. After leaving the dialogue box by pressing "OK" you will at first see the same boxes
for defining the eye etc. and the coloured contours preferences as that described in the "Contours/Display" menu item "3D contours" button (see Section 5.3.1.8).
5.3.2
"Automatic triangle mesh" menu item
In order to visualise contour lines the program first requires a triangle mesh (interpolation mesh),
which serves as the basis for contour line smoothing. This mesh need only be defined once and is
then saved with the dataset. This menu items allows you to have the mesh generated automatically
by the program.
5.3.3
"Manually" menu item
Generally, the automatically generated triangle mesh is very high quality. However, there are
cases in which you might want to generate a different interpolation between individual points.
Using this menu item, you can create a triangle mesh completely by hand or rework an existing
mesh. A message box provides information on the procedure:
To define a triangle mesh (interpolation mesh) the data points are first displayed in their correct
locations.
If no points are visible, got to the "Page size + margins/Auto-resize" menu item or use the
[F9] function key.
GGU-TIME-GRAPH User Manual
Page 33 of 57
September 2008
Then click three data points with the left mouse button; these then represent an interpolation triangle. Repeat this process until all the required data points are integrated into the triangle mesh. By
pressing the right mouse button you can reset a triangle.
The triangles may not overlap as this will almost always lead to nonsensical contours. You can
have this condition tested by the program by going to the "Contours/Test" menu item.
If you want to delete an existing triangle, click the points of the triangle once more. By pressing
the right mouse button you can reset a triangle.
5.3.4
"Round off" menu item
During automatic generation a triangle mesh is generated that envelops all points. This can lead to
acute-angled triangle elements in the boundary regions. These triangles can be removed from the
triangle mesh using this menu item.
The program first computes the maximum and average radius ratios of the most unfavourable
triangle. The radius ratio describes the relationship between external radius and internal radius of a
triangle. For an isosceles triangle, this ratio equals 2.0 (optimum).
A dialogue box then opens, allowing you to define a radius ratio, above which all triangles are
deleted.
In the example above, all external triangles with a radius ratio greater than 10.31 will be removed.
In order to avoid interpolation holes in the triangle system only triangles at the boundaries
are deleted.
5.3.5
"Test" menu item
The program examines the existing triangle mesh for overlapping triangles, which would normally
lead to undesirable results.
GGU-TIME-GRAPH User Manual
Page 34 of 57
September 2008
5.3.6
"Display" menu item
You can have the triangle mesh (interpolation mesh) presented by means of the following dialogue
box.
Using the "Select presentation format" button you have the option of specifying a number of
preferences for the presentation, e.g. labelling with point names or triangle numbers.
5.3.7
"Delete" menu item
Using this menu item you can delete the triangle mesh, in part or completely. You must first click
four points in anti-clockwise direction. All triangles with their centroid within this quadrilateral
will be deleted.
5.3.8
"Save" menu item
You can save the triangle mesh separate from the dataset, in order to use varying interpolation
meshes for the same system, for example.
5.3.9
"Load" menu item
You can load a previously saved triangle mesh (interpolation mesh).
5.3.10
"Test coordinates" menu item
If you work with eastings and northings a lot of digits are lost numerically, because the coordinate
values only differ in the final four digits before the point.
GGU-TIME-GRAPH User Manual
Page 35 of 57
September 2008
It may then be expedient, and in extreme cases unavoidable, to work with a so-called offset. For
example, you can subtract 3,550,000 m from all eastings between 3,555,000 m and 3,556,000 m
and then work in the range from 5,000 m to 6000 m. You can make this offset visible in the graphics by correspondingly labelling the x and the y axis (see menu item "Contours/Labelling x
and y axes", see Section 5.3.12).
If the coordinates are too large, the above dialogue box opens, for example. The "Edit coordinates" button opens the same box as used in the menu item "Contours/Edit coordinates" (see Section 5.3.11). However, the program enters the recommended offset values directly into the appropriate input boxes.
5.3.11
"Edit coordinates" menu item
Using this menu item you can edit the coordinates of all data points. For example, if you used an
incorrect scale during input, it can be corrected here by applying an appropriate factor. You can
apply the factor to one direction only if necessary, i.e. to the x or to the y coordinate.
The coordinates can be displaced in x- or y-direction in order to achieve correct positioning.
If your point coordinates are given in eastings and northings you can displace them by the
required hundred thousand and ten thousand value. The resulting coordinate values are in
the thousands range.
5.3.12
"Labelling x and y axes" menu item
Labelling can be entered for the x and y axes of the contour visualisation.
GGU-TIME-GRAPH User Manual
Page 36 of 57
September 2008
5.4
Section menu
5.4.1
General notes on sections
You can generate true-to-scale sections, visualising measured data from various points for a userdefined date as hydrographs.
5.4.2
"Define" menu item
5.4.2.1
Define section course
After going to this menu item you will see the following dialogue box with explanations of how to
define a section
If the "Search for appropriate dates "loosely"" check box is not clicked, the following section
will only allow the dates for which data is available at all data points to be selected.
By clicking on "Load section" it is possible to load a section course saved during a previous session. If you have already defined a section during the current session, you can reload this section
using the "Prev. section" button. In both cases the section course is first displayed on the screen
and must be confirmed by pressing the [Return] or [Enter] key.
If you click "OK", you can define a new section course. The interpolation mesh and data points
are displayed on the screen to assist you. The data points are clicked in the sequence required (the
later section visualisation is always from left to right) using the left mouse button. The last point
defined can be reset using the right mouse button. Here, too, the section course is completed by
pressing [Return] or [Enter].
GGU-TIME-GRAPH User Manual
Page 37 of 57
September 2008
5.4.2.2
Select date for section visualisation
After confirming the section course the following dialogue box opens in all cases, allowing you to
define the dates for which the measured data should be visualised as hydrographs in section. It is
possible to visualise 40 date values. To specify the dates click on the "Arrow down" key and then
click the required dates from the drop-down list boxes.
At the end of each list you can select "Maximum", "Minimum" or "Mean". The selected value is
then determined for all available dates for each data point.
The complete list of dates can be switched on or off using the "None" and "All" buttons. If you
have selected a number of dates, for example, and would then like to visualise only one date, first
turn off all dates using "None" and then select the required date.
Alternatively, by means of "All from" and "All till" and the corresponding date box, you can
select all dates before or after the given date. You can also use the two date boxes to define a start
and an end date for a given period. Then click the "All before after" button.
Wenn Sie Ihre Eingaben mit "OK" bestätigen, erhalten Sie eine Dialogbox, in der Sie Einstellungen zur Darstellung des Schnittes eingeben können. Dieselbe Dialogbox erhalten Sie auch, wenn
Sie den Menüeintrag "Schnitt / einstellen" anwählen (siehe Erläuterungen in Abschnitt 5.4.3).
GGU-TIME-GRAPH User Manual
Page 38 of 57
September 2008
5.4.3
"Preferences" menu item
The following dialogue box opens for graphical visualisation of the hydrographs
• "Preferences" group box
If the "Section in colour" check box is activated the whole area of the data is filled. The
colours and hatching defined in the menu item "Section/Pens (section)" are used (see Section 5.4.4).
You can also define the intercept of the x-axis with the y-axis ("y0"). In this case the "Use"
switch must be activated. If you decide not to make use of this option, the x-axis will intercept the y-axis at the smallest occurring value of y. For example, use of a fixed value for
"y0" is useful if you need to visualise a number of sections and all need to be drawn with
the same base line.
If you have activated the "Recalculate image coordinates" check box, the program will
calculate the optimum image coordinates each time. If you need a section with fixed coordinates and a constant scale, which you may want to save as a section for long-term studies,
you should always deactivate this check box. The coordinates can be edited using the menu
item "Page size + margins/Manual resize (editor)" (see Section 0).
• "Labelling" group box
You can specify preferences for automatic section labelling. When activated the program
inserts a table, containing the selected values at the points defined, below the section. The
labelling font size can be altered to suit requirements.
• "Operations" group box
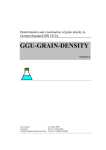
The current section can be saved to a file using the "Save section" button. The coordinate
and scale settings, and all Mini-CAD elements displayed in the current section are saved
with the file. This can be used, for example, to define the course of a section for a special
embankment profile, enabling long-term observation and visualisation of the phreatic lines,
as the following figure illustrates.
GGU-TIME-GRAPH User Manual
Page 39 of 57
September 2008
29.1 0.1998
30.1 0.1998
31.1 0.1998
01.1 1.1998
03.1 1.1998
04.1 1.1998
05.1 1.1998
06.1 1.1998
07.1 1.1998
09.1 1.1998
11.1 1.1998
13.1 1.1998
16.1 1.1998
19.1 1.1998
23.1 1.1998
44
42
44, 46
44 ,25
H ochw ass errückhaltebecken
b
a
Lege nde
44, 35
B eweis siche rung im E instauf all:
S ic kerwass er-Be obacht ung s brunnen in d en Dämmen
44 ,50
44 ,2 5
- Brun nenst af fel:
- Stan dort:
- Station:
1 O st (a, b, c)
Zuleiterdamm (O s t)
0+ 95 0
M ax. -S ta u NN + 42,25
4 0,7 0
Hauptbeck en
4 0,5 0
40
c
ös tl. Randgraben
3 9,1 0
38
37, 02
3 6, 82
36 ,73
3 6,43
36, 49
36 ,1 6
3 6, 12
36
35 ,53
35,25
35, 13
34
33, 83
32
-40
-30
-20
-10
0
10
20
30
40
50
The section will be drawn on the screen after clicking the "Display" button. In addition, a
legend showing the date allocation to the graph used and a location map, showing the system outline and the defined section, are automatically displayed. These legends (data and
section course) are activated by default, but can be deactivated in the menu items "Graphics preferences/Date legend" and "Graphics preferences/Section course legend" (see
Sections 5.5.10 and 5.5.11).
GGU-TIME-GRAPH User Manual
Page 40 of 57
September 2008
5.4.4
"Pens (section)" menu item
You can define a pen for each selected date of the hydrograph section visualisation. You will first
see the following box:
After clicking individual buttons you can define certain preferences. For example, if you click
"Colours" you will see the following box:
The default setting shows a course from red to blue for 40 date values. If considerably less dates
than this are visualised in a section it may make sense to define different colours. One colour can
be assigned to all values using the "For all" button.
5.5
5.5.1
Graphics preferences menu
"Refresh and zoom" menu item
The program works on the principle of What you see is what you get. This means that the screen
presentation represents, overall, what you will see on your printer. In the last consequence, this
would mean that the screen presentation would have to be refreshed after every alteration you
make. For reasons of efficiency and as this can take several seconds for complex screen contents,
the screen is not refreshed after every alteration.
GGU-TIME-GRAPH User Manual
Page 41 of 57
September 2008
If, e.g., after using the zoom function (see below), only part of the image is visible, you can
achieve a complete view using this menu item.
A zoom factor between 0.4 and 8.0 can be entered in the input box. By then clicking on "Use" to
exit the box the current factor is accepted. By clicking on the "0.4", "0.6", etc. buttons, the selected factor is used directly and the dialogue box closed.
It is much simpler, however, to get a complete overview using [Esc]. Pressing [Esc] allows a complete screen presentation using the zoom factor specified in this menu item. The [F2] key allows
screen refreshing without altering the coordinates and zoom factor.
5.5.2
"Zoom info" menu item
By clicking two diametrically opposed points you can enlarge a section of the screen in order to
view details better. An information box provides information on activating the zoom function and
on available options.
5.5.3
"Pen colour and width" menu item
For reasons of clarity different colours are used as default for the graphical representation of contour lines, hydrographs, gradients, etc.
You can edit the pen widths for the elements shown in the dialogue box; by clicking on the button
with the element designation you can also edit the pen or fill colours.
Your preferences can be saved in a file with the ".stf" extension. If you save the file in the program folder (default), your preferences will be automatically loaded the next time you start the
program.
GGU-TIME-GRAPH User Manual
Page 42 of 57
September 2008
On monochrome printers (e.g. laser printers), colours are shown in a corresponding grey scale.
Graphic elements employing very light colours may be difficult to see. In such cases it makes
sense to edit the colour preferences.
5.5.4
"Legend font selection" menu item
With this menu item you can switch to a different true-type font. All available true-type fonts are
displayed in the dialogue box.
GGU-TIME-GRAPH User Manual
Page 43 of 57
September 2008
5.5.5
"Mini-CAD toolbar" and "Header toolbar" menu items
Using these two menu items you can add free text to the graphics and add lines, circles, polygons
and images (e.g. files in formats BMP, JPG, PSP, TIF, etc.). The same pop-up menu opens for
both menu items, the icons and functions used are described in more detail in the Mini-CAD
manual provided. The differences between the Mini-CAD and Header CAD are as follows:
• Objects created with Mini-CAD are based on the coordinate system (generally in metres),
in which the drawing is produced, and are shown accordingly. You should use the "MiniCAD toolbar" when you wish to add information to the system (for example, labelling of
slope inclinations or the location of any foundations).
• Objects created with the Header CAD are based on the page format (in mm). This makes
you independent of the coordinate system and keeps you in the same position on the page.
You should select the "Header toolbar" if you wish to place general information on the
drawing (company logo, report numbers., plan numbers, stamp etc.). Once you have saved
the header information to disk (see Mini-CAD user manual), you can load it into completely different systems (with different system coordinates). The saved header information
will appear in exactly the same position on the page, which greatly simplifies the creation
of general page information.
5.5.6
"Toolbar preferences" menu item
After starting the program a horizontal toolbar for menu items appears below the program menu
bar. If you would rather work with a popup window with several columns, you can specify your
preferences using this menu item. The smarticons can also be switched off.
At the bottom of the program window you find a status bar with further information. You can also
activate or switch off the status bar here. The preferences will be saved in the "GGU-TIMEGRAPH.alg" file (see menu item "Graphics preferences/Save graphics preferences") and will
be active at the next time the program is started.
By clicking on the tools (smarticons) for the menu items you can directly reach most of the program functions. The meaning of the smarticons appears as a text box if you hover with the mouse
pointer over the tools. Some of the tool functions cannot be activated from the normal menu items.
"Zoom out"
If you have previously zoomed in, this tool returns to a full screen display.
"Zoom (-)"/"Zoom (+)"
With the zoom functions you can zoom in or out of parts of the image, by clicking the left mouse
button.
"Copy/print area"
Use this tool to copy only parts of the graphics in order to paste them, e.g. to a report. You will see
information on this function and can then mark an area, which is copied to the clipboard or can be
saved in a file. Alternatively you can send the marked area directly to your printer.
GGU-TIME-GRAPH User Manual
Page 44 of 57
September 2008
5.5.7
"3D toolbar" menu item
This menu item allows you to choose a pop-up window with tools for advanced editing of the
three-dimensional graphics. If you hover with the mouse pointer over the tools, the meaning of the
Smarticons appears in a text box.
The "Rotation by …" tool allows you to rotate the graphics around one of the three axes. The plus
and minus signs designate the direction of rotation. The angle of rotation can be adjusted as
wished using the
5.5.8
tool.
"General legend" menu item
If the "Show legend" check box is activated in this menu item's dialogue box, a general legend is
shown on the screen when visualising contours and gradients. The shape and appearance of the
legend can be altered. If a heading is entered or the check box "Date as heading" is activated in
the dialogue boxes accessed via the "Presentation format (contours)" and "Presentation format
(gradients)" buttons (see Sections 5.3.1.4 and 5.3.1.6) in the menu item "Contours/Display", the
heading and the currently selected data date are also displayed in the legend.
You can define and edit the position of the legend using the values "x" and "y". You control the
size of the legend using "Font size" and "max. no. of lines"; where necessary, several columns are
used. The fastest way to modify the position of the legend is to press the [F11] function key and
then to pull the legend to the new position with the left mouse button pressed.
By activating the "Short" or "Long" option buttons the current file name can be shown in the
legend, either with or without the path.
If nothing is entered as a heading and the "Date in heading" check box is deactivated in
the "Contours/Display" menu item (buttons "Presentation format (contours)" and
"Presentation format (gradients)"), the general legend will only be displayed if one of the
file name display check boxes in the above dialogue box is activated.
GGU-TIME-GRAPH User Manual
Page 45 of 57
September 2008
5.5.9
"Hydrographs legend" menu item
When visualising hydrographs a descriptive legend can be displayed with the allocations for lines
and markers to the hydrographs of the selected data. The position and appearance of the legend
can be modified if the "Show legend" check box in this menu item's dialogue box is activated.
A text can be specified as legend header. You can define and edit the position of the legend using
the values "x" and "y". You control the size of the legend using "Font size" and "Max. no. of
lines"; where necessary, several columns are used. The fastest way to modify the position of the
legend is to press the [F11] function key and then to pull the legend to the new position with the
left mouse button pressed. The legend can be provided with a coloured background fill; the colour
can be edited via the "Background colour" button.
GGU-TIME-GRAPH User Manual
Page 46 of 57
September 2008
5.5.10
"Section course legend" menu item
Once the section is complete you can have the location of the section displayed in plan. The triangle mesh can also be visualised.
The position of the legend can be defined and edited using the values "x" and "y", "Width" and
"Height". You can edit the font size of the entered heading. The triangular mesh in the sketch can
be provided with a coloured background. The colour can be edited using the "Mesh colour" button id the "Coloured mesh" check box is activated.
5.5.11
"Date legend" menu item
If the hydrographs are visualised in a section a descriptive legend containing an allocation of the
graphs to the selected dates can be displayed. The position and appearance of the legend can be
modified if the "Show legend" check box in this menu item's dialogue box is activated.
GGU-TIME-GRAPH User Manual
Page 47 of 57
September 2008
A text can be specified as legend header. You can define and edit the position of the legend using
the values "x" and "y". You control the size of the legend using "No. of lines", "Dash length" and
"Font size"; where necessary, several columns are used. The fastest way to modify the position of
the legend is to press the [F11] function key and then to pull the legend to the new position with
the left mouse button pressed. The legend can be provided with a coloured background fill; the
colour can be edited via the "Background colour" button.
5.5.12
"Move objects" menu item
Select this menu item in order to position a legend at the desired position on the output sheet. You
can also move objects by pressing [F11] and then positioning the legend box with the left mouse
button pressed. In that case an info-box appears no more.
5.5.13
"Load graphics preferences" menu item
You can reload a graphics preferences file into the program, which was saved using the
"Graphics preferences/Save graphics preferences" menu item. Only the corresponding data will
be refreshed.
5.5.14
"Save graphics preferences" menu item
Some of the preferences you made with the menu items of the "Graphics preferences" menu can
be saved to a file. If you select "GGU-TIME-GRAPH.alg" as file name, and save the file on the
same level as the program, the data will be automatically loaded the next time the program is
started and need not be entered again.
GGU-TIME-GRAPH User Manual
Page 48 of 57
September 2008
5.6
5.6.1
Page size + margins menu
"Page sizes and margins" menu item
Page format preferences can be defined in a dialogue box. The dialogue box contains five group
boxes.
In the "Page height" and "Page width" group boxes the required page formats can be selected
directly by clicking or user-defined values entered. The A3 format is set as default. The program
automatically draws thin cutting borders around the page, which are required when using a plotter
on paper rolls. The borders can be switched off using the "With borders" check box. Markers for
the bottom and right-hand edges can be activated in the "Fold marking" group box.
"Page margin" defines the position of a frame as a distance to the margins. This frame encloses
the subsequent diagram. You can switch off the frame deactivating the "With margins" check
box. The "Plot margin" define a set distance between the page margin and the actual drawing
area in which the graphical evaluation of your input is presented. If the "Contours with axes"
check box is deactivated the x- and y-axis labelling is switched off in the subsequent contour visualisation
GGU-TIME-GRAPH User Manual
Page 49 of 57
September 2008
5.6.2
"Auto-resize" menu item
When this menu item is utilised the program calculates the image coordinates, ensuring that all
data points are displayed. In a hydrograph visualisation this means that all measured data are visualised with an adjustment on the y-axis to the minimum and maximum heights for the complete
time range (x-axis). In a contour line visualisation a true-to-scale visualisation of the data points
and contours for both coordinate axes is achieved. This can be useful,
• if, after a hydrograph visualisation, you want to include further hydrographs lying outside
of the original image coordinates.
• if, after graphical visualisation of contour lines, new data points are added, lying outside of
the original image coordinates.
• If, despite all your efforts, graphics cannot be correctly visualised on the screen. In a previous step, you probably altered the image coordinates to such an extent that visible graphic
elements are no longer within the area seen on the screen.
This function can also be accessed using the [F9] function key."Auto-resize date axis" menu
item
Only the x-axis (date values) coordinates are recalculated, for example if they were previously
included in a different section. The measured data (y-coordinate) visualisation remains unchanged.
This function can also be accessed by pressing [F8].
5.6.4
"Auto-resize measured data axis" menu item
Only the y-axis coordinates are recalculated, i.e. all measured data are readjusted to the minimum
and maximum heights. The date axis remains unchanged for the previously defined section. This
function can also be accessed by pressing [F7].
5.6.5
"Manual resize (editor)" menu item
The image coordinates can be modified by direct numerical input in a dialogue box. The dialogue
box displays the existing preferences for the currently selected visualisation. In the dialogue box
example shown, which opens for hydrograph visualisation, an earliest and a latest date can be
specified for the x-axis and a minimum and a maximum measured data value for the y-axis.
The lower and left image boundary and the scale in x- and y-direction are defined for contour or
section visualisation. In the same way it is possible to always use the same scale and the same
coordinates for different sections, to facilitate direct comparisons, for example.
GGU-TIME-GRAPH User Manual
Page 50 of 57
September 2008
5.6.6
"Manual resize (mouse)" menu item
You can alter the image coordinates graphically with the mouse. In the dialogue box you are offered two choices.
• You can use the coordinates of a section of the visualisation as the new image coordinates
by marking the desired area with the mouse, pressing the left mouse button and holding the
[Ctrl] and [Shift] keys. The scales of the x- and y-axes are adjusted accordingly. If the previous proportions (scale x-direction/scale y-direction) need to be retained, the "Proportional section" check box must be activated.
• By activating the "Redefine origin" button you can change the image coordinates without
altering the scale. In this way, you can quickly achieve the desired presentation with a suitably defined scale without annoying trial and error with the x/y coordinates.
GGU-TIME-GRAPH User Manual
Page 51 of 57
September 2008
5.7
5.7.1
? menu
"Copyright" menu item
You will see a copyright message and information on the program version number.
The "System" button shows information on your computer configuration and the folders used by
GGU-TIME-GRAPH.
5.7.2
"Maxima" menu item
You will see information on the maximum number of hydrographs and points per hydrograph
allowed by the program.
5.7.3
"Help" menu item
The GGU-TIME-GRAPH online-help is opened using an installed browser (e.g. MS Internet
Explorer). The help function can also be accessed using the [F1] function key.
5.7.4
"GGU on the web" menu item
Using this menu item you can access the GGU Software website: www.ggu-software.com.
Keep in touch with new program versions and the regular download offers.
If you would like to be automatically notified about program innovations, please register for the
Newsletter in our Knowledge Base. Go to the following website: http://kbase.civilserve.com.
5.7.5
"GGU support" menu item
This menu item takes to the GGU-Software Support area at www.ggu-software.com.
5.7.6
"Meteorology + pedology" menu item
Using this menu item you can determine certain meteorological and pedological parameters, e.g.
evaporation rates according to DVWK Fact Sheet 238/1996 "Determination of evaporation on
land and over water" ("Ermittlung der Verdunstung von Land- und Wasserflächen").
5.7.7
"What's new?" menu item
You will see information on program improvements in comparison to older versions.
5.7.8
"Language preferences" menu item
This menu item allows you to switch the menus and the graphics from German to English and vice
versa. To work in German, deactivate the two switches "Dialoge + Menüs übersetzen (translate
dialogues, menus)" und "Graphiktexte übersetzen (translate graphics)".
Alternatively, you can work bilingually, e.g. with German dialogue boxes but with graphic output
in English. The program always starts with the language setting applicable when it was last ended.
GGU-TIME-GRAPH User Manual
Page 52 of 57
September 2008
6 Tips
Slow screen output generated using the contour line menu items can be cancelled by clicking the
right mouse button.
You can scroll the screen with the keyboard using the cursor keys and the [Page up] and [Page
down] keys. By clicking and pulling with the mouse, with [Ctrl] pressed, you activate the zoom
function, i.e. the selected section will fill the screen. Use the mouse wheel to zoom in or out of the
screen view or to pan.
In addition, scale and coordinates of the system graphics (drawing area within the plotting margins) can be altered directly using the mouse wheel. The following mouse wheel functions are
available
Change system graphics (new values can be checked in "Page size + margins/Manual resize
(editor)"):
• [Ctrl] + mouse wheel up
= enlarge system graphics (change of scale)
• [Ctrl] + mouse wheel down
= shrink system graphics (change of scale)
• [Shift] + mouse wheel up
= move system graphics up
(change in system coordinates)
• [Shift] + mouse wheel down
= move system graphics down
(change in system coordinates)
• [Shift] + [Ctrl] + mouse wheel up
= move system graphics right
(change in system coordinates)
• [Shift] + [Ctrl] + mouse wheel down = move system graphics left
(change in system coordinates)
Change screen coordinates:
• Mouse wheel up
= move screen image up
• Mouse wheel down
= move screen image down
• [Alt] + [Ctrl] + mouse wheel up
= enlarge screen image (zoom in)
• [Alt] + [Ctrl] + mouse wheel down
= shrink screen image (zoom out)
• [Alt] + [Shift] + mouse wheel up
= move screen image right
• [Alt] + [Shift] + mouse wheel down = move screen image left
GGU-TIME-GRAPH User Manual
Page 53 of 57
September 2008
If you click the right mouse button anywhere on the screen a context menu containing the principal menu items opens.
By double-clicking the left mouse button on legends or Mini-CAD objects, the editor for the selected object immediately opens, allowing it to be edited.
Some of the function keys are assigned program functions. The allocations are noted after the
corresponding menu items. The individual function key allocations are:
• [Esc] refreshes the screen contents and sets the screen back to A3 format. This is useful if,
for example, you have used the zoom function to display parts of the screen and would like
to quickly return to a complete overview.
• [F1] opens the online-help.
• [F2] refreshes the screen without altering the current magnification.
• [F3] opens the menu item "Graphics preferences/Zoom info".
• [F7] activates the menu item "Page size + margins/Auto-resize date axis".
• [F8] activates the menu item "Page size + margins/Auto-resize measured data axis".
• [F9] activates the menu item "Page size + margins/Auto-resize".
• [F11] activates the menu item "Graphics preferences/Move objects".
GGU-TIME-GRAPH User Manual
Page 54 of 57
September 2008
7 Index
A
Angle of rotation, 3D graphics ......................... 45
Area, calculate .................................................. 25
ASCII data, export to file ............................. 9, 25
ASCII data, import as measured data for
individual point ............................................ 17
ASCII data, import file with all data points........ 7
ASCII file, export measured data to ................. 14
Automatic image coordinates ........................... 50
Axes labelling, define font size ........................ 25
Axis labelling, enter text for hydrograph.......... 22
Axis labelling, enter texts for contour
visualisation ................................................. 36
Axis labelling, turn off for contour
visualisation ................................................. 49
B
Bar chart, activate display ................................ 22
C
Clipboard .......................................................... 10
CodeMeter stick.................................................. 5
Colour bar, define for contours......................... 30
Colour fill, activate for gradient arrows............ 29
Colours, define for contours/gradients.............. 43
Colours, define the same for all hydrographs ... 43
Company letterhead, add via Mini-CAD.......... 44
Context menu ................................................... 54
Contour lines, edit pen colour and width.......... 43
Contours and gradients, display........................ 25
Contours, activate labelling .............................. 27
Contours, define dashing .................................. 26
Contours, generate 3D visualisation ................. 31
Contours, generate 3D visualisation in
rectangle array.............................................. 33
Contours, generate coloured visualisation ........ 30
Contours, generate normal lines ....................... 26
Contours, select date for visualisation .............. 24
Contours, smoothing out procedures ................ 26
Coordinates, alter with mouse .......................... 51
Coordinates, automatically optimise data axis . 50
Coordinates, automatically optimise date axis . 50
Coordinates, modify via editor ......................... 50
Coordinates, optimise automatically ................ 50
Copy/print area ........................................... 10, 44
Cutting borders, switch off ............................... 49
Data points, test coordinates ............................. 35
Date axis, define for hydrographs
visualisation ................................................. 22
Date, activate automatically display in
legend..................................................... 27, 29
Date, display in legend for section ................... 47
Date, input info................................................. 16
Datue, automatic axis optimisation................... 50
Delete, all measured data of one data point ...... 14
Delete, individual data point............................. 14
Delete, individual triangle mesh elements ........ 34
Delete, selected triangle mesh elements ........... 35
Drawing area, define......................................... 49
DXF file, export................................................ 10
DXF file, import ................................................. 5
E
Eastings, adapt coordinates............................... 36
EMF format ...................................................... 10
Evaporation after Haude ................................... 14
Extreme events, calculate ................................. 18
Extreme values, determine for contours
visualisation ................................................. 30
F
File, add .............................................................. 7
File, display name in legend ............................. 45
File, load/save..................................................... 7
Font size, define for axes labelling ................... 25
Font size, define for date axis ........................... 22
Font size, define for measured data axis
labelling........................................................ 22
Font, select........................................................ 43
Function keys ................................................... 54
G
General legend, activate/alter ........................... 45
General legend, enter heading and date ...... 27, 29
General page informations, add via
Mini-CAD .................................................... 44
GGUCAD file, export....................................... 10
GGU-GEO-GRAPH data, export to file ........... 25
GGUMiniCAD file, export ............................... 10
Gradients, activate arrow colour fill ................. 29
Gradients, activate labelling ............................. 29
Gradients, edit pen colour and width ................ 43
Gradients, generate visualisation ...................... 28
Graphics, add via Mini-CAD............................ 44
D
Dashing, define for contours............................. 28
Data acquisition system .................................... 14
Data points, define............................................ 12
Data points, delete all ....................................... 12
Data points, delete/duplicate individually ........ 14
Data points, display in evaluation
graphics .................................................. 27, 29
Data points, edit coordinates ............................ 36
GGU-TIME-GRAPH User Manual
H
Header CAD, use.............................................. 44
Hydrographs, activate visualisation.................. 23
Hydrographs, define the same pen colour
and width for all ........................................... 43
Hydrographs, select for visualisation................ 23
Hydrographs, visualisation preferences ............ 22
Page 55 of 57
September 2008
I
Installation .......................................................... 5
K
Knowledge Base............................................... 52
L
Labelling table, activate for section.................. 39
Labelling, define for measured data axis .......... 22
Language preferences ................................... 6, 52
Legend, move with mouse................................ 48
Licence protection .............................................. 5
Point coordinates, test....................................... 35
Precipitation data, display as bar chart ............. 22
Preferences, program ........................................ 48
Presentation format, contours ........................... 27
Presentation format, gradients .......................... 29
Print, graphics..................................................... 9
Print, section ..................................................... 10
Print, several files ............................................. 11
Printer preferences.............................................. 9
Program, default maximum values ................... 52
Program, improvements.................................... 52
Program, information........................................ 52
Program, preferences ........................................ 48
Project data, add via Mini-CAD ....................... 44
R
M
Markers, activate for hydrographs
visualisation ................................................. 22
MDS file, import .............................................. 14
Measured data axis, activate logarithmic
display .......................................................... 22
Measured data axis, visualisation preferences .. 22
Measured data, automatic axis optimisation..... 50
Measured data, delete for one data point .......... 14
Measured data, delete individually ................... 16
Measured data, delete ranges............................ 16
Measured data, display in evaluation
graphics .................................................. 27, 29
Measured data, edit using a constant ................ 16
Measured data, enter/edit.................................. 15
Measured data, enter/edit for a common date... 21
Measured data, export to ASCII file....... 9, 14, 25
Measured data, export to
GGU-GEO-GRAPH file .............................. 25
Measured data, import as ASCII file for
all data points ................................................. 7
Measured data, import as DWD ASCII file...... 14
Measured data, import as MDS file .................. 14
Measured data, import as SEBA ASCII file ..... 14
Measured data, import ASCII file for
individual point ............................................ 17
Measured data, load/save/append ..................... 14
Measured data, merge......................................... 7
Measurement series', statistical evaluation ....... 21
Metafile, export ................................................ 10
Mini-CAD file, export ...................................... 10
Mini-CAD, use ................................................. 44
Mouse wheel functions..................................... 53
N
Northings, adapt coordinates ............................ 36
P
Page format, define........................................... 49
Page margins, define/switch off ....................... 49
Pens, define for contours/gradients................... 43
Pens, define for hydrographs in section............ 41
Pens, edit for individual hydrographs ............... 13
Plot margins, define.......................................... 49
Point coordinates, edit ...................................... 36
GGU-TIME-GRAPH User Manual
Radius ratio, triangle mesh elements ................ 34
Recurrence interval, enter................................. 18
Reference lines, activate for hydrographs
visualisation ................................................. 22
S
Scroll the screen ............................................... 53
Section course, define....................................... 37
Section, load ..................................................... 37
Section, save ..................................................... 39
Section, select date for visualisation................. 38
Section, visualisation preferences..................... 39
Smarticons, 3D graphics................................... 45
Smarticons, for menu items .............................. 44
Smoothing out procedures, contours................. 26
Statistical evaluation, carry out ........................ 17
Statistical evaluations, update for
measurement series'...................................... 21
Status bar main program, activate..................... 44
System, information.......................................... 52
T
Time of day, take into consideration for
visualisations................................................ 24
Toolbar, 3D graphics ........................................ 45
Toolbar, for menu items ................................... 44
Translation........................................................ 52
Triangle mesh, define/edit with mouse click .... 33
Triangle mesh, delete elements automatically .. 34
Triangle mesh, delete individual elements........ 34
Triangle mesh, delete selected elements........... 35
Triangle mesh, display in evaluation
graphics .................................................. 27, 29
Triangle mesh, generate automatically ............. 33
Triangle mesh, presentation preferences........... 35
Triangle mesh, save/load .................................. 35
True-type font................................................... 43
V
Volume, calculate ............................................. 25
Page 56 of 57
September 2008
W
Z
What you see is what you get ........................... 42
Zoom factor, define for full-screen display ...... 42
Zoom function ...................................... 42, 44, 53
GGU-TIME-GRAPH User Manual
Page 57 of 57
September 2008