1
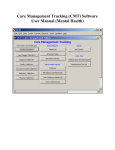
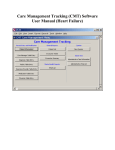
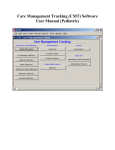
OQ® Analyst
Quick Start User Guide
OQ® Analyst
Quick Start User Guide
Version:
1.0
Date: 19/JAN/2007
1. Overview
This document will walk you through the different screens available in the OQ® Analyst system. If you
would like more information please refer to the full OQ® Analyst user manual, which can be viewed by
clicking on the Help link at the top right after you login to OQ® Analyst.
OQ® Analyst allows for electronic administration and scoring of the OQ Family of mental health outcome
measures through the use of handheld PDAs, scan-able paper forms, or manual data entry and is able to
provide instant feedback to clinicians regarding client outcomes. The software will compare a patient's
progress with the expected rate of improvement and use empirically based algorithms to predict treatment
failures.
1.1 Outcome Measures (Please refer to the instrument scoring manuals for more information)
OQ® 45.2 – adult outcome measure (ages 18+) with 45 items completed by the client
Y-OQ® 2.01 – youth outcome measure (ages 4-17) with 64 items completed by the parent or guardian
Y-OQ® 2.01 Self Report – youth outcome measure (ages 12-18) with 64 items completed by the client
OQ® 30.1 – adult short form outcome measure (ages 18+) with 30 items completed by the client
Y-OQ® 30.1 – youth short omni form outcome measure (ages 4-17) with 30 items
S-OQ® 2.0 – outcome measure for clients with serious mental illness (SMI or SPMI)
BPRS (Brief Psychiatric Rating Scale) – outcome measure for clients with serious mental illness
ASC (Assessment for Signal Clients) – adult clinical support tool to help assess problems with therapeutic
alliance, motivation, social supports, and life events
1.2 Security System Time-Out
For security purposes if OQ®-Analyst detects no activity during a twenty-minute period, the system will
time out and any unsaved information will be lost. You will need to login again to access OQ®-Analyst.
1.3 OQ®-Analyst Security Model
Before using OQ®-Analyst, it is important to understand the basics of the security model, which is
comprised of Access Levels and User Roles. A user’s access level determines the pages, subpages, and
actions available to them and information displayed within OQ®-Analyst. A user’s role controls the rules
permitting them to see a customized group of Clients and excluding them from viewing others. Access
Levels and User Roles are set by your System Administrators in order to restrict information for security
purposes. For example, a Clinician will have access to the Clients assigned to him/her, but will not have
access to another Clinician’s Clients. If you are having issue accessing client records or do not have
sufficient rights within the system please contact your system administrator.
1.4 Changes from the previous version of OQ®-Analyst
If you are familiar with the previous version of OQ Analyst, Please make note of the following changes:
1.
All client medical record numbers now start with an agency code (example VMH0123456)
2.
A client search is now required before any records will be displayed in the client search list. You can
search by entering part of the client’s last name or the client’s full medical record number.
3.
The YOQ and YOQ Self Report (YOQ SR) are now separate instruments. To administer the youth
completed questionnaire select YOQ SR, otherwise use the YOQ instrument for other respondents.
4.
You can now administer multiple instruments to an individual client (i.e... both YOQ and YOQ SR).
5.
When reviewing questionnaires the records will be filtered by selecting a desired instrument to view.
6.
The system will now track the clinic and setting of care for each questionnaire.
©OQ Measures, LLC 2006
Page 2
OQ® Analyst
Quick Start User Guide
Version:
1.0
Date: 19/JAN/2007
2. How to Access OQ®-Analyst
Note: Before you can login to the system you must obtain a username and password from your System
Administrator. If you have forgotten your account information it can be reset by your System Administrator.
1.
Logon to a computer with an internet connection.
2.
Open an Internet Explorer window and browse to the login URL.
3.
Type your user name in the User Name field.
4.
Type your password in the Password field.
5.
Click [logon].
Note: Your username and password are case sensitive and should be at least six characters in length. If you are not
able to login successfully after your first attempt, make sure that your caps-lock and num-lock keys are properly set.
2.1 Multiple Logon Failure Attempts
The number of login attempts for a given browser session is limited to four. After three tries with an invalid
user name/password combination, a warning will display indicating one more attempt is allowed. If a valid
user name/password is not entered on the fourth attempt, the user must close the browser window and start
a new session in order to attempt to login again.
3.
Navigating OQ®-Analyst
When you first login, OQ®-Analyst will open to your Home page. The Navigation bar is located at the top
of each page within the application and displays the different pages available in the application. Your
current page will be indicated by the blue tab.
©OQ Measures, LLC 2006
Page 3
OQ® Analyst
Quick Start User Guide
Version:
1.0
Date: 19/JAN/2007
Several of the pages also contain subpages that, if available, are listed on the blue bar directly below the
Navigation bar. Your current subpage will be indicated in bold lettering.
4.
Administer Questionnaires Tab
The Administer Questionnaires page allows you to enter, review, and delete questionnaire responses, as
well as generate Clinician and Client Reports. There are two subpages accessible from the Administer
Questionnaires page – New Questionnaire and Review Questionnaires.
4.1
Review Questionnaires Subpage
The Review Questionnaires page allows you to view, edit and delete questionnaires and responses, as well
as generate Clinician and Client Reports. Searching for a client and pressing the show info button will
display the Questionnaire History page. Pressing the Select button on a questionnaire will display the
questions and administrative data for that questionnaire. This data can be edited for up to 10 days after the
administration date, at which point the update button will be locked out.
4.1.1 Viewing the Clinician Report
1. Access the Administer Questionnaires page and select the Review Questionnaires subpage.
2.
Search for and select the desired client and press the show info button.
3.
Select [Clinician Report] for the desired questionnaire and a new window will open containing the
Clinician Report. If a new window does not appear, make sure that your browser is set to allow pop-ups for
the OQ-Analyst website. (Note: some computers may have multiple pop-up blockers that need to be
configured)
©OQ Measures, LLC 2006
Page 4
OQ® Analyst
Quick Start User Guide
Version:
1.0
Date: 19/JAN/2007
4.1.2 Interpreting the Clinician Report
The Clinician Report is intended to give the clinician a summary of the client’s progress to-date. The
Clinician Report is comprised of five sections.
Section 2 –
Summary
Data
Section 1 –
Identifying
Information
Section 5 –
OQ
Subscales
Section 4 –
Summary
Critical Item
Scores
Section 6 –
Graph of
Client Scores
Section 3 –
Feedback
Message
•
Section 1, Identifying Information, consists of client identification and session administration information.
Please verify this information to make sure the correct client and session was selected.
•
Section 2, Summary Data, provides summary data including:
Alert Status – Conveys information about client treatment response as determined by statistical
algorithms. Alert Status may be White, Green, Yellow, or Red. Some patients may also receive a Blue
signal in addition to one of the other signals. The Blue signal indicates that the patient’s change from
intake at the session of interest is so dramatically positive that there is a very high probability the
patient will end treatment with clinically significant change and maintain the change for a minimum of
one year following termination.
Most Recent Score – Total score for the most recent administration of the questionnaire
Initial Score – Total score for the initial administration of the questionnaire.
Change From Initial – A classification of change based on calculations of clinically significant
change using Jacobson & Truax formulas (see Administration and Scoring Manuals for cutoffs).
Change may be Recovered, Reliably Improved, No Reliable Change, Deteriorated. Current Distress
©OQ Measures, LLC 2006
Page 5
OQ® Analyst
Quick Start User Guide
Version:
1.0
Date: 19/JAN/2007
Level – A classification of distress level. Distress Level may be Low, Moderate, High, or Very High
•
Section 3, Feedback Message, provides a feedback message consisting of a verbal summary of the Alert
Status. Of most significance in the Alert Status, are signals that are Yellow or Red. As the messages that
accompany them suggest, research has shown that patients who get either signal anytime during treatment
are at risk for leaving treatment with a negative outcome. Research also suggests that a Red signal is much
more often associated with patient deterioration than a Yellow signal.
•
Section 4, Most Recent Critical Item Status, provides summary scores for the client’s response to
questionnaire items that are intended to screen for risk of suicide, substance abuse, violence at work and a
variety of other disturbing symptoms. It is recommended that clinicians consider any response other than
Never as an alert to possible risk in these areas.
•
Section 5, OQ Subscales, provides a comparison of the client’s current subscale scores for the selected
instrument. Summary benchmark data based on both non-client and client samples are provided in order to
compare the client under consideration with other groups of persons (see Administration and Scoring
Manual for the instruments for technical details).
•
Section 6, Graph of Client Scores, provides a graph of client scores from the first administration through
the most current administration of the questionnaire. The horizontal line drawn across the graph represents
the Jacobson-Truax cut off for being in either the Functional Range or Dysfunctional Range. (See
Administration and Scoring Manuals for technical justification). In general, one goal of treatment is to help
clients feel well enough to report symptom scores that do not exceed the cutoff score. Signal Alert status is
indicated by the letter inside parentheses - W, G, Y, or R. The graph displays the results of the ten previous
sessions. Graphs displaying earlier sessions for clients with more than 10 sessions may be seen by viewing
Clinician Reports from earlier treatment sessions. Some reports include a dark straight line that gradually
slopes down, indicating the expected recovery curve for patients that begin therapy with intake scores
similar to this client. The expected recovery line helps practitioners visualize the average change per
session of treatment that is typical of treated patients. Fifty different expected recovery curves representing
different intake scores are incorporated into the empirical algorithms. These curves provide a benchmark
for contrasting the recovery of the patient of interest. It is deviations from this curve that provide the
foundation for predicting treatment failure and success.
Note: Since the Y-OQ® may be completed by the client or others and different respondents may be
used during different sessions, the bottom section indicates the person completing the Y-OQ® for each
session. This knowledge helps the clinician keep track of who is reporting progress. Obviously, it is
highly desirable for weekly ratings on client progress to come from a single informant. As this is not
always possible, this software helps the clinician keep track of who is rating client symptoms.
The Clinician Report for the first administration of the questionnaire emphasizes interpretation of the test score
and implications for treatment planning, and is intended to help the clinician recognize the client’s degree of
overall disturbance. Below is an example of a typical report that is delivered to the clinician when the first OQ45 is taken by a client. A similar report is created for the first administration of the Y-OQ. In general, the more
disturbed that the client is, the more sessions of therapy that will be necessary for the client to return to a normal
state of functioning.
©OQ Measures, LLC 2006
Page 6
OQ® Analyst
Quick Start User Guide
Version:
1.0
Date: 19/JAN/2007
4.1.3 Viewing the Client Report (Not available for all instruments)
1. Access the Administer Questionnaires page and select the Review Questionnaires subpage.
2.
Search for and select the desired client and press the show info button.
3.
Select [Client Report] for the desired questionnaire and a new window will open containing the Client
Report. If a new window does not appear, make sure that your browser is set to allow pop-ups for the
OQ-Analyst website. (Note: some computers may have multiple pop-up blockers that need to be
configured)
4.1.4 Interpreting the Client Report
The Client Report may be used to provide clients (or their parents in the case of the Y-OQ) with a brief
progress report. The Client Report provides a series of statements and a graph displaying client progress
that is based upon the same algorithms used to generate the Clinician Report. The feedback in the report
varies as a function of the degree of disturbance initially reported by the client, the amount of change
reported at the follow-up session of interest, and the degree of alarm, if any, that the change suggests.
Messages range from suggestions that the client is functioning quite well, is progressing but in need of
further help, or is not progressing as expected and encouraged to discuss progress with the therapist.
Feedback is, by design, encouraging as well as empirically based.
Limited research has shown that clients find the feedback desirable and would like to have it, if given the
option. It also shows that feedback given directly to clients in the form provided in the Client Report has a
positive effect on treatment outcome. It is important for clinicians to know which feedback message is
going to the client. As a practical matter it is a good idea to have clinicians personally provide the feedback
form to the client or at least be aware of what feedback was given to the client. Although it is not common
practice in clinical settings to give clients feedback about their treatment progress and clinicians may be
uncomfortable with a formal feedback report that they did not create (especially if the report indicates a
lack of progress), research has shown that such feedback promotes interaction about goals and tasks of
successful treatments.
©OQ Measures, LLC 2006
Page 7
OQ® Analyst
Quick Start User Guide
Version:
1.0
Date: 19/JAN/2007
4.2 New Questionnaire Subpage
Questionnaire data can be entered into OQ®-Analyst manually, via a scanner, or by synchronizing a
questionnaire taken via a PDA. For information on the PDA and Scanner based administration methods,
please refer to the administration guides provided by your system administrator or the online help guide.
Note: If more than 10% of a questionnaire’s responses are left blank, the data gathered will be excluded
from aggregate reporting to ensure the report data is accurate.
4.3 Manually entering questionnaire data
1. Access the Administer Questionnaires page and select the New Questionnaires subpage.
2.
Select the desired client and verify the identifying information.
3.
Select the desired instrument using the drop-down list at the top.
4.
Click [Manual] to display the questionnaire at the bottom of the page
5.
Enter the administration data (Session Number, Completed By, Date, Clinic, Setting of Care)
6.
Manually enter the questionnaire responses by selecting the appropriate radio button for each question.
Note: You can use the number listed underneath the category to quickly key in client responses
7.
Click [Submit] when finished.
4.4 Kiosk Entry Method
The kiosk entry method allows clients to complete the questionnaire using a computer terminal or touch
screen setup in a waiting area. The client will login using their Medical Record Number (MRN) and Date
of Birth (DOB), after which they can select which questionnaire to complete. The questionnaire will then
be displayed and responses will be submitted electronically. The kiosk entry method is available using the
following URL:
Https://SERVERNAME/oqa/kiosk/
©OQ Measures, LLC 2006
Page 8
OQ® Analyst
Quick Start User Guide
Version:
1.0
Date: 19/JAN/2007
5. Reporting Tab
The reports generated in OQ®-Analyst provide data that is essential to understanding treatment outcomes.
After selecting the type of report from the Report Selector drop-down menu (e.g., diagnosis, gender, etc.),
outcome information is displayed in the Report Detail section in terms of average OQ/Y-OQ at intake (first
administration), termination (last administration), the average number of administrations per client, and the
total number of administrations on which the report is based. The information provided on average number
of administrations per client allows for an estimate of the number of treatment sessions on which pre-test
and post-test changes are based. In general the more sessions of treatment per client, the larger the
difference between pre-test and post-test scores.
In addition to the foregoing information, Section 1 also provides a summary of treatment success based on
the Jacobson & Truax formulas for estimating clinically significant change. Only three of Jacobson’s
Categories are used: Improved (which includes Reliable Change and Recovered), No Reliable Change, and
Deteriorated (which includes Reliable Worsening). The Administration and Scoring Manuals of the OQ
and Y-OQ provide the technical information used to estimate the cut-offs for classification. The Jacobson
& Truax cut-offs are applied to each individual client and are the most widely used standards for
classification of individual client change.
Section 2 provides a graph of pre-test and post-test change by the selected reporting category, along with
the rounded average total score of the first and last administrations of the questionnaire.
Section 3 presents a graphic representation of the percent of cases falling into each selected reporting
category, along with the actual number of cases within each category. This information is useful in judging
how reliable the information on outcomes might be, since very low numbers could cause unreliable
estimates of percentage and amount of change.
©OQ Measures, LLC 2006
Page 9
OQ® Analyst
Quick Start User Guide
Version:
1.0
Date: 19/JAN/2007
6. Management Tab
The Management page allows you to add, view and edit employee and client information. Only those
users with an Administrative or System Administrator access level will be able to access the
Management page.
6.1 Client Management
The Clients page allows you to add, view, search and edit information about persons receiving treatment.
Clients fields include (* Required fields):
Last Name *
– The last name of the client (20 alphanumeric characters or less)
First Name *
– The first name of the client (20 alphanumeric characters or less)
Middle Name – The middle name of the client (20 alphanumeric characters or less)
Medical Record Number – A unique ID up to 10 alphanumeric characters starting with the Agency Code
Birthdate *
– The client’s date of birth in the format of MM/DD/YYYY
Gender *
– The gender of the client
Diagnosis
– The client’s current diagnoses
Clinic *
– The clinic to which the client is assigned
Clinician *
– The primary clinician to which the client is assigned; this listing is filtered to only those
employees assigned a Clinician or Supervisor role
Default Instrument *
– The default outcome measure for this client
Secondary Clinician Assignment – Additional clinicians to which the client is assigned. Secondary
Clinicians are able to view and administer questionnaires for the client on the Administer
Questionnaires page.
Note: There may be instances of clients with similar names. For example, John P. Smith and John H. Smith. The
Medical Record # and Birth Date fields are unique identifiers used to ensure the correct client has been selected.
Creating a new Client account
1.
Access the Management page and select the Clients subpage.
2.
Select [New].
3.
Enter the required information for the client in the Add Client box and click [Add].
6.2 Employee Management
The Employees page allows you to add, view, search and edit information about clinic employees.
Employees fields include (* Required fields):
Last Name *
– The last name of the employee (20 alphanumeric characters or less)
First Name *
– The first name of the employee (20 alphanumeric characters or less)
Login Name * – The assigned user ID that the employee will use when accessing OQ®-Analyst; The
Login Name is unique for each user and must consist of 20 alphanumeric characters or less. For
security purposes, it is strongly recommended that the Login Name be at least 6 characters in
length.
Password *
– The default password for the employee; For security purposes, it is strongly
recommended that the Password be at least 6 characters in length and is case sensitive.
Re-enter *
– Re-enter the default password for confirmation
Role *
– Clerical, Clinician, Corporate, or Supervisor
Supervisor
– A list of employees filtered to only those assigned the role of Supervisor within OQ®Analyst; The Supervisor assignment is optional and is only available for those employees assigned
the role of Clinician.
Access Level * – Standard User, Administrative, Executive User, System Admin, or Not Assigned
Clinic *
– The clinics to which the employee has been assigned
©OQ Measures, LLC 2006
Page 10
OQ® Analyst
Quick Start User Guide
Version:
1.0
Date: 19/JAN/2007
Creating a new Employee account
1.
Access the Management page and select the Employees subpage.
2.
Select [New].
3.
Enter the required information for the employee in the Add Employee box and click [Add].
7.
Preferences Tab
The Preferences page in OQ®-Analyst allows you to view your personal account information and to
change your account password. To have changes made to your personal information, please contact your
System Administrator.
8. Additional Information
For more information please refer to the full OQ® Analyst user manual, which can be viewed by clicking
on the Help link at the top right after you login to OQ® Analyst, or contacst your System Administrator.
©OQ Measures, LLC 2006
Page 11