1
ILLINOI
S
UNIVERSITY OF ILLINOIS AT URBANA-CHAMPAIGN
PRODUCTION NOTE
University of Illinois at
Urbana-Champaign Library
Large-scale Digitization Project, 2007.
Nznm Ilbmq bmrv
d (ckŽB
lcd-il
\ , ,
(1-7>
1 \i. I
ILLINOIS
__
_
HISTnRV
TJA fY JLV
NISI ATTTPATT
A UX
JLLA. AAxLJk
A XJI
£AL
-
SURVEY
Manual for the State Fisheries Analysis
System (State FAS): A Package for Fisheries
Management and Research
Aquatic Biology Section
Technical Report
Peter B. Bayley and Stephen T. Sobaski
Aquatic Biology Technical Report 87/13
Illinois Natural History Survey
Aquatic Biology Section Technical Report 87/13
MANUAL FOR THE STATE
FISHERIES ANALYSIS SYSTEM (STATE FAS):
A PACKAGE FOR FISHERIES
MANAGEMENT AND RESEARCH
Peter B. Bayley and Stephen T. Sobaski
Peter B. Bayley, Princip-nvestigator
Aquatic Biology Section
Robert W. Gorden, Head
Aquatic Biology Section
September 1987
SUMMARY OF PROJECT
The major emphasis of this project was in the design and implementation of a
fisheries data base, the Fisheries Analysis System (FAS), that would provide
information for managers and researchers on a long-term basis. The secondary, but
no less important, emphasis was to interpret and analyze FAS data at the District and
State levels.
An overview of FAS is presented in Aquatic Biology Technical Report 87/10.
A description of the fish population survey data processing in the DISTRICT FAS part
of the system is described in the form of a manual in Aquatic Biology Technical
Report 87/11 which results from part of the work required under Jobs 101.1 and
101.3. Creel Survey data processing is described in Aquatic Biology Technical
Report 87/12 and completes the requirements under Jobs 101.1 and 101.3. The
statewide data base, STATE FAS, is described along with uploading and
downloading procedures in Aquatic Biology Technical Report 87/13 (Jobs 101.4
and 101.5). Technical Report 87/14 presents an analysis of efficiencies of gears
used in generating most of the data in FAS and an analysis of standard parameters
for condition factors, resulting from requirements under Jobs 101.2 and 101.6.
This technical report is part of the final report of Project F-46-R, Comparative Analysis of
Fish Communities in Impoundments, which was conducted under a memorandum of
understanding between the Illinois Department of Conservation and the Board of
Trustees of the University of Illinois. The actual work was performed by the Illinois Natural
History Survey, a division of the Department of Energy and Natural Resources. The
project was supported through Federal Aid in Sport Fish Restoration by the U.S. Fish
and Wildlife Service, the Illinois Department of Conservation, and the Illinois Natural
History Survey. The form, content, and data interpretation are the responsibility of the
University of Illinois and the Illinois Natural History Survey, and not that of the Illinois
Department of Conservation.
PREFACE
This manual has been written as a guide to the State Fisheries Analysis
System (State FAS). We urge you to read these instructions before and while
using the package.
ACKNOWLEDGMENTS
We thank Jana Waite for her excellent redactional work.
Chapter 1
DATA TRANSFER
The uploading of data from DISTRICT FAS (DOC9) to a Prime minicomputer
and downloading to R:BASE SYSTEM V is a multistep process of file reformatting
and creation through FAS software and transfer via KERMIT file transfer protocol
programs.
Initially, data in General Manager's hierarchial structure is converted to an
ASCII text format through a DOC9 Applesoft program using General Manager
COMPRESS-DATA. COMPRESS-DATA reads a DOC9 data set, compresses the nine
screens by eliminating the rewriting of redundant data from previous records, and
writes a temporary text file to a designated slot and drive. When transferring several
DOC9 data sets in one session, compressed files are stored internally in a
RAMFACTOR card (Applied Engineering, Carrolton, TX). This peripheral card
expands the Read Accessible Memory of an Apple //e by 1 Mbyte. When addressed
by the Applesoft command 'IN r#prior to loading General Manager, an unpartitioned
RAMFACTOR card becomes a DOS 3.3 RAM disk, emulating two 400-Kbyte disk
drives. Saving files to a RAMFACTOR card increases the efficiency of data transfer
by allowing quicker access of the files through storage in auxiliary RAM and
increases the volume of data that can be saved to one device.
Compressed text files are then transferred to Illinois Natural History Survey's
(INHS) Prime 9955 minicomputer using the file transfer program KERMIT ][ 3.1 for
the Apple //e (University of Wisconsin, public domain software).
Once moved to the Prime computer, files can then be interpreted and
decompressed through a compiled FORTRAN 77 program, DECOMPRESS.
DECOMPRESS reads the compressed structure created by COMPRESS-DATA and
creates ASCII text files for each of DOC9's nine screens, restoring all the redundant
values of each record. The format of these files is suitable for transfer to the Prime's
relational database, INFO9, or down to R:BASE SYSTEM V.
Presently, FAS-STATE uses INFO9 as the main sorting and storage device for
all DOC9 data, due to the large storage capacity and high processing speed of the
Prime 9955. All nine files created by DECOMPRESS are imported to INFO9 through
a single program written in the Prime's programming language CPL. The program,
ADDINFO.CPL, calls INFO9, then transfers the files individually. The transfer process
entails writing data files to scratch files in INFO and then running a series of checks
and comparisons with DOC9 data stored in INFO9 data files. Records with invalid or
questionable values are removed from the scratch file and written to an error file for
later evaluation. Empty records and records duplicating data, such as lake location,
are eliminated. Remaining records are then added to the permanent data file for that
screen's data.
Downloading data from INFO9 to R:BASE SYSTEM V is accomplished by first
creating an ASCII-delimited file for each of the nine FAS-STATE "Screen" data files
1-1
(Appendix A), using the INFO command EXPORT. EXPORT allows for the transfer
of all or select records and/or variables from an INFO data file.
Once data is in an ASCII-delimited format, it is easily shipped to the system on
which R:BASE V resides using the KERMIT file transfer protocol. Data files saved in
MS-DOS format are then read into an R:BASE V database through the R:BASE
module FILEGATEWAY. It is a menu driven import/export utility which, in import
mode, allows the creation of new databases or data tables or the updating of existing
tables.
1-2
Chapter 2
DATA BASE ORGANIZATION
FAS-STATE uses the relational data base software R:BASE SYSTEM V to
organize and summarize DOC9 (DISTRICT FAS) data sets. R:BASE V is composed of
a series of menu- and prompt-driven modules, providing a user-friendly
environment to create and maintain data bases, as well as providing data input
forms, reports, and application programs. Data bases are composed of tables,
comparable to DOC9's screens, in which data variables are kept in columns and
records in rows. Tables can be further organized into views or pseudo tables, where
common columns are used to establish links between related data. A single view
allows a user to display up to five tables of information without creating additional
tables. Data bases in R:BASE V may consist of up to 80 related data tables with up to
800 columns. Any table or view may be composed of up to 80 columns. Single
rows in a table can hold up to 4 Kbytes of data; the number of records within a data
base are restricted only by a computer's storage capacity or limits imposed by the
operating system. To date, FAS-STATE encompasses 9 Mbytes of data from 69
Illinois lakes. Most data are from 1985, although for some lakes data are available
from as early as 1981.
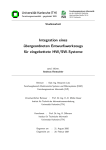
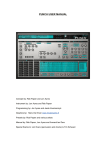
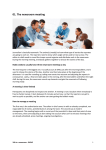
At the core of FAS-STATE are the nine data screens, corresponding to those of
DOC9 on the Apple //e (Figure 2-1 and Appendix A). The columns in FAS-STATE
tables and their order are identical to the structure of DOC9, with several exceptions
necessitated by converting a hierarchical database to a relational one. To reduce
storage requirements, the output fields for impoundment, station, season, and year
in DOC9 have been dropped from tables SCREENS through SCREEN9 and replaced
by a single alphanumeric column, FCODE. FCODE consists of a five digit number,
preceded by the character 'D'that is unique for each combination of lake-stationseason-year. For example, data collected for Lake Springfield in fall 1985 were
given FCODES of D00199, D00200, and D00201 to correspond with the three
stations sampled for that impoundment and season. The FCODE of rows in tables
SCREENS through SCREEN9 provides the link between columns in those tables and
data, such as the LAKE, STATION, SEASON, and YEAR columns, found in table
SCREEN4. Within the context of a view, FCODE allows data of SCREENS through
SCREEN9 to be secondarily related to tables SCREEN2 and SCREEN3 through the
one-to-one relationship that SCREEN4 has through the common columns LAKE and
SPECIES CODE. A column for sampling gear, GEARTYPE, has also been added to
DOC9's sample data and length-frequency tables (Screens 6 and 7). GEARTYPE is
equal to the first character in the column SEASON; it was added to allow gear to be
selected as a criterion for reports.
To provide a link between Screens 1 and 2, the table LAKEDIST was created,
which contains the name of each impoundment in FAS-STATE and its associated
region and district. In addition to LAKEDIST, other tables relate coded data to text
for reports, or to other data items specific to that code. Tables GEAR and SEASON
match appropriate text through columns GEARTYPE and SEASON with rows of
related tables such as SCREEN7 or SCREEN4. A fourth table, FISHCODE, uses the
column SPECIES to link rows in tables SCREENS through SCREEN9 with fish
2-1
species and common names. Future additions and modifications to the structure of
FAS-STATE can be readily accomplished through the DEFINITION EXPRESS module
of R:BASE V. DEFINITION EXPRESS menus can define new tables or views; add,
delete, or reorder table columns; rename tables or columns; create passwords for
databases or tables; and create or modify data entry forms and data reports. R:BASE
V also allows the creation of new tables from existing tables or views through the
relational commands PROJECT, UNION, APPEND, JOIN, INTERSECT, and
SUBTRACT.
SEASON
Screen 2
LAKE-STATIONSEASON
Figure 2-1. The organization of STATE FAS data tables In R:BASE SYSTEM V. The relational paths
between tables Is flow charted with the primary common column listed between tables.
2-2
Chapter 3
DATA REPORTING
This section presents a detailed account of report procedures to serve as a
guideline for IDOC personnel in Springfield and Regional offices in the development
of new reports. Data output in FAS-STATE is currently handled by the data reporting
utilities of R:BASE SYSTEM V. Detailed descriptions of the modules and commands
used in report generation are covered in "R:Base System V User's Manual" and
"Building Applications-Command Dictionary" (version 1.0, Microrim, Inc., 1986).
The simplest form of displaying data in R:BASE V is through the command
SELECT. SELECT lists the data of all or specified columns of a given table or view,
either in the default column order or in the order listed in the command. It optionally
allows data sets to be sorted on up to ten columns prior to listing. SELECT also
allows for the inclusion of a condition list of up to ten criteria that rows must meet in
order to be displayed.
Other R:BASE Vcommands relating to data output include:
COMPUTE--used for the calculation of simple function values such as minimum,
maximum, mean, and standard deviation for a selected column;
TALLY--lists each unique value of a column and its number of occurrences; and
CROSSTAB--counts the number of cases, computes the sum, or calculates the
average of each unique pair of values from two columns in a table or view.
All three of these commands may be used with a WHERE clause, which defines the
condition list for rows in the data set.
To create more formal data output, R:BASE V provides the module REPORTS
EXPRESS, which allows users to create reports for a single table or for the data of
several related tables through a specific view, using a series of menu-driven
prompts and a full-page editor. Within a report, data can be displayed in its
originally entered form, summarized through break points, or transformed or totaled
through variables defined within the report. The definition of variables within
REPORTS EXPRESS also allows for the display of such system variables as
#DATE, #TIME, or #PAGE, and of data from additional tables or views through
look-up variables. The report editor permits users to define where data is to be
displayed on the report page. It also allows the incorporation of text, such as for
titles or headings, into the body of the report.
Creating a report in R:BASE V initially involves deciding which data items
(columns) to display, whether to display all or a select number of cases (rows), and
where those items can be accessed. A list of the tables, views, and columns of a
given database can be seen by typing "LIST ALL" while in R:BASE mode. Where
columns of interest occur over several related tables, report generation will generally
first require the creation of a view to serve as the report's driving table. A driving
table is the single data table or view for which a report is created. For a report to
display data of more than one table or view, either a view must be defined,
3-1
modified, or look-up variables must be created in the Report's definition menu for
the additional columns.
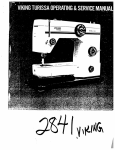
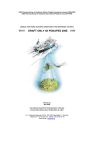
As an example, to produce a summary report of the impoundments, years, and
seasons sampled within a selected region of Illinois, the view LAKEYEAR was
created for FAS-STATE (Figure 3-1). Views are created and modified within the
R:BASE V module DEFINITION EXPRESS. Within its View menu, users are
alternately prompted for tables, then columns, for a maximum of five tables from the
current data base. Views for reports should include the columns holding data to be
displayed, columns used in calculating report variables, columns used in the
selection criteria of the view's condition list, and columns that serve as links
between related tables in the view. Note that tables cannot be included in a view
definition until a common column is added from a related table already in the view.
Other columns, up to 80 columns per view, may be included so that, for instance, a
view may be applicable to other reports. In "LAKEYEAR," the data of four tables are
linked, with LAKE being the common column between tables SCREEN2, SCREEN4,
and LAKEDIST, and SEASON the link between SCREEN4 and SEASON. Besides
these columns, LAKEYEAR includes REGION, LAKE, YEAR, ACREAGE, and
SEASTEXT, which are displayed in the summary report LAKEREP. An additional
column, DISTRICT, is included as a potential criterion column in the view, a report
condition list, or a potential report item.
Once tables and columns are chosen for a view, DEFINITION EXPRESS
concludes the view definition process by prompting the user to optionally set a
condition list for the view. The list is a string consisting of a maximum of ten
criteria on columns, joined by logical operators such as AND or OR. Condition lists
limit the rows included in a view and are useful in selecting specific sets of data for a
report, such as all fish records for a specific impoundment. Condition lists are also
useful in error checking, such as checking for illegal region and district values in
LAKEYEAR. Like the view itself, the condition list is created through a series of
menu-driven prompts (Figure 3-1).
The definition and inclusion of condition lists in commands often affects the
processing efficiency of R:BASE V. Generally, efficiency is increased by setting data
conditions on the driving view rather than in the PRINT command executing the
report. For example, the creation of a species summary for the Fall 1984 fish
census of Lake Shelbyville involves selecting and sorting 1,725 records of 29
species from a view linking tables SCREEN2, SCREEN4, SCREEN7, and
FISHCODE. When the condition "WHERE LAKE EQ SHELBYVILLE AND YEAR EQ 84"
is included in the view definition, generation of a species list takes 69 minutes to
complete. When this condition clause is placed in the PRINT command, the
completion of the same report took 145 minutes. The processing of data from a
view is additionally expedited by keying common columns. A key is an index of
data locations in a column, formed by R:BASE V as an option in the table creation
and modification menu of DEFINITION EXPRESS. R:BASE V can reference only one
key per data base operation, therefore it is best to key only the common or criteria
column with the greatest number of unique cases. Processing is also expedited
when the last rule or criterion in a condition list compares a keyed column using the
EQUALS comparison, and when that criterion, in multi-condition clauses, is
preceded by the logical operator AND. The processing efficiency of reports can be
severely reduced with increased complexity in the driving view's design and or size,
3-2
(A) THE DEFINITION PAGE OF "LAKEYEAR"
(VIEW NAME):
LAKEYEAR
(Viewname)
(Columns within "LAKEYEAR"):
LAKE
YEAR
SEASON
ACREAGE
SCREEN4 SCREEN4 SCREEN4 SCREEN2
SCREEN2
SCREEN2
LAKEDIST
SEASON
SE)ASTEXT REGION
SE)ASON
DISTRICT
LAKEDIST LAKEDIST
___
(Tables linked by "LAKEYEAR"):
SCREEN4 SCREEN2 LAKEDIST SEASON
(B) THE CONDITION LIST PAGE OF "LAKEYEAR"
LAKEYEAR
AND
AND
Column
Operator
REGION
REGION
DISTRICT
GT
LT
LT
Value
0
6
22
Figure 3-1. The view definition pages of the FAS-STATE view LAKEYEAR, as
displayed in the VIEWS menu of R:BASE SYSTEM V moduleDEFINITION EXPRESS.
3-3
-m-
(C) MENUS AND PROMPTS DISPLAYED IN THE DEFINITION OF
CONDITIONS FOR "LAKEYEAR"
AND
D
OR
AD NOT
OR NOT
OR
AND NOT
OR NOT (Done)
(eaogcanr
-LAKE
YEAR SEASON
ACREAGE SEASTEXT
REGION DISTRICT
LAKE
YEAR
ACREAGE
REGION DISTRICT
SEASON
SEASTEXT
-----Choosean
EQ NE GT GE
LT LE
CONTAINS
EXISTS
FAILS
Enter value to be used for comparison:
Figure 3-1 (concluded).
both in terms of the number of tables related, the total size of each table and the total
number of columns comprising the view.
Following the selection of a view or data table, the report creation process
continues with the design of the report's format. In R:BASE V,reports are defined
and edited using the Report Definition section of the module REPORTS EXPRESS.
Reports in R:BASE V are composed of sections, each containing text and/or field
positions for column and variable displays.
Prior to entering the Report Definition menu, the user should map out how the
report should look. Factors to consider include: which columns to display from the
report's driving table or view; whether all rows of data are to be displayed or just
summaries of columns; whether variables need to be defined to display the data of
other tables, the system variables for date, time, page number, or values of data
transformations or calculations; and how the display of data should be organized.
Display considerations include: which columns should be displayed in header
sections and which columns should be listed as subordinate to header information;
whether a column should be displayed in ascending or descending order; whether
subtotals and grand totals of columns or variables are required; what text to include
3-4
in the report (specifically report titles, page titles, and column headings); and the
general page and print format of the report.
Report items can be organized into any or all of seven sections in Renort
Definition. These sections are
1.
Report Header--appears once and holds the report's title;
2.
Page Header--appears at the top of each page and generally includes such items
as page number, date, and column headings;
3.
Break Header--appears periodically as a subheading whenever a specified
column or variable changes value;
4.
Detail--lists all values of a single block of data, usually rows of data from
specified columns or variables;
5.
Break Footer,--appears at the end of a block of data, whenever a specified
column or variable changes value, and generally includes subtotal values of
that column or variable;
6.
Page Footer--appears at the end of each page and contains such items as page
numbers and the sum of column values displayed on that page; and
7.
Report Footer--appears at the end of the report and contains such values as
column or variable grand totals.
The body of the report may be further subdivided into a maximum of ten blocks by
defining breakpoints, with each block consisting of a Break Header section and/or a
Detail and Break Footer section.
The size and contents of each section are defined with the EDIT option of the
Report's Definition menu. EDIT acts as a full screen editor, allowing quick
definition of each report. Specifically EDIT allows the determination of sections to
be included in the report, their size, and the location of text and fields with each
section. Fields are areas of the report page designated for the display of data from
specific columns or variables. Fields are located by the definition of starting (S) and
ending (E) points through EDIT's cursor, after EDIT prompts for the column or
variable to be associated with that field. Text displays, such as titles or column
headings, are added by typing the text at the desired page location. Variables used in
the report are defined, changed, or deleted through the EXPRESSION option of the
Definition menu. Report contents may include a maximum of 40 variables. The
third definition option, CONFIGURE, allows page control specifications and report
breakpoints to be set.
The order in which execution of the definition options--EDIT, CONFIGURE, and
EXPRESSION--are executed is generally not critical. For instance, one can define all
report variables in the EXPRESSION menu prior to defining field locations in EDIT,
or enter the definitions directly in EDIT. EDIT will prompt for a definition before
locating the field of a previously undefined variable. Order is important, however,
when defining Break Header or Break Footer sections. Before EDIT will display
Break sections as possible report sections, breakpoints must be defined in the
3-5
CONFIGURE menu. Breakpoints are flags set by R:BASE V on designated break
columns to indicate changes in groups of data. In setting breakpoints, report data
are automatically sorted in ascending order on the break columns. Data of break
columns are displayed only when the values of those columns change, when their
fields are located in Break Header sections. Breakpoints offer a convenient method
of creating summary report data, because only unique values of columns or
combinations of columns are displayed when the fields of breakpoint columns are
located in Break Header sections.
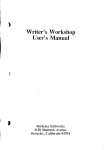
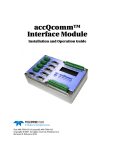
The report LAKEREP (Figure 3-2) is an example of the output possible using
REPORTS EXPRESS and DEFINITIONS EXPRESS with FAS-STATE. LAKEREP
gives a summary of the impoundments and years sampled within selected IDOC
regions from the current FAS-STATE data base. The report displays region
identifications, the names of impoundments sampled, their surface area, the years
each were sampled, and the seasons in which sampling occurred. Because the
columns with these data occur over four related tables, the view LAKEYEAR (Figure
3-1) was created to serve as the driving table for LAKEREP prior to designing the
report. Within REPORTS EXPRESS, a report page was designed to display the data
of interest in four levels: (1) by region (column REGION); (2) by impoundment
(column LAKE); (3) by the years sampled for a given impoundment (column YEAR);
and (4) by seasons sampled during a given year (column SEASTEXT, which is the
text equivalent of the two digit season code of column SEASON).
Because the view LAKEYEAR is built primarily around the station data table,
SCREEN4, it is possible for one combination of Region-Lake-Year-Season to have a
number of cases, one for each station sampled in that impoundment. To display a
summary of the unique combinations of these four columns, it was necessary to first
enter the Configure Page of the Reports Definition Menu and designate each as a
break column (Figure 3-2B). The order of break designation is important since it
establishes the hierarchy that R:BASE V follows in sorting the rows of data. In the
case of LAKEREP, data rows are first sorted on REGION until a row is encountered
that has a value for REGION identical to a row already sorted. Those two rows are
then sorted on the values of the next break column, LAKE. If both also have the
same impoundment name, sorting is then done on the values in break column YEAR.
This process continues with all four break columns until all cases of the driving view
or table have been sorted.
Once the breakpoints were established, several variables were defined in the
Expression Menu of Report Definition. Because data on years are stored only by the
last two digits in FAS-STATE, the variable YEARSAMP was defined (Figure 3-2C) to
allow display of the true values for years. Variables were also defined for
displaying the system variables #DATE, which holds the current date in the
computer's operating system clock, and #PAGE, which R:BASE V uses to hold the
current page number of a report.
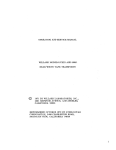
After the definition of all breakpoints and variables, the EDIT option was
chosen to select and define sections for the report and the text and field locations of
each section. LAKEREP is divided into six sections--a Report Header, a Page
Header and four Break Headers, one for each break column. Figure 3-2A shows the
format for LAKEREP and the location of each of the variables and columns selected
for display. The Report Header consists of seven rows, displaying text for report
title and the variable holding the current date, REPDATE. A four-row Page Header
3-6
(A) MAIN REPORT DEFINITION MENU WITH THE EDIT PAGE
Reports Defi•on Menu-Expression
Edit
RH
RH
RH
RH
RH
RH
RH
RH
RH
RH
RH
H1
H1
H1
H2
H2
H3
H4
Draw
Configure
FAS-STATE SUMMARY REPORT
LISTING OF LAKES AND YEARS SAMPLED
DATE: S
(1)
E
PAGE S
LAKE
YEAR
AREA
E
SEASON
(3)
REGION - SE
S
(4)
E
S
(5) E acres
S (6)E
E
RH - report header section
PH - page header section
H1-H4 - break header sections
S - starting point of a column or variable display field
E - endpoint of a display field
(1) - variable REPDATE
(2) - variable REPPAGE
(3) - column REGION
(4) - column LAKE
(5) - column ACREAGE
(6) - variable YEARSAMP
(7) - column SEASTEXT
Figure 3-2. Report definition pages for the FAS-STATE report, LAKEREP, from
the R:BASE SYSTEM V module REPORTS EXPRESS.
3-7
(B) CONFIGURATION PAGE
Lines Per Page..................60
Remove Initial Carriage Return..... [NO]
Manual Break Reset .............. :[NO]
Page Footer Line Number......... : 0
BREAKPOINTS
Break
Variable
Column
Reset
Report
Page
Breaki
Break2
Break3
Break4
Break5
Break6
Break7
Break8
Break9
Break10
FORM FEEDS
Header
Footer
Before
After
Before
After
[NO]
REGION
LAKE
YEAR
SEASTEXT
[None]
[None]
[None]
[None]
[None]
[None]
[NO]
[NO]
[NO]
[NO]
[NO]
[NO]
[NO]
[NO]
[NO]
[NO]
[NO]
[NO]
[NO]
[NO]
[NO]
[NO]
[NO]
[NO]
[NO]
[NO]
[NO]
[NO]
[NO]
[NO]
(C) EXPRESSION MENU PAGE
Rr--------ieMernu-
-eD
Define
1:
2:
3:
Delete
DATE
INTEGER
INTEGER
Retype
REPDATE
RPTPAGE
YEARSAMP
Reorder
.#DATE
.#PAGE
YEAR + 1900
Figure 3-2 (concluded).
section follows with a field for displaying the page number variable, REPPAGE, and
text for the report column titles. The Page Header contents are displayed at the top
of each page of the report, with the exception of the initial page. The underlining of
column titles is accomplished through the DRAW option of the Report Definition
3-8
Menu Data. DRAW provides the option of inserting either single or double lines,
vertically or horizontally, anywhere in the report.
The main body of the report displays data from the view LAKEYEAR over four
Break Header sections. In the first break section, text is mixed with a field for the
column REGION to display the region identification. The second Break Header
section includes field locations for LAKE and for the SCREEN2 column with
impoundment surface area data, ACREAGE. Because ACREAGE is in the same
Break Header section as a break column, a value for ACREAGE will be displayed
only when a new value for LAKE is printed. The relationship between LAKE and
ACREAGE is one-to-one, i.e., each impoundment has only one surface area value
associated with it. Given that, the inclusion of ACREAGE in the same section as
LAKE will summarize all of the selected data of these two columns. In the case of a
many-to-one relationship, however, only the first value of the column associated
with the break column is printed. For instance, if ACREAGE is substituted in the
second Break Header by STATION, the column containing FAS-STATE station
number data, the report will print only the first station number for each
impoundment, regardless of the number of stations actually sampled for that
impoundment. To display all values of a many-to-one relationship, a field for the
"many" column should be located either in a Data section or in a separate Break
Header section, directly under the section with the "one" column. In the case of
LAKEREP, each impoundment generally has several years of data stored in
FAS-STATE. To display all years sampled for each impoundment, a separate Break
Header section was defined following the lake-area section. Because YEARSAMP's
field is located in a Break Header section and calculated from the Break column
YEAR, a summary list of years is displayed. If YEAR had not been designated a
break column, the output of year values would have been unpredictable, since
breaks would have been made on unsorted data.
Following the Break Header section for year, Break Header 4 was defined to
summarize the seasons sampled for each impoundment per year. Because sampling
season is stored only as a two digit code in the core data tables of FAS-STATE, a
new table, Season, was created to relate the values of the column SEASON with the
appropriate season text. The table, Season, (Appendix A) is composed of just two
columns, SEASON, which acts as the common column between it and the Screen
tables and a text column SEASTEXT, which contains such values as FALL. Through
the one-to-one relationship established by the column SEASON in LAKEYEAR,
SEASTEXT can be defined as a break column in LAKEREP. SEASTEXT is both the
last item that report data are sorted by and, by being located in Break Header 4, the
last data displayed in the region-lake-year-season data block of LAKEREP.
Once defined, reports are run in R:BASE V's main module, R:BASE, through
the PRINT command. To report on just data from IDOC Region 5 for Figure 3-3, an
optional WHERE clause was included when entering the PRINT command. The
execution command for that example is "PRINT LAKEREP WHERE REGION EQ 5."
The WHERE clause is a convenient method for restricting the data covered in a
report. For small data sets with just one condition, the turnaround time from
entering the command to execution is rapid. For driving views linking large sets of
data, or where multiple conditions are placed on a data set, however, it is more
efficient, in terms of processing time, to add or change a WHERE clause in the
driving view definition rather than in the PRINT command. A second optional clause
of the PRINT command, SORTED BY, permits sorting on up to ten columns or report
3-9
DOC9 SUMMARY REPORT
LISTING OF LAKES AND YEARS SAMPLED
DATE: 08/26/87
PAGE
IMPOUNDMENT
AREA
YEAR
REGION- 5
BEALL WOODS STATE LAKE
14. acres
1985
FALL
BORAH LAKE
137. acres
1985
FALL
EAST FORK LAKE
935. acres
1985
FALL
FERNE CLYFFE
16. acres
1984
FALL
1986
FALL
JONES LAKE
105. acres
1985
FALL
NEWTON LAKE
1750. acres
1985
FALL
RED HILLS STATE LAKE
40. acres
1985
FALL
REND
18900. acres
1985
FALL
SAM PARR LAKE
180. acres
1985
FALL
Figure 3-3. Sample output from the FAS-STATE report LAKEREP.
3-10
1
variables. Inclusion of this clause is required where sorted output is desired from
report variables containing breakpoints. In reports with break columns, however,
the use of SORTED BY should be avoided. The inclusion of SORTED BY prevents
the automatic sorting of data on break columns, thereby potentially cavlring
unpredictable report output.
Report output in R:BASE V can be directed to any or all of three devices with
the OUTPUT command. The default display of reports is to the monitor (OUTPUT
SCREEN), but output may be sent to a printer (OUTPUT PRINTER) and/or saved to a
DOS file (OUTPUT filename), as well as any combination of the three (e.g., OUTPUT
filename WITH BOTH). To change the output device, the OUTPUT command is
entered prior to entering a PRINT command.
Included in the figures of this report are two further examples of reports created
with the FAS-STATE database. Figure 3-4 is a sample output from the report,
FISHLIST. FISHLIST summarizes the species of fish collected from a selected
impoundment over all years, seasons, stations and sampling methods present in the
data base. FISHLIST is driven by the view LAKESPP (Appendix A) and breaks on
column FASSP, the three character code for fish species. The condition list
specifying the impoundment to be reported on is defined and edited in the view
definition of LAKESPP. FISHLIST displays the data of four FAS-STATE columns as
well as the system variables for page number and current date. Impoundment name
(LAKE), size (ACREAGE), and average depth (AVGDEPTH) are listed in the first
break header section of the report. The common names of fish species collected
(COMMON) are summarized in a second break header. Because column FASSP has
a one-to-one relationship with COMMON, the listing of species will reflect the
breakpoints of FASSP, despite the fact that COMMON and not FASSP is displayed.
Figure 3-5 is sample output from the report GEARSUMM. GEARSUMM
summarizes the various sampling gears used in a selected region and year, broken
down by the IDOC districts and impoundments sampled. To integrate data on
impoundment location, impoundment morphometry, and sampling, the view
GEARVIEW was created (Appendix A). As with the report FISHLIST, the condition
list for region and year is defined in the driving view rather than in the PRINT
command. GEARSUMM displays the data of five columns, three of which are
designated as break columns. DISTRICT, which holds the district location of the
sample, is displayed in the first Break Header section. LAKE is displayed in the
second Break Header section with the impoundment area column, ACREAGE. In the
third Break Header, the sampling gear used in each impoundment is summarized by
displaying the break column GEARTYPE. To round out the report, variables defined
to hold the system values for current date and page are displayed in the Report and
Page Header sections, respectively. A third report variable holds the value of the
year selected, converted from the two-digit format that year data is stored in to its
full, four-digit value. The year variable, as well as the number of the region
selected, appears in the Page Header section.
R:BASE V'S reporting capability is reasonably flexible, permitting
summarization of any set of FAS-STATE data, assuming that those data can be
related within the constraints of view and report structures. One major consideration
in running reports in R:BASE V, however, is the speed of data processing. Actions
requiring frequent disk access, such as relating and sorting in report generation, are
constrained by the disk access speed of the user's computer hardware. When
3-11
FAS-STATE SUMMARY REPORT
FISH SPECIES COLLECTED
DATE: 08/25/87
PAGE 1
IMPOUNDMENT
AREA
AVERAGE
D.EPl
SPECIES COLLECTED
LAKE SPRINGFIELD
4235. acres
14. feet
BIGMOUTH BUFFALO
GREEN SUNFISH X BLUEGILL
BLACK CRAPPIE
BLUEGILL
BROOK SILVERSIDE
BULLHEAD MINNOW
CARP
CHANNEL CATFISH
FLATHEAD CATFISH
FRESHWATER DRUM
GOLDEN SHINER
GREEN SUNFISH
GIZZARD SHAD
LARGEMOUTH BASS
ORANGESPOTTED SUNFISH
REDEAR SUNFISH
RIVER CARPSUCKER
TIGER MUSKIE
WALLEYE
WHITE BASS
WHITE CRAPPIE
WHITE SUCKER
YELLOW BULLHEAD
YELLOW BASS
Figure 3-4. Sample output from the FAS-STATE report
FISHLIST.
3-12
FAS-STATE SUMMARY REPORT
GEARS USED IN FISH SAMPLING
DATE: 08/26/87
FOR YEAR - 1985
REGION 4
MPOUNDMBET
AREA
DISTRICT- 10
HORTON LAKE
12.6 acres
ELECTROFISHING
PITTSFIELD LAKE
241. acres
ELECTROFISHING
GILL NET
HOOP NET
SCHUY-RUSH LAKE
225. acres
ELECTROFISHING
SILOAM SPRINGS LAKE
58. acres
ELECTROFISHING
GILL NET
HOOP NET
DISTRICT- 11
17. acres
IDOT
ELECTROFISHING
JACKSONVILLE
475. acres
ELECTROFISHING
GILL NET
LAKE SPRINGFIELD
4235. acres
ELECTROFISHING
GILL NET
HOOP NET
SANGCHRIS LAKE
2165. acres
ELECTROFISHING
GILL NET
HOOP NET
WAVERLY
130. acres
ELECTROFISHING
Figure 3-5. Sample output from the FAS-STATE report GEARSUMM.
3-13
DISTRICT- 12
BEAVER DAM
56.6 acres
ELECTROFISHING
GILL NET
GILLESPIE NEW LAKE
207. acres
ELECTROFISHING
GLEN SHOAL LAKE
1200. acres
ELECTROFISHING
GREENVILLE NEW CITY LAKE
775. acres
OTTER LAKE
765. acres
ELECTROFISHING
ELECTROFISHING
GILL NET
Figure 3-5 (concluded).
numerous or complex relates, multiple sorts, or multiple condition checks are
required, the execution of such commands as PRINT can potentially take hours with a
data base the size of FAS-STATE.
To demonstrate the relative speed of R:BASE V, the report FISHLIST was run on
1984 data of Lake Shelbyville, using an IBM-AT with 30-Mbyte hard disk and 640
Kbytes of RAM. A comparable report was created with the FAS-STATE data base
residing in INFO9 on the INHS Prime 9955 minicomputer. Both reports were
required to relate the 25,980 records of data table SCREEN7 to the three remaining
tables of view LAKEYEAR, eliminate all but the 1,725 records for Lake Shelbyville
in 1984, and sort the 29 species present in that data set. The total execution time for
the report in INFO9 was 9.6 minutes. In R:BASE V the total run time was 69 minutes
when the condition list, specifying impoundment and year, was defined in the
driving view. As noted earlier, this run time increased to 145 minutes when the
condition list was defined in the PRINT command, rather than in LAKEYEAR's
definition. A similar output using the Summary Species Table of DISTRICT FAS
(Aquatic Biology Technical Report 87/11) on an Apple //e with the Shelbyville data
in RAM memory took 21.5 minutes.
3-14
Chapter 4
APPLICATION PROGRAMS
When reports are to be executed on subsets of a driving table or view, an
alternative to repeated redefinition of the condition list criteria in DEFINITION
EXPRESS is to incorporate the criteria selection process and report execution in an
R:BASE application program. An application program consists of a series of R:BASE
commands, menus, and/or help screens that normally provide a user with everything
needed to enter, update, report, or process data base information. Applications are
especially useful in allowing someone with only a working knowledge of R:BASE V
to perform a series of operations, such as producing reports on various subsets of a
database, without requiring a detailed understanding of the data base itself.
An application in R:BASE V can consist of a single procedure file or a series of
files called on by a main program. Each procedure file is organized into one or a
series of command blocks, and optionally include menu blocks and help screen
blocks. Command blocks are the equivalent of subroutines in other programming
languages. These blocks contain sets of R:BASE system commands and functions
and are delineated from other blocks of code in a program by the commands
$COMMAND and RETURN. Examples of command block operations are commands
which set the R:BASE V system environment such as "SET ERROR MESSAGE OFF,"
IF-THEN-ENDIF segments which route programs to different sets of commands, and
execution commands such as RUN or PRINT. Command blocks can also call and run
programs written external to R:BASE V using the ZIP command. Command blocks
are executed only when requested by name with the RUN command.
Menu blocks consist of individual R:BASE menu definitions. Each block
contains a name which is referenced by the menu execution command CHOOSE,
followed by the menu type and title, and lastly the list of choices that appear when
the menu is displayed. Menus may be defined as either horizontal (ROW) or vertical
(COLUMN). The actions ascribed to each option, however, are defined in the
command block calling the menu following the CHOOSE command. For vertical
menus, a total of nine options are possible, each up to 65 characters in length. The
options in vertical menus are numbered, and it is those values that the command
block processing the menu tests for when interpreting a user selection. These tests
consist of a series of IF-ELSE-ENDIF commands that check the value of the integer
variable set to hold the menu choice and then executes the actions defined for that
choice. Horizontal menus are processed by command files in a similar fashion;
however, they differ from vertical menus in several respects besides the obvious
display difference. Menu options in horizontal menus are not numbered;
consequently, the values for choice tested for in the calling command file are the
option's actual text. Horizontal menus are limited to a total of 1,134 characters,
which potentially allows 81 options of eight characters each. Within APPLICATION
EXPRESS, horizontal menus are limited to 12 options of up to 10 characters. Menu
blocks are delineated in a procedure file by the $MENU command and extend until
another block definition or the end of the procedure file is encountered.
4-1
The third type of block, the Screen block, is invoked by the DISPLAY command
in the procedure file. Screen blocks are made up of single screens of text, and for
this reason are primarily used to provide on-line help in an application. Screen
blocks are delineated by the command $SCREEN and contain the name unique to that
block, followed by the text to be displayed. Screens are commonly called by menus
through the F10 key. F10 will return a value of-1 for vertical menus and HELP for
horizontal menus. Menu options can then be assigned a DISPLAY command by an IF
statement.
Application programs can be created by two methods in R:BASE V.A userfriendly method of creating applications is offered by the module APPLICATION
EXPRESS. In this module, a series of menus and prompts are displayed, leading the
user through the process of selecting a data base, creating a menu for that data base,
then assigning various actions to that menu. Menu actions may include such
operations as entering and editing data with a user defined form, displaying the
contents of data tables, executing reports, and creating command files. A procedure
file is then automatically written and compiled, containing all of the actions selected.
Procedure files created in APPLICATION EXPRESS are generally simple, given the
constraints of the menu-prompt format. Programs written in APPLICATION
EXPRESS, however, may be expanded or edited with the R:BASE Veditor, RBEDIT.
APPLICATION EXPRESS may, therefore, be useful in creating a rough draft of code
that an experienced user can then modify to produce complex applications.
Alternately, an entire procedure file or individual program blocks may be
written within RBEDIT. The R:BASE V module CODELOCK is then run to join
program blocks together into a compiled procedure file or to convert the ASCII code
of a complete command or procedure file into binary form. Procedure files may be
composed of as many as 42 blocks of commands, menus and screens.
An example of a possible application for the FAS-STATE database is given in
Appendix B. REGMENU.APP is a procedure file, created in RBEDIT for running the
impoundment summary report LAKEREP. Because LAKEREP is designed around
one condition, the selection of a region, REGMENU.APP is designed to set region
specifications interactively through a menu. REGMENU.APP is composed of three
blocks--a command block, REGMENU, and two menu blocks, REGION and
OUTDEV.
REGMENU is organized into four major segments. The first section opens
FAS-STATE, and sets the various system parameters and variables used in the
application program. Then the menu REGION is displayed. In this section, the
condition list criteria is set for the PRINT command executing LAKEREP, by
interpreting the user choices made from REGION. This menu offers the user the
option of choosing to report on one, several, or all of the IDOC regions. The menu
is continually displayed until either the ESC key is entered or the option EXIT is
chosen. Menu choices are stored in the text variable PICK1 and tested with a series
of IF-ENDIF statements. A second text variable, RPICK, translates the menu selection
into a format which can be added to a condition list. For instance, if "REGION1" is
selected from the menu, RPICK is set to "REGION EQ 1." A third text variable,
REGPICK, contains the entire condition list statement, including the command
WHERE and any connectors required to concatenate multiple menu picks.
4-2
The third section of the command block displays the second menu block,
OUTDEV, which is a vertical menu that displays all possible output options of
R:BASE V. This menu is displayed once and its choice is interpreted through another
series of IF-ENDIF statements. Each IF statement executes an OUTPUT command with
the appropriate option, except for the last option EXIT, which causes the entire
program to terminate.
The command procedure ends by executing the report, resetting variable values
and closing the data base, then returning to the program which called the procedure
file initially. Because REGMENU contains a portion of an executable statement, in
this case the condition list for "PRINT LAKEREP," its prefaced by an ampersand (&)
in the PRINT command.
Procedure files performing applications can either be executed from the
R:BASE module or called from the command block of a different procedure file. For
example, it is possible to create similar application programs for each of the three
FAS-STATE reports listed earlier. An initial command file could then be written in
RBEDIT or APPLICATION EXPRESS, which, upon entering R:BASE V,would list the
reports created for FAS-STATE. Using such a command file anyone could then
automatically call and execute any FAS-STATE data base reports.
4-3
0
---- -
0
0
0
NM
('
y-CO 0
- - CV)
o
LL
Ii
-J
D -
zej
C
= 0)
00
Cm >
w LU
W-J
COMw.
-
WI
mIfl
-NC' )
*-/ Q)
) c
.o
(
C
-
g o E-
OT-O e5
X
So,.
<':-
0.
CL
or
0
S- 0iz
C)o'
Ow
c Oa>
) a)
O C
C
•*
-b
oo
C
0»
••0
U)
E00
')NN0'CtCOM
CM
OO
C')
CO
or oe
"E
0)
C1
ae
U)-L
at
dn
0.200(Ag
S
C0
C
|aa |
a0
04 ma
.l GLacoZ coo
-
ze
Vs
c 00
0.
^
---
»-Q --
Q-
0
-
»-•
0 coSma
c
.
! -"-O
a) ._
003
w m
EOfoo
8smE| >u
|
CDQQ)
Q
Sz
z
NEw
W
A-1
oC,
O
EO
OVW r*
V-
0
XC
W.
E
18
uj, -iC
VWe
i 0§
o
Ia c.
8
P
O
cL cL
a.
co
q0Q
Z
l >
c
2C)
Lc)
A
|g
8 I Sf)
c--
<A
S
<
1
W M
m p
0wu
p
0l
C,
CMCM»Z
0O
0
z
caz~
P
S
j 11
LLQ
V- V- VVV--VV9N-
--
t!
COL .. o
z
p
w
0
w
w
S0N
3a
a. a
m
-
§
11
aZ
70!
SWi
p
A-2
C
LU
Li
x
co
M CO C C) CM CJ
W
o
ii
CMJ
CO
o
P:
Sj
UI
a
I
o
W,
Cr
U) Oz> (!)
'w- O
0o
O LL {-U <<
LL
LUr
co
CM
I*;
C
<<
%
»-ftt rt
V (0 1^
cr
2m1
co^zz00Wco
Zz
w1
S
coos
LL
Cf)Cl)
WW
U)"
5
L
=3
CV
co nAn
C CJ Ln
i' i•
CV)
0
w
I0z
WI
C)
W0
0
U)
a-O
5
LL Z
WW
.
Cr0
Su
z j vs E
0
8
0w
a
O
W
-J
LL
•o
m
CL
LL
N coV
<0c
U
WW
ozW
W
o0
o w
ccUJ
<8m cr.r
Q9
I
<o
ci
< e »-
V<w.CCO
Q
r,2
WW
I
0
z
-^
~W
u d cCO)win
I
V.C' WU
gc0
i6
t;<CE
.z
Cr
o
3
0
I,A ..
, (o
o
Ce)
-
0
I-
--
I-
--
-CO
0
Pa
SDo
cc
C
w
wo
o
0m0
:
w
wc/
^ 0»
r
~
w
~<Cr
~V.CiJ')~C~o
m58
U
8
_o
D
NL.ZO
RLLLLC))
r~~~~~
rZ
C)
~
A-3
Cre.
:s
9
CZCL
C
V.OQC
STATE FAS
VIEW: LAKEYEAR
TABLES LINKED
COLUMN
FROM
FROM
FROM
FROM
FROM
FROM
FROM
LAKE
YEAR
SEASON
ACREAGE
SEASTEXT
REGION
DISTRICT
SCREEN4
SCREEN4
SCREEN4
SCREEN2
SEASON
LAKEDIST
LAKEDIST
SCREEN2
LAKEDIST
SCREEN2
SEASON
CONDITION LIST:
REGION
REGION
DISTRICT
WHERE
GT OAND
LT 6 AND
LT 22
STATE FAS
VIEW: GEARVIEW
TABLES LINKED
COLUMN
LAKEDIST
SCREEN4
SCREEN4
LAKEDIST
LAKEDIST
SCREEN6
GEAR
SCREEN4
SCREEN2
FROM
FROM
FROM
FROM
FROM
FROM
FROM
FROM
FROM
LAKE
FCODE
YEAR
REGION
DISTRICT
GEARTYPE
GEAR
SEASON
ACREAGE
SCREEN4
SCREEN6
GEAR
SCREEN2
CONDITION LIST:
WHERE
EQ85AND
EQ 4
YEAR
REGION
STATE FAS
VIEW: LAKESPP
TABLES LINKED
COLUMN
LAKE
FCODE
FAS
ACREAGE
AVGDEPTH
COMMON
YEAR
FROM
FROM
FROM
FROM
FROM
FROM
FROM
SCREEN4 SCREEN2
SCREEN4 SCREEN7
SCREEN7 FISHCODE
SCREEN2
SCREEN2
FISHCODE
SCREEN4
CONDITION LIST:
WHERE
LAKE
EQ
FERNECLYFFE
A-4
SCREEN2
Appendix B
Code for the R:Base application program REGMENU.APP.
Descriptions of the overall file contents and Individual
sections and lines are given inthe comment statements, which
are denoted by asterisks and parentheses.
*(REGMENU.APP is a procedure file that interactively creates criteria for, and then
executes, the report LAKEREP. LAKEREP displays a summary of the lakes and
years within the FAS-STATE database for selected regions. REGMENU.APP is
composed of three blocks: a COMMAND block, REGMENU, and two MENU blocks,
REGION and OUTDEV. REGMENU sets the R:BASE system environment, opens
FAS-STATE, stores the region selection(s), made in REGION, in variable REGPICK;
and uses REGPICK to set the WHERE criteria in PRINTing LAKEREP. The report
output is sent to the device(s) selected in menu OUTDEV. Once the report is printed,
the program exits to either the procedure file (menu) that called it or to the R:BASE
system module. LAKEREP summarizes data from the VIEW 'LAKEYEAR', which
relates data from tables SCREEN2, SCREEN4, LAKEDIST, and SEASON.)
$COMMAND
REGMENU
OPEN FAS-STATE
SET MESSAGE OFF
SET ERROR MESSAGE OFF
SET COLOR BACKGRND BLUE
SET COLOR FOREGRND WHITE
SET BELL OFF
SET VAR PICK1 TEXT
SET VAR RPICK TEXT
SET VAR REGPICK TEXT
SET VAR COUNTER INT
*(Opens FAS-STATE database.)
*(Sets R:BASE messages off.)
*(Sets R:BASE error messages off.)
*(Sets screen background color to blue.)
*(Sets screen foreground color to white.)
*(Sets bell off.)
*(Defines a text variable to hold the region menu
choice.)
*(Defines the variable used for holding the region
criterion set by PICK1's value.)
*(Defines a text variable to hold all region
criteria selected in menu REGION.)
*(Defines integer variable for flagging if one or more
regions have been chosen. When COUNTER is GT
1, 'OR' is inserted when concatenating the variable
RPICK to REGPICK.)
SET VAR COUNTER = 1
*(Initializes 'COUNTER' at 1.)
SET VAR DEVOUT INT
*(Defines an integer variable for holding the selection
made from the column menu OUTDEV.)
*(Defines a text variable to hold the name of the file
entered when the DOS file option of 'OUTDEV' is
chosen.)
*(Labels a return point for further menu selections.)
*(Clears the display screen.)
SET VAR FILENAM TEXT
LABEL STARTAPP
NEWPAGE
B-1
The following block checks the choices made from the menu REGION. The
CHOOSE command stores the value of the menu selection, then passes through a
series of IF-ENDIF statements, performing the operation(s) associated with the menu
selection. Within the IF-THEN blocks, the text variable RPICK is initialized to hold
part of the condition list used with the PRINT command. The variable REGPICK is
then defined to hold the entire condition list for the PRINT command by
concatenating the value of RPICK onto its present value, inserting the boolean
operator "OR" for cases where more than one region is selected for reporting. The
menu continues to prompt for selections using the GOTO STARTAPP statement until
the option EXIT is chosen.
CHOOSE PICK1 FROM REGION INREGMENU.APX
IF PICK1 EQ "ESC" THEN
GOTO ENDAPP
ENDIF
IF PICK1 EQ "REGION 1 " THEN
SET VAR RPICK TO "REGION EQ 1"
IF COUNTER = 1 THEN
SET VAR REGPICK TO "WHERE" & .RPICK
ENDIF
IF COUNTER > 1 THEN
SET VAR REGPICK TO .REGPICK & "OR" .RPICK
ENDIF
SET VAR COUNTER = 2
GOTO STARTAPP
ENDIF
IF PICK1 EQ "REGION 2 " THEN
SET VAR RPICK TO "REGION EQ 2"
IF COUNTER = 1 THEN
SET VAR REGPICK TO "WHERE" & .RPICK
ENDIF
IF COUNTER >1 THEN
SET VAR REGPICK TO .REGPICK & "OR" .RPICK
ENDIF
SET VAR COUNTER = 2
GOTO STARTAPP
ENDIF
IF PICK1 EQ "REGION 3 " THEN
SET VAR RPICK TO "REGION EQ 3"
IF COUNTER = 1 THEN
SET VAR REGPICK TO "WHERE" & .RPICK
ENDIF
IF COUNTER > 1 THEN
SET VAR REGPICK TO .REGPICK & "OR" & .RPICK
ENDIF
SET VAR COUNTER = 2
GOTO STARTAPP
ENDIF
IF PICK1 EQ "REGION 4 " THEN
SET VAR RPICK TO "REGION EQ 4"
IF COUNTER = 1 THEN
B-2
SET VAR REGPICK TO "WHERE" & .RPICK
ENDIF
IF COUNTER >1 THEN
SET VAR REGPICK TO .REGPICK & "OR" & .RPICK
ENDIF
SET VAR COUNTER = 2
GOTO STARTAPP
ENDIF
IF PICK1 EQ "REGION 5 " THEN
SET VAR RPICK TO "REGION EQ 5"
IFCOUNTER = 1 THEN
SET VAR REGPICK TO "WHERE" & .RPICK
ENDIF
IFCOUNTER > 1 THEN
SET VAR REGPICK TO .REGPICK & "OR" &.RPICK
ENDIF
SET VAR COUNTER = 2
GOTO STARTAPP
ENDIF
IF PICK1 EQ "ALL " THEN
SET VAR REGPICK TO "
GOTO STARTAPP
ENDIF
IF PICK1 EQ "EXIT " THEN
GOTO ENDAPP
ENDIF
LABEL ENDAPP
*(This IF-ENDIF terminates the application by going to LABEL THATSALL,
when the ESC option is chosen without making prior menu selections from
REGION.)
IF COUNTER EQ 1 THEN
GOTO THATSALL
ENDIF
NEWPAGE
*(This block defines the output device to be used in printing the report,
through the menu OUTDEV. Since OUTDEV is a column menu, the CHOOSE variable
is an integer by default, rather than text, as in the row menu REGION.
REGMENU.APX is the compiled version of this application file, created by the
R:BASE module CODELOCK. If EXIT is chosen in this menu, the procedure file is
terminated without creating a report.)
B-3
CHOOSE DEVOUT FROM OUTDEV IN REGMENU.APX
IF DEVOUT=1 THEN
OUTPUT SCREEN
GOTO OUTEND
ENDIF
IF DEVOUT 2 THEN
OUTPUT PRINTER
GOTO OUTEND
ENDIF
IF DEVOUT- 3 THEN
OUTPUT SCREEN WITH PRINTER
GOTO OUTEND
ENDIF
IF DEVOUT = 4 THEN
WRITE""
FILLIN FILENAM USING "PLEASE ENTER A FILENAME TO SAVE YOUR REPORT TO
DISK:"
WRITE""
OUTPUT .FILENAM WITH SCREEN
GOTO OUTEND
ENDIF
IF DEVOUT= 5 THEN
WRITE" "
FILLIN FILENAM USING "PLEASE ENTER A FILENAME TO SAVE YOUR REPORT TO
DISK:"
WRITE""
OUTPUT .FILENAM WITH BOTH
GOTO OUTEND
ENDIF
IF DEVOUT 6 THEN
GOTO THATSALL
ENDIF
LABEL OUTEND
*(Identifies the program section where the report is
run.)
NEWPAGE
PRINT LAKEREP & REGPICK
OUTPUT SCREEN
WRITE""
WRITE " "
WRITE"
PAUSE
LABEL THATSALL
CLEAR ALL VARIABLES
*(Executes the report LAKEREP. '®PICK
specifies the list of regions prefaced by" WHERE",
held in the variable REGPICK, thus providing a
condition list for the report.)
*(Resets the output device to screen only.)
*(Displays the message given in quotes. In this case it
prints a blank line.)
END OF THE LAKES LISITING. HIT <CR> TO
CONTINUE"
*(Suspends execution of the program until the
operator presses a key on the keyboard.)
*(Label routing execution to the end of the program.)
*(Resets all variables back to null or zero.)
B-4
WRITE ""
WRITE"
WRITE""
RETURN
*(Displays message that the program is ending.)
-- EXITING LAKE SPECIES REPORT ROUTINE ----
*(Retums control back to the file calling the program,
that being either another menu in a procedure file or
to R:BASE.)
*(The following is a menu block, REGION, used for selecting regions, and
denoted by $MENU. The line following $MENU is the name used by the CHOOSE
command to call the menu. The next line denotes the type of menu, either ROW or
COLUMN, and the message to be displayed at the head of the menu. This is then
followed by the menu selections, each of which is listed on an individual line).
$MENU
REGION
ROW PLEASE SELECT A REGION
REGION 1
REGION 2
REGION 3
REGION 4
REGION 5
ALL
EXIT
*(The menu block for menu OUTDEV, providing output options.)
$MENU
OUTDEV
COLUMN SELECT AN OUTPUT DEVICE
SCREEN
PRINTER
SCREEN AND PRINTER
DOS FILE
FILE-SCREEN-PRINTER
EXIT
B-5