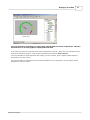
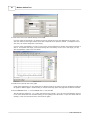
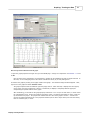
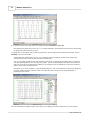
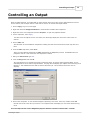
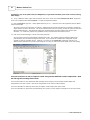
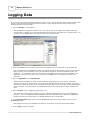
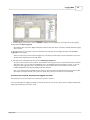
1
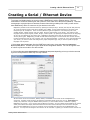
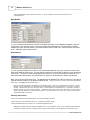
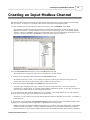
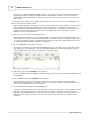
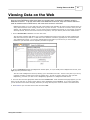
®
AzeoTech DAQFactory®
Modbus Guided Tour
Modbus Guided Tour
DAQFactory for Windows, Version 5.86, Sunday, September 18, 2011:
Copyright © 2001-2011 AzeoTech, Inc. All rights reserved worldwide.
Information in this document is subject to change without notice.
AzeoTech is a registered trademark of AzeoTech, Inc. DAQFactory is a registered
trademark of AzeoTech, Inc. Other brand and product names are trademarks of
their respective holders.
This manual: Copyright © 2011 AzeoTech, Inc. All rights reserved worldwide.
No portion of this manual may be copied, modified, translated, or reduced into
machine-readable form without the prior written consent of AzeoTech, Inc.
Contents
3
Table of Contents
Tour Overview
5
Tour Assumptions
7
Tour Terminology
9
Creating a Serial / Ethernet Device
11
Creating an Input Modbus Channel
15
Troubleshooting Modbus and the Comm
Monitor
19
Creating an Output Modbus Channel
22
Displaying some Data
24
Graphing / Trending the Data
29
Controlling an Output
35
Logging Data
38
Viewing Data on the Web
41
© 2011 AzeoTech, Inc.
3
Tour Overview
I
Tour Overview
5
Tour Overview
In this tour we will show you how to use DAQFactory to perform data acquisition, display your data, both locally and
on the web, and logging, and give you the base to proceed comfortably through the rest of the User's Manual or
explore DAQFactory on your own. We recommend performing all the steps on your computer as you read through
this tour. To use this tour you will need a Modbus device, ideally with an input and an analog output channel. If you
do not have to have any data acquisition hardware, you can use the guided tour in the User's Manual which uses the
test device.
Tour Overview
Tour Assumptions
II
Tour Assumptions
7
Tour Assumptions
This guided tour, and the rest of the DAQFactory manual assumes you are a reasonably experienced Windows user.
It also assumes that you have installed DAQFactory on your computer and are ready to use it. Installation
instructions are provided by the installer.
Tour Assumptions
Tour Terminology
III
Tour Terminology
9
Tour Terminology
We recommend you read the section on DAQFactory objects in the User's Guide to get an overview of the terms
used in this tour as well as the rest of this manual.
"Click" means left click.
"Right-Click" means right click.
"Double-Click" means two left clicks in rapid succession.
Tour Terminology
Creating a Serial / Ethernet Device
IV
Creating a Serial / Ethernet Device
11
Creating a Serial / Ethernet Device
To connect to a Modbus device we need to create a DAQFactory serial or Ethernet device. This is a
combination of a serial or Ethernet port and a protocol, in this case one of the flavors of Modbus. This often
corresponds to a physical piece of hardware, however when doing multidrop 422 or 485, you will use the
same DAQFactory device to connect to all your devices in the chain.
DAQFactory handles serial communications by splitting the transport layer: RS-232, RS-422, RS-485, Ethernet,
etc, from the protocol used on that layer: Modbus, DF1, NMEA. In less technical speak you can think of the
transport layer as a telephone. There are many different types of telephones: ones that plug into a wall,
cordless phones, cellular phones, and even VOIP. We then communicate on the phone. The protocol is the
language that we speak: English, Swahili, Klingon, modem speak. By splitting the telephone from the language,
we can use any language on any phone type. DAQFactory provides all the tools for communicate over the
various phone types. DAQFactory provides several different languages to communicate with common devices,
but also provides the tools for you to specify your own special languages. In order for you to communicate with
your device, you have to select and configure the proper telephone type, and you have to speak the proper
language over the phone.
1. Select Quick – Device Configuration from the DAQFactory main menu, then select New Serial (RS232/485) /
Ethernet (TCP/IP) Device. This will open up the serial device configuration window. For now we’ll ignore most
of it since we just want to talk to our device a little.
2. Click on either New Serial (RS232/422/485) or New Ethernet (TCP) Client depending on how you device connects
to your PC and proceed to either step 3 or step 4 below.
All three forms of serial connections, RS232, RS422, and RS485 are the same as far as DAQFactory is
concerned. A USB to serial converter will appear as a standard serial comm port on a PC. Ethernet Server is
usually only used when using the Modbus Slave protocol (i.e. when another device or software is polling
DAQFactory for values). If you using a serial to Ethernet converter, you can typically avoid installing any virtual
comm port software and simply select New Ethernet Client and connect directly to the converter's raw port.
This is because DAQFactory can use any protocol on any transport layer and thus can do ModbusRTU over
Ethernet. You may need to configure the converter to use raw data. Typically you will also need to connect to a
Creating a Serial / Ethernet Device
12
Modbus Guided Tour
non-standard Modbus port (meaning not 502). It will be whatever the converter uses for its raw
communications.
New Serial:
3. If you are doing a serial (RS-232, RS-422 or RS-485) connection: in the window that appears, give your
comm port a name, then specify the comm port number and its parameters. This information is usually
available from your device’s manual. The default timeout value of 1000 is fine. Most likely flow control will
be off. Click Save and proceed to step 5.
New Ethernet:
4. If you are doing an Ethernet connection: in the window that appears, give your connection a name, then
enter the IP address of the device. You will need to configure your device with a valid IP on your subnet and
not the URL. The device manual should explain how to do this. If you don’t know what a valid IP is, or for
that matter what subnet means, you should ask an IT person or get help from the device manufacturer.
Next, you will need to enter the IP port. The standard port for ModbusTCP is 502, so unless you are using a
serial to Ethernet converter, it will almost certainly be 502. Finally, a timeout of 1000 is more then adequate for
most cases. Click Save and proceed to step 5.
Ethernet is really a big bundle of different communication lines. Each one is assigned a port number. You can
think of it like a skyscraper. The IP address is the postal address, say 123 Main Street. The port is the office
number. Without both you won't find your device. Certain ports have standard uses. For example, port 80 is
typically used by the web for HTTP requests. ModbusTCP is typically on port 502. Once again, you will need to
check with your device for the proper Ethernet port. If you don’t enter the correct port, you will not be able to
communicate with your device.
Selecting the Protocol
Once you've created your serial or Ethernet port, you can finish creating your device:
5. Select the port you just created by clicking on it. A checkbox will appear next to it.
6. Select the desired protocol by clicking on it. A checkbox will appear next to it.
DAQFactory supports all three flavors of Modbus: RTU, TCP and ASCII. Refer to your hardware documentation
to determine which you need. Typically RTU is used for serial devices, TCP for Ethernet, and ASCII only on
© 2011 AzeoTech, Inc.
Creating a Serial / Ethernet Device
13
older serial devices.
7. Give your device a name. You will use this name when you create your I/O channels. For now, name it simply "Modbus", but if you
have, or expect to have multiple devices connected, you may wish to give a more descriptive name. When you are done, click OK.
The rest of this guide will assume you named the device "Modbus". Like almost all DAQFactory names, device
names must start with a letter and contain only letters, numbers or the underscore.
You now know how to select a communications port and protocol to create a DAQFactory
device. Next we will use this device to create our I/O channels.
For more information on serial communications, see the chapter entitled Serial and Ethernet Communications in the
DAQFactory User's Guide.
Creating a Serial / Ethernet Device
Creating an Input Modbus Channel
V
Creating an Input Modbus Channel
15
Creating an Input Modbus Channel
Now that you have a device created with your port settings and protocol we can create channels to communicate
with your device. In this part, we will add a channel to the document and start acquiring data.
1. In the workspace (the tree area along the right of the screen), click on CHANNELS: under Local.
The workspace provides an organized presentation of the different configuration screens for setting up your
DAQFactory document. Clicking on almost every item in the tree will bring up a new view related to the item
selected. Clicking on CHANNELS: displays the channel table where you can manipulate all the channels in your
document. Make sure and click the CHANNELS: under Local and not the one under V:
2. In the Channel Table View that appears, click on the Add button at the top.
This creates a new row where we will enter the information for our first channel.
3. In the new row of the table, enter Pressure in the Channel Name column.
All channels must have a name. You can assign any name you want to your channels as long as they are
unique, start with a letter and only contain letters, numbers or the underscore "_".
4. In the second column, Device Type, select Modbus from the drop down list.
The device type determines which type of device you wish to communicate with. This can be a specific
manufacturer, a specific device, or a generic communications method such as OPC. In our case, we select the
device we just created that has our port settings and protocol.
5. In the third column, D #, enter the Modbus ID of your hardware. This usually defaults to 1 for most hardware,
but you'll have to refer to your device settings for the proper value.
The device # is only used by some devices and has different meanings depending on the device. For Modbus it
is the device ID.
6. In the fourth column, I/O Type, select Read Holding S16 (3) or select from any of the other Modbus register types
depending on your hardware. Read Holding S16 is a good fallback for analog inputs.
Modbus technically only supports 6 different I/O types, force / read coil, read input status, read / write holding
register and read input register. However, hardware manufacturers have "enhanced" Modbus by combining
multiple registers in various ways to achieve registers with non-standard types like 32 bit integers and floating
Creating an Input Modbus Channel
16
Modbus Guided Tour
point values out of the standard 16 bit Modbus register. You should refer to your hardware documentation to
see which type applies. Sometimes, especially with the various floating point types, it is not clear from the
documentation which is appropriate. In this case you will often simply have to try each one until you get the
proper values.
7. In the fifth column, Chn #, enter the Modbus register address you wish to read. There is no fallback here, you
will have to look in your hardware manual.
Modbus addressing falls into two categories, what we call zero indexed and 40,000 notation. You can use either
here and DAQFactory will automatically adjust. The only exception is if your hardware manual uses zero
indexed and has registers that get up into the 30,000 and 40,000 range. In this case you will need to read a
register in the 50,000 range (even if it doesn't exist) to fix DAQFactory into zero index mode. See the
DAQFactory help for more information.
8. Leave the rest of the columns in their default setting.
One important item to mention is the sixth column, Timing. For input channels this determines how often the
input is read from the device. The interval provided here is in seconds. For now, we are going to leave it set at
1, or one new reading per second. In general you will never want to make this number smaller than 0.01 and
for Modbus even that is probably too fast for most hardware.
9. Click on the Apply button at the top of the screen.
The changes you make are not implemented by DAQFactory until you click Apply. If you do not want to keep
your changes, you can click Discard. Once you click Apply, DAQFactory will start taking trying to take data
from the Modbus device, and will place that data in the "Pressure" channel.
10. Click on the + sign next to CHANNELS in the workspace.
The + sign appeared when you hit Apply. Clicking on it displays the channels you've created as separate items in
the workspace.
11. Click on Pressure listed under CHANNELS in the workspace.
This will display the channel view for the channel Pressure. The channel view displays the configuration
information for a single channel. In general, it is quicker to create your channels in the channel table, but the
channel view provides space for some extra details.
12. In the Channel View that appears, click on the Graph tab.
The channel view also provides a quick graph and table to view your incoming data. This can be used to confirm
that data is being acquired and that you are reading the correct data. You should see some sort of trend
displayed in the graph depending on your signal. You have just confirmed that you are acquiring data on your
pressure channel. (below we just show a sin wave since we don't know what you have connected to your
hardware)
© 2011 AzeoTech, Inc.
Creating an Input Modbus Channel
13. If you'd like to see the table, click on the Table tab.
If you aren't seeing any data we'll go over some troubleshooting tips next.
For more information on channels and the various parameters available, see the chapter on Channels and
Conversions in the User's Guide.
Creating an Input Modbus Channel
17
Troubleshooting Modbus and the
Comm Monitor
VI
Troubleshooting Modbus and the Comm Monitor
19
Troubleshooting Modbus and the
Comm Monitor
In this section we'll go over some troubleshooting tips. If you are seeing data already, feel free to skip to the next
section.
Unfortunately, if you aren't seeing any data, there are a number of things that could be wrong when doing serial or
Ethernet communications. Fortunately, you can usually just step through all the possibilities, double checking
yourself, and the source of the problem will become apparent.
Monitoring Communications:
To help with troubleshooting serial and Ethernet communications, DAQFactory provides a communications monitor.
To view this monitor, click View - Comm Monitor from the DAQFactory main menu. This will display a docking window,
usually at the bottom of the DAQFactory window. Right click in the main part of this window and select the
communication port you wish to monitor. Unless you are doing Modbus ASCII, you will probably also want to enable
the Display All Chars as ASCII codes option also available from the right click menu (and probably Display codes as Hex
and Display Time of Rx/Tx. Do not check New line with CR or LF unless you are doing Modbus ASCII)
Troubleshooting:
Here are the things that can be wrong and cause communications to fail:
1) bad wiring: this is typically only a problem with RS422/485 connections as RS232 and Ethernet usually use
prebuilt cabling, but it still happens. For 422/485 make sure you have proper termination, watch for polarity, and
despite the fact that 422/485 are differential signals, you do need the Gnd line hooked up.
2) incorrect port settings:
For serial: your comm port settings much match exactly with your device. Even an incorrect Parity or Stop bit
setting will kill all communications so double check yourself.
For Ethernet: an incorrect IP or port will cause comm failure as well, the DAQFactory comm monitor can help. If
you don't see any Tx: lines after you create your channel then DAQFactory was unable to connect to the remote
device and the IP or port must be wrong, or the IP is on the wrong subnet (meaning DAQFactory, for example is
at 192.168.1.3 and your device is at 10.0.0.5). If you do see Tx: lines than DAQFactory was able to connect to
something, so unless you connected to the wrong port and that port happens to have some other protocol
running, you probably have the correct port settings and good wiring and can move on to the next possibilities.
Troubleshooting Modbus and the Comm Monitor
20
Modbus Guided Tour
3) wrong Modbus ID: even in ModbusTCP, most device require the Modbus ID to match the D# specified in your
DAQFactory channel. Double check the device to find the current Modbus ID setting and make sure the D# of your
channel is the same.
The above problems typical result in either no comms, or comm timeouts, meaning you'll see Tx: lines in the comm
monitor but no Rx. The ones below typically have a response, but its an error, though some devices won't respond
even when a standard Modbus error is called for.
4) noise on the line (serial only): if you see Rx lines but they don't look similar to the Tx lines you probably have
noise on the line and should evaluate your cabling. The first few characters of a Modbus response are identical to
the query, so the first few numbers in Rx should match Tx.
5) wrong I/O type: some devices only support Input Registers or Holding Registers, or have no registers at all, just
coils. Most will return a standard Modbus error, which will appear in the Command / Alert window (View - Command /
Alert from the main menu), but some just ignore the request and don't respond.
6) wrong Modbus register (channel #): double check your hardware manual.
That covers the basic failure modes. If you continue to have problems, please contact AzeoTech support or post to
our forum at www.azeotech.com/board.
© 2011 AzeoTech, Inc.
Creating an Output Modbus Channel
VII
22
Modbus Guided Tour
Creating an Output Modbus
Channel
In addition to taking data, most systems also control outputs. Here DAQFactory offers many advanced automated
control features such as PID loop control and sequences, but for now we will just create an output channel and
control it manually from a page component.
1. Click on CHANNELS: in the workspace to go back to the channel table.
2. Click on Add to create a new row in the table.
3. In the new row, name the channel Out Enter the same D# you used for Pressure, then select one of the output
I/O types (Force Coil or one of the Set Register types) and enter the Modbus register address for the desired output.
Leave the rest in their defaults.
4. Click on Apply to save your changes.
The output channel has been created, but it hasn't been set to anything. We'll see how to do that in a bit...
You are now taking data. In the next section we'll display it on our own custom screens.
© 2011 AzeoTech, Inc.
Displaying some Data
VIII
24
Modbus Guided Tour
Displaying some Data
The Channel View certainly provides a quick look at your data, but is not the most convenient or flexible way to
display your data, especially once you have more than one channel. In this section we'll add a component some
different components to a page that will display data from the Pressure channel.
1. Click on Page_0 in the workspace under PAGES.
This will display a blank white page. When DAQFactory starts, 10 blank pages are generated automatically with
default names. You are not limited to these 10 pages and can create as many pages as you want.
2. Right-click somewhere in the middle of the blank area and select Displays-Variable Value.
This will place a new page component on the screen. There are many different components available that allow
you to create custom screens. This particular component simply displays a changing value in text form.
3. Right click on the new component and select Properties...
All of the screen components have different properties windows for configuring the look of the component and
telling the component what data to display.
4. Next to Caption:, enter Pressure.
The caption is what is displayed in front of your value. A colon is automatically added when displayed.
5. Next to Expression:, enter Pressure[0].
Expressions are actually formulas that you can enter to display calculated data. In this case, the formula simply
requests the most recent data point of the channel pressure. The [0] indicates the most recent data point. If
you did [1] you'd get the next most recent data point and so forth back to the History length of the channel,
which we left in the default of 3600. You could just as easily put Pressure[0] * 10 if you wanted to display the
channel's value times ten.
© 2011 AzeoTech, Inc.
Displaying some Data
25
NOTE: A common error is to use () instead of [] for subsetting. Although this works in some cases, it does not
work in all, nor do we guarantee that it will continue to work in newer versions.
6. Click on OK.
Now the screen should display Pressure: 0.324 V with a changing number. This is the current value in the
pressure channel we created earlier. Feel free to open the properties window again and play with the units,
font and other settings.
7. While holding the Control key, click on the first Variable Value component.
This will select the component, as indicated by the shaded rectangle surrounding it.
8. While holding the Control key, click and drag the Variable Value component to a new location on the screen.
This allows you to move the component around the screen.
The next steps will not work in DAQFactory Express because it doesn't include gauges. Consider
upgrading to any of the paid versions of DAQFactory to get gauges and thirty some other controls,
among other things.
9. Right click somewhere else on the screen away from the displayed component and select Gauges-Angular.
Displaying some Data
26
Modbus Guided Tour
10. Right click on the new component and select Properties... to open its properties window.
11. For the expression, enter Pressure[0] * 10.
As we mentioned before, expressions are actually formula so wherever there is an expression we enter in
calculations. This particular one simply takes the most recent value of the pressure channel and multiplies it by
10.
12. For the Range, enter -10 to 10.
You'll want to adjust the range so that the reading from your device times 10 is within the range of the gauge.
13. Click OK.
The gauge will now be scaled from -10 to 10, or whatever you selected, and the gauge arrow will move with the
value of pressure. Notice how the first screen component still displays the original channel values. Both of
these components are independent of each other.
14. While holding the Control key, click on the first Variable Value component.
This will select the component, as indicated by the shaded rectangle surrounding it.
15. While holding the Control key, click and drag the Variable Value component to a new location on the screen.
This allows you to move the component around the screen. Try the same thing with the gauge.
16. While holding the Control key, click on the gauge. Square dots will appear at the corners of the gauge. Click
and drag these dots to resize the graph.
The gauge is a resizable component and displays square black dots around the selection rectangle for resizing.
The Variable Value component automatically sizes to its contents so does not display the dots.
© 2011 AzeoTech, Inc.
Displaying some Data
27
You now know how to display your data using several different screen components. Next we
will learn how to use the graph to display historical data.
In the mean time, feel free to play with other similar components if you'd like. When done, you can delete them by
selecting the component (Control - Click) and then right clicking and selecting Delete Component.
For more information on page components and creating your user interface, see the chapter entitled Pages and
Components in the User's Guide.
For more information on expressions and the functions available for use in expressions, see the chapter entitled
Expressions in the User's Guide.
Displaying some Data
Graphing / Trending the Data
IX
Graphing / Trending the Data
29
Graphing / Trending the Data
Displaying scalar values in text or gauge form is certainly useful, but nothing is better than a graph to give you a
handle on what is happening with your system. DAQFactory offers many advanced graphing capabilities to help you
better understand your system. In this section we will make a simple Y vs time or trend graph.
Note: the traces in the screenshots are for those without hardware that are using the Test device. For those using
real hardware, your screens will almost certainly look a bit different, but you should be able to see data after going
through these steps.
1. If you are still displaying the page with the gauge value on it, hit the 1 key to switch to Page_1. If you are in a
different view, click on Page_1 in the workspace.
The workspace is only one way to switch among pages. Another is using speed keys which can be assigned to a
page. By default, the initial 10 pages are assigned the keys 1 through 0.
2. Right click somewhere on the blank page and select Graphs - 2D Graph. Move and resize the graph so it takes up
most of the screen. To move the graph, simply hold the Ctrl key down and click and drag. To resize, hold the Ctrl
key down and click and drag one of the 8 dark squares around the outside of the graph. Next, open the properties
window for the graph.
3. Next to Y Expression: type Pressure.
The Y expression is an expression just like the others we have seen so far. The difference is that a graph
expects a list (or array) of values to plot, where in the previous components we have only wanted the most
recent value. By simply naming the channel in the Y expression and not putting a [0] after it, we are telling the
graph we want the entire history of values stored in memory for the channel. The history length, which
determines how many values are kept in memory and therefore how far back in time we can plot is one of the
parameters of each channel that we left in its default setting of 3600.
Graphing / Trending the Data
30
Modbus Guided Tour
4. Leave all the rest in their default settings and click OK.
If you are using the Test device, you should now see the top half of a sine wave displayed in the graph. The
sine wave will move from right to left as more data is acquired for the pressure channel. To display the entire
sine wave, we need to change the Y axis scaling.
If you are using real hardware, you may or may not see a trace depending on whether the reading is between 0
and 10. If its outside this range, you'll need to change the Y axis scaling. Even if it is in this range, you may
want to expand the Y axis to see more detail.
5. Double click on the left axis of the graph.
Unlike other components, you can double click on different areas of the graph to open the properties window for
the graph to different pages. Double clicking on the left axis brings up the axis page with the left axis selected.
6. Next to Scale From enter -1, next to Scale To enter 1, then click OK.
This will scale the graph from -1 to 1 which will show the entire graph. If you are using real hardware, feel free
to use other values that cover the data reading you were getting in the last section. If you don't know what the
reading is, read on as we'll show how to auto-scale the graph.
© 2011 AzeoTech, Inc.
Graphing / Trending the Data
31
Now we'll try another method to scale the graph.
7. Open the graph properties box again and go to the Traces page. Change the Y Expression to Pressure * 10 and
hit OK.
Like the other screen components, the expressions in graphs can be calculations as well as simple channels. In
this case, we are multiplying each of the values of Pressure's history by 10 and plotting them.
8. Deselect the graph by clicking on the page outside of the graph. The shaded rectangle should disappear. Next,
right click on the graph and select AutoScale - Y Axis
The graph component has two different right click popup menus. When selected, it displays the same popup
menu as the rest of the components. When it is unselected, it displays a completely different popup for
manipulating the special features of the graph.
After autoscaling, you should see the graph properly scaled from -10 to 10 (for the Test device, or other values
for real hardware users). Notice the rectangle around the graph. The left and right sides are green, while the
top and bottom are purple. The purple lines indicate that the Y axis of the graph is "frozen". A frozen axis
ignores the scaling parameters set in the properties window (like we did in step 6 above) and uses the scaling
from an autoscale, pan, or zoom.
Graphing / Trending the Data
32
Modbus Guided Tour
9. To "thaw" the frozen axis, right click on the graph and select Freeze/Thaw - Thaw Y Axis
Once thawed, the graph will revert to the -1 to 1 scaling indicated in the properties box and the box surrounding
the graph will be drawn entirely in green.
10. Double click on the bottom axis to open the properties to the axis page with the bottom axis selected. Next to
Time Width:, enter 120 and hit OK.
If the double click method does not work, you can always open the properties window for the graph using
normal methods, select the Axes page and click on Bottom Axis.
In a vs. time graph, the bottom axis does not have a fixed scale. It changes as new data comes in so that the
new data always appears at the very right of the graph. The time width parameter determines how far back in
time from the most recent data point is displayed. By changing it from the default 60 to 120 we have told the
graph to plot the last 2 minutes of data.
Once again, if you zoom, autoscale, or pan the graph along the x axis, it will freeze the x axis and the graph will
no longer update with newly acquired values. You must then thaw the axis to have the graph display a
marching trace as normal.
For more information on graphs and the many ways you can display your data in graph form, go to the chapter
© 2011 AzeoTech, Inc.
Graphing / Trending the Data
entitled Graphing and Trending in the User's Guide.
Graphing / Trending the Data
33
Controlling an Output
X
Controlling an Output
35
Controlling an Output
When we added channels, we created both an input channel, which we've been using to demonstrate the various
screen controls, and an output channel. Now we'll see how to use control that output channel.
1. Click on Page_0 to go to our first page.
2. Right-click and select Displays-Variable Value to create another variable value component.
3. Right click on the new component and select Properties... to open the properties window.
4. For the expression, enter Out[0].
Feel free to set the caption as well. Like before, this will simply display the most recent value of the out
channel.
5. Click on Action tab.
This tab exists on several different components including the static ones and works the same way with all of
them.
6. From the Action drop down, select Set To.
There are many different options for the Action described in the DAQFactory manual. The Set To action will
prompt the user for a new value when the component is clicked.
7. Next go to Action Channel: type Out.
8. Leave the Range blank and click OK.
The range allows you to constrain the inputs to particular values. By leaving these properties blank, we are
indicating that we do not want a range limitation. The page will now display your caption and 0 with a big red X
through it. This indicates that out does not have a valid value yet. This is because we haven't set it to
anything.
9. Click on the component. A new window will appear requesting a new value. Enter any number and hit OK.
Out will now be set to the value you entered. The component will now display your new value without the big
red X.
The next steps will not work in DAQFactory Express because it doesn't include knobs. Consider
Controlling an Output
36
Modbus Guided Tour
upgrading to any of the paid versions of DAQFactory to get knobs and thirty some other controls, among
other things.
10. To try a different control, right click somewhere else on the screen and select Sliders & Knobs - Knob. Right click
on the new component and select Properties... to open the properties window.
11. Next to Set Channel, type Out. Under Update Interval, put 0.1. Leave the rest of the properties at their default
values and click OK.
The knob is now set to control the out channel. Update Interval controls how often the command to update the
output channel is sent to the device. The screen refreshes the knob very quickly, usually too quick for serial and
Ethernet based devices. This parameter keeps the communications ports from getting tied up with rapid
refreshes. 0.1 means the output is only updated 10 times a second when the knob is turned.
12. Click on the knob and drag in a circle as if turning the knob.
You may have to click once beforehand to deselect the knob. The number inside will change indicating the
present setting and out will be changed to this value. If you look at the variable value component we just
created you will see it update as well. Likewise, if you click on the variable value component and set it to a
different value (between the current knob's range of 0 to 100) you will see the knob update to the new setting.
You now know how to set an output to value using several different screen components. Next
we will log the incoming data to disk.
For more information on the components that manually control outputs, see the chapter entitled Pages and
Components in the User's Guide. Most of the components can be used to control outputs.
For more information on PID loop control see the chapter on PID loops in the User's Guide.
For more information on sequences and automating your system, see the chapter on Sequences in the User's Guide.
© 2011 AzeoTech, Inc.
Logging Data
XI
38
Modbus Guided Tour
Logging Data
So far we have seen how to take data and display it on the screen. Next we will learn how to store this data to disk
so that it can be opened with another program for analysis. In this example we will create a simple comma
delimited file with our pressure data.
1. Click on LOGGING: in the workspace.
This will display the logging set summary view. Here you can see all your logging sets displayed and their
running status. A logging set is a group of data values being logged in a particular way to a particular file. You
can have as many logging sets as you need, and they can run concurrently.
2. Click on the Add button in the logging set and when prompted for the new name, type in Log and click OK.
Like channels and all other DAQFactory names, the logging set name must start with a letter and only contain
letters, numbers or the underscore. Once you click OK, the logging set view will be displayed for the new
logging set. You can also get to this view by clicking on the logging set name listed under LOGGING: in the
workspace. You may have to click on the + sign next to LOGGING to see your logging sets listed in the
workspace.
3. Next to Logging Method, select ASCII Delimited
ASCII Delimited is probably the most common method for data logging as it can be read by most other
programs such as Excel. Unfortunately, it is not as space efficient or fast as the binary methods. But unless
you have strict space constraints or you are logging more than about 10,000 points per second (depending also
on your computer / hard drive speed), we suggest ASCII since it can easily be read by other programs like
Excel.
4. Next to File Name enter c:\DAQFactory\mylogfile.csv
It is usually best to fully specify the path to your file, otherwise the data will be stored in your DAQFactory
directory. The .csv is a windows standard designation for comma delimited values. Note the c:\DAQFactory
directory will need to exist (and will if you installed DAQFactory in its normal place)
5. In the Channels Available table, click on the row with Pressure, then click on the >> button to move it to the
Channels to Log table.
Each logging set can log any combination of channels. In this case, we will just log the input channel.
6. Click on Apply to save the changes.
© 2011 AzeoTech, Inc.
Logging Data
39
7. To start logging, click on the + next to LOGGING to display the new logging set, then right click on the logging
set Log and select Begin Logging Set.
Once started, the icon next to Log will change and the red stop sign will be removed to indicate that this logging
set is running.
8. Wait at least 10 or 15 seconds to log some data and then right click on the logging set again and select End
Logging Set to stop logging.
There are other ways to start and stop logging sets, including the action page of some components such as the
variable value component that we used earlier.
9. Now start Excel or Notepad and open the file c:\DAQFactory\mylogfile.csv.
You will see two columns, time and data. By default the time is given in Excel / Access format which is decimal
days since 1900. You can also have DAQFactory log in its standard format of seconds since 1970. If you are
using Excel and logging the time in Excel format, you can format the first column as date / time and the
numbers displayed will be properly displayed as date and time.
Hint: if you cannot find the mylogfile.csv file, check to make sure that you selected Pressure to log and not Out.
Since Out is an output channel, it only gets new values to log when you actually set it to something.
You have now acquired, displayed and logged your data.
The last step is to view your data on the web from a browser. Read on....
For more information on logging including the various file formats you can use, please see the chapter entitled Data
Logging and Exporting in the User's Guide.
Logging Data
Viewing Data on the Web
XII
Viewing Data on the Web
41
Viewing Data on the Web
Once you have DAQFactory taking some data, you can also view it on the web in a browser using the
DAQConnect service. To do this, we'll create a free DAQConnect account, setup our Pressure channel to
send its measurements to DAQConnect, and create some screens in a browser.
DAQConnect allows you to view data live from a web browser and optionally do remote control without having to
worry about firewall or router settings, static IPs or any other IT issues. You also do not need to have your own
website, just a DAQConnect account. You can create screens in DAQConnect directly in your browser using drag
and drop controls, and can view these screens from anywhere, even your iPhone, iPad or other mobile device.
1. Click on Real-time Web -> Connect... from the main menu.
This will popup a window that allows you to create a DAQConnect account and create or select a DAQConnect
data source to send your data to. A data source is a collection of channels, typically from one location within
your DAQConnect account. You can have multiple data sources within your account if you have multiple
locations or you otherwise want to separate your data into groups.
2. Click on Create Account when the DAQConnect window opens, or if you already have a DAQConnect account, click
Login, login and proceed to step 4.
This will create a DAQConnect account, allowing you to send data to the web. There's a free plan so you can try
it without providing a credit card or much of anything else. You will not need to login every time you start
DAQFactory, just when you want to link a DAQFactory application to a DAQConnect data source.
3. Fill in the form with the appropriate details and click Create Account. When the Select Plan page appears, you can
leave it on the free plan, or select a higher plan for more capabilities and click Continue. If you select a paid plan,
you will be taken to the credit card page, otherwise you will go directly to the screen to create a new data source.
4. Enter Tank for your new data source name and click Create.
Viewing Data on the Web
42
Modbus Guided Tour
This will create a new data source named "Tank" and link it to your DAQFactory document. You can create
other data sources in your account and switch among them by clicking on Real-time Web -> Connect again.
5. The window will close. Select Real-time Web -> Settings. Then check Display Detailed Status in Command / Alert and
click OK.
This will cause DAQConnect status messages to appear in the command / alert window. This setting is designed
for debugging only, and is not saved with the document.
If all is well, you should see DAQConnect status messages, probably saying "Sending: 0 tags to server" in the
Command / Alert window located at the bottom of the DAQFactory window. Now that your DAQFactory document is
connected to DAQConnect, we can have our Pressure channel send its data to DAQConnect.
6. Click on CHANNELS: in the workspace, find the Pressure channel, and check the box under the column labeled
DAQConn?. Click Apply.
The pressure channel will immediately start sending its data to your DAQConnect data source. Now we can
go to DAQConnect in a browser and view the data:
7. Open up your favorite browser and browse to www.daqconnect.com then click on customer login or my
account if you are already logged in. Feel free to do this on a different computer. Login using the account
you created in step 2 above.
Although you can use pretty much any browser, we recommend Chrome because it has the fastest JavaScript
implementation, then Firefox, and finally, IE, which unfortunately still falls way behind in its JavaScript
performance.
© 2011 AzeoTech, Inc.
Viewing Data on the Web
43
8. Once logged in, you will be presented with the main DAQConnect editor and a blank page. Click on the
Basics menu at the top. You then see your Tank data source listed with the Pressure channel (or tag as its
called in DAQConnect) listed underneath. To the right of Pressure are three icons. Drag the first one onto
the big white area (the page) outside the menu to view the current Pressure reading as a number.
9. Try dragging the other two icons to the page to view a gauge and a trend graph of your data.
There are a number of other controls available in the Visuals menu. See the DAQConnect help for more
information.
10. Click on Save at the top right corner to save your new DAQConnect page. Now you can login from
anywhere to view real time values!
There are ways to create restricted, read-only members with separate login for the same account, as well as the
ability to embed your dynamic DAQConnect pages inside other web pages. Please refer to the DAQConnect help
for more information.
That is the very basics of DAQConnect. Feel free to explore more with your free account, and refer to the
DAQConnect help for more details. There is also more detail on using DAQFactory with DAQConnect and
control capability in the DAQFactory help.
You have now acquired, displayed, logged your data and viewed it on the web from a
browser.
For simpler applications, it is simply a matter of repeating most of these steps for additional channels. But even for
simpler applications there are many adjustments available for fine tuning your application to work the way you want.
These, along with many more walk-throughs and examples are provided in the appropriate sections of this manual.
At this point we suggest playing with DAQFactory a bit, jumping to the appropriate sections of the manual for more
detail on the areas of DAQFactory you may be interested in utilizing.
Viewing Data on the Web