1
Hansson et al.
Analyzing cell patterns using RipleyGUI
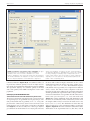
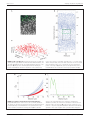
FIGURE 1 | Screenshot of the opening screen of RipleyGUI. The upper
left panel (Create a new distribution) is allocated for distribution
simulations. Each of the four reference distributions (see section
Reference distributions) can be tuned with intensity and other parameters.
The simulated distributions are displayed in the upper center panel (Name).
The lower left panel (Operations on this distribution) is designed for
it indicates inhibition (Figures 2C,F). An estimation of K̂(t) (or
in general any stochastic quantity) is based on sample observations under given assumptions that might not always be fulfilled.
The expectation (E[K̂(t)]) of a stochastic quantity is the mean
value of the quantity under fulfilled assumptions over the entire
population.
USING RipleyGUI ON EXPERIMENTAL DATA
Corticostriatal cells in visual and somatosensory barrel cortex
The mouse brain samples investigated in the present study were
etv-expressing layer 5A pyramidal neurons projecting to striatum [corticostriatal cells; etv-pyramids (Groh et al., 2010)] sampled from the somatosensory barrel cortex and visual cortex.
Confocal images were acquired from coronal slices 50–100 μm
thick (Figure 3). We chose to analyze for t-values up to 50 μm to
get estimations for the K-function on a varying scale. However,
Frontiers in Neuroinformatics
analysis of the distribution on display in the upper central panel (Name).
The right panel (Operations on all distributions in a chosen set) is designed
for saving, managing, and analyzing single or multiple data sets. The
results of all the analysis can be viewed inside or outside of RipleyGUI
depending on the user’s preference. All analysis-related parameters are
tunable in their corresponding panels.
the most stable results for Ripley’s K-function are for t-values
smaller than 0.25 times the shortest side of the volume (Ripley,
1988; Diggle, 2003; Costa et al., 2007). The distributions of genetically labeled cells (etv-pyramids) were compared in two different
sensory cortices. One aim for such a comparison could be to
investigate if local factors influence the structural arrangement,
and thus presumably the organization of these cell types in microcircuits. The distribution of etv-pyramids in both somatosensory
barrel cortex (Jafari-Mamaghani et al., 2010) and visual cortex
(Figures 4, 5) differs significantly from CSR distributions with
the same size and intensity. In the somatosensory barrel cortex
the sample volume was layer 5A and in the visual cortex it was
layer 5 (Groh et al., 2010). The distribution of cells is thus only
analyzed with respect to the organization within a specific layer
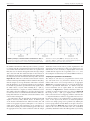
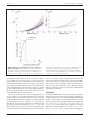
(Figure 3). Figure 4A shows the estimated K-function for all the
distributions in the experimental data set (blue lines) and all
www.frontiersin.org
April 2013 | Volume 7 | Article 5 | 4