1
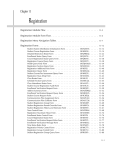
HR Data Mart User Guide
Creation Date: 10/28/11
Last Update: 9/12/12
Author: Michelle Rainey
Table of Contents
Logging On ....................................................................................................................................... 3
Data Mart Overview ........................................................................................................................................................ 7
Submissions ..................................................................................................................................... 8
Submission Statuses: ....................................................................................................................................................... 8
Other Features ........................................................................................................................................................... 10
Errors ........................................................................................................................................................................... 11
Results & Review .............................................................................................................................................................13
Validation Errors and Warnings ................................................................................................................................14
Employees ................................................................................................................................................................... 15
Positions ......................................................................................................................................................................16
Jobs .............................................................................................................................................................................. 17
Budgets ....................................................................................................................................................................... 18
Submission Schedule .......................................................................................................................................................19
Views .............................................................................................................................................. 22
Employee View ............................................................................................................................................................... 22
Choosing Your Filters ................................................................................................................................................ 22
Position View .................................................................................................................................................................. 24
Choosing Your Filters ................................................................................................................................................ 24
Reports ........................................................................................................................................... 25
Stock Reports .................................................................................................................................................................. 25
Step 1: Select Report .................................................................................................................................................. 25
Step 2. Specify Parameters ........................................................................................................................................ 25
ADHOC Reports ............................................................................................................................................................. 28
My Reports ................................................................................................................................................................. 28
Drag and Drop Functionality ......................................................................................................................................31
Datasets ...................................................................................................................................................................... 33
Data to Display- Flat .................................................................................................................................................. 35
Sorting and Aggregation (2b) (Flat Only) ................................................................................................................. 36
Data Filters ................................................................................................................................................................. 37
Results ........................................................................................................................................................................ 40
Data to Display- Pivot ................................................................................................................................................ 43
Data Filters ................................................................................................................................................................. 45
Results ........................................................................................................................................................................ 47
Custom Reports .............................................................................................................................................................. 50
Validation Reports .......................................................................................................................................................... 51
Dataset Information ...................................................................................................................................................... 56
Report Inventory............................................................................................................................................................ 58
Permissions .................................................................................................................................... 59
Data Mart FAQ ............................................................................................................................... 60
2
Logging On
To access Data Mart go to https://uncdm.northcarolina.edu/
Select Login in the right top corner of the webpage.
Select either ‘A UNC Member’ or ‘An External User’
3
Select your campus by clicking on the name of your campus
4
Enter your User ID and Password. Click Sign In.
If this is the first time you are logging in to the HR Data Mart, you will need to submit
your information to UNC General Administration and contact Keith Dupuis at
[email protected].
5
Once your account has been set up and you sign in for the first time, you will need to
complete a pop up security certification.
Once you have read the User Agreement, check the box beside of the statement:
“I accept the terms outlined in the user agreement.” Click the submit button when
complete
6
Home
Data Mart Overview
7
Submissions
Submission Statuses:
Under the Submissions tab there are three links, the first of which is Submission
Statuses.
1. Campus- Name of campus that submitted the data
2. Type- Currently, we only have an HR Data Mart (HRDM) system, but in the
future we might see versions tailored to other areas, such as Benefits or
Finance. The “TYPE” column refers to the specific type of Data Mart.
3. Period- Period of current submission
4. Due Date- Date the submission for that period is due
5. Loaded Data- Date the data was last loaded
6. Status- Current status of the submission
7. Errors/Warnings- Number of errors or warnings within the particular
submission. A red number indicates critical errors that must be resolved
prior to the monthly deadline. A blue number indicates warnings that we
recommend you review prior to the deadline, but which will not prevent an
official submission.
8. Review- Allows the user to review the submission
8
9. Action- Actions permitted by the campus. Depending on the state of the
submission or the time of the month, possible Actions might be to OPEN
NEXT (to open the next month’s data early) or CLOSE (to manually close the
monthly submission after errors have been resolved during the deadline grace
period).
9
Other Features
The Submission Statuses section allows you to sort and filter what information you wish
to view. You may select any of the columns to sort into ascending or descending order.
You may also filter what information about the submissions you wish to view. You may
do this by clicking on a column, selecting columns, and un-checking the boxes beside
the columns you do not wish to view.
10
Errors
There may be times when you will receive errors in your submission, indicated by a red number.
Simply select ‘Review’ on the line with the errors.
Review and correct your errors. Once complete, select “Reload Data.”
Note: Only select users on each campus have the ability to access this button
to reload the data.
11
Once you select “Reload Data” you will be prompted with this message:
Select ‘Yes’ to reload your data. Continue to correct and reload your data until nothing
but warnings remain for your campus’s submission.
The Campus’s ability to reload the data will be available through the third day of the
grace period after the submission date.
If you are reloading data within the three day grace period you will need to manually
close the month.
12
Results & Review
The second link under the submissions tab is “Results and Review”, which provides
details about each successful submission. Data Mart will not return results from any
campus that did not have a successful submission for that month.
Select the appropriate Campus, Type, and Period and then press
‘Get Results’.
Please note: Data Mart will list the earliest period that information became available
from any campus in the UNC system. Any attempt to pull data from a time period earlier
than your first HRDM submission will trigger a “No data was found for the filters
chosen” error message.
13
Validation Errors and Warnings
Displays a list of warnings and errors with the current submission. Please note that the
errors/warning data can be exported into an Excel spreadsheet by clicking “Export Data
to Excel”.
14
Employees
After clicking on the EMPLOYEES tab, click on one of the four tabs beneath it to access
information on:
New Employee Data
Lists all new employees compared to previous month's submission
Deleted Employee Data
Displays employees that do not show up on this file, but were on previous
month's file.
Modified Employee Data
Displays employees who have had modifications to at least one data element in his/her
record.
Tip! Hovering your mouse over a highlighted field shows previous month's
value.
All Employee Data
Displays complete details of all employees in submission.
To quickly view additional position information of a specific employee, simply click the
‘+ ‘ icon beside the number of the employee. By clicking on it, you will be able to access
deeper layers of data.
15
Positions
After clicking on the POSITIONS tab, click on one of the four tabs beneath it to access
information on:
New Position Data
Lists all new positions compared to previous month's submission
Deleted Position Data
Displays positions that do not show up on this file, but were on previous month's
file.
Modified Position Data
Displays positions that have had modifications to at least one data element in the record.
Tip! Hovering your mouse over a highlighted field shows previous month's
value.
All Position Data
Displays complete details of all positions in submission.
To quickly view additional employee information of a specific position, simply click the
‘+ ‘ icon beside the number of the employee. By clicking on it, you will be able to access
deeper layers of data.
16
Jobs
Shows all of the jobs submitted, which are grouped by employee.
Each Job is categorized as "No Change", "New", “Modified”, or "Deleted" which are computed
based on previous month's submission. For your convenience, all categories except for “No
Change” are color-coded.
Green=New
Yellow=Modified
Purple= Deleted
Use the "Hide No Change?" button in the lower right corner to see only the changes since
previous month's submission.
17
Budgets
Shows all of the budget data submitted, which are grouped by position
Each budget record is categorized by "No Change", "New", “Modified” or "Deleted"
which are computed based on previous month's submission.
Any fields that are highlighted indicate a modification from the previous submission.
Use the "Hide No Change?" button in the lower right corner to see only the changes
since previous month's submission.
18
Submission Schedule
Displays when each period opens and is due.
…
Period 1
Status
Un-opened
Open
1 day
Under Review
Pe
rio
d2
5 business
days
ue
-D
Pe
rio
d2
–O
pe
nD
Da
te
ate
-D
ue
Da
Pe
te
rio
d2
-S
tar
tD
ate
Pe
rio
d1
–E
Pe nd
ri o o f G
d
ra c
5 business
days
Pe
rio
d1
nD
Pe
rio
d1
Pe
rio
d1
–O
pe
-S
tar
t
Da
te
ate
e
Extract/ Submission Process Explanation
…
Closed
0 days – min
3 days – max
Period Start Date – The official beginning of the period. For example, if the period is
monthly, then it will most likely be the 1st of the month. However, precisely, it will be
exactly 1 day after the due date of the previous period.
Period Due Date – Defined as the last business day (as identified in the closing
schedule) of the period and marks the date at which the official snapshot for the period
will be taken. The next period will start immediately after this date has passed.
Period Open Date – The open period for campus data submissions. The period open
date is calculated as 5 business days before the end of the period.
19
Period End of Grace Period – If errors occur on the due date of submission, the
campus and GA will have 3 business days to correct the issue and take a snapshot that
can still count in the prior period.
The following diagram illustrates the possible statuses of a submission and how these statuses
are updated:
* Automatically pull data each night
* Email error/success report
* Campus manually invoke if error (when corrected)
automatically
opened by system
Un-opened
automatically
closed if no errors
Open
(5 bus. days)
Closed
(forever)
automatically
closed if no errors or
beyond 3 day window
if errors occur on
due date
Under
Review
(3 days max)
* Campus manually invokes data pull
1. Un-opened: All periods are pre-defined within the system and will remain in an
un- opened state until ready for use:
a. Auto-open: Once the day of the year is within the 5 business days halo of the
end of the period, the system will automatically open the period.
2. Open: Once opened, the system will automatically execute the following steps each
day at 7am through the period due date. Each subsequent day’s invocation of the
data pull overrides the previous day’s submission.
a. Extract campus data: The web services architecture will pull the data contained in
the 4 views enumerated above. This process will be automated and NOT require
manual campus intervention.
b. Load data: The extracted data will be processed and loaded into a temporary
table space with the data warehouse.
c. Error check: The temporarily loaded data will be evaluated against the data
definition to determine if it meets the definition.
20
d. Email status: Campus administrators will be emailed a report on a daily basis
concerning the status of the data load. Specifically, it will relay if the data load
was successful or not, and what errors, if any, it encountered.
e. Manual Invocation: If there were errors in the data load, the campus staff will
need to investigate and correct as necessary. They will be able to login to the
warehouse (using their local campus credentials via UNC’s federated identity)
and manually invoke the data submission on demand.
3. Under Review: If we did not get a “clean” data load (no errors) on the due date, then
the period will be marked as “Under Review” and will be characterized by the following:
a. Email notification: The campus administrators and the GA administrators will be
notified via email once the due date passes and a clean data load was not
encountered.
b. Manual Invocation: The automated nightly extraction process will be cancelled.
Instead, the campus administrator will need to correct the issue leading to the
errors encountered during the data load and login to the warehouse to manually
invoke the submission.
c. Manual Close: Once the campus administrator has corrected the issues and is
satisfied with the correctness of the submission, they will be able to manually
close the period via the web interface.
d. Auto Close: If the campus administrator is unable to submit a “clean” data set
within the three day grace-period, the period will be automatically closed for that
campus, and it will have to wait until the next period to submit.
4. Closed: Once closed, no period can be re-opened for subsequent submission. The
campus will have to wait for the next period to make data corrections.
21
Views
The Data Mart project relies on four Oracle views, which collects HR data in four
distinct areas: Employee Information, Position Information, Employee-Position
Information, and Budget-Position Information. You have the option to choose from
employee and position view.
Employee View
Choosing Your Filters
Search for a particular employee by name and campus or if you wish to view every
employee , simply select your campus. Once you have selected your filters, click the “Get
Employees” Icon.
Note: Only Users with cross campus access will be able to select another campus other
than their own.
“Reset Filters” button erases any filters previously selected
22
Clicking on the employee’s name on the left will show details on the right side of the
screen.
You can review an employee’s data by a certain time frame by selecting which period you
wish to view.
You can use the paging buttons at the bottom of the screen to page through search
results.
Any positions an employee may have are located at the bottom of the employee details
panel and can be clicked to see the corresponding position record.
You can export this information to a PDF file by selecting “Export To PDF”
23
Position View
Choosing Your Filters
Filters allow you to search for positions based on the Working Title, SPA Banded Class,
Campus, or Position Number.
Once you have selected your filters, click the “Get Positions” Icon
Clicking on the position listed on the left will show details on the right side of the screen.
Employees associated with this position are located at the bottom of the details record
and can be clicked to see the corresponding employee record. This particular position is
empty and therefore no employee details are displayed.
24
Reports
Stock Reports
Stock Reports are pre-created reports for which you can specify a few parameters via a
drop down menu to see the customized results.
Step 1: Select Report
Select the type of report you want to see.
Note: I’ve selected: Advancement Change By Gender EPA Report
Descriptions of all the stock reports can be found under the Report Inventory link.
Step 2. Specify Parameters
Specify the relevant filters for how the report should be constructed.
Click "Run Report" to see results
25
Other examples of possible parameters:
Hire/Separation by Gender Report
Salary Change Report
26
Results are then displayed below the filtered criteria in a flat table. From here you can:
1.
2.
3.
4.
5.
Expand all the data by selecting Expand All or ‘+’
Collapse all the data by selecting Collapse All or ‘-‘
Export the data to an excel spreadsheet, PDF, or Text File
Select the Advanced Tab to view report parameters.
Select Charts to view graphical representation of the data
Note: Changing parameters and saving the report does not affect the stock report, it creates a
‘copy’ of the report under your id.
27
ADHOC Reports
ADHOC Reports are reporting mechanisms that allow you to manipulate datasets to
perform highly customized queries.
My Reports
My Reports allows you to create and save your own customized reports
In the picture above, the arrows on the left have been clicked to expand the campus root folder
(UNC-GA) and the subsequent personal sub-directory (KEDUPUIS).
1. The icons:
a. The “ADD FOLDER” icon allows you to create new folders within your
own sub-directory.
b. The “ADD REPORT” icon allows you to create your own reports. If the
ADD REPORT button is selected while you are in your personal folders, the report
will be created within your own directory, visible only you. If you were to click the
ADD REPORT button while in your campus folder (example being “UNC-GA”
folder), the newly created report would be accessible to all other users on your
campus.
28
c. The “DELETE ITEM” icon allows you to delete reports that you have created.
You cannot delete another user’s reports. (Red X’s will not appear next to
reports created by other users)
d. To the right of the icons is the email address of the individual who
created the report.
e.This icon allows you begin creating your personal report without
diving down within the folders. Reports saved from here will be
located in your personal sub-directory.
2. This indented list is an example of private reports visible only to a particular
user. This personal sub-directory is where any personal reports you create
and save will be located. As you can see, there are 6 unique reports under the
“KEDUPUIS” directory, which is not visible to anyone except the user
KEDUPUIS.
3. The non-indented list shows examples of reports under the root directory – in
this case, UNC-GA. There are 8 shared reports currently available to all UNCGA users.
29
The Reporting frame size may be increased or decreased. Hover your mouse over the right edge
of the frame, adjacent to the scroll bar, until the mouse shows as cross hairs. Left click your
mouse and resize the Reporting frame.
The reporting frame can also be hidden by clicking the left facing double arrow icon in
the top right corner of the frame. The frame can be brought back by clicking the double
facing right arrow in the upper left section of the frame.
30
Drag and Drop Functionality
You have the ability to copy reports within your personal folders and share them through the
shared folders on your campus.
To move a personal report into a shared
folder:
Select the report you wish to share within
your personal directory by left clicking on
the report, holding the left mouse button
down, and dragging the name of the report
upwards towards the shared folder you wish
to place it into. Look for the green plus icon,
indicating it will be added, before releasing
your mouse.
Note: You will have the ability to delete that
now shared report by selecting the red X
displayed to the right of the report you
shared.
Once you are ready to begin creating your report, select Advanced
32
Datasets
Select a Dataset. Contains a list of all the datasets for which the your account
has access. You can hover over the dataset to get a longer description if desired.
BASIC BUDGET- This view contains data from ALL PERIODS for the position’s and
budget records information.
BASIC BUDGET LATEST PRD- This view contains data from the LATEST PERIOD for
the position’s and budget records information.
BASIC EMPLOYEE- This view contains data from ALL PERIODS for the employee’s
records and position information of their primary job. One record per employee per
campus per reporting period.
BASIC EMPLOYEE LATEST PRD- This view contains data from the LATEST PERIOD
for the employee’s records and position information of their primary job. One record per
employee per campus per reporting period.
BASIC POSITION- This view contains data from the position records for ALL PERIODS
BASIC POSTION LATEST PRD- This view contains data from the position records for
the LATEST PERIOD.
33
Report Type
Flat reports allow you to sort, count, total or give the average of
data using only columns and rows, without the ability to drill down
Pivot tables allow you to automatically sort, count, total or give
the average of data in one table or spreadsheet. It also allows you to
drill down into information based on specific variables. For those
with data containing a lot of information, you may find it difficult to
get summarized information. A pivot table can quickly help
summarize the data and highlight the desired information.
Report Title. Not specifically required, but helpful if you want to name a
report for future use. A title header will not print on any exported results unless
you enter a Report Title here. It will not print the name you assign a custom
report that you save in your directory or the campus directory.
34
Data to Display- Flat
If Report Type ‘Flat’ is chosen, the screen below will be displayed.
Fields Column: Contains a list of all the fields in the selected dataset.
Columns: Controls the breakdown of information and which fields you want displayed
on each row and column.
Drag and drop or click on the arrow buttons to move selected fields to the columns box.
35
Sorting and Aggregation (2b) (Flat Only)
Note that the data I selected in the previous tab is now displayed here
Sort- Whether or not it is an ascending (A-Z) or descending (Z-A) sort.
Aggregation- If you want to apply an aggregation operation to this field, otherwise
leave blank. Example: AVG over SALARY
Use for Total- If checked, the chosen aggregation will be added to any other checked field to
create a row total. Example: Base Salary + Other Salary could be added for a combined total;
or, alternately, you could leave Other Salary unchecked so that only Base Salary goes toward
the row total.
Records Per Page- Controls the size of the pagination within the web browser.
Defaults to 25 and can be extended, but will slow down processing.
Sort Order- A numeric value that controls the order of the sort. It will DEFAULT to
the order of the fields in the "2. Data to Display" tab. Therefore, you can drag/drop
the sort order on that tab as well.
Show Grand Totals- If checked, then it will sum all of the total columns for each row
into one master total row
36
Data Filters
Allows you to control/filter the subset of data used to populate the query.
Other examples of Data Filters
37
NOTE:
If you want to select multi-values from a dropdown, then you need to use the "IN"
operation instead of the "=" operator.
Select multiple values by holding down the ‘CTRL’ key and simultaneously clicking on
the values you desire.
Field Dropdown- You can select the field from the list for which you want to add a
filter criteria.
Operation- Depending on the underlying data type of the field you select, you will have
options governing what operations are valid.
Possible Operations and their meanings
= The field selected will equal the value(s) you select
!= The field selected will not be equal to the value(s)
selected
In= The field selected will be included in the value(s)
you select
NOT IN- The field selected will be excluded from the
value(s) you select.
38
Value- Depending on the underlying data type of the field, you will either manually
enter a value, select a date, or click on a list of items in a dropdown to specify the exact
details you want.
Add Filter- You can click the "Add" button to add additional criteria.
Erase Filters- You can click the eraser icon to erase any filters you have
currently selected.
39
Results
40
Export to Excel, PDF, TEXT- Generate an Excel, PFT, Text file with the
information in the report by selecting the corresponding icon.
Save: Save your report by selecting this icon
You will then be prompted to name your report which will be
saved to your personal subdirectory
Report ID: Is the number specifically associated with this report. This number
allows you to quickly generate a specific report without having to reenter the
different parameters and filters. It is also a method for sharing reports among
users.
To generate a previously processed report, enter the report id in the ‘Report ID’
field on the Reporting tab and click on the search icon. Your report will display in
the results pane.
Note: If you change the selection criteria for a report, a new report id
will be generated.
41
Pagination- You can use the arrows at the bottom of the window to scroll
through the pages of results if they exceed one page or refresh the report
42
Data to Display- Pivot
If Report Type ‘Pivot’ is chosen, the screen below will be displayed.
Fields Column: Contains a list of all the available datasets.
Definitions of fields can be found under the link ‘Dataset Information’
(See page53 for more information on the Dataset Information tab)
Drag and drop or click on the arrow buttons to move selected fields to or from the
columns and rows boxes.
Columns/Rows: Controls the breakdown of information and which fields you want
displayed on each column and row. A maximum of three columns is allowed.
*Note: Adhoc Pivot Repots need both columns and rows to work correctly*
43
Aggregation Operator & Field: Controls what operator and over which field
the aggregation will occur. If left blank, it will count the number of unique
records.
44
Data Filters
Allows you to control/filter the data used to populate the query.
NOTE: If you want to select multi-values from a dropdown, then you need to use the
"IN" operator instead of the "=" operator.
Field Dropdown- You can select the field from the list for which you want to add a
filter criteria.
Operation- Depending on the underlying data type of the field you select, you will have
options governing what operations are valid.
45
Possible Operations and their meanings
= The field selected will equal the value(s) you select
!= The field selected will not be equal to the value(s)
selected
In= The field selected will be included in the value(s)
you select
NOT IN- The field selected will be excluded from the
value(s) you select.
Value- Depending on the underlying data type of the field, you will either manually
enter a value, select a date, or click on a list of items in a dropdown to specify the exact
details you want.
Add Filter- You can click the "Add" button to add additional criteria.
Erase Filters- You can click the eraser icon to clear your filters
46
Results
If you wish to view more detailed information about the numbers that were generated by
your report, simply select the blue number under the category you wish to learn more
about.
Export to Excel- Generate an Excel file with the information in the report.
Export to PDF- Generate a PDF file with the information in the report.
Export to TXT- Generate a text file with the information in the report.
Report ID: Is the number specifically associated with this report. This number
allows you to quickly generate a specific report without having to reenter the
different parameters and filters.
This number will change if you go back and alter the report in any way.
47
Drill Down (pivot)- If you have added more than 1 row in a pivot table, then
you can click the "+" sign beside each row to expand the next level of data.
Pagination- You can use the arrows at the bottom of the window to scroll
through the results if they exceed one page.
You can enter a Report ID here to generate a report used previously
48
Charts
Provides a graphical representation of data in either a Bar or Pie Chart.
Note: Although it is possible to generate charts from flat files, they are mainly derived from
Pivot Tables.
Bar Graphs
-
Only allow one column
Only the first level of rows will be used.
Multiple aggregations will not display.
Pie Charts
- Only allow one column
- Only the first level of rows will be used.
These will become the legend
- The percentages will be based off of the total number
- The use of filters is vital in order to create relevant pie charts.
It is important to know that if a report does not contain the values necessary to
create a readable bar graph or pie chart, the tab displaying Charts will not be
available.
49
Custom Reports
The custom report link on the Reports tab is a new reporting interface for special,
standardized reports that require programing to achieve. For example, our first custom
report is a staffing report requested by OSP that has OAC categories broken down by
race, ethnicity and gender categories that is designed to match the exact format of an
existing report in Beacon.
50
Validation Reports
Validation reports help you get a quick overview of key data elements, so you can
spot issues that might not trigger as actual ERRORS, but still indicate a possible
issue with data integrity.
Step 1: Select Report- User can select one of the stock reports
Step 2: Specify Parameters
Step 3: Click “Run Report”
51
A quick review of the report is usually enough to determine if there are obvious errors with the
data. (For instance, if you are reporting null values; or if you are reporting no new hires in a
month where you know a new hire was made).
You also have the option to look deeper into the data. Clicking on the numbers in
blue will allow you to investigate any of the generated numbers.
Selecting “Advanced” allows you to reconfigure or filter the data further, just as
you could in the previous tabs.
52
Selecting “Data to Display” allows you to see the way the table is set up
Selecting “Data Filters” allows you to view the filters applied.
53
Selecting “Results” will bring you back to the original results generated.
Selecting “Charts” allows you to view a graphical representation of the data
54
You can hover your mouse over the different parts of the chart to receive more
information.
55
Dataset Information
Provides detailed definitions about all of the collected data elements and derived fields
for each dataset within HR Data Mart.
Use the tabs on the left to navigate the dataset for each main View:
Basic (budget/employee/position): Takes all available periods into consideration
Basic Latest (budget/employee/position): Takes only the latest successfully-closed
period into consideration.
This table outlines the current submission status for each campus in question for each
month.
You have the option to view the Data Mart User Guide by selecting this icon
56
The Dataset Information is arranged into a table
Field Name: Displays the field name
Definition: Provides a description of the field
Type: Displays the format of the information the field is looking for (for some
fields, this is a live link that can be clicked on)
Example Data: Provides an example of what the data would look like for that
particular field
Notes: Displays any notes that pertain to that particular field
57
Report Inventory
Lists every stock report along with its related data elements
58
Permissions
Displays the permissions granted to each user of your campus. During the first phases of
the Data Mart project, UNC-GA will establish admin privileges for campuses. At some
point, we expect to turn the admin privileges over to campuses along with
recommendations for access protocol.
Permissions:
Can View Results: User is allowed to view data and create reports within HRDM
Can Upload Data: User is allowed to Upload/ Reload Data for the campus for campus
submission
Gets Emails: Receives emails from HRDM
Can Grant Access: Can grant other users on the campus access to HRDM (currently
disabled for campuses)
59
Data Mart FAQ
To view the most up to date FAQ click the link below:
http://collab.northcarolina.edu/public/index.php/projects/288/files/17162
Background
1. What was the impetus to develop the HR Data Mart (“Data Mart”)?
2. Who designed the Data Mart?
Procedural Issues
3.
4.
5.
6.
7.
8.
How much time will we have to fix errors before each month’s Data Mart “snapshot”?
What is the difference between a Warning and an Error?
Does Data Mart coordinate with existing payroll cycles?
Will the Data Mart replace the Personnel Data Files (PDF)?
Will the Data Mart still be a relevant project if S575 passes?
Who are the Project Managers on each campus?
Security Issues
9. Why are we using social security numbers and birth dates?
10. What measures has the General Administration taken to protect the information
supplied to Data Mart, specifically the Social Security Number of each employee?
11. What data elements can individual users access?
12. How do we handle locked Job Records in Banner?
Data Element Issues
13. Will the Data Mart accept alpha-numeric data types in place of numeric data types?
14. What is Effective Date on a position?
15. What is our system recognizes more than the required 5 termination codes?
16. Does the Data Mart “Veteran Status” comply with Federal guidelines?
17. What if we have EPA or miscellaneous employees not in positions?
18. Is a primary position required?
19. Should ‘funding source” be attached to a job or position?
20. Is the Data Mart tracking position vacancies?
21. Is highest education level required?
22. Will we lose access to historical PMIS data?
23. Can we export Data Mart data into an Excel chart?
24. Who can I contact with further questions?
25. What do we do about employees moving from SPA to EPA or TEMP status?
26. What do we do about non-resident aliens that we assign a temporary SSN placeholder?
27. Is Data Mart looking for the county the employee is working in or where the job is based?
28. What do we do with employees who are in between job assignments and hence are not
active, on leave, or terminated? Can their status be NULL?
29. Are employees who are terminated but still due leave payout still considered active?
30. What value should we use for Last Day Worked?
31. Should we be entering pooled positions?
32. What are the differences between Appropriation, Receipts, and Other funding types in the HR
Data Mart and how do I determine each?
60
33. Do we need to include positions that exist only as a way to categorize salary reserves?
34. For rehires, do we use their original hire date or their rehire date for the “Initial Hire Date” data
element?
35. We’re seeing NCAS budget codes showing up on error reports. Is there a list of codes that are
acceptable?
36. For employees with multiple jobs, are we only required to use the salary of the primary job to
calculate annual base salary?
Code Issues (WCU CODE)
37. What is GORIROL and how does it play into the Data Mart?
38. Why use GTVSDAX for crosswalked data instead of hard coding things within the Data Mart
scripts?
39. In what order do we apply the scripts and views to aid in creating the process?
Post-Production Questions
40. We were told that we weren’t reporting our Faculty. What does that mean?
41. Is Appointment Type a required field?
42. What happens after a successful submission?
43. Can we look at our monthly data before the last 5 days of the month?
44. Does opening data early affect our 5-day window?
45. What info is OSP looking at?
46. Can we extract data from views into Excel
47. We’ve had warning issues regarding an employee’s FTE being more than the FTE of a
position.
48. What happens if our grace period spills over into the following month? Won’t our
snapshot include data from that new month?
49. Do we have a glossary of terms or data elements?
50. Will temporary workers trigger an error report?
51. What do we do if we have an error for a valid CUPA code?
52. What are the most common errors with JCAT codes?
53. Do we have the ability to add campus users ourselves?
54. Can you save or re-run ad hoc reports?
55. Why am I getting an error on a NULL value for a data element that accepts NULL
values?
56. When will we need to provide disability and education level data elements?
57. What are validation reports?
58. What should we do if our validation reports indicate we have no SPA time-limited
employees?
59. How do we request additional Data Mart users?
60. Can we request a GA Override on an error we can’t solve?
61. When does the 3-day grace period start?
62. How do we close out our monthly submission during the grace period?
61
1. What was the impetus to develop the HR Data Mart?
In June 2009, a University-Wide HR Reporting Task Force was formed. This committee was
charged with developing a proposal for the University reporting of required statewide HR
information, to replace PMIS. Pursuant to this effort, campuses were asked to recommend
changes that would make existing policies and practices more efficient and effective. The
resulting inquiry revealed that duplicate data entry into the PMIS was identified as an area
that strongly required efficiency review. In April 2010 a proposal was presented to the Office
of State Personnel for UNC General Administration to present consolidated reporting of HR
data on behalf of all campuses by providing regular snapshots of SPA personnel data.
2. Who designed the Data Mart?
The HR Data Mart was designed and vetted by a steering committee composed of UNCGA,
OSP, OSBM and campus representation. This group collectively defined the following
objectives:
Eliminate the need to enter duplicate data into PMIS
Provide consistent, timely and accurate HR information to campuses, GA, OSP, OSBM
and the General Assembly
Increase our ability to catch and correct inaccurate HR data as it is recorded (and
consequently prevent the costly and exhaustive revisions that result from a single, yearly
snapshot)
3. How much time will we have to fix errors before each month’s Data Mart
“snapshot?”
Campuses will be able to use a web-based application to test their data during a 5 day
window before the monthly snapshot is taken on the last business day of the month. That
snapshot
may generate Error or Warning reports. In the absence of any Errors, the snapshot will be
closed for the month. If there are Errors, they must be resolved within a 3 business day grace
period, at the end of which the Snapshot closes for the month.
4. What is the difference between a Warning and an Error?
The Error Report flags data issues that must be fixed prior to the monthly snapshot being
finalized. Examples of Errors include missing required fields or incorrect data formats.
Warnings are potential data issues that the campus may want to review prior to the monthly
snapshot, but will not prevent the monthly snapshot from being finalized. Campuses are
more than welcome to request the inclusion of Warnings that benefit their own data process.
5. Is Data Mart being coordinated with existing payroll cycles?
No. We suggest that you pull monthly Data Mart information after payroll is submitted, but
the exact timing within the established timeframes is a campus decision.
6. Will Data Mart replace the Personnel Data File (PDF)?
This has not been determined, but it is one of the long-term goals for Data Mart.
62
7. Will Data Mart still be a relevant project if S575 passes?
Data Mart will become even more relevant if the BOG is given personnel authority. Reports
that the OSP are currently required to prepare for the General Assembly will then be
required of the BOG. The BOG must have a system in place to collect and present this data.
8. Who are the Project Managers on each campus?
Appalachian State University
East Carolina University
Elizabeth City State University
Fayetteville State University,
North Carolina A&T University,
North Carolina Central University
North Carolina State University
University of North Carolina at Asheville
UNC at Chapel Hill
University of North Carolina at Charlotte
University of North Carolina at Greensboro
Richard Shook
Rhonda Updyke Gavin
Tanisha Brumsley
James Campbell
Maurice Warren
John N Smith
Brian Simet
Lisa Honeycutt
Dave Turner/Rich Arnold
Jared Waugh
Joella Anderson
University of North Carolina at Pembroke
University of North Carolina at Wilmington,
University of North Carolina School of the Arts,
Western Carolina University
Winston-Salem State University
UNC - General Administration
George Guthrie
Andrea Powell
Susan Porter
Diana Catley
Janine McDuffie
Keith Dupuis
9. Why are we using social security numbers and birth dates?
PMIS currently tracks social security numbers and birthdates; this is not a new data
element. OSP uses this information to track the movement of employees, since campus PID
numbers have no consistent value across different state agencies and campuses.
10. What measures has General Administration taken to protect the
information supplied to the Data Mart, specifically the Social Security
Number of each employee?
General Administration takes securing the information in the Data Mart extremely
seriously. While we do not want to divulge specific details that could assist a hacker trying to
penetrate our defenses, we can say that the following general steps are taken to protect this
information:
Encrypted Transmission - The web services architecture uses public key
infrastructure to encrypt the data 3 times between the campus and General
Administration. This triple encryption ensures authenticity of the following: 1) when GA
requests the data from the campus and 2) when the campus responds with the actual
data feed. In short, each campus is assured that it is GA making the request and that
only GA can read its response.
63
De-identification - As soon as General Administration receives the SSN, we
immediately de-identify the data by separating the SSN from the remainder of the
biographical information and replacing it with a meaningless identifier. The full SSN
will never be displayed to the user via the web interface and will never be used to find
employees in the system. Only the last 4 digits of the SSN is visible to authorized users
of the system.
Encrypted Storage - Once the SSN has been stripped from the employees record, it is
encrypted twice and stored in a vault that can only be accessed by a limited set of
database administrators. Access to this vault is logged and monitored.
11. What data elements can individual users access?
Security permissions are being established for both the standard reports (which are based on
reports currently available to the OSP and OBM), as well as individual data elements that
can be compiled into ad hoc reports. As an added security measure, all users will be required
to read and sign a user agreement that is currently being developed by GA Legal.
12. How do we handle locked Job Records in Banner?
While we understand that Job Records in Banner are locked during the active payroll cycle,
which at times could delay any changes to that Job Record, we believe the windows of time
given in the monthly submission process will prevent any significant problems. If it becomes
a recurring issue on campuses, we will absolutely reconsider the process deadlines.
13. What if Data Mart requires a numeric entry and our data field is alphanumeric?
That won’t be a problem; our IT folk can edit those requirements as necessary. Once
identified, please pass along any specific instances to Steven Hopper, Director, GA Online
Services ([email protected]).
14. What is Effective Date on Position?
In Banner, use Last Activity Date.
15. What if our system recognizes more than 5 termination codes?
We will provide a translation table. We understand that several data elements may require
translation tables during the initial stages of the program. Unfortunately, this is a necessary
effort in order to achieve standardized values that make sense across all campuses.
16. Does the Data Mart “Veteran Status” comply with Federal guidelines?
The Data Mart values are compliant with current VETS 100 and 100a reporting.
64
17. What if we have EPA or miscellaneous employees not in positions?
All EPA employees must be in positions; it’s a requirement of the PDF process.
Miscellaneous employees that are currently not in designated positions will be handled
during Phase 3.
18. Is a “Primary Position” required?
All employees must have a primary position.
19. Should “Funding Source” be attached to job or position?
For phase 1, we will only be attaching funding sources to positions. Based on campus
feedback, we are currently readdressing this question for future phases
20.
Is Data Mart tracking position vacancies?
Data Mart will not replace the current campus vacancy reporting process. The closest data
elements that Data Mart tracks with regards to potential vacancies are positions that are
active, frozen or eliminated.
21. Is Highest Education level required?
The state does track Highest Education level. However, we understand that it’s not being
tracked consistently across campuses. As mentioned above, once we review the campus error
reports, we’ll re-evaluate its inclusion in Phase 1.
22. Will we lose access to historical PMIS data?
Historical PMIS Data through 12/31/2011 is available in BEACON BI. In late 2011, each
campus designated between two and three super-trainers who learned how to access this
historical data. Please contact your Data Mart PMO or Keith Dupuis
([email protected]) with any questions about your campus super-trainers.
23. Can we export Data Mart data into an Excel chart?
Yes. Data Mart will include two main reporting tools: standard reports, and ad hoc reports.
In addition to campus-specific information, Data Mart will—in planned enhancements—also
provide aggregate-level data from across all campuses (for instance, the prevalence of a
specific JCAT code across all campuses.)
24.Who can I contact with further questions?
You can contact Gwen Canady (Project Management Officer, [email protected])
or Ann Lemmon (Associate VP for HR, [email protected]) with general
questions, or Steven Hopper (Director of Online Services, [email protected]) with
technical questions.
65
25. What do we do about employees moving from SPA to EPA or TEMP status?
The current procedure involves terminating the employee and rehiring them under a new
Employee Type. There is a possibility for confusion when the snapshot is taken between
those two transactions. (IE, employees could show as terminated one month and as a new
hire the next.) We do not expect this to be a common occurrence, however, and can handle it
as the situation arises.
26.What do we do about non-resident aliens that we assign a temporary SSN
placeholder?
We’ve based our policy on current IRS rules (http://www.ssa.gov/employer/hiring.htm),
which allows employers to use 000-00-0000 as a placeholder SSN until a unique identifier
is issued. Data Mart will not flag this as an error unless the all-zero placeholder appears for
more than two consecutive snapshots.
27. Is Data Mart looking for the county that the employee is working in, or the
county where the job is based?
Data Mart is looking for the North Carolina county of the site where the employee does their
principle work. Telework positions should report the county where their home department is
located, not the county where the work is being done. In cases where that information is not
maintained in Banner, you can code the data element to default to the campus county, with
the understanding that corrections will be made prior to Data Mart’s Phase 2 in late 2011.
28.What do we do with employees who are in between job assignments and
hence are not active, on leave, or terminated? Can their status be NULL?
Permanent employees must be either Active, On Leave, or Terminated.
29.Are employees who are terminated but are still due a leave payout still
considered "active"?
No.
30.
What value should we use for Last Day Worked?
Based on campus feedback, we will be updating this data element. You should use the last
date an employee is paid their standard salary (not including severance or benefit
continuation).
31. Should we be entering pooled positions?
Yes.
66
32. What are the differences between Appropriation, Receipts, and Other
funding types in the HR Data Mart and how do I determine each?
For the purposes of the HR Data Mart we have established the following definitions for each
category.
Appropriation – Any payment from the General Fund except payments from fully
receipt supported purposes within the General Fund.
Receipts – Any payment from a fully receipt supported purpose within the General
Fund. Generally this will only apply to payments funded from Purpose 1102 – Summer
Term Instruction and Purpose 1103 – Non-Credit and Receipts-Supported Instruction.
Other – Any payment not from the General Fund.
33. Do we need to include positions that exist only as a way to categorize
salary reserves?
If you have positions that were established solely for the purpose of salary reserves or
premium pay (or other similar conventions used to simplify the accounting process in
Banner), you do not need to include them. Please note that these are separate from pooled
positions, which must be included.
34. For rehires, do we use their original hire date or their rehire date for the
“Initial Hire Date” data element?
Use their rehire date.
35. We’re seeing NCAS budget codes showing up on error reports. Is there a
list of codes that are acceptable?
Yes, and it’s been posted on the Collab Site. We only recently began working from a standard
set of NCAS budget codes, which explains why some campuses are seeing new errors. Please
review the list of acceptable NCAS budget codes and either crosswalk your campus-specific
codes to the campus-wide codes, or contact us with a justification for adding new codes to
our list.
36. For employees with multiple jobs, are we only required to use the salary of
the primary job to calculate annual base salary?
No; any jobs that form a piece of the employee’s overall FTE must be figured into annual
base salary. Please note that this does not include supplemental pay, such as pay for
increased course load.
37. What is GORIROL and how does it play into the Data Mart?
GORIROL is a baseline Banner Identity Role process that works with GORRSQL to interpret
Banner Data and associates a role with the ID. For example, once a person is associated with
PEAEMPL they are identified in Banner as an Employee; once in SGASTDN, they are
identified as a Student; once in APACONS, they are identified as an Alumni, etc. More
67
information on the GORIROL process can be found in the Banner Bookshelf / Banner
General Technical Reference Manual / Chapters 7 and 11 reference this process.
38.Why use GTVSDAX for crosswalked data instead of hard coding things
within the Data Mart scripts?
GTVSDAX allows a user maintainable reference for the Data Mart mapping and data
extraction process that allows for future growth to the Standard Model Rules and
Validations. These initial crosswalk values identify Employee Classes used solely for Data
Mart processing (thereby eliminating non-reportable classifications), retirement
information pertinent to employee participation and enrollment types, termination and job
change reason codes {UNCHRDM_ECLS, UNCHRDM_RET, UNCHRDM_JCRE,
UNCHRDM_TREA}.
39. In what order do we apply the scripts and views to aid in creating the
process?
The readme.txt file (posted on active collab as “README.TXT-FAQ Question 50” explains
the steps to creating the Data Mart Schema and applying the scripts as needed for the
process to be successful (attached below for easy reference).
40.
We were told that we weren’t reporting our Faculty. What does that
mean?
We found that while EPA workers were being reported, some campuses were submitting a
null value for the data element titled “EPA Faculty v Non-Faculty.” EPA workers are not able
to submit a null value in that category without triggering an error check.
41. Is Appointment Type a required field?
Starting in October, it will be a required field, which may be an issue for some of our earlier
campuses. The Appointment Type data element provided information on SPA and EPA
workers, such as whether they are permanent, time-limited, or temporary (for SPA), or
continuing, fixed-term, temporary or grad students (for EPA).
42.What happens after a successful submission?
The monthly submission is scheduled for the last business day of each month, though our
schedule does take into account holidays. The complete schedule can be found on the
“Submission Schedule” link on the Submissions page. Five (5) business days before the
deadline, the system will automatically pull your data and send an email to designated users
with results. You have those 5 days to review and fix critical errors; and each morning, the
data will be freshly pulled. On day 5, if there are no problems, the monthly snapshot will be
taken. If there are still critical errors, you will get a three (3) business day grace period to fix
the errors and then manually close the snapshot for the month.
68
43. Can we look at our monthly data before the last 5 days of the month?
Yes, on the Submissions Statuses page, you’ll have the option to “OPEN NEXT” once you
officially close the prior month’s data.
44.Does opening data early affect our 5-day window?
No, it just gives you access to the data early. You can hit the reload button as often as you
want during that time frame.
45. What info is OSP looking at?
OSP will have access to all types of information that they currently have access to through
PMIS.
46.Can we extract data from views into Excel
Not in the Views, but you can export standard and ad hoc reports to Excel -- so you could
always take basic employee View data and put into a flat report. If there’s a need from
campuses to create an export from Views, we’ll examine it. Right now, you should also be
able to get Views data from your IT department.
47. We’ve had warning issues regarding an employee’s FTE being more than
the FTE of a position.
We’re going to change the warning logic of that, so that it only applies to permanent instead
of time limited and temp positions. We’ll also revisit this during the phase when we start
including temporaries. Please keep in mind that warnings will not prevent a successful data
submission, either.
48.
What happens if our grace period spills over into the following
month? Won’t our snapshot include data from that new month?
We don’t expect that to be a problem. Ultimately, the Data Mart system is just meant to
provide a general snapshot in time.
49.Do we have a glossary of terms and data elements?
Yes; there is a DATASET link on the REPORTS tab that will give you a list of all data
elements (and their definition and variables) for the employee, position and budget views.
50.Will temporary workers trigger an error report?
Yes; if you have workers who are coded as temporaries under appointment type, it will cause
an error. All non-permanent workers should be pulled from the Data Mart submission. We
will be addressing their addition during the next phase of Data Mart.
51. What do we do if we have an error for a valid CUPA code?
Please contact Keith Dupuis, who will research the CUPA code and update the Data Mart
validation table as necessary.
69
52. What are the most common errors with JCAT codes?
The 6-digit JCAT code is composed of three parts: a 3-digit JCAT code, a 1-digit special
descriptor, and a 2-digit subcategory code. The general default for the special descriptor, if
no other code applies, is currently “X”. We see a lot of problems when campuses submit
JCAT codes that are not 6-digits, or use “0” (zero) as the special descriptor default, which is
not a valid option. A NULL value is acceptable for positions that have no corresponding
JCAT number. As we approach Phase II of the Data Mart project, we expect to adapt the
JCAT structure so that it is more in line with the traditional PDF requirements, based on
feedback from campuses. We’ll update you on that change as it develops.
53. Do we have the ability to add campus users ourselves?
For the moment, GA is processing admin privileges for all university users. We expect to
hand that role over to campuses within the next several months, along with some
suggestions for campus access protocols.
54. Can you save or re-run ad hoc reports?
Yes, ad hoc reports can be reproduced if you make a note of the REPORT ID (which prints
on every report you download as an Excel spreadsheet as well as on the reporting tab itself
after a table is generated). You can also create and name custom reports that can be saved in
either a personal directory or a shared campus-wide directory. Please see the user manual
for instructions.
55. Why am I getting an error on a NULL value for a data element that accepts
NULL values?
Most often, we find that the data isn’t being submitted as a true null value (ie, the complete
absence of any data, even a space key).
56. When will we need to provide disability and education level data elements?
GA gave campuses an extended period of time to collect this information given that most
campuses did not routinely track it in Banner. We expect that all campuses will have
supplied information for these data elements by the end of the calendar year. Following that,
missing data elements will trigger error reports.
57. What are validation reports?
Validation reports, accessed under the Reports tab, indicate potential data integrity issues.
GA routinely reviews them to identify potential errors that, while not causing an Error,
suggest a need for deeper review. For example, we may find a campus is reporting no SPA
time-limited positions, no terminated employees, and no work counties other than the
county of the main campus. That information should prompt you to ask the obvious
questions: do we have any SPA time-limited positions, and if we do, why aren’t they being
recorded? Did we have any terms this month? Do we have any business units based off the
main campus?
70
58. What should we do if our validation reports indicate we have no SPA timelimited employees?
An SPA time-limited employee is comparable to an EPA fixed-term employee. Not every
campus will necessarily have time-limited employees. We suggest you review areas that
focus on research, especially research projects run by funds with an end date.
59. How do we request additional Data Mart users?
For each person you want to have access, ask them to login to the Data Mart
production site (https://uncdm.northcarolina.edu/index.htm) using
his/her credentials. This will create the basic account in our system. They will not be
able to see anything at this point, which is normal.
Once everybody has logged in, please contact Keith Dupuis and supply the name and
access level (essentially whether the employee can VIEW DATA and/or RELOAD
DATA. We suggest you limit the amount of people who can RELOAD DATA.)
We will add the necessary permissions as you specify and notify you once it is
complete.
You will then be able to login to see the submission tab.
60.
Can we request a GA Override on an error we can’t solve?
The GA override button was designed to excuse errors that we know can’t be solved given a
set of justified, extenuating circumstances. If you feel an override is warranted, please
contact Keith Dupuis and Steven Hopper with your justification
61. When does the 3-day grace period start?
If you have any errors on the day that your monthly submission is scheduled (see the
submission schedule on the Data Mart submissions tab), you will enter a 3-day grace period
beginning that morning. For instance, if the monthly submission is scheduled Monday, you
will have until start of business Thursday to manually correct and close your monthly
submission. Please note that automatic submission generally occur in the early hours of
morning, shortly after midnight.
62.How do we close out our monthly submission during the grace period?
Once you reach zero errors, the Data Mart submission status page will show a “CLOSE” link
in the column labeled “Actions.” Click on it. The available action should change from
“CLOSE” to “OPEN NEXT”.
71