1
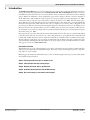
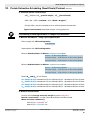
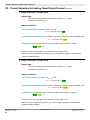
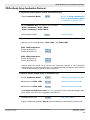
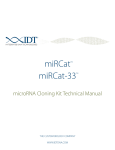
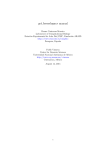
User Manual
Antibody Microarrays 380 &
500 User Manual
United States/Canada
800.662.2566
Asia Pacific
+1.650.919.7300
Europe
+33.(0)1.3904.6880
Japan
+81.(0)77.543.6116
Clontech Laboratories, Inc.
A Takara Bio Company
1290 Terra Bella Ave.
Mountain View, CA 94043
Technical Support (US)
E-mail: [email protected]
www.clontech.com
Cat. Nos. 631790
631795
631786
631796
631797
631798
PT3648-1(PR123821)
Published February 2011
Antibody Microarrays 380 & 500 User Manual
Table of Contents
I. Introduction.............................................................................................................................. 3
II. Protocol Overview & Troubleshooting Guide........................................................................ 4
III. List of Components................................................................................................................. 6
IV. Additional Materials & Equipment Required......................................................................... 8
V. Important Pre-Protocol Considerations................................................................................. 9
VI. Protein Extraction & Labeling (Large-Scale) Protocol........................................................ 10
A. Extracting Protein from Crude Tissue ..................................................................................... 10
B. Extracting Protein from Cultured Cells .................................................................................. 11
C. Preparing Protein from Body Fluids..................................................................................................... 12
D. Labeling Protein with Fluorescent Dye................................................................................................ 13
E. Removing Unbound Dye using PD-10 Desalting Columns.................................................................. 14
F. Determining Protein Concentration ......................................................................................... 16
G. Estimating the Average Number of Coupled Dye Molecules ........................................... 17
VII.Protein Extraction & Labeling (Small-Scale) Protocol........................................................ 19
A. Extracting Protein from Crude Tissue ..................................................................................... 19
B. Extracting Protein from Cultured Cells .................................................................................. 20
C. Labeling Protein with Fluorescent Dye................................................................................................. 21
D. Removing Unbound Dye using Protein Desalting Spin Columns........................................................ 22
E. Determining Protein Concentration ........................................................................................ 24
F. Estimating the Average Number of Coupled Dye Molecules ............................................. 25
VIII.Antibody Array Incubation Protocol..................................................................................... 27
IX. Analysis of Results................................................................................................................. 31
X. References.............................................................................................................................. 34
List of Figures
Figure 1A. The Ab Microarray procedure (Steps 1–3). . . ....................................................................................4
Figure 1B. The Ab Microarray procedure (Steps 4, 5)..........................................................................................5
Figure 2. The Ab Microarray Analysis Workbook contains four worksheets.......................................................32
Figure 3. The “Import & Analyses” worksheet has three sections: Import, Analyses, and Sorting......................32
Figure 4. The “Sorting” section of the “Import & Analyses” worksheet.............................................................33
List of Tables
Table I. Comparison of protein extraction & labeling methods...........................................................................9
Customer Service/Ordering
Technical Support
tel: 800.662.2566 (toll-free)
tel: 800.662.2566 (toll-free)
fax: 800.424.1350 (toll-free)
fax: 650.424.1064
web: www.clontech.com
e-mail: [email protected]
e-mail: [email protected]
Protocol No. PT3648-1
www. clontech.com
Version No. PR123821
2
Clontech Laboratories, Inc.
A Takara Bio Company
Antibody Microarrays 380 & 500 User Manual
I. Introduction
The Ab Microarray 500 enables you to detect a wide variety of proteins (both cytosolic and membrane bound) representing a broad range of biological functions. The Ab Microarray 380 - Disease Profiling Array enables you to detect
many different proteins that are known to be associated with a variety of conditions such as cancer, metastasis, multiple
sclerosis, Parkinson’s, Alzheimer’s, obesity, transplanted organ rejection, digestive disorders, and more. Examples of
the Ab Microarray's utility include the study of expression of apoptosis regulatory proteins (Yamagiwa et al., 2004),
as well as the study of expression of proteins relevant to diabetes (Gosmanov et al., 2004). This array allows you to
detect differences in protein abundance between two individual samples—cells, whole tissue, or biological fluids. The
fluorescence-based procedure, which takes less than a day to complete, lets you detect as little as 20 pg/ml of each
protein target. A dual-color detection method is uniquely designed so that inherent variations in dye labeling do not
affect the outcome of the experiment Thus, you can be confident that your side-by-side comparisons reflect the relative abundances of proteins in the sample. Follow-up studies with Western blotting and in situ hybridization support
these claims (Song et al., 2002).
Our proprietary process ensures that antibodies remain functionally active even after they are covalently immobilized
to the glass surface. The arrays are printed on 75 x 25 x 1 mm glass slides, an open platform that is compatible with
commercially available microarray scanners. All arrayed antibodies are carefully tested for specificity and sensitivity.
Those that display a high degree of cross reactivity are eliminated from the final product. For a complete list of the
arrayed antibodies, including Swiss-Prot ID numbers of the target antigens, please visit the Bioinformatics or Online
Tools page of our web site at www.clontech.com.
Procedural Overview
The Ab Microarray protocol, outlined in Figures 1A & 1B, is a fluorescence-based procedure in which solid-phase
antibody is used to capture fluorescently-labeled antigen. The entire procedure, from sample preparation to array scanning, takes one day to complete.
Measuring protein abundances with Ab Microarrays consists of the following five main steps (see Section II for details
and troubleshooting information):
Step 1. Extract protein from cells or whole tissue
Step 2. Label protein with Cy5 and Cy3 dyes
Step 3. Remove unbound dye by gel filtration
Step 4. Incubate labeled protein with Ab Microarrays
Step 5. Scan microarrays to measure bound antigen
Clontech Laboratories, Inc. www. clontech.com
A Takara Bio Company
Protocol No. PT3648-1
Version No. PR123821
3
Antibody Microarrays 380 & 500 User Manual
II. Protocol Overview & Troubleshooting Guide
Harvesting & Storage of Sample:
After collecting the pellet in a tube,
wash pellet 3X with PBS. Remove
the last wash. Spin and remove the
additional PBS. Measure the pellet
size and record it on the tube or in
a lab notebook. Freeze the pellet
immediately.
Sample Preparation
Sample A
Cell pellet or crude tissue
a. Freeze/thaw
b. Add Extraction/Labeling Buffer
c. Incubate for 10 min
d. Centrifuge
e. Collect supernatant
Protein Concentration:
If the protein concentration is less
than 1.1 mg/ml, DO NOT proceed
to the next step.
(monfunctional NHS-ester)
Trial Labeling:
Before proceeding with
the array experiment,
perform a labeling
reaction on a test sample.
Use any available cell line.
If the substitution degree
is higher than 4, dilute
fresh Cy dyes with a
larger volume of the
Extraction/Labeling Buffer.
Step 1
Protein extraction
(1–2 hr)
Complex solution of total
cellular protein
a. Measure protein concentration
b. Dilute each sample to 1.1 mg/ml
c. Split and combine with dye
Cy3 Fluorescent Dye
Extraction/Labeling
Buffer
Sample B
110 µl
470 µl
470 µl
470 µl
Cy5 Fluorescent Dye
(monfunctional NHS-ester)
470 µl
110 µl
Extraction/Labeling
Buffer
Step 2
Protein labeling
(2–3 hr)
A-Cy3
A-Cy5
30 µl
Measure the Substitution Degree.
If it is higher than 4, then relabel with
diluted amounts of Cy dye. Since the
final labeling reaction volume must
remain the same, it is necessary to
dilute fresh Cy dyes with larger volumes
of the Extraction/Labeling Buffer and to
add the same 50 µl volume of diluted
dye per labeling reaction.
30 µl
30 µl
a. Incubate at 4ºC for 90 min
b. Add Blocking Buffer
c. Incubate at 4ºC for 30 min
d. Remove unbound dye with desalting columns
A-Cy3
A-Cy5
Small-Scale Labeling (User Manual):
Final labeled protein concentration
should be ~0.8–0.9 mg/ml (using Protein
Desalting Spin Columns).
If the above concentrations are not
obtained, DO NOT proceed to the
next step.
B-Cy5
30 µl
You must obtain a
substitution degree
between 1 and 4 in order
to proceed.
Large-Scale Labeling (shown):
Final labeled protein concentration
should be ~0.2 mg/ml (using PD-10
columns for desalting).
B-Cy3
100 µg
B-Cy3
B-Cy5
Step 3
Removing
unbound dye
(1 hr)
100 µg
Mix 1 (A-Cy5 + B-Cy3)
100 µg protein
100 µg protein
Mix 2 (A-Cy3 + B-Cy5)
Ab Microarray Incubation
Figure 1A. The Ab Microarray procedure (Steps 1–3). The volumes and quantities given in Steps 1 and 2 correspond to those needed for
the Large-Scale Protein Extraction & Labeling procedure. Steps 4 & 5 are shown in Figure 1B.
Protocol No. PT3648-1
www. clontech.com
Version No. PR123821
4
Clontech Laboratories, Inc.
A Takara Bio Company
Antibody Microarrays 380 & 500 User Manual
II.
Protocol Overview & Troubleshooting Guide continued
Ab Microarray Incubation
Mix 1
Mix 2
20 µg protein
20 µg protein
5 ml Incubation Buffer
Recommended Sample Amounts:
Use 20 µg of protein per slide
(10 µg of Cy3-labeled protein and
10 µg of Cy5-labeled protein).
Larger amounts of protein will
saturate the antibodies and
relevant results will not be
obtained.
For serum samples, use
100 µg of protein, since a large
percentage (~80%) of the protein
consists of immunoglobin and
albumin.
Incubation Tray
Wash
Incubation
Slide 1 Chambers
Wash
Incubation
Step 4
Microarray incubation
(1.5 hr)
Slide 2 Chambers
a. Incubate tray at room temperature for 10 min and
wash microarray slides in the provided storage vial
to remove storage buffer as described in User Manual.
b. Place microarray slides array-side-up in the incubation
chambers using forceps or gloved hands.
567xcv4
567xcv4
Incubation Tray
Incubation
Wash
Slide 1 Chambers
Incubation
Wash
Slide 2 Chambers
Incubate at room temperature for 40 min
with constant rocking motion.
Drying & Scanning Slides:
When drying slides, place the slides
in the vial with the array end up.
Do not touch the array surface at
any time.
Transfer slides to their respective
wash chambers and begin washing.
Dry slides by centrifugation.
Slides should be scanned within
24 hr after drying. Slide pairs
should be scanned using the same
scanner settings.
Scan
Step 5
Scanning microarrays
(~30 min)
Figure 1B. The Ab Microarray procedure (Steps 4, 5).
Clontech Laboratories, Inc. www. clontech.com
A Takara Bio Company
Protocol No. PT3648-1
Version No. PR123821
5
Antibody Microarrays 380 & 500 User Manual
III. List of Components
Store Ab Microarray Slides at –20°C.
Store all other components at 4°C.
Ab Microarray Express Buffer Kit* (Cat. No. 631795)
•
2 •
20 ml
Incubation Trays
Extraction/Labeling Buffer
• 200 µl
Blocking Buffer
•
20 ml
10X Desalting Buffer
•
90 ml
Stock Incubation Buffer (2 Bottles)
•
10 ml
Background Reducer
•
20 ml
Wash Buffer A
•
20 ml
Wash Buffer B
•
20 ml
Wash Buffer C
•
Antibody Microarrays 380 & 500 User Manual (PT3648-1)
•
Ab Microarray Analysis Workbook
A Microsoft Excel 97/98 file used for array data analysis. This workbook must be downloaded from the Bioinformatics or Online Tools page of our web site at www.clontech.com
*The Ab Microarray Express Buffer Kit provides reagents suitable for two Ab Microarray experiments
(four slides total) as described in this User Manual.
Ab Array 380 - Disease Profiling Array (Cat. No. 631797)
•
2 Ab Microarray 380 slides
•
1 Storage Vial
Ab Array 380 - Disease Profiling Kit (Cat. No. 631796)
•
4 Ab Microarray 380 slides
•
2 Storage Vials
•
1 Ab Microarray Express Buffer Kit (Cat. No. 631795)
Ab Microarray 500 Kit (Cat. No. 631798)
•
4 Ab Microarray 500 slides
•
2 Storage Vials
•
1 Ab Microarray Express Buffer Kit (Cat. No. 631795)
Protocol No. PT3648-1
www. clontech.com
Version No. PR123821
6
Clontech Laboratories, Inc.
A Takara Bio Company
Antibody Microarrays 380 & 500 User Manual
III.
List of Components continued
Ab Microarray 500 Slides (Cat. No. 631790)
•
2 Ab Microarray 500 slides
•
1 Storage Vial
Protein Extraction & Labeling Kit (Cat. No. 631786)
This kit is designed for first time users. Use this kit to optimize the labeling reaction. The goal is to obtain the
correct dye/molecule ratio to allow for reliable, reproducible results between experiments.
•
20 ml
Extraction/Labeling Buffer
•
20 ml
10X Desalting Buffer
• 100 µl
Blocking Buffer
Visit our Antibody Arrays product page at www.clontech.com for a current list of products available for
use with our Ab Arrays.
Clontech Laboratories, Inc. www. clontech.com
A Takara Bio Company
Protocol No. PT3648-1
Version No. PR123821
7
Antibody Microarrays 380 & 500 User Manual
IV. Additional Materials & Equipment Required
The following materials are required but not supplied:
•
Alumina (Sigma Cat. No. A-2039; for disintegrating tissue samples)
•
BCA Protein Assay Reagent Kit (Pierce Biotechnology; Cat. No. 23225 or 23227)
Pierce’s BCA Protein Assay Reagent Kit has been tested by our scientists and is approved for use with
Ab Microarray procedures and reagents.
•
Bovine serum albumin (BSA; protein standard)
•
0.1 M sodium carbonate buffer (pH 8.3)
Used in the preparation of body fluids for array analysis
•
Cy5 mono-Reactive Dye Pack (GE Healthcare, Cat. No. PA25001)
•
Cy3 mono-Reactive Dye Pack (GE Healthcare, Cat. No. PA23001)
Cy5 and Cy3 are fluorescent dyes that have distinct emission spectra.
•
1.5 ml and 2.0 ml microcentrifuge tubes
•
15 ml and 50 ml conical centrifuge tubes (e.g., BD Falcon™ conical centrifuge tubes)
•
Disposable PD-10 Desalting Columns
(GE Healthcare; 17-0851-01) These columns are recommended for the Large-Scale Protein Extraction
& Labeling Protocol.
•
Protein Desalting Spin Columns (Pierce Biotechnology; Cat. Nos. 89849 or 89862)
These columns are recommended for the Small-Scale Protein Extraction & Labeling Protocol.
•
Mortar & pestle (for grinding tissue)
•
Rocking platform (to provide a constant “see-saw” motion during slide incubation and washing)
•
Swinging-bucket centrifuge (with adaptors for spinning 50 ml tubes)
•
Microcentrifuge
•
Spectrometer (capable of measuring absorbance at 552 and 650 nm)
•
Microarray slide scanner
You may use any scanner that is compatible with 75 x 25 x 1 mm slides and capable of dual-color
analysis. The scanner must be capable of measuring Cy5 and Cy3 fluorescent labels.
•
Microsoft® Excel 97/98 or later (software application)
Used for calculating Internally Normalized Ratios based on fluorescence data from a microarray analysis.
Protocol No. PT3648-1
www. clontech.com
Version No. PR123821
8
Clontech Laboratories, Inc.
A Takara Bio Company
Antibody Microarrays 380 & 500 User Manual
V. Important Pre-Protocol Considerations
A. Handling Ab Microarray Slides
• Wear laboratory gloves whenever handling Ab Microarrays. Alternatively, use tweezers to manipulate slides.
• Always hold slides at the end nearest the affixed data label. (Note: This label includes identifying information
for the array.)
Attention
B. Orienting Microarrays
A
B
1
2
3
4
a b c d e f g h a b c d e f g h a b c d e f g h a b c d e f g h
Ab Microarray
A
1
2
3
4
5
6
B
1
2
3
4
5
6
C
1
2
3
4
5
6
D
1
2
3
4
5
6
1
2
3
4
5
6
a b c d e f g h
a b c d e f g h
a b c d e f g h
a b c d e f g h
1
2
3
4
5
6
a b c d e f g h
a b c d e f g h
a b c d e f g h
a b c d e f g h
1
2
3
4
5
6
a b c d e f g h
a b c d e f g h
a b c d e f g h
a b c d e f g h
1
2
3
4
5
6
Figure 2. Layout of the Ab Microarray 500.The Ab Microarray 500 contains at least 500 distinct antibodies arrayed in a 32 x 32 grid on a
75 x 25 x 1 mm glass slide (Panel A). Each antibody is printed in duplicate. Panel B. Darker dots at the corners represent Cy3™/Cy5™labeled bovine serum albumin (BSA) spots, which serve as orientation markers. The open circles correspond to unlabeled BSA spots,
which serve as negative controls. The Ab Microarray 380 has a similar layout to the Ab Microarray 500. The difference is that rows 5 and
6 are not printed in the Ab Microarray 380.
C. Choosing Your Protocol
In completing an Ab Microarray analysis, you have the option of using either a Large-Scale or Small-Scale Protein
Extraction & Labeling protocol. The key differences between these two protocols are summarized in Table I.
Table I. Comparison of protein Extraction & labeling MethodS
Quantities Needed for or Obtained from Specific Stepsa
Quantity of tissue or cells required for protein extraction (Step 1)
Expected yield of total protein following protein extraction (Step 1)
Quantity needed for labeling (Step 2)
Small-Scaleb
Tissues & Cells
Large-Scaleb
Tissues, Cells & Body
Fluids
15–25 mg
50–200 mg
~250–500 µg
~2–3 mg
~200 µg
~1 mg
Diagrammed in Figure 1A
a
b
The quantities and volumes given correspond to those needed for a single sample. Recall that for each array analysis, two different
samples (referred to as Samples A and B in Figure 1A) are prepared and analyzed.
Both protocols yield sufficient protein to perform a single antibody microarray analysis. The large-scale method,
however, yields more than enough protein for additional downstream analyses performed in conjunction with the
antibody microarray procedure. Note, however, that we do not recommend storing labeled protein for long periods
because of the potential for protein degradation.
D. Preventing Protein Degradation
DO NOT USE protease inhibitors. The Extraction/Labeling, Blocking, Desalting, Stock Incubation, and Wash
Buffers do not contain protease inhibitors because of their potential interference with protein labeling. We obtain
excellent results without protease inhibitors, and thus do not recommend their use during protein extraction,
labeling, or array detection. We do, however, recommend that once you start the extraction you work quickly and
proceed diligently towards the array analysis step.
Clontech Laboratories, Inc. www. clontech.com
A Takara Bio Company
Protocol No. PT3648-1
Version No. PR123821
9
Antibody Microarrays 380 & 500 User Manual
VI. Protein Extraction & Labeling (Large-Scale) Protocol
PLEASE READ THE ENTIRE PROTOCOL BEFORE STARTING.
Follow the appropriate section below, depending on your starting material: crude tissue
(Section A), cultured cells (Section B), or body fluids (Section C).
A. Extracting Protein from Crude Tissue
Protocol
1. Chill the following items on ice or at 4°C:
• Extraction/Labeling Buffer
• one mortar & pestle
• two 2 ml microcentrifuge tubes
• one 15 ml conical centrifuge tube
2. Perform protein extraction
Frozen tissue
100–200 mg
transfer to a prechilled mortar
Add alumina
0.25–0.5 g
to the mortar
Use the pestle to grind the tissue until a paste is formed.
Add prechilled Extraction/Labeling Buffer
1–2 ml
to the mortar
Mix the buffer into the paste using the pestle.
Use a micropipette tip to scrape the paste that adheres to the pestle back into the mortar.
Transfer the extract to a prechilled 2 ml microcentrifuge tube
Rinse pestle with Extraction/Labeling Buffer
1–2 ml
Hold the pestle over the mortar,
rinse the pestle
Combine the rinse with the original extract in a 2 ml tube
If the volume exceeds the tube’s capacity, use a second 2 ml tube
Centrifuge suspension 10,000 x g for 30 min
Transfer the supernatant to a prechilled 15 ml conical centrifuge tube
Do not disturb the pellet
Mix lysate, by gently inverting the tube
Protocol No. PT3648-1
www. clontech.com
Version No. PR123821
10
Clontech Laboratories, Inc.
A Takara Bio Company
Antibody Microarrays 380 & 500 User Manual
VI. Protein Extraction & Labeling (Large-Scale) Protocol continued
3. Measure protein concentration & dilute sample
Measure protein concentration
Use Pierce’s BCA Protein Assay
Reagent Kit
Dilute sample with Extraction/Labeling Buffer
1.1 mg protein/ml
Final volume must be
≥1 ml
Proceed immediately to Section D
If final volume is below 1 ml – STOP. Do not proceed to the next step. Repeat the extraction with a fresh sample or carry out small-scale labeling (starting at Section VII.C).
B. Extracting Protein from Cultured Cells
Protocol
Note: For adherent cells that are 90% confluent, we find that two 150 mm culture plates,
when combined, yield ~150 mg of cells. We typically harvest two 150 mm plates for each
Sample A and B. Before starting the freeze-thaw procedure, we wash the cells four times
with PBS (20 volumes each wash).
1. Cell preparation
Cultured cells
50–150 mg
Centrifuge in a
preweighed centrifuge tube
Decant the supernatant
Aspirate the residual liquid
Centrifuge the tube again (for ~2 min)
Aspirate any residual traces of liquid
Weigh the cell pellet
Reweigh the tube
Freeze the cell pellet liquid nitrogen (–196°C)
Place samples in liquid nitrogen
or freezer
–80°C freezer
2. Perform protein extraction
Add Extraction/Labeling Buffer
20 μl buffer/ 1 mg cells
Incubate at room temperature
10 min
Centrifuge suspension
Mix thoroughly by vortexing
until mixture is homogeneous
Constant rotation/mixing
10,000 x g for 30 min at 4°C
Transfer the supernatant to a clean tube
Discard the pellet
Clontech Laboratories, Inc. www. clontech.com
A Takara Bio Company
Protocol No. PT3648-1
Version No. PR123821
11
Antibody Microarrays 380 & 500 User Manual
VI. Protein Extraction & Labeling (Large-Scale) Protocol continued
3. Measure protein concentration & dilute sample
Measure protein concentration
Use Pierce’s BCA Protein Assay
Reagent Kit
Dilute sample with Extraction/Labeling Buffer
1.1 mg protein/ml
Final volume must be
≥1 ml
Proceed immediately to Section D
If final volume is below 1 ml – STOP. Do not proceed to the next step. Repeat the extraction with a fresh sample or carry out small-scale labeling (starting at Section VII.C).
C. Preparing Protein from Body Fluids
Protocol
Note: A preliminary estimate of the protein concentration, followed by a desalting procedure
and a second protein assay, is necessary to accurately measure the protein levels in body
fluids. Desalting may be performed at room temperature if you work quickly, or else at 4°C.
1. Measure protein concentration & dilute sample
Measure protein concentration
Use Pierce’s BCA Protein Assay
Reagent Kit
Dilute sample with 0.1 M sodium carbonate buffer (pH 8.3)
~4 mg protein/ml
2. Perform desalting
Add 0.1 M sodium carbonate buffer (pH 8.3)
3 x 5 ml
To a PD-10 column (equilibration step)
Load
2.5 ml
Sample onto column
Elute with
3.5 ml
0.1 M sodium carbonate buffer (pH 8.3)
Collect flowthrough in a clean 15 ml conical centrifuge tube.
3. Measure protein concentration & dilute sample
Measure protein concentration
Use Pierce’s BCA Protein Assay
Reagent Kit
Dilute sample with Extraction/Labeling Buffer
1.1 mg protein/ml
Final volume must be
≥1 ml
Proceed immediately to Section D
If final volume is below 1 ml – STOP. Do not proceed to the next step. Repeat the extraction with a fresh sample or carry out small-scale labeling (starting at Section VII.C).
Protocol No. PT3648-1
www. clontech.com
Version No. PR123821
12
Clontech Laboratories, Inc.
A Takara Bio Company
Antibody Microarrays 380 & 500 User Manual
VI. Protein Extraction & Labeling (Large-Scale) Protocol continued
D. Labeling Protein with Fluorescent Dye
IMPORTANT: Prepare dye solutions, mix dyes with protein samples, and centrifuge mixtures
rapidly, all without interruption. After the Cy3 and Cy5 dyes are dissolved in buffer, they must
be used immediately. Each dye tube contains sufficient dye to label ~1 mg of total protein.
You will need at least 1 ml of protein at a concentration of 1.1 mg/ml to proceed with the
fluorescent labeling protocol.
Protocol
1. Label tubes & prepare dye solutions
Label four 1.5 ml microcentrifuge tubes: A-Cy3
A-Cy5
B-Cy3
B-Cy5
Add Extraction/Labeling Buffer
110 µl
To Cy3 dye tube
Vortex dye solution
20 sec
Centrifuge dye solution
10 sec (moderate speed)
Add Extraction/Labeling Buffer
110 µl
To Cy5 dye tube
Vortex dye solution
20 sec
Centrifuge dye solution
10 sec (moderate speed)
2. Mix dyes with protein samples
Add Cy3 solution
30 µl
To tubes A-Cy3 and B-Cy3
Add Cy5 solution
30 µl
To tubes A-Cy5 and B-Cy5
Add Protein Sample A
470 µl
To tubes A-Cy3 and A-Cy5
470 µl
To tubes B-Cy3 and B-Cy5
Add Protein Sample B
Invert each tube 3 times to mix the contents
Centrifuge protein and dye mixture
Clontech Laboratories, Inc. www. clontech.com
A Takara Bio Company
10 sec (moderate speed)
Protocol No. PT3648-1
Version No. PR123821
13
Antibody Microarrays 380 & 500 User Manual
VI. Protein Extraction & Labeling (Large-Scale) Protocol continued
3. Incubate dye-sample mixtures
Wrap each tube in foil &incubate on ice (or at 4°C)
90 min
Add Blocking Buffer 4 µl
Wrap each tube in foil & incubate on ice (or at 4°C)
30 min
Mix by inversion every 20 min or
incubate on a rocker at 4°C
To each tube
Mix by inversion every 10 min
Proceed immediately to Section E.
E. Removing Unbound Dye using PD-10 Desalting Columns
Protocol
Note: Dye removal using PD-10 desalting columns, manufactured by GE Healthcare (Cat. No.
17-0851-01), may be performed at room temperature if you work quickly, or else at 4°C.
1. Label microfuge tubes & columns, and prepare buffer
Label four PD-10 Desalting Columns
A-Cy3
A-Cy5
B-Cy3
B-Cy5
Label four 2 ml microcentrifuge tubes:
A-Cy3
A-Cy5
B-Cy3
B-Cy5
Prepare 1X Desalting Buffer 100 ml
Dilute 10X Desalting Buffer with
Milli-Q H2O (in clean plastic bottle)
Adjust the pH to 7.4
Protocol No. PT3648-1
www. clontech.com
Version No. PR123821
14
Clontech Laboratories, Inc.
A Takara Bio Company
Antibody Microarrays 380 & 500 User Manual
VI. Protein Extraction & Labeling (Large-Scale) Protocol continued
2. Perform desalting
Add 1X Desalting Buffer 3 x 5 ml each
To each PD-10 column
(equilibration step)
Load the Cy3- and Cy5-labeled ~500 µl each
Allow protein to pass into column
protein samples
Add 1X Desalting Buffer 2 ml each
To each PD-10 column
Allow buffer to pass into columns
Elute each column by adding 2 ml each
To each PD-10 column
1X Desalting Buffer
Collect flowthrough in the prelabeled
2 ml microcentrifuge tubes
Store tubes on ice
3. Measure protein concentration & dilute sample
Measure protein concentration
Use Pierce’s BCA Protein Assay
Reagent Kit (see Section F)
Clontech Laboratories, Inc. www. clontech.com
A Takara Bio Company
Protocol No. PT3648-1
Version No. PR123821
15
Antibody Microarrays 380 & 500 User Manual
VI. Protein Extraction & Labeling (Large-Scale) Protocol continued
F. Determining Protein Concentration
We recommend the BCA Protein Assay Reagent Kit from Pierce Biotechnology. It has
been tested by our scientists and shown to be compatible with our buffers. Using other BCA
reagents (or kits) could lead to errors in protein estimation.
Protocol
1. Standard curve
Use bovine serum albumin (BSA) as your protein standard.
Dilute BSA to:
0.02 mg/ml
0.05 mg/ml
0.1 mg/ml
0.2 mg/ml
0.3 mg/ml
0.4 mg/ml
0.5 mg/ml
Use 1 X Desalting Buffer 0 mg/ml
As the blank
Measure each sample in triplicate.
2. Subtract contribution of dyes (Cy3 and Cy5 absorb at 562 nm)
Prepare protein blank
Substitute BCA reagent with 1X Desalting Buffer
Add an aliquot of your labeled protein
3. Sample plate layout
A
B
C
D
1
2
3
4
5
6
7
8
9
10
11
12
Std. 0
mg/ml
Std. 0
mg/ml
Std. 0
mg/ml
Sample
A Cy3
Std. 0.02
mg/ml
Std. 0.02
mg/ml
Std. 0.02
mg/ml
Sample
A Cy3
Std. 0.05
mg/ml
Std. 0.05
mg/ml
Std. 0.05
mg/ml
Sample
A Cy3
Std. 0.1
mg/ml
Std. 0.1
mg/ml
Std. 0.1
mg/ml
Sample
A Cy5
Std. 0.2
mg/ml
Std. 0.2
mg/ml
Std. 0.2
mg/ml
Sample
A Cy5
Std. 0.3
mg/ml
Std. 0.3
mg/ml
Std. 0.3
mg/ml
Sample
A Cy5
Std. 0.4
mg/ml
Std. 0.4
mg/ml
Std. 0.4
mg/ml
Sample
B Cy3
Std. 0.5
mg/ml
Std. 0.5
mg/ml
Std. 0.5
mg/ml
Sample
B Cy3
Protein blank –
Sample A Cy3
Protein blank –
Sample A Cy3
Protein blank –
Sample A Cy3
Sample
B Cy3
Protein blank –
Sample A Cy5
Protein blank –
Sample A Cy5
Protein blank –
Sample A Cy5
Sample
B Cy5
Protein blank –
Sample B Cy3
Protein blank –
Sample B Cy3
Protein blank –
Sample B Cy3
Sample
B Cy5
Protein blank –
Sample B Cy5
Protein blank –
Sample B Cy5
Protein blank –
Sample B Cy5
Sample
B Cy5
E
F
G
H
Protocol No. PT3648-1
www. clontech.com
Version No. PR123821
16
Clontech Laboratories, Inc.
A Takara Bio Company
Antibody Microarrays 380 & 500 User Manual
VI. Protein Extraction & Labeling (Large-Scale) Protocol continued
4. Calculate protein concentration
ΔOD562 Sample= [OD562 (protein sample) – OD562 (protein blank)]
ΔOD562 Std. = [OD562 (standard) – OD562 (blank = 0 mg/ml)]
Use the ΔOD562 and your standard curve to estimate protein concentration.
Typical concentration of desalted samples ~0.2 mg protein/ml
G. Estimating the Average Number of Coupled Dye Molecules
Protocol
1. Measure absorbance – using a spectrophotometer
Dilute sample with 1X Desalting Buffer
1/10 dilution
Prepare blank with 1X Desalting Buffer
Measure Cy3 absorbance at 552 nm – can use 1 cm cuvettes
Blank – 1X Desalting Buffer
Sample A-Cy3 – 1/10 dilution in Desalting Buffer
Sample B-Cy3 – 1/10 dilution in Desalting Buffer
Measure Cy5 absorbance at 650 nm – can use 1 cm cuvettes
Blank – 1X Desalting Buffer
Sample A-Cy5 – 1/10 dilution in Desalting Buffer
Sample B-Cy5 – 1/10 dilution in Desalting Buffer
Record A552 and A650 for all samples
A552 Sample A-Cy3 = absorbance 552 nm of Sample A-Cy3 – absorbance 552 nm of blank
A552 Sample B-Cy3 = absorbance 552 nm of Sample B-Cy3 – absorbance 552 nm of blank
A650 Sample A-Cy5 = absorbance 650 nm of Sample A-Cy5 – absorbance 650 nm of blank
A650 Sample B-Cy5 = absorbance 650 nm of Sample B-Cy5 – absorbance 650 nm of blank
2. General considerations
Assume that the average molecular weight of protein is 60,000 Da
Protein concentration – use the values obtained from the BCA method
Molar extension coefficient (ε)
ε552 of Cy3 = 150,000 M–1 cm–1
ε650 of Cy5 = 250,000 M–1 cm–1
Clontech Laboratories, Inc. www. clontech.com
A Takara Bio Company
Protocol No. PT3648-1
Version No. PR123821
17
Antibody Microarrays 380 & 500 User Manual
VI. Protein Extraction & Labeling (Large-Scale) Protocol continued
3. Sample calculation – Sample A-Cy3
Sample data
BCA assay results (protein concentration by BCA) = 0.18 mg/ml
Absorbance results (A552) = 0.9
Sample calculation
Cy3 concentration in sample = (A552/ ε552) x 106
= (0.9 / 150,000) x 106 = 6 μM
Protein concentration in sample = [(BCA assay result) / (average molecular weight)] x 106
= (0.18/60,000) x 106 = 3 μM
Dye/protein = Cy3 concentration in sample / protein concentration in sample
= 6 μM / 3 μM = 2
For best results, the dye/protein ratio should be in the range of 2–4.
When this ratio is significantly greater (e.g., >6), the label may begin to interfere with
antigen-antibody binding.
4. Sample calculation – Sample A-Cy5
Sample data
BCA assay results (protein concentration by BCA) = 0.18 mg/ml
Absorbance results (A650) = 1.5
Sample calculation
Cy5 concentration in sample = (A650/ ε650) x 106
= (1.5 / 250,000) x 106 = 6 μM
Protein concentration in sample = [(BCA assay result) / (average molecular weight)] x 106
= (0.18/60,000) x 106 = 3 μM
Dye/protein = Cy5 concentration in sample / protein concentration in sample
= 6 μM / 3 μM = 2
For best results, the dye/protein ratio should be in the range of 2–4.
When this ratio is significantly greater (e.g., >6), the label may begin to interfere with
antigen-antibody binding.
Protocol No. PT3648-1
www. clontech.com
Version No. PR123821
18
Clontech Laboratories, Inc.
A Takara Bio Company
Antibody Microarrays 380 & 500 User Manual
VII.Protein Extraction & Labeling (Small-Scale) Protocol
PLEASE READ THE ENTIRE PROTOCOL BEFORE STARTING.
Follow the appropriate section below, depending on your starting material: crude tissue
(Section A) or cultured cells (Section B).
A. Extracting Protein from Crude Tissue
Protocol
1. Chill the following items on ice or at 4°C:
• Extraction/Labeling Buffer
• one small mortar & pestle
• two 1.5 ml microcentrifuge tubes
2. Perform protein extraction
Frozen tissue
15–25 mg
transfer to a prechilled mortar
Add alumina
2–5 mg
to the mortar
Use the pestle to grind the tissue until a paste is formed.
Add prechilled Extraction/Labeling Buffer
100–200 µl
to the mortar
Mix the buffer into the paste using the pestle.
Use a micropipette tip to scrape the paste that adheres to the pestle back into the mortar.
Transfer the extract to a prechilled 1.5 ml microcentrifuge tube
Rinse pestle with Extraction/Labeling Buffer
100–200 µl
Hold the pestle over the mortar,
rinse the pestle
Combine the rinse with the original extract in a 1.5 ml tube
Centrifuge suspension 10,000 x g for 30 min at 4°C
Transfer the supernatant to a prechilled 1.5 ml microcentrifuge tube
Do not disturb the pellet
Mix lysate, by gently inverting the tube
Clontech Laboratories, Inc. www. clontech.com
A Takara Bio Company
Protocol No. PT3648-1
Version No. PR123821
19
Antibody Microarrays 380 & 500 User Manual
VII. Protein Extraction & Labeling (Small-Scale) Protocol continued
3. Measure protein concentration & dilute sample
Measure protein concentration
Use Pierce’s BCA Protein Assay
Reagent Kit
Dilute sample with Extraction/Labeling Buffer
1.1 mg protein/ml
Final volume must be
≥200 µl
Proceed immediately to Section C
If final volume is below 200 µl – STOP. Do not proceed to the next step. Repeat the
extraction with a fresh sample and use more starting material.
B. Extracting Protein from Cultured Cells
Protocol
Note: For adherent cells that are 90% confluent, we find that one 100 mm culture plate yields
~17 mg of cells. Before starting the freeze-thaw procedure, we wash the cells four times with
PBS (20 volumes each wash).
1. Cell preparation
Cultured cells
15–25 mg
Centrifuge in a preweighed
microcentrifuge tube
Decant the supernatant
Aspirate the residual liquid
Centrifuge the tube again (for ~2 min)
Aspirate any residual traces of liquid
Weigh the cell pellet
Reweigh the tube
Freeze the cell pellet liquid nitrogen (–196°C)
Place samples in liquid nitrogen
or freezer
–80°C freezer
2. Perform protein extraction
Add Extraction/Labeling Buffer
20 μl buffer/ 1 mg cells
Incubate at room temperature
10 min
Mix thoroughly by vortexing
until mixture is homogeneous
Constant rotation/mixing
Centrifuge suspension
10,000 x g for 30 min at 4°C
Transfer the supernatant to a clean tube
Place tube on ice
Discard the pellet
Protocol No. PT3648-1
www. clontech.com
Version No. PR123821
20
Clontech Laboratories, Inc.
A Takara Bio Company
Antibody Microarrays 380 & 500 User Manual
VII. Protein Extraction & Labeling (Small-Scale) Protocol continued
3. Measure protein concentration & dilute sample
Measure protein concentration
Use Pierce’s BCA Protein Assay
Reagent Kit
Dilute sample with Extraction/Labeling Buffer
1.1 mg protein/ml
Final volume must be
≥200 µl
Proceed immediately to Section C
If final volume is below 200 µl – STOP. Do not proceed to the next step. Repeat the
extraction with a fresh sample and use more starting material.
C. Labeling Protein with Fluorescent Dye
Protocol
IMPORTANT: Prepare dye solutions, mix dyes with protein samples, and centrifuge mixtures
rapidly, all without interruption. After the Cy3 and Cy5 dyes are dissolved in buffer, they must
be used immediately. Each dye tube contains sufficient dye to label ~1 mg of total protein.
1. Label tubes & prepare dye solutions
Label four 1.5 ml microcentrifuge tubes: A-Cy3
A-Cy5
B-Cy3
B-Cy5
Add Extraction/Labeling Buffer
110 µl
To Cy3 dye tube
Vortex dye solution
20 sec
Centrifuge dye solution
10 sec (moderate speed)
Add Extraction/Labeling Buffer
110 µl
To Cy5 dye tube
Vortex dye solution
20 sec
Centrifuge dye solution
10 sec (moderate speed)
2. Mix dyes with protein samples
Add Cy3 solution 6 µl
To tubes A-Cy3 and B-Cy3
Add Cy5 solution
6 µl
To tubes A-Cy5 and B-Cy5
Clontech Laboratories, Inc. www. clontech.com
A Takara Bio Company
Protocol No. PT3648-1
Version No. PR123821
21
Antibody Microarrays 380 & 500 User Manual
VII. Protein Extraction & Labeling (Small-Scale) Protocol continued
Add Protein Sample A 94 µl
To tubes A-Cy3 and A-Cy5
Add Protein Sample B
94 µl
To tubes B-Cy3 and B-Cy5
Carefully pipette up and down several times to mix the contents
Centrifuge protein and dye mixture
10 sec (moderate speed)
3. Incubate dye-sample mixtures
Wrap each tube in foil &incubate on ice (or at 4°C)
90 min
Add Blocking Buffer
4 µl
Wrap each tube in foil & incubate on ice (or at 4°C)
30 min
Mix by inversion every 20 min
To each tube
Mix by inversion every 10 min
Proceed immediately to Section D.
D. Removing Unbound Dye using Protein Desalting Spin Columns
Protocol
Note: Dye removal using Protein Desalting Spin Columns, which are manufactured by Pierce
Biotechnology, Inc. (Cat. No. 89849 or 89862), may be performed at room temperature if you
work quickly, or else at 4°C.
1. Label microfuge tubes & columns, and prepare buffer
Label four Protein Desalting Spin Columns
A-Cy3
A-Cy5
B-Cy3
B-Cy5
Label four 2 ml microcentrifuge tubes:
A-Cy3
A-Cy5
B-Cy3
B-Cy5
Prepare 1X Desalting Buffer 5 ml
Dilute 10X Desalting Buffer with
Milli-Q H2O (in clean plastic bottle).
Adjust the pH to 7.4
Protocol No. PT3648-1
www. clontech.com
Version No. PR123821
22
Clontech Laboratories, Inc.
A Takara Bio Company
Antibody Microarrays 380 & 500 User Manual
VII. Protein Extraction & Labeling (Small-Scale) Protocol continued
2. Prepare desalting columns
Spin each column to remove storage buffer
1,500 x g for 2 min
Add 1X Desalting Buffer
2 x 400 µl
1,500 x g for 2 min
to each column & spin
(after each buffer addition)
Discard flowthrough after each spin.
Attach prelabeled microfuge tubes to the corresponding columns.
3. Perform desalting
Load the Cy3- & Cy5-labeled ~100 µl each
Allow samples to pass into columns
protein samples
Centrifuge to elute desalted protein
1,500 x g for 2 min
Detach and cap microfuge tubes
Store tubes on ice.
4. Measure protein concentration & dilute sample
Measure protein concentration
Use Pierce’s BCA Protein Assay
Reagent Kit (see Section E)
Clontech Laboratories, Inc. www. clontech.com
A Takara Bio Company
Protocol No. PT3648-1
Version No. PR123821
23
Antibody Microarrays 380 & 500 User Manual
VII. Protein Extraction & Labeling (Small-Scale) Protocol continued
E. Determining Protein Concentration
We recommend the BCA Protein Assay Reagent Kit from Pierce Biotechnology. It has
been tested by our scientists and shown to be compatible with our buffers. Using other BCA
reagents (or kits) could lead to errors in protein estimation.
Protocol
1. Standard curve
Use bovine serum albumin (BSA) as your protein standard.
Dilute BSA to:
0.02 mg/ml
0.05 mg/ml
0.1 mg/ml
0.2 mg/ml
0.3 mg/ml
0.4 mg/ml
0.5 mg/ml
Use 1 X Desalting Buffer 0 mg/ml
As the blank
Measure each sample in triplicate.
2. Subtract contribution of dyes (Cy3 and Cy5 absorb at 562 nm)
Prepare protein blank
Substitute BCA reagent with 1X Desalting Buffer
Add an aliquot of your labeled protein
3. Sample plate layout
A
B
C
D
1
2
3
4
5
6
7
8
9
10
11
12
Std. 0
mg/ml
Std. 0
mg/ml
Std. 0
mg/ml
Sample
A Cy3
Std. 0.02
mg/ml
Std. 0.02
mg/ml
Std. 0.02
mg/ml
Sample
A Cy3
Std. 0.05
mg/ml
Std. 0.05
mg/ml
Std. 0.05
mg/ml
Sample
A Cy3
Std. 0.1
mg/ml
Std. 0.1
mg/ml
Std. 0.1
mg/ml
Sample
A Cy5
Std. 0.2
mg/ml
Std. 0.2
mg/ml
Std. 0.2
mg/ml
Sample
A Cy5
Std. 0.3
mg/ml
Std. 0.3
mg/ml
Std. 0.3
mg/ml
Sample
A Cy5
Std. 0.4
mg/ml
Std. 0.4
mg/ml
Std. 0.4
mg/ml
Sample
B Cy3
Std. 0.5
mg/ml
Std. 0.5
mg/ml
Std. 0.5
mg/ml
Sample
B Cy3
Protein blank –
Sample A Cy3
Protein blank –
Sample A Cy3
Protein blank –
Sample A Cy3
Sample
B Cy3
Protein blank –
Sample A Cy5
Protein blank –
Sample A Cy5
Protein blank –
Sample A Cy5
Sample
B Cy5
Protein blank –
Sample B Cy3
Protein blank –
Sample B Cy3
Protein blank –
Sample B Cy3
Sample
B Cy5
Protein blank –
Sample B Cy5
Protein blank –
Sample B Cy5
Protein blank –
Sample B Cy5
Sample
B Cy5
E
F
G
H
Protocol No. PT3648-1
www. clontech.com
Version No. PR123821
24
Clontech Laboratories, Inc.
A Takara Bio Company
Antibody Microarrays 380 & 500 User Manual
VII. Protein Extraction & Labeling (Small-Scale) Protocol continued
4. Calculate protein concentration
ΔOD562 Sample= [OD562 (protein sample) – OD562 (protein blank)]
ΔOD562 Std. = [OD562 (standard) – OD562 (blank = 0 mg/ml)]
Use the ΔOD562 and your standard curve to estimate protein concentration.
Typical concentration of desalted samples ~0.8 mg protein/ml
F. Estimating the Average Number of Coupled Dye Molecules
Protocol
1. Measure absorbance – using a spectrophotometer
Dilute sample with 1X Desalting Buffer
1/10 dilution
Prepare blank with 1X Desalting Buffer
Measure Cy3 absorbance at 552 nm – can use 1 cm cuvettes
Blank – 1X Desalting Buffer
Sample A-Cy3 – 1/10 dilution in Desalting Buffer
Sample B-Cy3 – 1/10 dilution in Desalting Buffer
Measure Cy5 absorbance at 650 nm – can use 1 cm cuvettes
Blank – 1X Desalting Buffer
Sample A-Cy5 – 1/10 dilution in Desalting Buffer
Sample B-Cy5 – 1/10 dilution in Desalting Buffer
Record A552 and A650 for all samples
A552 Sample A-Cy3 = absorbance 552 nm of Sample A-Cy3 – absorbance 552 nm of blank
A552 Sample B-Cy3 = absorbance 552 nm of Sample B-Cy3 – absorbance 552 nm of blank
A650 Sample A-Cy5 = absorbance 650 nm of Sample A-Cy5 – absorbance 650 nm of blank
A650 Sample B-Cy5 = absorbance 650 nm of Sample B-Cy5 – absorbance 650 nm of blank
2. General considerations
Assume that the average molecular weight of protein is 60,000 Da
Protein concentration – use the values obtained from the BCA method
Molar extension coefficient (ε)
ε552 of Cy3 = 150,000 M–1 cm–1
ε650 of Cy5 = 250,000 M–1 cm–1
Clontech Laboratories, Inc. www. clontech.com
A Takara Bio Company
Protocol No. PT3648-1
Version No. PR123821
25
Antibody Microarrays 380 & 500 User Manual
VII. Protein Extraction & Labeling (Small-Scale) Protocol continued
3. Sample calculation – Sample A-Cy3
Sample data
BCA assay results (protein concentration by BCA) = 0.18 mg/ml
Absorbance results (A552) = 0.9
Sample calculation
Cy3 concentration in sample = (A552/ ε552) x 106
= (0.9 / 150,000) x 106 = 6 μM
Protein concentration in sample = [(BCA assay result) / (average molecular weight)] x 106
= (0.18/60,000) x 106 = 3 μM
Dye/protein = Cy3 concentration in sample / protein concentration in sample
= 6 μM / 3 μM = 2
For best results, the dye/protein ratio should be in the range of 2–4.
When this ratio is significantly greater (e.g., >6), the label may begin to interfere with
antigen-antibody binding.
4. Sample calculation – Sample A-Cy5
Sample data
BCA assay results (protein concentration by BCA) = 0.18 mg/ml
Absorbance results (A650) = 1.5
Sample calculation
Cy5 concentration in sample = (A650/ ε650) x 106
= (0.9 / 150,000) x 106 = 6 μM
Protein concentration in sample = [(BCA assay result) / (average molecular weight)] x 106
= (0.18/60,000) x 106 = 3 μM
Dye/protein = Cy5 concentration in sample / protein concentration in sample
= 6 μM / 3 μM = 2
For best results, the dye/protein ratio should be in the range of 2–4.
When this ratio is significantly greater (e.g., >6), the label may begin to interfere with
antigen-antibody binding.
Protocol No. PT3648-1
www. clontech.com
Version No. PR123821
26
Clontech Laboratories, Inc.
A Takara Bio Company
Antibody Microarrays 380 & 500 User Manual
VIII.Antibody Array Incubation Protocol
1. Prepare Incubation Buffer and set up Incubation Tray
Prepare Incubation Buffer
45 ml
Mix 4.5 ml Background Reducer
& 40.5 ml Stock Incubation Buffer
in a clean plastic bottle or tube
Set up Incubation Tray and label the four chambers: Use a pen to mark exterior surface
“Slide 1 Incubation”, “Slide 1 Wash”, “Slide 2 Incubation”, “Slide 2 Wash”
Add Incubation Buffer
5 ml
2. Prepare protein sample mixes
To each chamber
Label two 1.5 ml microfuge tubes: “Slide 1 Mix” and “Slide 2 Mix”
Slide 1 Mix Preparation:
Protein Sample A-Cy5 100 µg
Protein Sample B-Cy3
100 µg
Slide 2 Mix Preparation:
Protein Sample A-Cy3 Protein Sample B-Cy5
100 µg
100 µg
Leftover Samples A and B can be stored at 4°C (short-term storage) or –20°C (long-term
storage) for later use in other applications—e.g., Western blotting, but stored protein samples
are not recommended for future microarray analyses.
3. Transfer protein sample mixes to Incubation Tray
Transfer Incubation Buffer
5 ml
To Slides 1 & 2 Incubation chambers
Add protein from Slide 1 Mix
20 µg*
To Slide 1 Incubation chamber
Add protein from Slide 2 Mix
20 µg*
To Slide 2 Incubation chamber
*For samples derived from serum, use 100 µg of protein, since a large percentage (~80%)
of the protein consists of immunoglobulin and albumin.
Incubate the tray at RT
10 min
With gentle rocking
Prepare Ab Microarray Slides (Step 4) while incubating tray with protein sample mixes.
Clontech Laboratories, Inc. www. clontech.com
A Takara Bio Company
Protocol No. PT3648-1
Version No. PR123821
27
Antibody Microarrays 380 & 500 User Manual
VIII. Antibody Array Incubation Protocol continued
4. Prepare Ab Microarray Slides for incubation
TE
NO
Important: Use gloved hands or tweezers to hold and manipulate the slides. Never touch the
array-end of the slide. Instead, always hold the slide at the end nearest the affixed label.
The Ab array slides are supplied in Storage Buffer inside a green-capped Storage Vial. An empty
storage vial for drying the slides is also provided.The Storage Buffer contains glycerol and should
be disposed of in a properly labeled waste container.
Decant the Storage Buffer from Press your gloved finger against
the green-capped Storage Vial
the top of vial to keep the slides
from falling out.
Wash Ab Microarray Slides as follows:
Transfer the slides into the dry, clean Storage Vial provided with the slides
Add Stock Incubation Buffer
30 ml
To Storage Vial
Cap Storage Vial and slowly invert 10 times
Decant Storage Buffer while using your gloved finger to keep the slides from falling out.
Add Stock Incubation Buffer
20 ml
To Storage Vial
Cap Storage Vial and slowly invert 10 times
Stand the vial upright in a rack.
Record each slide’s lot number.
Designate one slide as Slide 1 and the other slide as Slide 2.
5. Incubate Ab Microarray Slides with protein sample mixes
Important: Place each slide array-side-up into the appropriate incubation chamber in the
Incubation Tray (see Step 1). The array is printed on the side to which the label is affixed.
Transfer Slide 1 from the Storage Vial to the Slide 1 Incubation chamber
Transfer Slide 2 from the Storage Vial to the Slide 2 Incubation chamber
Incubate the tray at RT
40 min
Note: Use a micropipette tip to pry up one end of each slide while you gently rock
the Incubation Tray once or twice. This helps exchange liquid on all sides of the slide.
Protocol No. PT3648-1
www. clontech.com
Version No. PR123821
28
With gentle rocking
Clontech Laboratories, Inc.
A Takara Bio Company
Antibody Microarrays 380 & 500 User Manual
VIII. Antibody Array Incubation Protocol continued
6. Wash Ab Microarray Slides & prepare for scanning
TE
NO
Important: Use gloved hands to hold and manipulate the slides. Do not touch the array surface
of the slides. Instead, hold the slides by their edges.
Add Wash Buffer A
5 ml
To each wash chamber Transfer Slide 1 from the Slide 1 Incubation chamber to the Slide 1 Wash chamber
Transfer Slide 2 from the Slide 2 Incubation chamber to the Slide 2 Wash chamber
Incubate at RT
5 min
With gentle rocking
Remove the buffer from the chambers
Add Wash Buffer B
5 ml
To each wash chamber
Incubate at RT
5 min
With gentle rocking
Remove the buffer from the chambers
Add Wash Buffer C
5 ml
To each wash chamber
Incubate at RT
5 min
With gentle rocking
Rinse the slides as follows:
Transfer each slide into a 50 ml conical tube filled with Milli-Q grade water, with the slide
label facing downward, then pour off the water completely.
Dry the slides as follows:
Place the slides, array-end-up, in the empty, green-capped Storage Vial provided, & cap it.
Centrifuge the slides for
5 min
1,000 x g at RT
Using gloved hands, uncap the vial. While holding your finger over the top of the vial to
prevent the slides from falling out, tip the vial slightly to nudge the slides near the rim of the
vial. When the slides protrude by ~2 cm, remove the slides one-by-one.
The slides are now ready for scanning (see Step 7).
Clontech Laboratories, Inc. www. clontech.com
A Takara Bio Company
Protocol No. PT3648-1
Version No. PR123821
29
Antibody Microarrays 380 & 500 User Manual
VIII. Antibody Array Incubation Protocol continued
7. Scan the Ab Microarray Slides with a Microarray Scanner
Important: If you need to postpone the scanning, keep the slides in a dry chamber and protect
them from light until you are ready to scan.
Scanning Arrays:
• Slides should be scanned ≤24 hours after drying.
• We routinely scan the arrays with an Axon GenePix 4000B scanner using the following settings:
• 635 nm (Cy5 channel): PMT = 670 V; power = 33%
• 532 nm (Cy3 channel): PMT = 550 V; power = 33%.
• The bovine serum albumin control spots can be used as a guide for setting the scanner. These
control spots should generally give a fluorescent signal of 2,500–30,000 fluorescence units (FU).
If the control spots are >50,000 FU this is an indication that the scanner settings are too high; the
slides should be rescanned using lower power settings. If you are using a scanner other than
the GenePix 4000B instrument, adjust the laser power and PMT (if possible) to obtain a signal
within the range of 2,500–9,000 FU for the control spots.
• Some scanners (such as the PerkinElmer ScanArray instrument) adjust the laser settings based
on a pre-scan of the slide; these types of scanners generally calculate the correct settings so
adjustments are not normally required. However, it is still useful to check the signal intensities of
the control spots as the automatic detection settings based on the pre-scan may be incorrect.
Protocol No. PT3648-1
www. clontech.com
Version No. PR123821
30
Clontech Laboratories, Inc.
A Takara Bio Company
Antibody Microarrays 380 & 500 User Manual
IX. Analysis of Results
Attention
A. General Tips for Microarray Data Analysis
In order to use our Ab Microarray Analysis Workbook as described below in Part B, you must first calculate the
Cy5/Cy3 fluorescent signal ratios for all coordinates on each array. This calculation can usually be done with your
array analysis software (e.g., GenePix Pro). The Cy5/Cy3 values are required to calculate Internally Normalized
Ratios (INRs), as described below in Part B.
Antibody Array Data Analysis Features:
• A. Internally normalized results
Internal normalization refers to the sampling method described above (Steps 2–3) in
which a portion of each protein sample is labeled with a portion of each fluorophore
(see Figure 1). By following our protocol, you obtain an Internally Normalized Ratio
(INR) for each antibody antigen pair on the microarray. This sampling method controls for differences in labeling efficiency.
After gel filtration (Step 3), the four samples are combined in equal proportions to
form two samples:
• Mix 1, which comprises A-Cy5 and B-Cy3
• Mix 2, which comprises A-Cy3 and B-Cy5
One microarray is incubated with Mix 1; the second microarray is incubated with Mix
2. In this setup, Array 1 measures A-Cy5/B-Cy3 (Ratio 1), while Array 2 measures
B-Cy5/A-Cy3 (Ratio 2).
After the slides are scanned, arrange the fluorescence data in our Ab Microarray
Analysis Workbook (Microsoft® Excel 97/98), located on the the Bioinformatics or
Online Tools page of our web site at www.clontech.com, and obtain an Internally
Normalized Ratio for each coordinate on the array by computing
Ratio 1 .
Ratio 2
This value now represents the abundance of an antigen in Sample A relative to that
of Sample B. Please see Section B.2 for more details.
• B. Controls
Several bovine serum albumin (BSA) spots are included on all Ab Microarrays. Some
of these spots, prelabeled with Cy3 and Cy5, serve as positive controls, and, as discussed in Section V, serve as orientation markers to help you identify the printed area
of the microarray. Other BSA spots, not labeled with fluorophore, serve as negative
controls. The coordinates of all BSA spots are given on the Certificate of Analysis.
B. Using the Ab Microarray Analysis Workbook to Calculate Internally Normalized Ratios
The Ab Microarray Analysis Workbook is a Microsoft® Excel 97/98 file that converts your fluorescence data into
Internally Normalized Ratios (INRs) for each coordinate on the array. As described in the Introduction (Section
I), the INR calculated by our workbook is a numerical value that represents the abundance of antigen in Sample
A relative to that of Sample B.
To get started:
1. Connect to the Bioinformatics or Online Tools page of our web site at www.clontech.com and download a copy
of the workbook that corresponds to the Slide Lot Number of your Microarray. The Microarray Slide Lot Number
is given on the data label affixed to the glass slide.
TE
NO
Note: The Microarray Slide Lot Number differs from that of the assembled Kit. The Kit Lot Number is shown on the Certificate of Analysis
and on the labels affixed to Boxes 1 and 2.
Clontech Laboratories, Inc. www. clontech.com
A Takara Bio Company
Protocol No. PT3648-1
Version No. PR123821
31
Antibody Microarrays 380 & 500 User Manual
IX. Analysis of Results continued
2. Launch Microsoft Excel. Then open the Microarray Analysis Workbook.
Upon opening the workbook, you will notice that it contains four worksheets. The names of these sheets appear
on tabs at the bottom of the workbook window (Figure 2).
Figure 2. The Ab Microarray Analysis Workbook contains four worksheets.
The “Ab,” “Array,” and “Ab List” worksheets contain array-specific information such as the names and coordinates
of antibodies and the Locus Link and SWISS-PROT accession numbers of the corresponding protein targets.
The fourth worksheet, “Import & Analyses,” contains formulas that perform arithmetic operations on the fluorescence data (i.e., Cy5/Cy3 signal ratios) that you paste into the worksheet. Other formulas in this sheet combine
the values of these operations to generate an INR for each coordinate on the array. The INR can be represented
by the following expression:
INR =
Ratio 1
Ratio 2
where Ratio 1 = A-Cy5 relative fluorescence units
B-Cy3 relative fluorescence units
and Ratio 2 =
B-Cy5 relative fluorescence units
A-Cy3 relative fluorescence units
Note that the Ratio 1 values are obtained from Slide 1. Whereas the Ratio 2 values are obtained from Slide 2.
3. Click on the “Import & Analyses” tab to make it the active window.
4. Paste the Cy5/Cy3 signal ratios from each array into the appropriate columns of the worksheet (Figure 3). Be sure
that your Cy5/Cy3 ratios are listed in the same order as the corresponding Ab-Ag in the worksheet.
When you paste your data into the worksheet, it automatically calculates Ratio 1/Ratio 2 and places these values
in the next column, which in Figure 3 is labeled “R/R.”
Figure 3. The “Import & Analyses” worksheet has three sections: Import, Analyses, and Sorting. To use this worksheet, first paste
your fluorescence data into the Import section (shown). Be sure the data correspond to the correct antibody-antigen (Ab-Ag) pairs
given in the leftmost column. Note: The view shown is that from the Ab Microarray Workbook.
5. Choose File>Save As, and save a copy of the workbook under a new name.
6. Copy the data in the Ab-Ag, (Average) R/R, and (Average) INR columns.
Protocol No. PT3648-1
www. clontech.com
Version No. PR123821
32
Clontech Laboratories, Inc.
A Takara Bio Company
Antibody Microarrays 380 & 500 User Manual
IX. Analysis of Results continued
7. Paste the data into the corresponding columns in the “Sorting” section of the worksheet (Figure 4).
Figure 4. The “Sorting” section of the “Import & Analyses” worksheet.
8. Choose Data>Sort, and sort the data by (Average) INR in ascending or descending order.
Interpretation of Results:
•
Average values (e.g., Average R/R and Average INR) are usually considered
invalid if they are based on duplicates that differ by more than 30%. INR values
are usually considered invalid if they are based on Cy5/Cy3 ratios in which one or
more of the antigen signals is(are) less than twice the background signal.
•
In theory, an INR>1indicates that an antigen is more abundant in Sample A than
in Sample B. Conversely, an INR<1 indicates that an antigen is less abundant in
Sample A than in Sample B. In reality, experimental and assay variabilities must
be taken into account when analyzing your results.
•
The two slide approach addresses the majority of variability that could be introduced. Although internal normalization improves the quality of your data and
addresses potential differences in dye labeling between samples, it is still not
advisable to accept any INR value less than or greater than 1.0 as being a valid
change. In our experience, INR values that are ≥1.3 or ≤0.77 indicate valid changes that signify differences in protein abundance. These threshold values were
used successfully by Anderson et al. (2003).
•
It is important to note that the threshold values of 1.3 and 0.77 are based on an
ideal average INR of 1.0. However, an average INR of 1.0 is not normally obtained
in actual experiments. Thus, threshold values should be calculated for each set
of slides. To calculate the threshold values, it is necessary to calculate the average INR for the experiment. (The average INR can be obtained by averaging the
values in column J of the “Import & Analyses” worksheet of the Ab Microarray
Workbook.) The average INR should then be multiplied by 1.3 to obtain the upper
threshold value and 0.77 to obtain the lower threshold value for that experiment. This practice should be done for every set of slides. For example, if a given
experiment generated an average INR of 1.1, the threshold values would then be
1.43 (1.1 X 1.3) and 0.85 (1.1 X 0.77). Thus, for this hypothetical experiment a valid
change in protein abundance would be any INR value >1.43 or <0.85.
•
To validate your results, you may wish to repeat the assay using individual antibodies with a Western blot procedure.
Clontech Laboratories, Inc. www. clontech.com
A Takara Bio Company
Protocol No. PT3648-1
Version No. PR123821
33
Antibody Microarrays 380 & 500 User Manual
X. References
Abbott, A. (1999a) A post-genomic challenge: learning to read patterns of protein synthesis. Nature 402:715–720.
Abbott, A. (1999b) How to spot a protein in a crowd. Nature 402: 715–717.
Anderson, K., Potter, A., Baban, D. & Davies, K. E. (2003) Protein expression changes in spinal muscular atrophy revealed with a novel antibody array technology.
Brain 126: 2052–2064.
Blattner, F. R., et al. (1997) The complete genome sequence of Escherichia coli K-12. Science 277: 1453–1470.
Bult, C. J., et al. (1996) Complete genome sequence of the methanogenic archaeon, Methanococcus jannaschii. Science 273: 1058–1073.
Dalton, R. & Abbott, A (1999) Can researchers find recipe for proteins and chips? Nature 402: 719–720.
Goffeau, A., Barrell, B. G., Bussey, H., Davis, R. W., Dujon, B., Feldmann, H., Galibert, F., Hoheisel, J. D., Jacq, C. , Johnston, M., Louis, E. J., Mewes, H. W.,
Murakami, Y., Philippsen, P., Tettelin, H. & Oliver, S. G. (1996) Life with 6000 genes. Science 274:546, 563–7.
Gosmanov, A. R., Umpierrez, G. E., Carabel, A. H., Cuervo, R. & Thomason, D.B. (9 March 2004) Impaired expression and insulin-stimulated phosphorylation of
Akt-2 in muscle of obese patients with atypical diabetes. Am J Physiol Endocrinol Metab. 287(1):E8-E15.
Haab, B. B., Dunham, M. J. & Brown, P. O. (2001) Protein microarrays for highly parallel detection and quantitation of specific proteins and antibodies in complex
solutions. Genome Biol. 2(2):research0004.1–0004.13.
Hodgkin, J., Plasterk, R. H. & Waterston, R. H. (1995) The nematode Caenorhabditis elegans and its genome. Science 270:410–414.
Lander, E. S., et al. (2001) Initial sequencing and analysis of the human genome. Nature 409:860–921.
Simpson, R. J. & Dorow, D. S. (2001) Cancer proteomics: from signaling networks to tumor markers. Trends Biotechnol. 19(suppl.):S40–S48.
Song, Y., McDuffie, E., Sobocinski, G., States, D. & Albassam, M. (2002) Profiling of human endothelial cells, human aortic smooth muscle cells & human macrophages responses to lipopolysaccharide stimulation using protein microarrays. Poster presented at the First Annual Great Lakes Bioinformatics Retreat, Michigan,
USA
de Wildt, R. M., Mundy, C. R., Gorick, B. D. & Tomlinson, I. M. (2000) Antibody arrays for high-throughput screening of antibody-antigen interactions. Nat.
Biotechnol. 18:989–994.
Venter, J. C., et al. (2001) The sequence of the human genome. Science 291:1304–1351.
Yamagiwa, Y., Marienfeld, C., Meng, F., Holcik, M. & Patel, T. (2004) Translational regulation of X-linked inhibitor of apoptosis protein by interleukin-6: a novel
mechanism of tumor cell survival. Cancer Res. 64:1293-1298.
Zhou, H., Roy, S., Schulman, H. & Natan, M. J. (2001) Solution and chip arrays in protein profiling. Trends Biotechnol. 19(suppl.): S34–S39.
Protocol No. PT3648-1
www. clontech.com
Version No. PR123821
34
Clontech Laboratories, Inc.
A Takara Bio Company
Antibody Microarrays 380 & 500 User Manual
Notes
Notice to Purchaser
Clontech products are to be used for research purposes only. They may not be used for any other purpose, including, but not limited to, use in drugs, in vitro diagnostic purposes, therapeutics, or in humans. Clontech products may not be transferred to third parties, resold, modified for resale, or used to manufacture commercial
products or to provide a service to third parties without written approval of Clontech Laboratories, Inc.
Milli-Q® is a registered trademark of Millipore Corporation.
Microsoft® is a registered trademark of Microsoft Corporation.
ScanArray® is a registered trademark of PerkinElmer, Inc.
GenePix™ is a trademark of Axon Instruments.
BD Falcon™ is a trademark of Becton, Dickinson and Company.
Clontech, the Clontech logo and all other trademarks are the property of Clontech Laboratories, Inc., unless noted otherwise.
Clontech is a Takara Bio Company. ©2011 Clontech Laboratories, Inc.
Clontech Laboratories, Inc. www. clontech.com
A Takara Bio Company
Protocol No. PT3648-1
Version No. PR123821
35