1
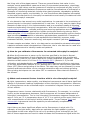
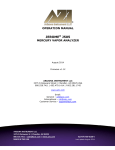
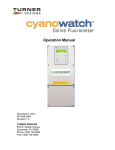
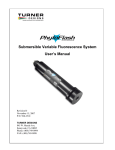
Frequently Asked Questions About Fluorometric Chlorophyll Analysis
Q: Why measure chlorophyll?
A: All plant life contains the primary photosynthetic pigment chlorophyll a. Microscopic,
planktonic plants, or phytoplankton, occupy the lit zone of all water bodies. With over
70% of the surface of the earth covered in water, phytoplankton and photosynthetic
bacteria are responsible for almost ½ of the planets primary production while their
total biomass comprises less then 1% of the total plant biomass. These extraordinarily
efficient plants also act as the single largest CO2 sink on earth. For these reasons alone
it should be clear that there is an interest in measuring concentrations of
phytoplankton. Chlorophyll a fluorescence is the most versatile, sensitive and easy way
to measure the concentrations of phytoplankton in water.
The quantitation, through extracted analysis, or estimation, through in vivo analysis, of
chlorophyll a concentration supplies information on the abundance of phytoplankton
present in all aquatic environments. Since chlorophyll-containing organisms are the
first step in most food chains, the health and /or abundance of these primary
producers will have cascading effects to all higher organisms. Therefore, the
determination of chlorophyll concentration is one of the key indices in monitoring the
health of any natural system.
Chlorophyll measurements are also used to directly monitor phytoplankton populations.
Examples include, but are not limited to, the monitoring of chlorophyll in natural
marine and freshwater environments, reservoirs, water and sewage treatment plants,
and aquacultural systems.
Q: How do fluorometers detect and quantify chlorophyll a in water?
A: Fluorescence is the phenomena of some compounds to absorb specific wavelengths
of light and almost instantaneously emit longer wavelengths of light. Chlorophyll a
naturally absorbs blue light and emits, or fluoresces, red light. Fluorometers detect
chlorophyll a by transmitting an excitation beam of light in the blue range (440nm for
extracted analysis and 460nm for in vivo analysis) and by detecting the light fluoresced
by cells or chlorophyll in a sample at 685nm (red). Generally, this fluorescence is
directly proportional to the concentration of the material in question.
Q: What is the difference between in vivo, in vitro , and extracted chlorophyll
analysis?
A: In vitro (meaning 'in glass' and referring to 'in an artificial environment or outside
the living organism') chlorophyll analysis is another term for extracted analysis. It
entails the concentration of chlorophyll containing cells onto a filter followed by the
extraction of the chlorophyll a from the cells. In vivo (meaning 'within a living
organism') chlorophyll analysis simply refers to the analysis of chlorophyll in the
natural environment or, in our case, in the living algal cells.
Q: What is in vivo chlorophyll analysis?
A: In vivo chlorophyll analysis is the fluorescent detection of chlorophyll a in living
algal and cyanobacterial cells in water. In this technique, the excitation light from the
fluorometer passes through the untreated sample water and excites chlorophyll within
the living cells of the algae present. There are several factors that make in vivo
analysis a semi-quantitative measure at best. Environmental parameters, physiology,
morphology, light history and the presence of interfering compounds all play a role in
altering the relationship between fluorescence and the concentrations of chlorophyll a.
Examples of interfering materials include other plant pigments, degradation products,
dissolved organic matter, and turbidity. In vivo fluorescence data supplies information
on the relative distribution of chlorophyll concentrations and usually correlate well with
extracted chlorophyll a samples.
In vivo detection has several very useful applications. An example is the monitoring of
general trends in chlorophyll concentrations in real time. It is very easy to obtain large
amounts of data using in vivo instrumentation and is an excellent means of following
trends and estimating chlorophyll concentration. With the introduction of the SCUFA®
submersible fluorometer, verticals profiling and mooring applications are now possible.
Other examples of in vivo applications include continuous monitoring along a ship's
track using the 10-AU configured with a flowcell and discrete sampling used to monitor
algal concentrations in natural or laboratory phytoplankton populations. Examples of
discrete sampling applications include aquaculture and hatchery systems, water
treatment facilities, reservoir monitoring, and aquatic research (see the Aquafluor™).
If water samples are taken, the in vivo data can be correlated to extracted chlorophyll
a data to estimate actual concentrations. Otherwise, the in vivo data can be used as a
relative measurement to identify trends and patterns.
Q: How do you calibrate a fluorometer for extracted chlorophyll a analysis?
A: Allow the fluorometer to warm-up for the time specified in the User's Manual.
Measure the fluorescence of each standard at sensitivity settings that provide midscale readings (refer to your User's Manual for proper calibration procedures). Follow
directions under section 10.0 from E.P.A. Method 445.0 (Revision 1.2) for the
calibration and standardization procedure using the traditional acidification technique
or the non-acidification method. E.P.A. Method 445.0 calls for filtering onto glass fiber
filters (GFF) filters and grinding of the filters. This step may not be necessary in some
systems and tests should be run to compare extractions with and without grinding.
Non-grinding techniques can use either GFF or membrane filters that will dissolve in
the solvent.
Q: What environmental factors interfere with in vivo chlorophyll analysis?
A: Light, temperature, water quality, and dissolved components can all have significant
effects on fluorescent readings independent of the chlorophyll concentration. However,
all of these factors can be controlled and/or corrected to a degree if the user is aware
of their effects.
Temperature has an inverse relationship with fluorescence. For example, in a vertical
profile, as the temperature decreases, the fluorescence will increase independent of
chlorophyll concentration. The in vivo chlorophyll fluorescence response changes at a
rate of 1.4% per °C. A temperature drop of 10 °C in a vertical profile would result in a
14% overestimation of chlorophyll at the coldest point. Turner Designs' field and
submersible instruments have the capability to automatically compensate for
temperature effects.
Light history can have significant affects on the fluorescence in algal cells. For
example, at low light levels, algal cells can optimize the light uptake by pushing
chloroplasts to the outer edge of the cell or by producing more chlorophyll per cell.
Both of these responses can result in data increases the fluorescence signal while the
algal biomass may be unchanged. To lessen the effects, opaque hose should always be
used when sampling natural waters with a field fluorometer. The transport time of the
water in the hose will dark-adapt cells to an extent, significantly reducing fluorescence
error caused by variations in the light history of the cells.
Dissolved organic matter (DOM), chlorophyll degradation products (pheophytins),
chlorophyll b & c and turbidity can also falsely increase the chlorophyll a fluorescence
signal. If the dissolved interfering compounds are suspected to be significant, it is
worth conducting a quick study to look at the effects by comparing the fluorescence
from filtered and non-filtered water samples or from noting the fluorescence signal
below the photic zone and using this value as a blank.
Q: What is the effect of varying species on fluorometric chlorophyll analysis?
A: Different species of phytoplankton have varied morphologies (cell packaging),
physiological states, size, and chlorophyll a : carbon ratios. All of these factors can
affect the fluorescence emitted from a cell under a specific excitation light intensity.
Luckily, in natural environments, the phytoplankton assemblage is diverse enough that
much of the variation in fluorescence resulting from the factors above balance
eachother out so the net effect on the fluorescence reading is reduced. Nevertheless,
the researcher needs to be aware of the potential for error in readings caused by these
factors to better interpret in vivo data.
Q: How does other chlorophylls and degradation products affect extracted
chlorophyll analysis?
A: All chlorophyll pigments and their degradation products (pheophytins) have their
own unique excitation and emission spectra. Unfortunately, these spectra overlap
significantly with the fluorescence spectra of chlorophyll a due to the similar chemical
structure (see Figure 2). Due to the overlap in fluorescence spectra, the presence of
one can result in an interference in the measurement of another, resulting in an under
or overestimation of the pigment in question.
In the case of chlorophyll a, interfering pigments to be aware of are chlorophyll b,
chlorophyll c, and pheophytin a (see figure 3). Chlorophyll b causes the most
interference in freshwater systems with high concentrations of chlorophytes and/or
prasinophytes and in marine systems with high concentrations of prochlorophytes. In
chlorophyll extraction, the interference results during the acidification step of the
traditional extraction technique. Chlorophyll b undergoes a wavelength shift when
acidified, resulting in an underestimation of chlorophyll a and an overestimation of
pheophytin. In environments with high chlorophyll b concentrations, we strongly
recommend using the Welschmeyer (non-acidification) method.
High concentrations of chlorophyll c can result in a slight overestimation of chlorophyll
a and an underestimation of pheophytin a sometimes even resulting in negative
pheophytin readings. It has been reported that a chl a : chl b ratio of 1 : 1 , which is
the highest ratio which could occur in nature, would result in a chl a overestimation of
10%.
High concentrations of any of the interfering compounds will result in an increase to in
vivo chlorophyll readings. The magnitude of the increase will depend on the
instrumentation used. Instruments using filters with a wider bandpass will be more
effected by interfering compounds than instrument with narrower bandpass filters.
Q: What is a secondary standard?
A: A secondary standard is used as an alternative to a primary calibration standard. It
is often used when primary standards are expensive, difficult to obtain, or unstable. In
the case of chlorophyll a, a secondary standard can be used the majority of time for
calibration because liquid chlorophyll a standards are expensive, time-consuming, and
photosensitive. To properly use a secondary standard, you must first calibrate with a
primary liquid standard of the fluorophore of interest. You can then obtain the
equivalent value of the secondary standard. Henceforth, you may calibrate using the
secondary standard using the value you obtained for it initially. An occasional
calibration using a primary standard to recheck the stability is recommended.
In the past, secondary standards have been more stable than the primary standards
they mimic, but have still required special storage and handling conditions with
relatively short lifetimes. Examples of these include coproporphrin and fluorescent dyes
such as Rhodamine WT.
Turner Designs has developed a solid secondary standard that is stable under ambient
light and temperatures with no special treatment or storage required. This new
secondary standard will greatly reduce time, cost, and trouble in fluorescent
chlorophyll analysis procedure.
Q: What is the best solvent and procedure for the extraction of chlorophyll a?
A: The most commonly used extraction solvent is a 90% acetone 10% DI water
solution. Other solvents, such as methanol, ethanol and acetone/DMSO mixtures are
also commonly used and can improve extraction efficiency with specific phytoplankton
or may be found useful for the extraction of sediment samples.
There is no 'best' solvent or procedure for chlorophyll extraction. Several work well and
have their own pros and cons. The E.P.A. Method 445.0 describes the recommended
step-by-step process for analysis using 90% acetone. There are many factors in the
extraction process that can lead to different results. Several examples of these factors
will be discussed below in hopes reducing some of the variability.
An excellent resource for sample collection, storage and extraction methods is the
UNESCO publication, Phytoplankton Pigments in Oceanography.
Water collection, storage, and filtration:
Because pigment is being extracted from living cells, it is critical to use consistent
techniques of obtaining water, filtering and storing filters. The living cell is sensitive to
changes in the environment such as temperature and light. Conditions leading to cell
death or damage will affect chlorophyll concentrations.
In the collection of water samples, it is important to make certain that the collection
containers are clean of all chemicals. They should be rinsed several times in the
sample water. Once collected, if samples cannot be filtered immediately, they should
be stored quickly on ice in the dark. The time between collection and filtration should
be as brief as possible and should not exceed 4 hrs.
Specifics on the recommended filtration and storage procedure can be found in E.P.A.
Method 445.0. An excellent resource for sample collection, storage and extraction
methods is the UNESCO publication, Phytoplankton Pigments in Oceanography.
Q: How do I take and store discrete water samples in the field?
A: For discrete in vivo analysis, water samples should be measured as soon as possible
after collection. The same time constraints should be placed on the filtering of water
samples that are to be used for extracted analysis. From the time of collection to
measurement, the samples should be stored in the dark on ice. Remember that the
cells are living and significant time in a container will alter the physiological state of the
algal cells, resulting in misrepresented chlorophyll data compared to the natural
situation.
Discrete samples need to be kept at the same temperature. This is most easily
accomplished through the use of a water bath. The bath should be covered from direct
light. When the samples are being measured in the fluorometer, a 'time in the
instrument' must be established. Use the discrete sample averaging function on the 10AU or TD-700 Fluorometer or wait for the reading to stabilize (~10 seconds) and
record the fluorescence. If this time is not monitored the heat and light in the
instrument will cause fluorescence to change.
When developing you own sample collection and storage procedures, it is
recommended to run your own experiment to test change in fluorescence over a given
transport time by analyzing samples from a given sample at hour or half-hour
intervals.
Q: How do I calculate actual chlorophyll a concentrations from my
fluorometric data?
A: ACIDIFICATION METHOD
Prior to running sample on the fluorometer, the instrument must be calibrated with a
pure chlorophyll a standard and the maximum acid ratio must be determined by
measuring the fluorescence of the standard before and after acidification. If a
fluorometer other than a digital Turner Designs instrument is being used, the
fluorometer sensitivity coefficient may also need to be determined. For further
information please refer to EPA Method 445.0.
chl a =K (Fm/ Fm -1) x (Fb-Fa) x (v/V)
pheo a =K (Fm/ Fm -1) x [(Fm x Fa - Fb)] x (v/V)
If necessary, the result can be multiplied by a dilution factor.
where:
K= sensitivity coefficient, equal to 1 on 10-AU
Fm = max acid ratio Fb/Fa of pure chlorophyll a standard
Fb = fluorescence before acidification
Fa = fluorescence after acidification
Fo = fluorescence signal of sample
v = extract volume (L)
V= volume filtered (L)
NON-ACIDIFICATION METHOD (Chlorophyll a concentration only)
1) Collect fluorescence data (one number/sample)
** DO NOT ACIDIFY**
2) Plug data into following equation:
chl a = (Fo x v)/ V
where:
Fo = fluorescence signal of sample
v = extract volume (L)
V= volume filtered (L)
Q: Does the E.P.A. approve fluorometric chlorophyll analysis?
A: Yes, the E.P.A. has published Method 445.0 which covers the in vitro(extraction)
fluorometric analysis of chlorophyll a. In the most recent revision (Rev 1.2 Sept.,
1997), the E.P.A. also approves the use of the non-acidification method, which is less
susceptible to interfering compounds such as chlorophyll b. This filter kit supplies only
chlorophyll a concentrations with no information on pheophytin concentration.
Q: How can I compare chlorophyll data obtained through different
measurement techniques?
A: All detection instrumentation used in chlorophyll analysis will result in chlorophyll
concentrations that are directly comparable. A side-by-side comparison between a
fluorometer and a spectrophotometer is easily done but would require dilution of the
chlorophyll sample to put it within the linear range of the fluorometer. A sample that is
in range on a spectrophotometer will be over-range on a fluorometer.
Q: Why use a fluorometer over a spectrophotometer for extracted chlorophyll
analysis?
A: Benefits of fluorescence over spectrophotometry include the capability of in vivo
detection, sensitivity, durability, versatility (accepts a wide range of discrete sample
cells and flow cells, accepts AC or DC power, and the user can choose and quickly
change between many optical kits), ease of use, stability, ease of transport, and a
small footprint.
For oceanographic research, the greater sensitivity of fluorescence results in less time
and work in the analysis because much less water must be filtered for extracted
analysis. The superior sensitivity also enables in vivo detection of chlorophyll
concentration of <1µg/L.
Freshwater researchers now have an extremely accurate and easy way to measure
chlorophyll a even with high chlorophyll b concentrations using the non-acidification
optical kit. Fluorometers also allow for in-line monitoring to collect data in real time.
Q: What are the chlorophyll detection limits of Turner Designs Fluorometers?
A: The TD-700 Laboratory Fluorometer and the 10-AU Field Fluorometer with a red
sensitive photomultiplier tube (PMT), have extracted chlorophyll detection limits of
0.02µg/L using a 13mm diameter test tube and 0.01µg/L using a 25mm test tube. The
SCUFA® Submersible Fluorometer can detect in vivo chlorophyll concentrations to
0.02µg/L.
FIG.
1USGS,
1998
FIG. 2
FIG. 3
Turner Designs manufactures more fluorometers and research grade
luminometers than any other company in the world.
fluorometer.committed™