
1
www.allitebooks.com
Mastering Zabbix
Second Edition
Learn how to monitor your large IT environments using
Zabbix with this one-stop, comprehensive guide to the
Zabbix world
Andrea Dalle Vacche
BIRMINGHAM - MUMBAI
www.allitebooks.com
Mastering Zabbix
Second Edition
Copyright © 2015 Packt Publishing
All rights reserved. No part of this book may be reproduced, stored in a retrieval
system, or transmitted in any form or by any means, without the prior written
permission of the publisher, except in the case of brief quotations embedded in
critical articles or reviews.
Every effort has been made in the preparation of this book to ensure the accuracy
of the information presented. However, the information contained in this book is
sold without warranty, either express or implied. Neither the author, nor Packt
Publishing, and its dealers and distributors will be held liable for any damages
caused or alleged to be caused directly or indirectly by this book.
Packt Publishing has endeavored to provide trademark information about all of the
companies and products mentioned in this book by the appropriate use of capitals.
However, Packt Publishing cannot guarantee the accuracy of this information.
First published: December 2013
Second edition: September 2015
Production reference: 1080915
Published by Packt Publishing Ltd.
Livery Place
35 Livery Street
Birmingham B3 2PB, UK.
ISBN 978-1-78528-926-2
www.packtpub.com
www.allitebooks.com
Credits
Author
Project Coordinator
Andrea Dalle Vacche
Reviewers
Sanchita Mandal
Proofreader
Grigory Chernyshev
Safis Editing
Nitish Kumar
Indexer
Nicholas Pier
Timothy Scoppetta
Commissioning Editor
Dipika Gaonkar
Kevin Colaco
Parag Topre
Sheetal Aute
Jason Monteiro
Abhinash Sahu
Content Development Editor
Technical Editor
Graphics
Disha Haria
Acquisition Editor
Adrian Raposo
Monica Ajmera Mehta
Production Coordinator
Nilesh R. Mohite
Cover Work
Nilesh R. Mohite
Copy Editor
Sarang Chari
www.allitebooks.com
About the Author
Andrea Dalle Vacche is a highly skilled IT professional with over 15 years of
industry experience.
He graduated from Univeristà degli Studi di Ferrara with an information technology
certification. This laid the technology foundation that Andrea has built on ever since.
He has acquired various other industry-respected accreditations from big players
in the IT industry, which include Cisco, Oracle, ITIL, and of course, Zabbix. He also
has a Red Hat Certified Engineer certification. Throughout his career, he has worked
on many large-scale environments, often in roles that have been very complex, on a
consultant basis. This has further enhanced his growing skillset, adding to his practical
knowledge base and concreting his appetite for theoretical technical studying.
Andrea's love for Zabbix came from the time he spent in the Oracle world as a
database administrator/developer. His time was mainly spent on reducing "ownership
costs" with specialization in monitoring and automation. This is where he came
across Zabbix and the technical and administrative flexibility that it offered. With
this as a launch pad, Andrea was inspired to develop Orabbix, the first piece of open
source software to monitor Oracle that is completely integrated with Zabbix. He has
published a number of articles on Zabbix-related software, such as DBforBIX. His
projects are publicly available on his website at http://www.smartmarmot.com.
Currently, Andrea is working as a senior architect for a leading global investment
bank in a very diverse and challenging environment. His involvement is very wide
ranging, and he deals with many critical aspects of the Unix/Linux platforms and
pays due diligence to the many different types of third-party software that are
strategically aligned to the bank's technical roadmap.
Andrea also plays a critical role within the extended management team for the
security awareness of the bank, dealing with disciplines such as security, secrecy,
standardization, auditing, regulator requirements, and security-oriented solutions.
In addition to this book, he has also authored the following books:
• Mastering Zabbix, Packt Publishing
• Zabbix Network Monitoring Essentials, Packt Publishing
www.allitebooks.com
Acknowledgments
First, I would like to thank my wife, Anna, for her support and encouragement
during the writing of this book. I highly appreciate her help and advice. Many
thanks to Fifi for her relaxing company and fluffy stress relief.
I would like to give a special thanks to the whole team at Packt Publishing and a
particular thanks to Adrian. Their advice, effort, and suggestions have been really
valuable. The whole team has been very professional and helpful.
www.allitebooks.com
About the Reviewers
Grigory Chernyshev is senior release manager / DevOps engineer in the Online
Games department at Mail.Ru Group. He specializes in managing configurations,
automating the build pipeline, monitoring, releasing versions, and writing scripts
in Python. He has experience in projects such as Allods Online and Skyforge—AAA
MMORPG games that are known around the globe. In his regular work, he uses
Zabbix to monitor internal game servers, heterogeneous build agents, and a lot of
infrastructure servers.
Besides that, he writes plugins for Atlassian Jira and JetBrains Teamcity—for the
latter, he even won the 2015 WordPress Plugins contest!
I would like to thank my wife for her patience, my parents for my
happy childhood, and the project coordinator, Sanchita, for her
never-ending enthusiasm and support.
Nitish Kumar is a Wintel lead at HT Media Ltd. and an independent tech
blogger on various technologies. He has been working on several Microsoft
technologies and open source solutions (including, but not limited to, Spiceworks,
ManageEngine products, Zabbix, MS Active Directory, MS Exchange Servers, and
so on) for 8 years now, of which the last couple of years have been spent on bringing
cost-effective solutions to corporates to simplify their complex requirements and
improve the time management of their staff. Nitish is a technology enthusiast and
has been a participant at various corporate events and public webinars. Mobile
technologies are of special interest to him and he often writes about various
gadgets and technologies. Nitish holds an MS degree in software from J.K Institute
of Applied Physics and Technology, and his areas of interest include Microsoft
technologies, open source software, and mobile gadgets. He occasionally blogs at
http://nitishkumar.net and can be reached at [email protected].
www.allitebooks.com
Nitish coauthored Getting Started with Spiceworks, Packt Publishing. Also, he has been
a technical reviewer for other books on topics such as Zabbix and Spiceworks.
Nicholas Pier is a network engineer in the managed services and professional
services fields. His experience includes web development, designing data center
network infrastructures with virtualization and SAN solutions, and writing
middleware for business applications. As of this date, Nicholas holds a number
of industry certifications, including Cisco CCNP, VMware VCP-DCV, and various
other Cisco and CompTIA certifications. He has a passion for craft beer, longdistance running, and reading, in which he indulges in his free time.
Timothy Scoppetta is a systems engineer who specializes in automation,
continuous integration, and creating fault-tolerant infrastructures. Having held
positions at Google and a number of start-ups, he now focuses on bringing cuttingedge tools and industry best practices to higher education.
www.allitebooks.com
www.PacktPub.com
Support files, eBooks, discount offers, and more
For support files and downloads related to your book, please visit.
Did you know that Packt offers eBook versions of every book published, with PDF
and ePub files available? You can upgrade to the eBook version at www.PacktPub.
com and as a print book customer, you are entitled to a discount on the eBook copy.
Get in touch with us at [email protected] for more details.
At www.PacktPub.com, you can also read a collection of free technical articles, sign
up for a range of free newsletters and receive exclusive discounts and offers on Packt
books and eBooks.
TM
https://www2.packtpub.com/books/subscription/packtlib
Do you need instant solutions to your IT questions? PacktLib is Packt's online digital
book library. Here, you can search, access, and read Packt's entire library of books.
Why subscribe?
• Fully searchable across every book published by Packt
• Copy and paste, print, and bookmark content
• On demand and accessible via a web browser
Free access for Packt account holders
If you have an account with Packt at www.PacktPub.com, you can use this to access
PacktLib today and view 9 entirely free books. Simply use your login credentials for
immediate access.
www.allitebooks.com
Table of Contents
Prefacevii
Chapter 1: Deploying Zabbix
1
Defining the environment size
Zabbix architectures
Installing Zabbix
2
3
6
Prerequisites8
Setting up the server
9
Setting up the agent
Installing and creating the package
Installing from packages
Configuring the server
11
11
13
14
Installing the database
Some considerations about the database
Sizing the database
Some considerations about housekeeping
The web interface
16
27
29
32
39
Capacity planning with Zabbix
46
The web wizard – frontend configuration
The observer effect
Deciding what to monitor
Defining a baseline
Load testing
Forecasting the trends
40
46
46
48
49
51
Summary
Chapter 2: Distributed Monitoring
Zabbix proxies
Deploying a Zabbix proxy
Zabbix's runtime proxy commands
Deploying a Zabbix proxy using RPMs
Considering a different Zabbix proxy database
[i]
www.allitebooks.com
52
53
54
56
58
59
64
Table of Contents
Understanding the Zabbix monitoring data flow
Understanding the monitoring data flow with proxies
Monitoring Zabbix proxies
Security considerations
No network configuration
Network isolation
Simple tunnels
66
67
69
71
72
73
73
Secure Shell
73
Stunnel75
A full-blown VPN
76
Summary77
Chapter 3: High Availability and Failover
Understanding high availability
Understanding the levels of IT service
Some considerations about high availability
Automating switchover/failover with a resource manager
Replicating the filesystem with DRBD
Implementing high availability on a web server
Configuring HTTPD HA
Understanding Pacemaker and STONITH
Pacemaker – is Quorum really needed?
Pacemaker – the stickiness concept
Pacemaker – configuring Apache/HTTPD
Configuring the Zabbix server for high availability
Implementing high availability for a database
Clustering of PostgreSQL
Mirrored logical volume with LVM and DRDB
Prerequisite tasks to start with DRBD on LVM
Creating a DRBD device on top of the LVM partition
Enabling resources in DRBD
Defining a primary device in DRDB
Creating a filesystem on a DRBD device
79
80
81
82
83
84
85
86
88
89
90
90
94
95
97
98
99
100
101
103
104
Pacemaker clusters – integrating DRBD
105
DRBD performance and optimization
110
Enabling the DRBD configuration
Pacemaker – the LVM configuration
Pacemaker – configuring PostgreSQL
Pacemaker – the network configuration
Pacemaker – the final configuration
Cluster configuration – the final test
DRBD efficient synchronization
Enabling DRBD online verification
DRBD – some networking considerations
106
106
107
108
108
109
111
112
113
Summary116
[ ii ]
Table of Contents
Chapter 4: Collecting Data
Gathering items as raw data
Understanding the data flow for Zabbix items
Understanding Zabbix trapper items
The data flow overview
Database monitoring with Zabbix
Delving into ODBC
Installing database drivers
MySQL ODBC drivers
PostgreSQL ODBC drivers
Oracle ODBC drivers
unixODBC configuration files
Compiling Zabbix with ODBC
Database monitor items
Some considerations about the ODBC SQL query
117
118
120
122
123
124
124
125
126
127
129
130
131
132
134
Zabbix JMX monitoring
Considering JMX security aspects
Installing a Zabbix Java gateway
Configuring Zabbix JMX
135
136
137
140
Zabbix SNMP monitoring
SNMP queries
SNMP traps
143
146
149
JMX keys in detail
Issues and considerations about JMX
142
142
The snmptrapd process
The perl trap handler
149
151
Monitoring Zabbix SSH
155
Configuring the SSH key authentication
156
Monitoring Zabbix IPMI
158
The first steps with IPMI
158
Configuring IPMI accounts
160
Configuring Zabbix IPMI items
162
Monitoring the web page
164
Authenticating web pages
166
Logging out
171
Aggregated and calculated items
174
Aggregated items
174
Calculated items
176
Summary178
Chapter 5: Visualizing Data
179
Graphs181
Analyzing simple graphs
181
[ iii ]
Table of Contents
Analyzing ad hoc graphs
183
Analyzing custom graphs
187
Hacking ad hoc graphs
185
Reviewing all the combinations of graph properties
Visualizing the data through maps
Creating your first Zabbix map
Important considerations about macros and URLs
Finally, inside the map
Selecting elements
Playing with macros inside maps
Visualizing through screens
Creating a screen
Dynamic elements
Visualizing the date through a slide show
Controlling center slides and the big display challenge
Considerations about slides on a big display
Automated slide show
IT services
Configuring an IT service
Summary
Chapter 6: Managing Alerts
Understanding trigger expressions
Selecting items and functions
Choosing between seconds and a number of measurements
The date and time functions
Trigger severity
Choosing between absolute values and percentages
Understanding operations as correlations
Managing trigger dependencies
Taking an action
Defining an action
The {EVENT.DATE} and {EVENT.TIME} macros
The {INVENTORY.SERIALNO.A} and friends macros
Defining the action conditions
Choosing the action operations
Steps and escalations
Messages and media
Remote commands
193
195
199
201
204
206
208
210
210
212
214
215
216
216
218
219
221
223
224
225
226
227
228
228
229
233
234
235
236
236
236
239
239
241
243
Summary
244
Chapter 7: Managing Templates
245
Creating templates
246
[ iv ]
Table of Contents
Adding entities to a template
Using macros
246
248
Importing and exporting templates
Linking templates to hosts
Nesting templates
Combining templates
Discovering hosts
The active agent auto-registration
Configuring the auto-registration
The real-case scenario
Low-level discovery
Summary
254
256
256
257
258
262
262
263
264
272
User-defined macros
Chapter 8: Handling External Scripts
External checks
The script's placement
Going deep into external checks
Going inside the script
General rules for writing scripts
Considerations about external checks
The user parameter
The flexible user parameter
Considerations about user parameters
Sending data using zabbix_sender
The new script
Writing a wrapper script for check_ora_sendtrap
The pros and cons of the dedicated script server
Working with Zabbix protocols
The Zabbix get protocol
The Zabbix sender protocol
An interesting undocumented feature
Using the clock properties in JSON items
The Zabbix agent protocol
Some more possible responses
253
273
274
274
275
278
280
281
281
282
284
285
286
287
288
289
289
290
292
293
294
296
The low-level discovery protocol
297
Communicating with Zabbix
301
Implementing the Zabbix_sender protocol in Java
301
Implementing the Zabbix sender protocol in Python
303
Some considerations about agent development
305
Summary306
[v]
Table of Contents
Chapter 9: Extending Zabbix
Exploring the Zabbix API
First steps through the API
Authenticating through the API
Using the PyZabbix library
Exploring the Zabbix API with JQuery
Mass operations
Redistributing hosts to proxies
Adding or updating users
Exporting data
Extracting tabular data
Creating graphs from data
The Graphviz suite of programs
Creating a trigger dependency graph
307
308
309
310
313
316
319
320
321
324
324
327
327
329
Generating Zabbix maps from dot files
331
Summary338
Chapter 10: Integrating Zabbix
339
Stepping into WhatsApp
340
Getting ready to send messages
341
Registering the yowsup client
342
Sending the first WhatsApp message
343
Securing the yowsup setup
344
Creating our first Zabbix alert group
347
Integrating yowsup with Zabbix
353
An overview of Request Tracker
359
Setting up RT to better integrate with Zabbix
361
Creating a custom queue for Zabbix
361
Customizing tickets – the links section
362
Customizing tickets – ticket priority
363
Customizing tickets – the custom fields
364
Connecting to the Request Tracker API
367
Setting up Zabbix to integrate with Request Tracker
370
Creating RT tickets from the Zabbix events
373
Summary378
Index379
[ vi ]
Preface
Ever since its first public release in 2001, Zabbix has distinguished itself as a very
powerful and effective monitoring solution. As an open source product, it's easy to
obtain and deploy, and its unique approach to metrics and alarms has helped to set
it apart from its competitors, both open and commercial. It's a powerful, compact
package with very low requirements in terms of hardware and supporting software
for a basic yet effective installation. If you add a relative ease of use, it's clear that it
can be a very good contender for small environments with a tight budget. But it's
when it comes to managing a huge number of monitored objects, with a complex
configuration and dependencies, that Zabbix's scalability and inherently distributed
architecture really shines. More than anything, Zabbix can be an ideal solution
in large and complex distributed environments, where being able to manage
efficiently and extract meaningful information from monitored objects and events
is just as important if not more important than the usual considerations about costs,
accessibility, and the ease of use.
This is a second edition book, the first having been coauthored by Andrea Dalle
Vacche and Stefano Kewan Lee.
The purpose of this book is to help you make the most of your Zabbix installation to
leverage all of its power to monitor any large and complex environment effectively.
[ vii ]
Preface
What this book covers
Chapter 1, Deploying Zabbix, focuses on choosing the optimal hardware and software
configuration for the Zabbix server and database in relation to the current IT
infrastructure, monitoring goals, and possible evolution. This chapter also includes
a section that covers an interesting database-sizing digression, which is useful in
calculating the final database size using a standard environment as the baseline.
Correct environment sizing and a brief discussion about metrics and measurements
that can also be used for capacity planning will be covered here. The chapter contains
practical examples and calculations framed in a theoretical approach to give the
reader the skills required to adapt the information to real-world deployments.
Chapter 2, Distributed Monitoring, explores various Zabbix components both on the server
side and the agent side. Different distributed solutions will be given to the same example
networks to highlight the advantages and possible drawbacks of each. In addition to
the deployment and configuration of agents, the chapter takes proxies, maintenance,
and change management into account too. This section will cover all the possible
architectural implementations of Zabbix and add the pros and cons considerations.
Chapter 3, High Availability and Failover, covers the subjects of high availability and
failover. For each of the three main Zabbix tiers, you will learn to choose among different
HA options. The discussion will build on the information provided in the previous
two chapters in order to end the first part of the book with a few complete deployment
scenarios that will include high-availability servers and databases hierarchically
organized in tiered, distributed architectures geared toward monitoring thousands of
objects scattered in different geographical locations. This chapter will include a realworld, practical example and certain possible scenarios that have been implemented.
Chapter 4, Collecting Data, moves beyond simple agent items and SNMP queries
to tackle a few complex data sources. The chapter will explore powerful Zabbix
built-in functionalities, how to use them, and how to choose the best metrics to
ensure thorough monitoring without overloading the system. There will also be
special considerations about aggregated values and their use in monitoring complex
environments with clusters or the more complex grid architectures.
Chapter 5, Visualizing Data, focuses on getting the most out of the data visualization
features of Zabbix. This is quite a useful chapter, especially if you need to explain
or chase a hardware expansion/improvement to the business unit. You will learn
how to leverage live monitoring data to make dynamic maps and how to organize
a collection of graphs for big-screen visualization in control centers and implement
a general qualitative view. This chapter will cover the data center quality view slide
show completely, which is really useful in highlighting problems and warning the
first-level support in a proactive approach. The chapter will also explore some best
practices concerning the IT services and SLA-reporting features of Zabbix.
[ viii ]
Preface
Chapter 6, Managing Alerts, gives examples of complex triggers and trigger conditions
as well as advice on choosing the right amount of trigger and alerting actions. The
purpose is to help you walk the fine line between being blind to possible problems
and being overwhelmed by false positives. You will also learn how to use actions
to automatically fix simple problems, raise actions without the need for human
intervention to correlate different triggers and events, and tie escalations to your
operations management workflow. This section will make you aware of what
can be automated, reducing your administrative workload and optimizing the
administration process in a proactive way.
Chapter 7, Managing Templates, offers guidelines for effective template management:
building complex template schemes out of simple components, understanding and
managing the effects of template modification, maintaining existing monitored
objects, and assigning templates to discovered hosts. This will conclude the second
part of the book that is dedicated to the different Zabbix monitoring and data
management options. The third and final part will discuss Zabbix's interaction with
external products and all its powerful extensibility features.
Chapter 8, Handling External Scripts, helps you learn how to write scripts to monitor
objects that are not covered by the core Zabbix features. The relative advantages and
disadvantages of keeping the scripts on the server side or agent side, how to launch
or schedule them, and a detailed analysis of the Zabbix agent protocol will also be
covered. This chapter will make you aware of all the possible side effects, delays,
and load caused by scripts; you will be able to implement all the needed external
checks, as you will be well aware of all that is connected with them and the relative
observer effect. The chapter will include different implementations of working with
Bash, Java, and Python so that you can easily write your own scripts to extend and
enhance Zabbix's monitoring possibilities.
Chapter 9, Extending Zabbix, delves into the Zabbix API and how to use it to build
specialized frontends and complex extensions. It also covers how to harvest
monitoring data for further elaboration and reporting. It will include simple example
implementations written in Python that will illustrate how to export and further
manipulate data, how to perform massive and complex operations on monitored
objects, and finally, how to automate different management aspects such as user
creation and configuration, trigger activation, and the like.
Chapter 10, Integrating Zabbix, wraps things up by discussing how to make other
systems know about Zabbix and the other way around. This is key to the successful
management of any large and complex environment. You will learn how to use
built-in Zabbix features, API calls, or direct database queries to communicate with
different upstream and downstream systems and applications. There will be concrete
examples of possible interaction with inventory applications, trouble ticket systems,
and data warehouse systems.
[ ix ]
Preface
Who this book is for
As the book's title is Mastering Zabbix, Second Edition, you won't find any detailed,
step-by-step tutorials (well, except the installation that will be covered from scratch,
but with some useful tips) on the basic usage of Zabbix. Although you may find a lot
of detailed information about installing the server or configuring items, triggers, and
screens, you are expected to have at least a basic, working knowledge of how it all
works so that you can focus on a more advanced approach for the same subjects. That
said, it is possible to profit from the contents of this book even if you have no previous
experience with Zabbix, but in that case, you are strongly encouraged to refer to
the official Zabbix documentation that you can find at https://www.zabbix.com/
documentation/2.4/manual to fill in any possible gaps in your knowledge.
What you need for this book
Before going deep into the Zabbix setup, it is important to know that the proposed
setup covered here has been tested on a large-production environment (more
than 1,800 hosts monitored, more than 89,500 monitored items, and more than
30,000 triggers) and that they can be considered valid for most large and very large
environments. The high-availability solution proposed in this book has been widely
tested, not purely as a disaster recovery exercise but during a real disaster (network
cables were accidentally sheared by an excavating machine).
In this book, it is important to understand that most of the choices made have been
on a practical basis and not driven by passion. One of the main choices made is using
PostgreSQL as the official Zabbix RDBMS. We came across PostgreSQL as an RDBMS
mostly for the mature and production ready features offered:
• Hot backup is available by design
• Atomicity, consistency, isolation, and durability—in short, it is fully
ACID compliant
• Many different, native standby configurations (hot standby, synchronous
replication, and so on)
• Efficient partitioning
Zabbix's database is a critical component, especially if you need to keep historical
data available and guarantee constant performances day by day while the database
is growing.
[x]
Preface
We have made some assumptions in this book: the packaging system used in our
examples is yum, and then the distribution is obviously Red Hat Enterprise Linux.
Anyway, excluding details such as package names and packet manager, the whole
book is valid for all the Linux distributions. Furthermore, the proposed architectures
and their implementations are not directly tied to a particular distribution. We did
not use any Red Hat-specific clustering system or make any choice that you cannot
reproduce on your favorite Linux distribution.
On reading this book, you will find different pieces of open source software, but out
of all of them, it would be better if you are familiar with the following:
•
•
•
•
Apache: http://www.apache.org/
Pacemaker: http://clusterlabs.org/
PostgreSQL: http://www.postgresql.org/
DRBD: http://www.drbd.org
This book also focuses on system administrators who have some programming
skills. We propose different workings for the implemented code snippet. With the
proposed example, all well documented, you should be able to implement your own
plugin or external software that is fully integrated with Zabbix. The code snippets
proposed are in two different and widely diffused languages: Java and Python.
These cover most of the current programmers' preferences and show, once you know
how to implement the Zabbix protocol, how simple it is to switch between them.
Zabbix is more than a piece of monitoring software; it is an open source monitoring
solution that can be explained as you want, and this book will make you aware of all
the pros and cons of the possible solutions.
So, now it is time to go deep into Zabbix land!
Conventions
In this book, you will find a number of styles of text that distinguish between
different kinds of information. Here are some examples of these styles, and an
explanation of their meaning.
Code words in text, database table names, folder names, filenames, file extensions,
pathnames, dummy URLs, user input, and Twitter handles are shown as follows:
"Most of these parameters are contained inside the php.ini file."
[ xi ]
www.allitebooks.com
Preface
A block of code is set as follows:
zabbixsrv=zabbixsvr
[ -e /etc/sysconfig/$syscf ] && . /etc/sysconfig/$syscf
start()
{
echo -n $"Starting Zabbix server: "
When we wish to draw your attention to a particular part of a code block, the
relevant lines or items are set in bold:
; Maximum size of POST data that PHP will accept.
; http://www.php.net/manual/en/ini.core.php#ini.post-max-size
post_max_size = 16M
Any command-line input or output is written as follows:
# yum list postgres*
New terms and important words are shown in bold. Words that you see on the
screen, in menus or dialog boxes for example, appear in the text like this: "Once we
fill this form, we can click on Next."
Warnings or important notes appear in a box like this.
Tips and tricks appear like this.
Reader feedback
Feedback from our readers is always welcome. Let us know what you think about
this book—what you liked or may have disliked. Reader feedback is important for us
to develop titles that you really get the most out of.
To send us general feedback, simply send an e-mail to [email protected],
and mention the book title via the subject of your message.
If there is a topic that you have expertise in and you are interested in either writing
or contributing to a book, see our author guide on www.packtpub.com/authors.
[ xii ]
Preface
Customer support
Now that you are the proud owner of a Packt book, we have a number of things to
help you to get the most from your purchase.
Downloading the example code
You can download the example code files for all Packt books you have purchased
from your account at http://www.packtpub.com. If you purchased this book
elsewhere, you can visit http://www.packtpub.com/support and register to have
the files e-mailed directly to you.
Errata
Although we have taken every care to ensure the accuracy of our content, mistakes do
happen. If you find a mistake in one of our books—maybe a mistake in the text or the
code—we would be grateful if you would report this to us. By doing so, you can save
other readers from frustration and help us improve subsequent versions of this book.
If you find any errata, please report them by visiting http://www.packtpub.com/
submit-errata, selecting your book, clicking on the errata submission form link,
and entering the details of your errata. Once your errata are verified, your submission
will be accepted and the errata will be uploaded on our website, or added to any list
of existing errata, under the Errata section of that title. Any existing errata can be
viewed by selecting your title from http://www.packtpub.com/support.
Piracy
Piracy of copyright material on the Internet is an ongoing problem across all media.
At Packt, we take the protection of our copyright and licenses very seriously. If you
come across any illegal copies of our works, in any form, on the Internet, please
provide us with the location address or website name immediately so that we can
pursue a remedy.
Please contact us at [email protected] with a link to the suspected pirated
material.
We appreciate your help in protecting our authors, and our ability to bring you
valuable content.
Questions
You can contact us at [email protected] if you are having a problem with
any aspect of the book, and we will do our best to address it.
[ xiii ]
Deploying Zabbix
If you are reading this book, you have, most probably, already used and installed
Zabbix. Most likely, you did so on a small/medium environment, but now things
have changed, and your environment today is a large one with new challenges
coming in regularly. Nowadays, environments are rapidly growing or changing, and
it is a difficult task to be ready to support and provide a reliable monitoring solution.
Normally, an initial deployment of a system, a monitoring system, is done by
following a tutorial or how-to, and this is a common error. This kind of approach is
valid for smaller environments, where the downtime is not critical, where there are
no disaster recovery sites to handle, or, in short, where things are easy.
Most likely, these setups are not done by looking forward to the possible new
quantity of new items, triggers, and events that the server should elaborate. If you
have already installed Zabbix and you need to plan and expand your monitoring
solution, or, instead, you need to plan and design the new monitoring infrastructure,
this chapter will help you.
This chapter will also help you to perform the difficult task of setting up/upgrading
Zabbix in large and very large environments. This chapter will cover every aspect
of this task, starting with the definition of a large environment until using Zabbix
as a capacity planning resource. The chapter will introduce all the possible Zabbix
solutions, including a practical example with an installation ready to handle a large
environment, and go ahead with possible improvements.
At the end of this chapter, you will understand how Zabbix works, which tables
should be kept under special surveillance, and how to improve the housekeeping on a
large environment, which, with a few years of trends to handle, is a really heavy task.
[1]
Deploying Zabbix
This chapter will cover the following topics:
• Knowing when you are in front of a large environment and defining when an
environment can be considered a large environment
• Setting up/upgrading Zabbix on a large environment and a very large
environment
• Installing Zabbix on a three-tier system and having a readymade solution to
handle a large environment
• Database sizing and finally knowing the total amount of space consumed by
the data acquired by us
• Knowing the database's heavy tables and tasks
• Improving the housekeeping to reduce the RDBMS load and improving the
efficiency of the whole system
• Learning fundamental concepts about capacity planning bearing in mind that
Zabbix is a capacity-planning tool
Defining the environment size
Since this book is focused on a large environment, we need to define or at least
provide basic fixed points to identify a large environment. There are various things to
consider in this definition; basically, we can identify an environment as large when:
• There are more than one different physical locations
• The number of monitored devices is high (hundreds or thousands)
• The number of checks and items retrieved per second is high (more than 500)
• There are lots of items, triggers, and data to handle (the database is larger
than 100 GB)
• The availability and performance are both critical
All of the preceding points define a large environment; in this kind of environment,
the installation and maintenance of Zabbix infrastructure play a critical role.
The installation, of course, is a task that is defined well on a timely basis and,
probably, is one of the most critical tasks; it is really important to go live with
a strong and reliable monitoring infrastructure. Also, once we go live with the
monitoring in place, it will not be so easy to move/migrate pieces without any loss
of data. There are certain other things to consider: we will have a lot of tasks related
to our monitoring system, most of which are daily tasks, but in a large environment,
they require particular attention.
[2]
Chapter 1
In a small environment with a small database, a backup will keep you busy for a few
minutes, but if the database is large, this task will consume a considerable amount of
time to be completed.
The restore and relative-restore plans should be considered and tested periodically to
be aware of the time needed to complete this task in the event of a disaster or critical
hardware failure.
Between maintenance tasks, we need to consider testing and putting into production
upgrades with minimal impact, along with the daily tasks and daily checks.
Zabbix architectures
Zabbix can be defined as a distributed monitoring system with a centralized web
interface (on which we can manage almost everything). Among its main features, we
will highlight the following ones:
• Zabbix has a centralized web interface
• The server can be run on most Unix-like operating systems
• This monitoring system has native agents for most Unix, Unix-like, and
Microsoft Windows operation systems
• The system is easy to integrate with other systems, thanks to the API
available in many different programming languages and the option that
Zabbix itself provides
• Zabbix can monitor via SNMP (v1, v2, and v3), IPMI, JMX, ODBC, SSH,
HTTP(s), TCP/UDP, and Telnet
• This monitoring system gives us the possibility of creating custom items and
graphs and interpolating data
• The system is easy to customize
The following diagram shows the three-tier system of a Zabbix architecture:
[3]
Deploying Zabbix
The Zabbix architecture for a large environment is composed of three different
servers/components (that should be configured on HA as well). These three
components are as follows:
• A web server
• A database server
• A Zabbix server
The whole Zabbix infrastructure in large environments allows us to have two other
actors that play a fundamental role. These actors are the Zabbix agents and the
Zabbix proxies. An example is represented in the following figure:
On this infrastructure, we have a centralized Zabbix server that is connected to
different proxies, usually one for each server farm or a subnetwork.
[4]
Chapter 1
The Zabbix server will acquire data from Zabbix proxies, the proxies will acquire
data from all the Zabbix agents connected to it, all the data will be stored on a
dedicated RDBMS, and the frontend will be exposed with a web interface to the
users. Looking at the technologies used, we see that the web interface is written in
PHP and that the server, proxies, and agents are written in C.
The server, proxies, and agents are written in C to give
the best performance and least resource usage possible.
All the components are deeply optimized to achieve the
best performance.
We can implement different kinds of architecture using proxies. There are several
types of architectures and, in the order of complexity, we find the following ones:
• The single-server installation
• One server and many proxies
• Distributed installation (available only until 2.3.0)
The single-server installation is not suggested in a large environment. It is the basic
installation, where single servers do the monitoring, and it can be considered a good
starting point.
Most likely, in our infrastructure, we might already have a Zabbix installation.
Zabbix is quite flexible, and this permits us to upgrade this installation to the next
step: proxy-based monitoring.
Proxy-based monitoring is implemented with one Zabbix server and several proxies,
that is, one proxy per branch or data center. This configuration is easy to maintain
and offers the advantage to have a centralized monitoring solution. This kind of
configuration is the right balance between large environment monitoring and
complexity. From this point, we can (with a lot of effort) expand our installation to a
complete and distributed monitoring architecture. The installation consisting of one
server and many proxies is the one shown in the previous diagram.
Starting from the 2.4.0 version of Zabbix, the distributed scenarios that include
nodes are no longer a possible setup. Indeed, if you download the source code of the
Zabbix distribution discussed in this book, and then Zabbix 2.4.3, you'll see that the
branch of code that was managing the nodes has been removed.
All the possible Zabbix architectures will be discussed in detail in Chapter 2,
Distributed Monitoring.
[5]
Deploying Zabbix
Installing Zabbix
The installation that will be covered in this chapter is the one consisting of a server
for each of the following base components:
• A web frontend
• A Zabbix server
• A Zabbix database
We will start describing this installation because:
• It is a basic installation that is ready to be expanded with proxies and nodes
• Each component is on a dedicated server
• This kind of configuration is the starting point to monitor large environments
• It is widely used
• Most probably, it will be the starting point of your upgrade and expansion of
the monitoring infrastructure.
Actually, this first setup for a large environment, as explained here, can be useful
if you are looking to improve an existing monitoring infrastructure. If your current
monitoring solution is not implemented in this way, the first thing to do is plan the
migration on three different dedicated servers.
Once the environment is set up on three tiers but is still giving poor performance,
you can plan and think which kind of large environment setup will be a perfect fit
for your infrastructure.
When you monitor your large environment, there are some points to consider:
• Use a dedicated server to keep things easy to extend
• Keep things easy to extend and implement a high-availability setup
• Keep things easy to extend and implement a fault-tolerant architecture
On this three-layer installation, the CPU usage of the server component will not be
really critical at least for the Zabbix server. The CPU consumption is directly related
to the number of items to store and the refresh rate (number of samples per minute)
rather than the memory.
Indeed, the Zabbix server will not consume excessive CPU but is a bit greedier for
memory. We can consider that four CPU cores with 8 GB of RAM can be used for
more than 1,000 quad hosts without any issues.
[6]
Chapter 1
Basically, there are two ways to install Zabbix:
• Downloading the latest source code and compiling it
• Installing it from packages
There is also another way to have a Zabbix server up and running, that is, by
downloading the virtual appliance, but we don't consider this case as it is better to
have full control of our installation and be aware of all the steps. Also, the major
concern about the virtual appliance is that Zabbix itself defines the virtual appliance
that is not production ready directly on the download page http://www.zabbix.
com/download.php.
The installation from packages gives us the following benefits:
• It makes the process of upgrading and updating easier
• Dependencies are automatically sorted
The source code compilation also gives us benefits:
• We can compile only the required features
• We can statically build the agent and deploy it on different Linux flavors
• We can have complete control over the update
It is quite usual to have different versions of Linux, Unix, and Microsoft Windows in
a large environment. These kinds of scenarios are quite diffused on a heterogeneous
infrastructure, and if we use the agent distribution package of Zabbix on each Linux
server, we will, for sure, have different versions of the agent and different locations
for the configuration files.
The more standardized we are across the server, the easier it will be to maintain and
upgrade the infrastructure. --enable-static gives us a way to standardize the
agent across different Linux versions and releases, and this is a strong benefit. The
agent, if statically compiled, can be easily deployed everywhere, and, for sure, we
will have the same location (and we can use the same configuration file apart from
the node name) for the agent and their configuration file. The deployment will be
standardized; however, the only thing that may vary is the start/stop script and how
to register it on the right init runlevel.
The same kind of concept can be applied to commercial Unix bearing in mind its
compilation by vendors, so the same agent can be deployed on different versions of
Unix released by the same vendor.
[7]
www.allitebooks.com
Deploying Zabbix
Prerequisites
Before compiling Zabbix, we need to take a look at the prerequisites. The web
frontend will need at least the following versions:
• Apache (1.3.12 or later)
• PHP (5.3.0 or later)
Instead, the Zabbix server will need:
• An RDBMS: The open source alternatives are PostgreSQL and MySQL
• zlib-devel
• mysql-devel: This is used to support MySQL (not needed on our setup)
• postgresql-devel: This is used to support PostgreSQL
• glibc-devel
• curl-devel: This is used in web monitoring
• libidn-devel: The curl-devel depends on it
• openssl-devel: The curl-devel depends on it
• net-snmp-devel: This is used on SNMP support
• popt-devel: net-snmp-devel might depend on it
• rpm-devel: net-snmp-devel might depend on it
• OpenIPMI-devel: This is used to support IPMI
• iksemel-devel: This is used for the Jabber protocol
• Libssh2-devel
• sqlite3: This is required if SQLite is used as the Zabbix backend database
(usually on proxies)
To install all the dependencies on a Red Hat Enterprise Linux distribution, we can
use yum (from root), but first of all, we need to include the EPEL repository with the
following command:
# yum install epel-release
Using yum install, install the following package:
# yum install zlib-devel postgresql-devel glibc-devel curl-devel gcc
automake postgresql libidn-devel openssl-devel net-snmp-devel rpm-devel
OpenIPMI-devel iksemel-devel libssh2-devel openldap-devel
[8]
Chapter 1
The iksemel-devel package is used to send a Jabber
message. This is a really useful feature as it enables Zabbix
to send chat messages, Furthermore, Jabber is managed as
a media type on Zabbix, and you can also set your working
time, which is a really useful feature to avoid the sending
of messages when you are not in the office.
Setting up the server
Zabbix needs a user and an unprivileged account to run. Anyway, if the daemon
is started from root, it will automatically switch to the Zabbix account if this one
is present:
# groupadd zabbix
# useradd –m –s /bin/bash -g zabbix zabbix
# useradd –m –s /bin/bash -g zabbix zabbixsvr
The server should never run as root because this will expose
the server to a security risk.
The preceding lines permit you to enforce the security of your installation. The
server and agent should run with two different accounts; otherwise, the agent can
access the Zabbix server's configuration. Now, using the Zabbix user account, we can
download and extract the sources from the tar.gz file:
# wget http://sourceforge.net/projects/zabbix/files/ZABBIX%20Latest%20
Stable/2.4.4/zabbix-2.4.4.tar.gz/download -O zabbix-2.4.4.tar.gz
# tar -zxvf zabbix-2.4.4.tar.gz
Now, we will configure the sources where help is available:
# cd zabbix-2.4.3
# ./configure -–help
To configure the source for our server, we can use the following options:
# ./configure --enable-server --enable-agent --with-postgresql --withlibcurl --with-jabber --with-net-snmp --enable-ipv6 --with-openipmi
--with-ssh2 --with-ldap
The zabbix_get and zabbix_send commands are generated
only if --enable-agent is specified during server compilation.
[9]
Deploying Zabbix
If the configuration is complete without errors, we should see something similar
to this:
config.status: executing depfiles commands
Configuration:
Detected OS:
linux-gnu
Install path:
/usr/local
Compilation arch:
linux
Compiler:
gcc
Compiler flags:
-g -O2
-I/usr/include
-I/usr/include/rpm
-I/usr/local/include -I/usr/lib64/perl5/CORE -I. -I/usr/include -I/usr/
include -I/usr/include -I/usr/include
Enable server:
yes
Server details:
With database:
PostgreSQL
WEB Monitoring:
cURL
Native Jabber:
yes
SNMP:
yes
IPMI:
yes
SSH:
yes
ODBC:
no
Linker flags:
-rdynamic
-L/usr/lib -L/usr/lib -L/usr/lib
-L/usr/lib64
-L/usr/lib64
Libraries:
-lm -ldl -lrt -lresolv
-lpq -liksemel
-lnetsnmp -lssh2 -lOpenIPMI -lOpenIPMIposix -lldap -llber
-lcurl
Enable proxy:
no
Enable agent:
yes
Agent details:
Linker flags:
-rdynamic
Libraries:
-lcurl
Enable Java gateway:
-lm -ldl -lrt
-L/usr/lib
no
[ 10 ]
-lresolv
-lldap -llber
Chapter 1
LDAP support:
yes
IPv6 support:
yes
***********************************************************
*
Now run 'make install'
*
*
*
*
Thank you for using Zabbix!
*
*
<http://www.zabbix.com>
*
***********************************************************
We will not run make install but only the compilation with # make. To specify a
different location for the Zabbix server, we need to use a -- prefix on the configure
options, for example, --prefix=/opt/zabbix. Now, follow the instructions as
explained in the Installing and creating the package section.
Setting up the agent
To configure the sources to create the agent, we need to run the following command:
# ./configure --enable-agent
# make
With the make command followed by the --enable-static
option, you can statically link the libraries, and the compiled
binary will not require any external library; this is very useful
to distribute the agent across different dialects of Linux.
Installing and creating the package
In both the previous sections, the command line ends right before the installation;
indeed, we didn't run the following command:
# make install
I advise you not to run the make install command but use the checkinstall
software instead. This software will create the package and install the Zabbix software.
You can download the software from ftp://ftp.pbone.net/mirror/ftp5.gwdg.
de/pub/opensuse/repositories/home:/ikoinoba/CentOS_CentOS-6/x86_64/
checkinstall-1.6.2-3.el6.1.x86_64.rpm.
[ 11 ]
Deploying Zabbix
Note that checkinstall is only one of the possible alternatives that you have to
create a distributable system package.
We can also use a prebuild checkinstall. The current release is
checkinstall-1.6.2-20.4.i686.rpm (on Red Hat/CentOS);
the package will also need rpm-build; then, from root, we need to
execute the following command:
# yum install rpm-build rpmdevtools
We also need to create the necessary directories:
# mkdir -p ~/rpmbuild/{BUILD,RPMS,SOURCES,SPECS,SRPMS}
The package made things easy; it is easy to distribute and upgrade the software,
plus we can create a package for different versions of a package manager: RPM, deb,
and tgz.
checkinstall can produce a package for Debian (option –D),
Slackware (option –S), and Red Hat (option –R). This is particularly
useful to produce the Zabbix's agent package (statically linked) and
to distribute it around our server.
Now, we need to convert to root or use the sudo checkinstall command followed
by its options:
# checkinstall --nodoc -R --install=no -y
If you don't face any issue, you should get the following message:
******************************************************************
Done. The new package has been saved to
/root/rpmbuild/RPMS/x86_64/zabbix-2.4.4-1.x86_64.rpm
You can install it in your system anytime using:
rpm -i zabbix-2.4.4-1.x86_64.rpm
******************************************************************
Now, to install the package from root, you need to run the following command:
# rpm -i zabbix-2.4.4-1.x86_64.rpm
Finally, Zabbix is installed. The server binaries will be installed in <prefix>/sbin,
utilities will be in <prefix>/bin, and the man pages will be under the <prefix>/
share location.
[ 12 ]
Chapter 1
Installing from packages
To provide a complete picture of all the possible install methods, you need to be
aware of the steps required to install Zabbix using the prebuilt rpm packages.
The first thing to do is install the repository:
# rpm -ivh http://repo.zabbix.com/zabbix/2.4/rhel/6/x86_64/
zabbix-2.4.4-1.el6.x86_64.rpm
This will create the yum repo file, /etc/yum.repos.d/zabbix.repo, and will enable
the repository.
If you take a look at the Zabbix repository, you can see that
inside the "non-supported" tree: http://repo.zabbix.com/
non-supported/rhel/6/x86_64/, you have available these
packages: iksemel, fping, libssh2, and snmptt.
Now, it is easy to install our Zabbix server and web interface; you can simply run
this command on the server:
# yum install zabbix-server-pgsql
And in the web server, bear in mind to first add the yum repository:
# yum install zabbix-web-pgsql
To install the agent, you only need to run the following command:
# yum install zabbix-agent
If you have decided to use the RPM packages, please bear
in mind that the configuration files are located under /etc/
zabbix/. The book anyway will continue to refer to the
standard configuration: /usr/local/etc/.
Also, if you have a local firewall active where you're deploying your Zabbix agent,
you need to properly configure iptables to allow the traffic against Zabbix's agent
port with the following command that you need to run as root:
# iptables -I INPUT 1 -p tcp --dport 10050 -j ACCEPT
# iptables-save
[ 13 ]
Deploying Zabbix
Configuring the server
For the server configuration, we only have one file to check and edit:
/usr/local/etc/zabbix_server.conf
The configuration files are located inside the following directory:
/usr/local/etc
We need to change the /usr/local/etc/zabbix_server.conf file and write the
username, relative password, and the database name there; note that the database
configuration will be done later on in this chapter and that, by now, you can write
the planned username/password/database name. Then, in the zabbix account, you
need to edit:
# vi /usr/local/etc/zabbix_server.conf
Change the following parameters:
DBHost=localhost
DBName=zabbix
DBUser=zabbix
DBPassword=<write-here-your-password>
Now, our Zabbix server is configured and almost ready
to go. zabbix_server.conflocation depends on the
sysconfdir compile-time installation variable. Don't
forget to take appropriate measures to protect access to the
configuration file with the following command:
chmod 600/usr/local/etc/zabbix_server.conf
The location of the default external scripts will be as follows:
/usr/local/share/zabbix/externalscripts
This depends on the datadir compile-time installation variable. The alertscripts
directory will be in the following location:
/usr/local/share/zabbix/alertscripts
This can be changed during compilation, and it depends on
the datadir installation variable.
[ 14 ]
Chapter 1
Now, we need to configure the agent. The configuration file is where we need to
write the IP address of our Zabbix server. Once done, it is important to add two new
services to the right runlevel to be sure that they will start when the server enters on
the right runlevel.
To complete this task, we need to install the start/stop scripts on the following:
• /etc/init.d/zabbix-agent
• /etc/init.d/zabbix-proxy
• etc/init.d/zabbix-server
There are several scripts prebuilt inside the misc folder located at the following
location:
zabbix-2.4.4/misc/init.d
This folder contains different startup scripts for different Linux variants, but this tree
is not actively maintained and tested, and may not be up to date with the most recent
versions of Linux distributions, so it is better to take care and test it before going live.
Once the start/stop script is added inside the /etc/init.d folder, we need to add
them to the service list:
# chkconfig --add zabbix-server
# chkconfig --add zabbix-agentd
Now, all that is left is to tell the system which runlevel it should start them on; we
are going to use runlevels 3 and 5:
# chkconfig --level 35 zabbix-server on
# chkconfig --level 35 zabbix-agentd on
Also, in case you have a local firewall active in your Zabbix server, you need to
properly configure iptables to allow traffic against Zabbix's server port with the
following command that you need to run as root:
# iptables -I INPUT 1 -p tcp --dport 10051 -j ACCEPT
# iptables-save
Currently, we can't start the server; before starting up our server, we need to
configure the database.
[ 15 ]
Deploying Zabbix
Installing the database
Once we complete the previous step, we can walk through the database server
installation. All those steps will be done on the dedicated database server. The
first thing to do is install the PostgreSQL server. This can be easily done with the
package offered from the distribution, but it is recommended that you use the latest
9.x stable version.
Red Hat is still distributing the 8.x on RHEL6.4. Also, its clones, such as CentOS and
ScientificLinux, are doing the same. PosgreSQL 9.x has many useful features; at the
moment, the latest stable, ready-for-production environment is Version 9.2.
To install PostgreSQL 9.4, there are some easy steps to follow:
1. Locate the .repo files:
°°
Red Hat: This is present at /etc/yum/pluginconf.d/rhnplugin.
conf [main]
°°
CentOS: This is present at /etc/yum.repos.d/CentOS-Base.repo,
[base] and [updates]
2. Append the following line on the section(s) identified in the preceding step:
exclude=postgresql*
3. Browse to http://yum.postgresql.org and find your correct RPM.
For example, to install PostgreSQL 9.4 on RHEL 6, go to http://yum.
postgresql.org/9.4/redhat/rhel-6-x86_64/pgdg-redhat94-9.4-1.
noarch.rpm.
4. Install the repo with yum localinstall http://yum.postgresql.
org/9.4/redhat/rhel-6-x86_64/pgdg-centos94-9.4-1.noarch.rpm.
5. Now, to list the entire postgresql package, use the following command:
# yum list postgres*
6. Once you find our package in the list, install it using the following command:
# yum install postgresql94 postgresql94-server postgresql94contrib
7. Once the packages are installed, we need to initialize the database:
# service postgresql-9.4 initdb
Alternatively, we can also initialize this database:
# /etc/init.d/postgresql-9.4 initdb
[ 16 ]
Chapter 1
8. Now, we need to change a few things in the configuration file /var/lib/
pgsql/9.4/data/postgresql.conf. We need to change the listen address
and the relative port:
listen_addresses = '*'
port = 5432
We also need to add a couple of entries for zabbix_db right after the
following lines:
# TYPE
METHOD
DATABASE
USER
ADDRESS
# "local" is for Unix domain socket connections only
local
trust
all
all
in /var/lib/pgsql/9.4/data/pg_hba.conf
# configuration for Zabbix
local
zabbix_db
zabbix
host
zabbix_db
zabbix
md5
<CIDR-address>
md5
The local keyword matches all the connections made in the Unix-domain
sockets. This line is followed by the database name (zabbix_db), the
username (zabbix), and the authentication method (in our case, md5).
The host keyword matches all the connections that are coming from TCP/IP
(this includes SSL and non-SSL connections) followed by the database name
(zabbix_db), username (zabbix), network, and mask of all the hosts that are
allowed and the authentication method (in our case md5).
9. The network mask of the allowed hosts in our case should be a network
mask because we need to allow the web interface (hosted on our web server)
and the Zabbix server that is on a different dedicated server, for example,
10.6.0.0/24 (a small subnet) or even a large network. Most likely, the web
interface as well as the Zabbix server will be in a different network, so make
sure that you express all the network and relative masks here.
10. Finally, we can start our PosgreSQL server using the following command:
# service postgresql-9.4
start
Alternatively, we can use this command:
# /etc/init.d/postgresql-9.4
start
To create a database, we need to be a postgres user (or the user that in your
distribution is running PostgreSQL). Create a user for the database (our Zabbix user)
and log in as that user to import the schema with the relative data.
[ 17 ]
www.allitebooks.com
Deploying Zabbix
The code to import the schema is as follows:
# su - postgres
Once we become postgres users, we can create the database (in our example, it is
zabbix_db):
-bash-4.1$ psql
postgres=#
HERE>';
CREATE USER zabbix WITH PASSWORD '<YOUR-ZABBIX-PASSWORD-
CREATE ROLE
postgres=# CREATE DATABASE zabbix_db WITH OWNER zabbix ENCODING='UTF8';
CREATE DATABASE
postgres=# \q
The database creation scripts are located in the /database/postgresql folder of the
extracted source files. They need to be installed exactly in this order:
# cat schema.sql |
psql –h <DB-HOST-IP-ADDRESS> -W -U zabbix zabbix_db
# cat images.sql |
psql –h <DB-HOST-IP-ADDRESS> -W -U zabbix zabbix_db
# cat data.sql |
psql –h <DB-HOST-IP-ADDRESS> -W -U zabbix zabbix_db
The –h <DB-HOST-IP-ADDRESS> option used on the psql
command will avoid the use of the local entry contained in
the standard configuration file /var/lib/pgsql/9.4/
data/pg_hba.conf.
Now, finally, it is the time to start our Zabbix server and test the whole setup for our
Zabbix server/database:
# /etc/init.d/zabbix-server start
Starting Zabbix server:
[
OK
]
A quick check of the log file can give us more information about what is currently
happening in our server. We should be able to get the following lines from the log
file (the default location is /tmp/zabbix_server.log):
26284:20150114:034537.722 Starting Zabbix Server. Zabbix 2.4.4
(revision 51175).
26284:20150114:034537.722 ****** Enabled features ******
26284:20150114:034537.722 SNMP monitoring:
YES
26284:20150114:034537.722 IPMI monitoring:
YES
26284:20150114:034537.722 WEB monitoring:
YES
[ 18 ]
Chapter 1
26284:20150114:034537.722 VMware monitoring:
YES
26284:20150114:034537.722 Jabber notifications:
YES
26284:20150114:034537.722 Ez Texting notifications:
YES
26284:20150114:034537.722 ODBC:
YES
26284:20150114:034537.722 SSH2 support:
YES
26284:20150114:034537.722 IPv6 support:
YES
26284:20150114:034537.725 ******************************
26284:20150114:034537.725 using configuration file: /usr/local/etc/
zabbix/zabbix_server.conf
26284:20150114:034537.745 current database version (mandatory/optional):
02040000/02040000
26284:20150114:034537.745 required mandatory version: 02040000
26284:20150114:034537.763 server #0 started [main process]
26289:20150114:034537.763 server #1 started [configuration syncer #1]
26290:20150114:034537.764 server #2 started [db watchdog #1]
26291:20150114:034537.764 server #3 started [poller #1]
26293:20150114:034537.765 server #4 started [poller #2]
26294:20150114:034537.766 server #5 started [poller #3]
26296:20150114:034537.770 server #7 started [poller #5]
26295:20150114:034537.773 server #6 started [poller #4]
26297:20150114:034537.773 server #8 started [unreachable poller #1]
26298:20150114:034537.779 server #9 started [trapper #1]
26300:20150114:034537.782 server #11 started [trapper #3]
26302:20150114:034537.784 server #13 started [trapper #5]
26301:20150114:034537.786 server #12 started [trapper #4]
26299:20150114:034537.786 server #10 started [trapper #2]
26303:20150114:034537.794 server #14 started [icmp pinger #1]
26305:20150114:034537.790 server #15 started [alerter #1]
26312:20150114:034537.822 server #18 started [http poller #1]
26311:20150114:034537.811 server #17 started [timer #1]
26310:20150114:034537.812 server #16 started [housekeeper #1]
26315:20150114:034537.829 server #20 started [history syncer #1]
26316:20150114:034537.844 server #21 started [history syncer #2]
26319:20150114:034537.847 server #22 started [history syncer #3]
26321:20150114:034537.852 server #24 started [escalator #1]
26320:20150114:034537.849 server #23 started [history syncer #4]
[ 19 ]
Deploying Zabbix
26326:20150114:034537.868 server #26 started [self-monitoring #1]
26325:20150114:034537.866 server #25 started [proxy poller #1]
26314:20150114:034537.997 server #19 started [discoverer #1]
Actually, the default log location is not the best ever as /tmp will be cleaned up in the
event of reboot and, for sure, the logs are not rotated and managed properly.
We can change the default location by simply changing an entry in /etc/zabbix_
server.conf. You can change the file as follows:
### Option: LogFile
LogFile=/var/log/zabbix/zabbix_server.log
Create the directory structure with the following command from root:
# mkdir –p /var/log/zabbix
# chown zabbixsvr:zabbixsvr /var/log/zabbix
Another important thing to change is logrotate as it is better to have an automated
rotation of our log file. This can be quickly implemented by adding the relative
configuration in the logrotate directory /etc/logrotate.d/.
To do that, create the following file by running the command from the root account:
# vim
/etc/logrotate.d/zabbix-server
Use the following content:
/var/log/zabbix/zabbix_server.log {
missingok
monthly
notifempty
compress
create 0664 zabbix zabbix
}
Once those changes have been done, you need to restart your Zabbix server with the
following command (run it using root):
# /etc/init.d/zabbix-server restart
Shutting down Zabbix server:
[
OK
]
Starting Zabbix server:
[
OK
]
Another thing to check is whether our server is running with our user:
# ps aux | grep "[z]abbix_server"
502 28742 1
0 13:39 ?
00:00:00 /usr/local/sbin/zabbix_server
[ 20 ]
Chapter 1
502 28744 28742 0 13:39 ? 00:00:00 /usr/local/sbin/zabbix_server
502 28745 28742 0 13:39 ? 00:00:00 /usr/local/sbin/zabbix_server
...
The preceding lines show that zabbix_server is running with the user 502. We will
go ahead and verify that 502 is the user we previously created:
# getent passwd 502
zabbixsvr:x:502:501::/home/zabbixsvr:/bin/bash
The preceding lines show that all is fine. The most common issue normally is the
following error:
28487:20130609:133341.529 Database is down. Reconnecting in 10 seconds.
There are different actors that cause this issue:
• Firewall (local on our servers or an infrastructure firewall)
• The postgres configuration
• Wrong data in zabbix_server.conf
We can try to isolate the problem by running the following command
on the database server:
serverpsql -h <DB-HOST-IP> -U zabbix zabbix_dbPassword
for user zabbix:psql (9.4)Type "help" for help
If we have a connection, we can try the same command from the
Zabbix server; if it fails, it is better to check the firewall configuration.
If we get the fatal identification-authentication failed error, it is better
to check the pg_hba.conf file.
Now, the second thing to check is the local firewall and then iptables. You need to
verify that the PostgreSQL port is open on the database server. If the port is not open,
you need to add a firewall rule using the root account:
# iptables -I INPUT 1 -p tcp --dport 5432 -j ACCEPT
# iptables-save
Now, it is time to check how to start and stop your Zabbix installation. The scripts
that follow are a bit customized to manage the different users for the server and
the agent.
[ 21 ]
Deploying Zabbix
The following startup script works fine with the standard
compilation without using a -- prefix or the zabbixsvr user.
If you are running on a different setup, make sure that you
customize the executable location and the user:
exec=/usr/local/sbin/zabbix_server
zabbixsrv=zabbixsvr
For zabbix-server, create the zabbix-server file at /etc/init.d with the
following content:
#!/bin/sh
#
# chkconfig: - 85 15
# description: Zabbix server daemon
# config: /usr/local/etc/zabbix_server.conf
#
### BEGIN INIT INFO
# Provides: zabbix
# Required-Start: $local_fs $network
# Required-Stop: $local_fs $network
# Default-Start:
# Default-Stop: 0 1 2 3 4 5 6
# Short-Description: Start and stop Zabbix server
# Description: Zabbix server
### END INIT INFO
# Source function library.
. /etc/rc.d/init.d/functions
exec=/usr/local/sbin/zabbix_server
prog=${exec##*/}
lockfile=/var/lock/subsys/zabbix
syscf=zabbix-server
The next parameter, zabbixsvr, is specified inside the start() function, and it
determines which user will be used to run our Zabbix server:
zabbixsrv=zabbixsvr
[ -e /etc/sysconfig/$syscf ] && . /etc/sysconfig/$syscf
start()
{
echo -n $"Starting Zabbix server: "
[ 22 ]
Chapter 1
In the preceding code, the user (who will own our Zabbix's server process) is
specified inside the start function:
daemon --user $zabbixsrv $exec
Remember to change the ownership of the server log file and configuration file of
Zabbix. This is to prevent a normal user from accessing sensitive data that can be
acquired with Zabbix. Logfile is specified as follows:
/usr/local/etc/zabbix_server.conf
On 'LogFile''LogFile' properties
rv=$?
echo
[ $rv -eq 0 ] && touch $lockfile
return $rv
}
stop()
{
echo -n $"Shutting down Zabbix server: "
Here, inside the stop function, we don't need to specify the user as the start/stop
script runs from root, so we can simply use killproc $prog as follows:
killproc $prog
rv=$?
echo
[ $rv -eq 0 ] && rm -f $lockfile
return $rv
}
restart()
{
stop
start
}
case "$1" in
start|stop|restart)
$1
;;
force-reload)
restart
;;
status)
status $prog
;;
[ 23 ]
Deploying Zabbix
try-restart|condrestart)
if status $prog >/dev/null ; then
restart
fi
;;
reload)
action $"Service ${0##*/} does not support the reload
action: " /bin/false
exit 3
;;
*)
echo $"Usage: $0 {start|stop|status|restart|try-restart|forcereload}"
exit 2
;;
esac
The following startup script works fine with the standard
compilation without using a -- prefix or the zabbix_usr
user. If you are running on a different setup, make sure that
you customize the executable location and the user:
exec=/usr/local/sbin/zabbix_agentd
zabbix_usr=zabbix
For zabbix_agent, create the following zabbix-agent file at /etc/init.d/zabbixagent:
#!/bin/sh
#
# chkconfig: - 86 14
# description: Zabbix agent daemon
# processname: zabbix_agentd
# config: /usr/local/etc/zabbix_agentd.conf
#
### BEGIN INIT INFO
# Provides: zabbix-agent
# Required-Start: $local_fs $network
# Required-Stop: $local_fs $network
# Should-Start: zabbix zabbix-proxy
# Should-Stop: zabbix zabbix-proxy
# Default-Start:
# Default-Stop: 0 1 2 3 4 5 6
# Short-Description: Start and stop Zabbix agent
[ 24 ]
Chapter 1
# Description: Zabbix agent
### END INIT INFO
# Source function library.
. /etc/rc.d/init.d/functions
exec=/usr/local/sbin/zabbix_agentd
prog=${exec##*/}
syscf=zabbix-agent
lockfile=/var/lock/subsys/zabbix-agent
The following zabbix_usr parameter specifies the account that will be used to run
Zabbix's agent:
zabbix_usr=zabbix
[ -e /etc/sysconfig/$syscf ] && . /etc/sysconfig/$syscf
start()
{
echo -n $"Starting Zabbix agent: "
The next command uses the value of the zabbix_usr variable and permits us
to have two different users, one for the server and one for the agent, preventing
the Zabbix agent from accessing the zabbix_server.conf file that contains our
database password:
daemon --user $zabbix_usr $exec
rv=$?
echo
[ $rv -eq 0 ] && touch $lockfile
return $rv
}
stop()
{
echo -n $"Shutting down Zabbix agent: "
killproc $prog
rv=$?
echo
[ $rv -eq 0 ] && rm -f $lockfile
return $rv
}
restart()
{
[ 25 ]
Deploying Zabbix
stop
start
}
case "$1" in
start|stop|restart)
$1
;;
force-reload)
restart
;;
status)
status $prog
;;
try-restart|condrestart)
if status $prog >/dev/null ; then
restart
fi
;;
reload)
action $"Service ${0##*/} does not support the reload action:
" /bin/false
exit 3
;;
*)
echo $"Usage: $0 {start|stop|status|restart|try-restart|forcereload}"
exit 2
;;
esac
With that setup, we have the agent that is running with zabbix_usr and the server
with Unix accounts of zabbixsvr:
zabbix_usr_ 4653 1 0 15:42 ?
agentd
zabbix_usr 4655 4653
zabbixsvr 4443 1
0 15:42 ?
0 15:32 ?
zabbixsvr 4445 4443
00:00:00 /usr/local/sbin/zabbix_
00:00:00 /usr/local/sbin/zabbix_agentd
00:00:00 /usr/local/sbin/zabbix_server
0 15:32 ? 00:00:00 /usr/local/sbin/zabbix_server
[ 26 ]
Chapter 1
Some considerations about the database
Zabbix uses an interesting way to keep the database the same size at all times. The
database size indeed depends upon:
• The number of processed values per second
• The housekeeper settings
Zabbix uses two ways to store the collected data:
• History
• Trends
While on history, we will find all the collected data (it doesn't matter what type of
data will be stored in history); trends will collect only numerical data. Its minimum,
maximum, and average calculations are consolidated by hour (to keep the trend a
lightweight process).
All the strings items, such as character, log, and text, do not
correspond to trends since trends store only values.
There is a process called the housekeeper that is responsible for handling the
retention against our database. It is strongly advised that you keep the data in
history as small as possible so that you do not overload the database with a huge
amount of data, and store the trends for as long as you want.
Now, since Zabbix will also be used for capacity planning purposes, we need to
consider using a baseline and keeping at least a whole business period. Normally,
the minimum period is one year, but it is strongly advised that you keep the trend
history on for at least 2 years. These historical trends will be used during the
business opening and closure to have a baseline and quantify the overhead for a
specified period.
If we indicate 0 as the value for trends, the server will not
calculate or store trends at all. If history is set to 0, Zabbix will
be able to calculate only triggers based on the last value of the
item itself as it does not store historical values at all.
The most common issue that we face when aggregating data is the presence of values
influenced by positive spikes or fast drops in our hourly trends, which means that
huge spikes can produce a mean value per hour that is not right.
[ 27 ]
www.allitebooks.com
Deploying Zabbix
Trends in Zabbix are implemented in a smart way. The script creation for the trend
table is as follows:
CREATE TABLE trends(
itemid bigin NOT NULL, clock integer DEFAULT '0'
NOT NULL, num integer DEFAULT '0'
NOT NULL, value_min numeric(16, 4) DEFAULT '0.0000'
NOT NULL, value_avg numeric(16, 4) DEFAULT '0.0000'
NOT NULL, value_max numeric(16, 4) DEFAULT '0.0000'
NOT NULL, PRIMARY KEY(itemid, clock));
CREATE TABLE trends_uint(
Itemid bigint NOT NULL, Clock integer DEFAULT '0'
NOT NULL, Num integer DEFAULT '0'
NOT NULL, value_min numeric(20) DEFAULT '0'
NOT NULL, value_avg numeric(20) DEFAULT '0'
NOT NULL, value_max numeric(20) DEFAULT '0'
NOT NULL, PRIMARY KEY(itemid, clock));
As you can see, there are two tables showing trends inside the Zabbix database:
• Trends
• Trends_uint
The first table, Trends, is used to store the float value. The second table, trends_
uint, is used to store the unsigned integer. Both tables own the concept of keeping
the following for each hour:
• Minimum value (value_min)
• Maximum value (value_max)
• Average value (value_avg)
This feature permits us to find out and display the trends graphically by using the
influence of spikes and fast drops against the average value and understanding how
and how much this value has been influenced. The other tables used for historical
purposes are as follows:
• history: This is used to store numeric data (float)
• history_log: This is used to store logs (for example, the text field on the
PostgreSQL variable has unlimited length)
• history_str: This is used to store strings (up to 255 characters)
• history_text: This is used to store the text value (again, this is a text field,
so it has unlimited length)
• history_uint: This is used to store numeric values (unsigned integers)
[ 28 ]
Chapter 1
Sizing the database
Calculating the definitive database size is not an easy task because it is hard to
predict how many items and the relative rate per second we will have on our
infrastructure and how many events will be generated. To simplify this, we will
consider the worst-case scenario, where we have an event generated every second.
In summary, the database size is influenced by:
• Items: The number of items in particular
• Refresh rate: The average refresh rate of our items
• Space to store values: This value depends on RDBMS
The space used to store the data may vary from database to database, but we can
simplify our work by considering mean values that quantify the maximum space
consumed by the database. We can also consider the space used to store values on
history to be around 50 bytes per value, the space used by a value on the trend table
to be around 128 bytes, and the space used for a single event to be normally around
130 bytes.
The total amount of used space can be calculated with the following formula:
Configuration + History + Trends + Events
Now, let's look into each of the components:
• Configuration: This refers to Zabbix's configuration for the server, the web
interface, and all the configuration parameters that are stored in the database;
this is normally around 10 MB
• History: The history component is calculated using the following formula:
History retention days* (items/refresh rate)*24*3600* 50 bytes
(History bytes usage average)
• Trends: The trends component is calculated using the following formula:
days*(items/3600)*24*3600*128 bytes (Trend bytes usage average)
• Events: The event component is calculated using the following formula:
days*events*24*3600*130 bytes (Event bytes usage average)
Now, coming back to our practical example, we can consider 5,000 items to be
refreshed every minute, and we want to have 7 days of retention; the used space will
be calculated as follows:
History: retention (in days) * (items/refresh rate)*24*3600* 50 bytes
[ 29 ]
Deploying Zabbix
50 bytes is the mean value of the space consumed by a value
stored on history.
Considering a history of 30 days, the result is the following:
• History will be calculated as:
30 * 5000/60 * 24*3600 *50 = 10.8GB
• As we said earlier, to simplify, we will consider the worst-case scenario (one
event per second) and will also consider keeping 5 years of events
• Events will be calculated using the following formula:
retention days*events*24*3600* Event bytes usage (average)
When we calculate an event, we have:
5*365*24*3600* 130 = 15.7GB
130 bytes is the mean value for the space consumed by a
value stored on events.
• Trends will be calculated using the following formula:
retention in days*(items/3600)*24*3600*Trend bytes usage (average)
When we calculate trends, we have:
5000*24*365* 128 = 5.3GB per year or 26.7GB for 5 years.
128 bytes is the mean value of the space consumed by a
value stored on trends.
The following table shows the retention in days and the space required for the
measure:
Type of measure
Retention in days
Space required
History
30
10.8 GB
Events
1825 (5 years)
15.7 GB
Trends
1825 (5 years)
26.7 GB
Total
N.A.
53.2 GB
[ 30 ]
Chapter 1
The calculated size is not the initial size of our database, but we need to keep in mind
that this one will be our target size after 5 years. We are also considering a history of
30 days, so keep in mind that this retention can be reduced if there are issues since
the trends will keep and store our baseline and hourly trends.
The history and trend retention policy can be changed easily for every item. This
means that we can create a template with items that have a different history retention
by default. Normally, the history is set to 7 days, but for some kind of measure, such
as in a web scenario or an other measures, we may need to keep all the values for
more than a week. This permits us to change the value for each item.
In our example, we considered a worst-case scenario with 30 days of retention, but
it is a piece of good advice to keep the history only for 7 days or even less in large
environments. If we perform a basic calculation of an item that is updated every 60
seconds and has its history preserved for 7 days, it will generate (update interval) *
(hours in a day) * (number of days in history) =60*24*7=10,080.
This mean that, for each item, we will have 10,080 lines in a week, and that gives us
an idea of the number of lines that we will produce on our database.
The following screenshot represents the details of a single item:
[ 31 ]
Deploying Zabbix
Some considerations about housekeeping
Housekeeping can be quite a heavy process. As the database grows, housekeeping
will require more and more time to complete his/her work. This issue can be sorted
using the delete_history() database function.
There is a way to deeply improve the housekeeping performance and fix this
performance drop. The heaviest tables are: history, history_uint, trends, and
trends_uint.
A solution is PostgreSQL table partitioning and the partitioning of the entire table
on a monthly basis. The following figure displays the standard and nonpartitioned
history table on the database:
The following figure shows how a partitioned history table will be stored in the
database:
[ 32 ]
Chapter 1
Partitioning is basically the splitting of a large logical table into smaller physical
pieces. This feature can provide several benefits:
• The performance of queries can be improved dramatically in situations
where there is heavy access of the table's rows in a single partition.
• The partitioning will reduce the index size, making it more likely to fit in the
memory of the parts that are being used heavily.
• Massive deletes can be accomplished by removing partitions, instantly
reducing the space allocated for the database without introducing
fragmentation and a heavy load on index rebuilding. The delete partition
command also entirely avoids the vacuum overhead caused by a bulk delete.
• When a query updates or requires access to a large percentage of the
partition, using a sequential scan is often more efficient than using the index
with random access or scattered reads against that index.
All these benefits are only worthwhile when a table is very large. The strongpoint of
this kind of architecture is that the RDBMS will directly access the needed partition,
and the delete will simply be a delete of a partition. Partition deletion is a fast
process and requires few resources.
Unfortunately, Zabbix is not able to manage the partitions, so we need to disable the
housekeeping and use an external process to accomplish the housekeeping.
The partitioning approach described here has certain benefits compared to the other
partitioning solutions:
• This does not require you to prepare the database to partition it with Zabbix
• This does not require you to create/schedule a cron job to create the tables in
advance
• This is simpler to implement than other solutions
This method will prepare partitions under the desired partitioning schema with the
following convention:
• Daily partitions are in the form of partitions.tablename_pYYYYMMDD
• Monthly partitions are in the form of partitions.tablename_pYYYYMM
All the scripts here described are available at https://github.com/smartmarmot/
Mastering_Zabbix.
[ 33 ]
Deploying Zabbix
To set up this feature, we need to create a schema where we can place all the
partitioned tables; then, within a psql section, we need to run the following command:
CREATE SCHEMA partitions AUTHORIZATION zabbix;
Now, we need a function that will create the partition. So, to connect to Zabbix, you
need to run the following code:
CREATE OR REPLACE FUNCTION trg_partition()
RETURNS TRIGGER AS
$BODY$
DECLARE
prefix text:= 'partitions.';
timeformat text;
selector text;
_interval INTERVAL;
tablename text;
startdate text;
enddate text;
create_table_part text;
create_index_part text;
BEGIN
selector = TG_ARGV[0];
IF selector = 'day'
THEN
timeformat:= 'YYYY_MM_DD';
ELSIF selector = 'month'
THEN
timeformat:= 'YYYY_MM';
END IF;
_interval:= '1 ' || selector;
tablename:= TG_TABLE_NAME || '_p' || TO_CHAR(TO_TIMESTAMP(NEW.clock),
timeformat);
EXECUTE 'INSERT INTO ' || prefix || quote_ident(tablename) || ' SELECT
($1).*'
USING NEW;
RETURN NULL;
EXCEPTION
WHEN undefined_table THEN
[ 34 ]
Chapter 1
startdate:= EXTRACT(epoch FROM date_trunc(selector, TO_TIMESTAMP(NEW.
clock)));
enddate:= EXTRACT(epoch FROM date_trunc(selector, TO_TIMESTAMP(NEW.
clock) + _interval));
create_table_part:= 'CREATE TABLE IF NOT EXISTS ' || prefix || quote_
ident(tablename) || ' (CHECK ((clock >= ' || quote_literal(startdate)
|| ' AND clock < ' || quote_literal(enddate) || '))) INHERITS (' ||
TG_TABLE_NAME || ')';
create_index_part:= 'CREATE INDEX ' || quote_ident(tablename) || '_1
on ' || prefix || quote_ident(tablename) || '(itemid,clock)';
EXECUTE create_table_part;
EXECUTE create_index_part;
--insert it again
EXECUTE 'INSERT INTO ' || prefix || quote_ident(tablename) || ' SELECT
($1).*'
USING NEW;
RETURN NULL;
END;
$BODY$
LANGUAGE plpgsql VOLATILE
COST 100;
ALTER FUNCTION trg_partition()
OWNER TO zabbix;
Please ensure that your database has been set up with the user
Zabbix. If you're using a different role/account, please change
the last line of the script accordingly:
ALTER FUNCTION trg_partition()
OWNER TO <replace with your database owner here>;
Now, we need a trigger connected to each table that we want to separate. This trigger
will run an INSERT statement, and if the partition is not ready or created yet, the
function will create the partition right before the INSERT statement:
CREATE TRIGGER partition_trg BEFORE INSERT ON history
FOR EACH ROW EXECUTE PROCEDURE trg_partition('day');
CREATE TRIGGER partition_trg BEFORE INSERT ON history_sync
FOR EACH ROW EXECUTE PROCEDURE trg_partition('day');
CREATE TRIGGER partition_trg BEFORE INSERT ON history_uint
FOR EACH ROW EXECUTE PROCEDURE trg_partition('day');
[ 35 ]
Deploying Zabbix
CREATE TRIGGER partition_trg BEFORE INSERT ON history_str_sync
FOR EACH ROW EXECUTE PROCEDURE trg_partition('day');
CREATE TRIGGER partition_trg BEFORE INSERT ON history_log
FOR EACH ROW EXECUTE PROCEDURE trg_partition('day');
CREATE TRIGGER partition_trg BEFORE INSERT ON trends
FOR EACH ROW EXECUTE PROCEDURE trg_partition('month');
CREATE TRIGGER partition_trg BEFORE INSERT ON trends_uint
FOR EACH ROW EXECUTE PROCEDURE trg_partition('month');
At this point, we miss only the housekeeping function that will replace the one
built in Zabbix and disable Zabbix's native one. The function that will handle
housekeeping for us is as follows:
CREATE OR REPLACE FUNCTION delete_partitions(intervaltodelete
INTERVAL, tabletype text)
RETURNS text AS
$BODY$
DECLARE
result RECORD ;
prefix text := 'partitions.';
table_timestamp TIMESTAMP;
delete_before_date DATE;
tablename text;
BEGIN
FOR result IN SELECT * FROM pg_tables WHERE schemaname =
'partitions' LOOP
table_timestamp := TO_TIMESTAMP(substring(result.tablename
FROM '[0-9_]*$'), 'YYYY_MM_DD');
delete_before_date := date_trunc('day', NOW() intervalToDelete);
tablename := result.tablename;
IF tabletype != 'month' AND tabletype != 'day' THEN
RAISE EXCEPTION 'Please specify "month" or "day" instead of %',
tabletype;
END IF;
--Check whether the table name has a day (YYYY_MM_DD) or month
(YYYY_MM) format
IF LENGTH(substring(result.tablename FROM '[0-9_]*$')) = 10
AND tabletype = 'month' THEN
--This is a daily partition YYYY_MM_DD
-- RAISE NOTICE 'Skipping table % when trying
to delete "%" partitions (%)', result.tablename, tabletype,
length(substring(result.tablename from '[0-9_]*$'));
CONTINUE;
[ 36 ]
Chapter 1
ELSIF LENGTH(substring(result.tablename FROM '[0-9_]*$')) = 7
AND tabletype = 'day' THEN
--this is a monthly partition
--RAISE NOTICE 'Skipping table % when trying to delete "%"
partitions (%)', result.tablename, tabletype, length(substring(result.
tablename from '[0-9_]*$'));
CONTINUE;
ELSE
--This is the correct table type. Go ahead and check if it
needs to be deleted
--RAISE NOTICE 'Checking table %', result.tablename;
END IF;
IF table_timestamp <= delete_before_date THEN
RAISE NOTICE 'Deleting table %', quote_ident(tablename);
EXECUTE 'DROP TABLE ' || prefix || quote_ident(tablename) ||
';';
END IF;
END LOOP;
RETURN 'OK';
END;
$BODY$
LANGUAGE plpgsql VOLATILE
COST 100;
ALTER FUNCTION delete_partitions(INTERVAL, text)
OWNER TO zabbix;
Now you have the housekeeping ready to run. To enable housekeeping, we can use
crontab by adding the following entries:
@daily psql –h<your database host here> -d zabbix_db -q -U zabbix -c
"SELECT delete_partitions('7 days', 'day')"
@daily psql –h<your database host here> -d zabbix_db -q -U zabbix -c
"SELECT delete_partitions('24 months', 'month')"
Those two tasks should be scheduled on the database server's crontab. In this
example, we will keep the history of 7 days and trends of 24 months.
[ 37 ]
www.allitebooks.com
Deploying Zabbix
Now, we can finally disable the Zabbix housekeeping. To disable the housekeeping
on Zabbix 2.4, the best way is use the web interface by selecting Administration |
General | Housekeeper, and there, you can disable the housekeeping for the Trends
and History tables, as shown in the following screenshot:
Now the built-in housekeeping is disabled, and you should see a lot of improvement
in the performance. To keep your database as lightweight as possible, you can clean
up the following tables:
• acknowledges
• alerts
• auditlog
• events
• service_alarms
[ 38 ]
Chapter 1
Once you have chosen your own retention, you need to add a retention policy; for
example, in our case, it will be 2 years of retention. With the following crontab entries,
you can delete all the records older than 63072000 (2 years expressed in seconds):
@daily psql -q -U zabbix -c "delete from acknowledges where clock <
(SELECT (EXTRACT( epoch FROM now() ) - 63072000))"
@daily psql -q -U zabbix -c "delete from alerts where clock < (SELECT
(EXTRACT( epoch FROM now() ) - 63072000))"
@daily psql -q -U zabbix -c "delete from auditlog where clock <
(SELECT (EXTRACT( epoch FROM now() ) - 62208000))"
@daily psql -q -U zabbix -c "delete from events where clock < (SELECT
(EXTRACT( epoch FROM now() ) - 62208000))"
@daily psql -q -U zabbix -c "delete from service_alarms where clock <
(SELECT (EXTRACT( epoch FROM now() ) - 62208000))"
To disable housekeeping, we need to drop the triggers created:
DROP
DROP
DROP
DROP
DROP
DROP
DROP
TRIGGER
TRIGGER
TRIGGER
TRIGGER
TRIGGER
TRIGGER
TRIGGER
partition_trg
partition_trg
partition_trg
partition_trg
partition_trg
partition_trg
partition_trg
ON
ON
ON
ON
ON
ON
ON
history;
history_sync;
history_uint;
history_str_sync;
history_log;
trends;
trends_uint;
All those changes need to be tested and changed/modified as they fit your setup.
Also, be careful and back up your database.
The web interface
The web interface installation is quite easy; there are certain basic steps to execute.
The web interface is completely written in PHP, so we need a web server that
supports PHP; in our case, we will use Apache with the PHP support enabled.
The entire web interface is contained inside the php folder at frontends/php/ that
we need to copy on our htdocs folder:
/var/www/html
[ 39 ]
Deploying Zabbix
Use the following commands to copy the folders:
# mkdir <htdocs>/zabbix
# cd frontends/php
# cp -a . <htdocs>/zabbix
Be careful—you might need proper rights and permissions
as all those files are owned by Apache and they also depend
on your httpd configuration.
The web wizard – frontend configuration
Now, from your web browser, you need to open the following URL:
http://<server_ip_or_name>/zabbix
The first screen that you will meet is a welcome page; there is nothing to do there
other than to click on Next. When on the first page, you may get a warning on your
browser that informs you that the date / time zone is not set. This is a parameter
inside the php.ini file. All the possible time zones are described on the official PHP
website at http://www.php.net/manual/en/timezones.php.
The parameter to change is the date/time zone inside the php.ini file. If you don't
know the current PHP configuration or where it is located in your php.ini file, and
you need detailed information about which modules are running or the current
settings, then you can write a file, for example, php-info.php, inside the Zabbix
directory with the following content:
<?phpphpinfo();phpinfo(INFO_MODULES);
?>
Now point your browser to http://your-zabbix-web-frontend/zabbix/phpinfo.php.
You will have your full configuration printed out on a web page. The following
screenshot is more important; it displays a prerequisite check, and, as you can see,
there is at least one prerequisite that is not met:
[ 40 ]
Chapter 1
On standard Red-Hat/CentOS 6.6, you only need to set the time zone; otherwise, if
you're using an older version, you might have to change the following prerequisites
that most likely are not fulfilled:
PHP
PHP
PHP
PHP
PHP
PHP
PHP
PHP
PHP
PHP
PHP
option post_max_size
option max_execution_time
option max_input_time
bcmath
mbstring
gd unknown
gd PNG support
gd JPEG support
gd FreeType support
xmlwriter
xmlreader
8M
30
60
no
no
16M
300
300
2.0
no
no
no
no
no
Fail
Fail
Fail
Fail
Fail
Fail
Fail
Fail
Fail
Fail
Fail
Most of these parameters are contained inside the php.ini file. To fix them, simply
change the following options inside the /etc/php.ini file:
[Date]
; Defines the default timezone used by the date functions
[ 41 ]
Deploying Zabbix
; http://www.php.net/manual/en/datetime.configuration.php#ini.date.
timezone
date.timezone = Europe/Rome
; Maximum size of POST data that PHP will accept.
; http://www.php.net/manual/en/ini.core.php#ini.post-max-size
post_max_size = 16M
; Maximum execution time of each script, in seconds
; http://www.php.net/manual/en/info.configuration.php#ini.maxexecution-time
max_execution_time = 300
; Maximum amount of time each script may spend parsing request data.
It's a good
; idea to limit this time on productions servers in order to eliminate
unexpectedly
; long running scripts.
; Default Value: -1 (Unlimited)
; Development Value: 60 (60 seconds)
; Production Value: 60 (60 seconds)
; http://www.php.net/manual/en/info.configuration.php#ini.max-inputtime
max_input_time = 300
To solve the issue of the missing library, we need to install the following packages:
• php-xml
• php-bcmath
• php-mbstring
• php-gd
[ 42 ]
Chapter 1
We will use the following command to install these packages:
# yum install php-xml php-bcmath php-mbstring php-gd
The whole list or the prerequisite list is given in the following table:
Prerequisite
Min
value
Solution
PHP Version
5.3.0
PHP memory_limit
128M
In php.ini, change memory_limit=128M.
PHP post_max_size
16M
In php.ini, change post_max_size=16M.
PHP upload_max_
filesize
2M
In php.ini, change upload_max_
filesize=2M.
PHP max_execution_
time option
300
Seconds
In php.ini, change max_execution_
time=300.
PHP max_input_time
option
300
seconds
In php.ini, change max_input_time=300.
PHP session.auto_
start
bcmath
Disabled
In php.ini, change session.auto_start=0.
Use php-bcmath extension
Use php-mbstring extension
mbstring
PHP mbstring.func_
overload
Must be
disabled
In php.ini change
PHP always_populate_
raw_post_data
Must be
set to -1
In php.ini change
mbstring.func_overload = 0.
always_populate_raw_post_data = -1.
This extension is required for user script
support:
sockets
php-net-socket module
The PHP GD extension must support PNG
images (--with-png-dir), JPEG (--withjpeg-dir) images, and FreeType 2 (--withfreetype-dir)
gd
libxml
2.6.15
Use php-xml or php5-dom
[ 43 ]
Deploying Zabbix
Prerequisite
Min
value
Solution
xmlwriter
Use php-xmlwriter
xmlreader
Use php-xmlreader
ctype
Use php-ctype
session
Use php-session
gettext
Use php-gettext. Since 2.2.1 is not a
mandatory requirement, anyway, you can have
issues with the GUI translations
Every time you change a php.ini file or install a PHP extension, the httpd service
needs a restart to get the change. Once all the prerequisites are met, we can click
on Next and go ahead. On the next screen, we need to configure the database
connection. We simply need to fill out the form with the username, password, IP
address, or hostname and specify the kind of database server we are using, as shown
in the following screenshot:
[ 44 ]
Chapter 1
If the connection is fine (this can be checked with a test connection), we can proceed
to the next step. Here, you only need to set the proper database parameters to enable
the web GUI to create a valid connection, as shown in the following screenshot:
There is no check for the connection available on this page, so it is better to verify
that it is possible to reach the Zabbix server from the network. In this form, it is
necessary to fill Host (or IP address) of our Zabbix server. Since we are installing the
infrastructure on three different servers, we need to specify all the parameters and
verify that the Zabbix server port is available on the outside of the server.
Once we fill this form, we can click on Next. After this, the installation wizard
prompts us to view Pre-Installation summary, which is a complete summary of all
the configuration parameters. If all is fine, just click on Next; otherwise, we can go
back and change our parameters. When we go ahead, we see that the configuration
file has been generated (for example, in this installation the file has been generated in
/usr/share/zabbix/conf/zabbix.conf.php).
It can happen that you may get an error instead of a success notification, and most
probably, it is about the directory permission on our conf directory at /usr/share/
zabbix/conf. Remember to make the directory writable to the httpd user (normally,
Apache is writable) at least for the time needed to create this file. Once this step is
completed, the frontend is ready and we can perform our first login.
[ 45 ]
Deploying Zabbix
Capacity planning with Zabbix
Quite often, people mix up the difference between capacity planning and
performance tuning. Well, the scope of performance tuning is to optimize the system
you already have in place for better performance. Using your current performance
acquired as a baseline, capacity planning determines what your system needs and
when it is needed. Here, we will see how to organize our monitoring infrastructure
to achieve this goal and provide us a with useful baseline. Unfortunately, this
chapter cannot cover all the aspects of this argument; we should have one whole
book about capacity planning, but after this section, we will look at Zabbix with a
different vision and will be aware of what to do with it.
The observer effect
Zabbix is a good monitoring system because it is really lightweight. Unfortunately,
every observed system will spend a bit of its resources to run the agent that acquires
and measures data and metrics against the operating system, so it is normal if the agent
introduces a small (normally very small) overhead on the guest system. This is known as
the observer effect. We can only accept this burden on our server and be aware that this
will introduce a slight distortion in data collection, bearing in mind that we should keep
it lightweight to a feasible extent while monitoring the process and our custom checks.
Deciding what to monitor
The Zabbix agent's job is to collect data periodically from the monitored machine
and send metrics to the Zabbix server (that will be our aggregation and elaboration
server). Now, in this scenario, there are certain important things to consider:
• What are we going to acquire?
• How are we going to acquire these metrics (the way or method used)?
• What is the frequency with which this measurement is performed?
Considering the first point, it is important to think what should be monitored on our
host and the kind of work that our host will do; or, in other words, what function it
will serve.
There are some basic metrics of operating systems that are, nowadays, more or less
standardized, and those are: the CPU workload, percentage of free memory, memory
usage details, usage of swap, the CPU time for a process, and all this family of
measure, all of them are built-in on the Zabbix agent.
Having a set of items with built-in measurement means that they are optimized to
produce as little workload as possible on the monitored host; the whole of Zabbix's
agent code is written in this way.
[ 46 ]
Chapter 1
All the other metrics can be divided by the service that our server should provide.
Here, templates are really useful! (Also, it is an efficient
way to aggregate our metrics by type.)
Doing a practical example and considering monitoring the RDBMS, it will be
fundamental to acquire:
• All the operating system metrics
• Different custom RDBMS metrics
Our different custom RDBMS metrics can be: the number of users connected, the use
of cache systems, the number of full table scans, and so on.
All those kinds of metrics will be really useful and can be easily interpolated and
compared against the same time period in a graph. Graphs have some strongpoints:
• They are useful to understand (also from the business side)
• It is often nice to present and integrate on slides to enforce our speech
Coming back to our practical example, well, currently we are acquiring data from
our RDBMS and our operating system. We can compare the workload of our RDBMS
and see how this reflects the workload against our OS. Now?
Most probably, our core business is the revenue of a website, merchant site, or a web
application. We assume that we need to keep a website in a three-tier environment
under control because it is quite a common case. Our infrastructure will be composed
of the following actors:
• A web server
• An application server
• The RDBMS
In real life, most probably, this is the kind of environment that Zabbix will be
configured in. We need to be aware that every piece and every component that can
influence our service should be measured and stored inside our Zabbix monitoring
system. Generally, we can consider it to be quite normal to see people with a strong
system administration background to be more focused on operating system-related
items as well. We also saw people writing Java code that needs to be concentrated
on some other obscure measure, such as the number of threads. The same kind of
reasoning can be done if the capacity planner talks with a database administrator or
a specific guy from every sector.
[ 47 ]
www.allitebooks.com
Deploying Zabbix
This is a quite important point because the Zabbix implementer should have a global
vision and should remember that, when buying new hardware, the interface will
most likely be a business unit.
This business unit very often doesn't know anything about the number of threads
that our system can support but will only understand customer satisfaction,
customer-related issues, and how many concurrent users we can successfully serve.
Having said that, it is really important to be ready to talk in their language, and we
can do that only if we have certain efficient items to graph.
Defining a baseline
Now, if we look at the whole infrastructure from a client's point of view, we can
think that if all our pages are served in a reasonable time, the browsing experience
will be pleasant.
Our goal in this case is to make our clients happy and the whole infrastructure
reliable. Now, we need to have two kinds of measures:
• The one felt from the user's side (the response time of our web pages)
• Infrastructure items related to it
We need to quantify the response time related to the user's navigation, and we need
to know how much a user can wait in front of a web page to get a response, keeping
in mind that the whole browsing experience needs to be pleasant. We can measure
and categorize our metrics with these three levels of response time:
• 0.2 seconds: It gives the feel of an instantaneous response. The user feels
the browser reaction was caused by him/her and not from a server with a
business logic.
• 1-2 seconds: The user feels that the browsing is continuous, without any
interruption. The user can move freely rather than waiting for the pages
to load.
• 10 seconds: The likes for our website will drop. The user will want better
performance and can definitely be distracted by other things.
Now, we have our thresholds and we can measure the response of a web page
during normal browsing, and in the meantime, we can set a trigger level to warn us
when the response time is more than two seconds for a page.
[ 48 ]
Chapter 1
Now we need to relate that to all our other measures: the number of users connected,
the number of sessions in our application server, and the number of connections to
our database. We also need to relate all our measures to the response time and the
number of users connected. Now, we need to measure how our system is serving
pages to users during normal browsing.
This can be defined as a baseline. It is where we currently are and is a measure of
how our system is performing under a normal load.
Load testing
Now that we know how we are, and we have defined the threshold for our goal,
along with the pleasant browsing experience, let's move forward.
We need to know which one is our limit and, more importantly, how the system
should reply to our requests. Since we can't hire a room full of people that can
click on our website like crazy, we need to use software to simulate this kind of
behavior. There is interesting open source software that does exactly this. There are
different alternatives to choose from—one of them is Siege (https://www.joedog.
org/2013/07/siege-3-0-3-url-encoding/).
Seige permits us to simulate a stored browser history and load it on our server. We
need to keep in mind that users, real users, will never be synchronized between
them. So, it is important to introduce a delay between all the requests. Remember
that if we have a login, then we need to use a database of users because application
servers cache their object, and we don't want to measure how good the process is in
caching them. The basic rule is to create a real browsing scenario against our website,
so users who login can log out with just a click and without any random delay.
The stored scenarios should be repeated x times with a growing number of users,
meaning Zabbix will store our metrics, and, at a certain point, we will pass our first
threshold (1-2 seconds per web page). We can go ahead until the response time
reaches the value of our second threshold. There is no way to see how much load
our server can take, but it is well known that appetite comes with eating, so I will
not be surprised if you go ahead and load your server until it crashes one of the
components of your infrastructure.
Drawing graphs that relate the response time to the number of users on a server will
help us to see whether our three-tier web architecture is linear or not. Most probably,
it will grow in a linear pattern until a certain point. This segment is the one on which
our system is performing fine. We can also see the components inside Zabbix, and
from this point, we can introduce a kind of delay and draw some conclusions.
[ 49 ]
Deploying Zabbix
Now, we know exactly what to expect from our system and how the system can
serve our users. We can see which component is the first that suffers the load and
where we need to plan a tuning.
Capacity planning can be done without digging and going deep into what to
optimize. As we said earlier, there are two different tasks—performance tuning and
capacity planning—that are related, of course, but different. We can simply review
our performance and plan our infrastructure expansion.
A planned hardware expansion is always cheaper than an
unexpected, emergency hardware improvement.
We can also perform performance tuning, but be aware that there is a relation
between the time spent and the performance obtained, so we need to understand
when it is time to stop our performance tuning, as shown in the following graph:
[ 50 ]
Chapter 1
Forecasting the trends
One of the most important features of Zabbix is the capacity to store historical data.
This feature is of vital importance during the task of predicting trends. Predicting
our trends is not an easy task and is important considering the business that we
are serving, and when looking at historical data, we should see whether there are
repetitive periods or whether there is a sort of formula that can express our trend.
For instance, it is possible that the online web store we are monitoring needs more
and more resources during a particular period of the year, for example, close to
public holidays if we sell travels. While doing a practical example, you can consider
the used space on a specific server disk. Zabbix gives us the export functionality to
get our historical data, so it is quite easy to import them in a spreadsheet. Excel has
a curve fitting option that will help us a lot. It is quite easy to find a trend line using
Excel that will tell us when we are going to exhaust all our disk space. To add a trend
line into Excel, we need to create, at first, a "scatter graph" with our data; here, it is
also important to graph the disk size. After this, we can try to find a mathematical
equation that is more close to our trend. There are different kinds of formulae that
we can choose; in this example, I used a linear equation because the graphs are
growing with a linear relation.
The trend line process is also known as the curve
fitting process.
The graph that comes out from this process permits us to know, with a considerable
degree of precision, when we will run out of space.
Now, it is clear how important it is to have a considerable amount of historical data,
bearing in mind the business period and how it influences data.
It is important to keep track of the trend/regression line used
and the relative formula with the R-squared value so that it is
possible to calculate it with precision and, if there aren't any
changes in trends, when the space will be exhausted.
[ 51 ]
Deploying Zabbix
The graph obtained is shown in the following screenshot, and from this graph, it is
simple to see that if the trends don't change, we are going to run out of space on
June 25, 2015:
Summary
In this chapter, we completed a Zabbix setup in a three-tier environment. This
environment is a good starting point to handle all the events generated from a large
or very large environment.
In the next chapter, you will go deep into nodes, proxies, and all possible
infrastructure evolution, and, as you will see, all of them are an improvement on the
initial setup. This does not mean that the extensions described in the next chapter are
easy to implement, but all the infrastructural improvements use this three-tier setup
as a starting point. Basically, in the next chapter, you will learn how to expand and
evolve this setup and also see how the distributed scenarios can be integrated into
our installation. The next chapter will also include an important discussion about
security in a distributed environment, making you aware of the possible security
risks that may arise in distributed environments.
[ 52 ]
Distributed Monitoring
Zabbix is a fairly lightweight monitoring application that is able to manage
thousands of items with a single-server installation. However, the presence of
thousands of monitored hosts, a complex network topology, or the necessity
to manage different geographical locations with intermittent, slow, or faulty
communications can all show the limits of a single-server configuration. Likewise,
the necessity to move beyond a monolithic scenario towards a distributed one is
not necessarily a matter of raw performance, and, therefore, it's not just a simple
matter of deciding between buying many smaller machines or just one big, powerful
one. Many DMZs and network segments with a strict security policy don't allow
two-way communication between any hosts on either side, so it is impossible for
a Zabbix server to communicate with all the agents on the other side of a firewall.
Different branches in the same company or different companies in the same group
may need some sort of independence in managing their respective networks, while
also needing some coordination and higher-level aggregation of monitored data.
Different labs of a research facility may find themselves without a reliable network
connection, so they may need to retain monitored data for a while and then send it
asynchronously for further processing.
Thanks to its distributed monitoring features, Zabbix can thrive in all these scenarios
and provide adequate solutions, whether the problem is about performance,
network segregation, administrative independence, or data retention in the presence
of faulty links.
While the judicious use of Zabbix agents could be considered from a point of view
to be a simple form of distributed monitoring, in this chapter, we will concentrate on
Zabbix's supported distributed monitoring mode with proxies. In this chapter, you
will learn how to set up, size, and properly configure a Zabbix proxy.
There will also be considerations about security between proxies and the Zabbix
server communication so that, by the end of this chapter, you will have all the
information you need to apply Zabbix's distributed features to your environment.
[ 53 ]
Distributed Monitoring
Zabbix proxies
A Zabbix proxy is another member of the Zabbix suite of programs that sits between
a full-blown Zabbix server and a host-oriented Zabbix agent. Just as with a server,
it's used to collect data from any number of items on any number of hosts, and it
can retain that data for an arbitrary period of time, relying on a dedicated database to
do so. Just as with an agent, it doesn't have a frontend and is managed directly from
the central server. It also limits itself to data collection without triggering evaluations
or actions.
All these characteristics make the Zabbix proxy a simple, lightweight tool to deploy
if you need to offload some checks from the central server or if your objective is
to control and streamline the flow of monitored data across networks (possibly
segregated by one or more firewalls) or both.
A basic distributed architecture involving Zabbix proxies would look as follows:
Server
Server
Server
z
Web server
Zabbix proxy (passive)
z
Zabbix server
z
Zabbix proxy (active)
Database server
Server
[ 54 ]
Server
Server
Server
Server
Chapter 2
By its very nature, a Zabbix proxy should run on a dedicated machine, which is
different than the main server. A proxy is all about gathering data; it doesn't feature
a frontend, and it doesn't perform any complex queries or calculations; therefore,
it's not necessary to assign a powerful machine with a lot of CPU power or disk
throughput. In fact, a small, lean hardware configuration is often a better choice;
proxy machines should be lightweight enough—not only to mirror the simplicity of
the software component, but also because they should be an easy and affordable way
to expand and distribute your monitoring architecture without creating too much
impact on deployment and management costs.
A possible exception to the small, lean, and simple guideline for proxies can arise if you
end up assigning hundreds of hosts with thousands of monitored items to a single
proxy. In that case, instead of upgrading the hardware to a more powerful machine,
it's often cheaper to just split up the hosts into different groups and assign them to
different smaller proxies. In most cases, this would be the preferred option as you
are not just distributing and evening out the load, but you are also considering the
possibility of huge data loss if a single machine charged with the monitoring of a
large portion of your network were to go down for any reason. Consider using small,
lightweight embedded machines as Zabbix proxies. They tend to be cheap, easy to
deploy, reliable, and quite frugal when it comes to power requirements. These are
ideal characteristics for any monitoring solution that aims to leave as little a footprint
as possible on the monitored system. There is one other consideration: if you have
a very segregated network, that is perhaps even distributed in many different
geographical locations, it is better to consider a very good persistent database on the
back of it. This reason is driven by the fact that a network outage, which can endure
for a considerable period of time, will force the proxy to preserve a considerable
amount of data for an important period of time, and here, if the proxy goes down, it
can be a serious problem.
That said, quantifying the period of time that the proxy needs to survive without any
connectivity with the server can be quite complex as it depends on two particular
factors: the number of the hosts that are monitored by a particular proxy, and,
moreover, the number of items or acquired metrics that the proxy needs to store
in its local database. Here, it is easy to understand that this kind of thinking will
drive the database choice. Whether the proxy is on your local network or not, the
decision will go in favor of a lightweight and performing database, such as SQLite3;
otherwise, we will be obliged to choose a different kind of database that can
maintain data for a long period of time and can be more crash tolerant than MySQL
or PostgreSQL.
[ 55 ]
Distributed Monitoring
Deploying a Zabbix proxy
A Zabbix proxy is compiled together with the main server if you add --enableproxy to the compilation options. The proxy can use any kind of database backend,
just as the server does, but if you don't specify an existing DB, it will automatically
create a local SQLite database to store its data. If you intend to rely on SQLite, just
remember to add --with-sqlite3 to the options as well.
When it comes to proxies, it's usually advisable to keep things light and simple as
much as we can; of course, this is valid only if the network design permits us to take
this decision. A proxy DB will just contain configuration and measurement data that,
under normal circumstances, is almost immediately synchronized with the main
server. Dedicating a full-blown database to it is usually overkill, so unless you have
very specific requirements, the SQLite option will provide the best balance between
performance and ease of management.
If you didn't compile the proxy executable the first time you deployed Zabbix, just
run configure again with the options you need for the proxies:
$ ./configure --enable-proxy --enable-static --with-sqlite3 --with-netsnmp --with-libcurl --with-ssh2 --with-openipmi
In order to build the proxy statically, you must have a static
version of every external library needed. The configure script
doesn't do this kind of check.
Compile everything again using the following command:
$ make
Be aware that this will compile the main server as well; just
remember not to run make install, nor copy the new Zabbix
server executable over the old one in the destination directory.
The only files you need to take and copy over to the proxy machine are the proxy
executable and its configuration file. The $PREFIX variable should resolve to the
same path you used in the configuration command (/usr/local by default):
# cp src/zabbix_proxy/zabbix_proxy $PREFIX/sbin/zabbix_proxy
# cp conf/zabbix_proxy.conf $PREFIX/etc/zabbix_proxy.conf
[ 56 ]
Chapter 2
Next, you need to fill out relevant information in the proxy's configuration file. The
default values should be fine in most cases, but you definitely need to make sure that
the following options reflect your requirements and network status:
ProxyMode=0
This means that the proxy machine is in an active mode. Remember that you need
at least as many Zabbix trappers on the main server as the number of proxies you
deploy. Set the value to 1 if you need or prefer a proxy in the passive mode. See the
Understanding the Zabbix monitoring data flow section for a more detailed discussion on
proxy modes. The following code captures this discussion:
Server=n.n.n.n
This should be the IP number of the main Zabbix server or of the Zabbix node that
this proxy should report to:
Hostname=Zabbix proxy
This must be a unique, case-sensitive name that will be used in the main Zabbix
server's configuration to refer to the proxy:
LogFile=/tmp/zabbix_proxy.log
LogFileSize=1
DebugLevel=2
If you are using a small, embedded machine, you may not have much disk space to
spare. In that case, you may want to comment all the options regarding the log file
and let syslog send the proxy's log to another server on the Internet:
#
#
#
#
#
#
DBHost=
DBSchema=
DBUser=
DBPassword=
DBSocket=
DBPort=
We need now create the SQLite database; this can be done with the following
commands:
$ mkdir –p /var/lib/sqlite/
$ sqlite3 /var/lib/sqlite/zabbix.db < /usr/share/doc/zabbix-proxysqlite3-2.4.4/create/schema.sql
[ 57 ]
Distributed Monitoring
Now, in the DBName parameter, we need to specify the full path to our SQLite
database:
DBName=/var/lib/sqlite/zabbix.db
The proxy will automatically populate and use a local SQLite database. Fill out the
relevant information if you are using a dedicated, external database:
ProxyOfflineBuffer=1
This is the number of hours that a proxy will keep monitored measurements if
communications with the Zabbix server go down. Once the limit has been reached,
the proxy will housekeep away the old data. You may want to double or triple it if
you know that you have a faulty, unreliable link between the proxy and server.
CacheSize=8M
This is the size of the configuration cache. Make it bigger if you have a large number
of hosts and items to monitor.
Zabbix's runtime proxy commands
There is a set of commands that you can run against the proxy to change runtime
parameters. This set of commands is really useful if your proxy is struggling with
items, in the sense that it is taking longer to deliver the items and maintain our
Zabbix proxy up and running.
You can force the configuration cache to get refreshed from the Zabbix server with
the following:
$ zabbix_proxy -c /usr/local/etc/zabbix_proxy.conf -R config_cache_reload
This command will invalidate the configuration cache on the proxy side and will
force the proxy to ask for the current configuration to our Zabbix server.
We can also increase or decrease the log level quite easily at runtime with log_
level_increase and log_level_decrease:
$ zabbix_proxy -c /usr/local/etc/zabbix_proxy.conf –R log_level_increase
[ 58 ]
Chapter 2
This command will increase the log level for the proxy process; the same command
also supports a target that can be PID, process type or process type, number here.
What follow are a few examples.
Increase the log level of the three poller process:
$ zabbix_proxy -c /usr/local/etc/zabbix_proxy.conf -R log_level_
increase=poller,3
Increase the log level of the PID to 27425:
$ zabbix_proxy -c /usr/local/etc/zabbix_proxy.conf -R log_level_
increase=27425
Increase or decrease the log level of icmp pinger or any other proxy processes with:
$ zabbix_proxy -c /usr/local/etc/zabbix_proxy.conf -R log_level_
increase="icmp pinger"
zabbix_proxy [28064]: command sent successfully
$ zabbix_proxy -c /usr/local/etc/zabbix_proxy.conf -R log_level_
decrease="icmp pinger"
zabbix_proxy [28070]: command sent successfully
We can quickly see the changes reflected in the log file here:
28049:20150412:021435.841 log level has been increased to 4 (debug)
28049:20150412:021443.129 Got signal [signal:10(SIGUSR1),sender_
pid:28034,sender_uid:501,value_int:770(0x00000302)].
28049:20150412:021443.129 log level has been decreased to 3 (warning)
Deploying a Zabbix proxy using RPMs
Deploying a Zabbix proxy using the RPM is a very simple task. Here, there are
fewer steps required as Zabbix itself distributes a prepackaged Zabbix proxy that
is ready to use.
What you need to do is simply add the official Zabbix repository with the following
command that must be run from root:
$ rpm –ivh http://repo.zabbix.com/zabbix/2.4/rhel/6/x86_64/
zabbix-2.4.4-1.el6.x86_64.rpm
[ 59 ]
Distributed Monitoring
Now, you can quickly list all the available zabbix-proxy packages with the
following command, again from root:
$ yum search zabbix-proxy
============== N/S Matched: zabbix-proxy ================
zabbix-proxy.x86_64 : Zabbix Proxy common files
zabbix-proxy-mysql.x86_64 : Zabbix proxy compiled to use MySQL
zabbix-proxy-pgsql.x86_64 : Zabbix proxy compiled to use PostgreSQL
zabbix-proxy-sqlite3.x86_64 : Zabbix proxy compiled to use SQLite3
In this example, the command is followed by the relative output that lists all the
available zabbix-proxy packages; here, all you have to do is choose between them
and install your desired package:
$ yum install zabbix-proxy-sqlite3
Now, you've already installed the Zabbix proxy, which can be started up with the
following command:
$ service zabbix-proxy start
Starting Zabbix proxy:
[
OK
]
Please also ensure that you enable your Zabbix proxy when
the server boots with the $ chkconfig zabbix-proxy
on command.
That done, if you're using iptables, it is important to add a rule to enable incoming
traffic on the 10051 port (that is the standard Zabbix proxy port) or, in any case,
against the port that is specified in the configuration file:
ListenPort=10051
To do that, you simply need to edit the iptables configuration file /etc/
sysconfig/iptables and add the following line right on the head of the file:
-A INPUT -m state --state NEW -m tcp -p tcp --dport 10051 -j ACCEPT
Then, you need to restart your local firewall from root using the following command:
$ service iptables restart
[ 60 ]
Chapter 2
The log file is generated at /var/log/zabbix/zabbix_proxy.log:
$ tail -n 40 /var/log/zabbix/zabbix_proxy.log
62521:20150411:003816.801 **** Enabled features ****
62521:20150411:003816.801 SNMP monitoring:
YES
62521:20150411:003816.801 IPMI monitoring:
YES
62521:20150411:003816.801 WEB monitoring:
YES
62521:20150411:003816.801 VMware monitoring:
YES
62521:20150411:003816.801 ODBC:
YES
62521:20150411:003816.801 SSH2 support:
YES
62521:20150411:003816.801 IPv6 support:
YES
62521:20150411:003816.801 **************************
62521:20150411:003816.801 using configuration file: /etc/zabbix/zabbix_
proxy.conf
As you can quickly spot, the default configuration file is
located at /etc/zabbix/zabbix_proxy.conf.
The only thing that you need to do is make the proxy known to the server and
add monitoring objects to it. All these tasks are performed through the Zabbix
frontend by just clicking on Admin | Proxies and then Create. This is shown in
the following screenshot:
[ 61 ]
Distributed Monitoring
Please take care to use the same Proxy name that you've used in the configuration
file, which, in this case, is ZabbixProxy; you can quickly check with:
$ grep Hostname= /etc/zabbix/zabbix_proxy.conf
# Hostname=
Hostname=ZabbixProxy
Note how, in the case of an Active proxy, you just need to specify the proxy's name
as already set in zabbix_proxy.conf. It will be the proxy's job to contact the main
server. On the other hand, a Passive proxy will need an IP address or a hostname for
the main server to connect to, as shown in the following screenshot:
[ 62 ]
Chapter 2
See the Understanding the monitoring data flow with proxies section for more details.
You don't have to assign hosts to proxies at creation time or only in the proxy's edit
screen. You can also do that from a host configuration screen, as follows:
One of the advantages of proxies is that they don't need much configuration or
maintenance; once they are deployed and you have assigned some hosts to one
of them, the rest of the monitoring activities are fairly transparent. Just remember
to check the number of values per second that every proxy has to guarantee, as
expressed by the Required performance column in the proxies' list page:
[ 63 ]
Distributed Monitoring
Values per second (VPS) is the number of measurements per second that a single
Zabbix server or proxy has to collect. It's an average value that depends on the
number of items and the polling frequency for every item. The higher the value, the
more powerful the Zabbix machine must be.
Depending on your hardware configuration, you may need to redistribute the hosts
among proxies or add new ones if you notice degraded performances coupled with
high VPS.
Considering a different Zabbix proxy database
Nowadays, from Zabbix 2.4 the support for nodes has been discontinued, and the
only distributed scenario available is limited to the Zabbix proxy; those proxies now
play a truly critical role. Also, with proxies deployed in many different geographic
locations, the infrastructure is more subject to network outages. That said, there is a
case to consider which database we want to use for those critical remote proxies.
Now, SQLite3 is a good product as a standalone and lightweight setup, but if, in our
scenario, the proxy we've deployed needs to retain a considerable amount of metrics,
we need to consider the fact that SQLite3 has certain weak spots:
• The atomic-locking mechanism on SQLite3 is not the most robust ever
• SQLite3 suffers during high-volume writes
• SQLite3 does not implement any kind of user authentication mechanism
Apart from the point that SQLite3 does not implement any kind of authentication
mechanism, the database files are created with the standard unmask, due to which,
they are readable by everyone. In the event of a crash during high load it is not the
best database to use.
Here is an example of the sqlite3 database and how to access it using a
third-party account:
$ ls -la /tmp/zabbix_proxy.db
-rw-r--r--. 1 zabbix zabbix 867328 Apr 12 09:52 /tmp/zabbix_proxy.db
]# su - adv
[adv@localhost ~]$ sqlite3 /tmp/zabbix_proxy.db
SQLite version 3.6.20
Enter ".help" for instructions
Enter SQL statements terminated with a ";"
sqlite>
[ 64 ]
Chapter 2
Then, for all the critical proxies, it is advisable to use a different database. Here, we
will use MySQL, which is a well-known database.
To install the Zabbix proxy with MySQL, if you're compiling it from source, you
need to use the following command line:
$ ./configure --enable-proxy --enable-static --with-mysql --with-net-snmp
--with-libcurl --with-ssh2 --with-openipmi
This should be followed by the usual:
$ make
Instead, if you're using the precompiled rpm, you can simply run from root:
$ yum install zabbix-proxy-mysql
Now, you need to start up your MySQL database and create the required database
for your proxy:
$ mysql -uroot -p<password>
$ create database zabbix_proxy character set utf8 collate utf8_bin;
$ grant all privileges on zabbix_proxy.* to zabbix@localhost identified
by '<password>';
$ quit;
$ mysql -uzabbix -p<password> zabbix_proxy < database/mysql/schema.sql
If you've installed using rpm, the previous command will be:
$ mysql -uzabbix -p<password> zabbix_proxy < /usr/share/doc/zabbix-proxymysql-2.4.4/create/schema.sql/schema.sql
Now, we need to configure zabbix_proxy.conf and add the proper value to those
parameters:
DBName=zabbix_proxy
DBUser=zabbix
DBPassword=<password>
Please note that there is no need to specify DBHost as the socket used for MySQL.
Finally, we can start up our Zabbix proxy with the following command from root:
$ service zabbix-proxy start
Starting Zabbix proxy:
[
[ 65 ]
OK
]
Distributed Monitoring
Understanding the Zabbix monitoring
data flow
Before explaining the monitoring data flow of our Zabbix proxies, it is important to
have at least an idea of the standard Zabbix monitoring data flow.
We can have at least four different kinds of data sources that can deliver items to the
Zabbix server:
• The Zabbix agent
• The Zabbix sender zabbix_send command
• Custom-made third-party agents
• Zabbix proxy
The following diagram represents the simplified data flow followed by
a Zabbix item:
Escalator
Various
Trapper
Data
DATA
OTHER
OTHER
AGENTS
Other
AGENTS
agents
Alerter
Data
DATA
OTHER
OTHER
OTHER
AGENTS
ZBX
OTHER
AGENTS
AGENTSproxy
AGENTS
Poller
Data
DATA
ZBX
ZBX
SENDER
ZBX
SENDER
sender
Data
DATA
ZBX
agent
Hist.
syncer
HTTP
RDBMS
Config.
syncer
Zabbix server
Be aware that this picture is a simplified, readable version of the full data flow,
and that it includes many other small components that are summarized on the
picture by the block called various. Then, basically on the left-hand side, we have
all our possible data sources, and on the right-hand side, we have the GUI that
represents the Zabbix web interface and, of course, the database that stores all the
items. Now, in the next section, we will see how the dataflow on the Zabbix proxy
detail is implemented.
[ 66 ]
Chapter 2
Understanding the monitoring data flow
with proxies
Zabbix proxies can operate in two different modes, active and passive. An active
proxy, which is the default setup, initiates all connections to the Zabbix server,
both to retrieve configuration information on monitored objects and to send
measurements back to be further processed. You can tweak the frequency of these
two activities by setting the following variables in the proxy configuration file:
ConfigFrequency=3600
DataSenderFrequency=1
Both the preceding values are in seconds. On the server side, in the zabbix_server.
conf file, you also need to set the value of StartTrappers= to be higher than the
number of all active proxies you have deployed. The trapper processes will have to
manage all incoming information from proxies, nodes, and any item configured as an
active check. The server will fork extra processes as needed, but it's advisable to prefork as many processes as you already know the server will use.
Back on the proxy side, you can also set HeartbeatFrequency so that after a
predetermined number of seconds, it will contact the server even if it doesn't have
any data to send. You can then check on the proxy availability with the following
item, where proxy name, of course, is the unique identifier that you assigned to the
proxy during deployment:
zabbix[proxy, "proxy name", lastaccess]
The item, as expressed, will give you the number of seconds since the last contact
with the proxy, a value that you can then use with the appropriate triggering
functions. A good starting point to fine-tune the optimal heartbeat frequency is to
evaluate how long you can afford to lose contact with the proxy before being alerted,
and consider that the interval is just over two heartbeats. For example, if you need
to know whether a proxy is possibly down in less than 5 minutes, set the heartbeat
frequency to 120 seconds and check whether the last access time was over 300
seconds. The following diagram depicts this discussion aptly:
Zabbix active proxy data flow
Req. list of items
Zabbix
server
Send list of items
Send mon. data
Send Heartbeat
[ 67 ]
Zabbix
proxy
Distributed Monitoring
An active proxy is more efficient at offloading computing duties from the server as
the latter will just sit idle, waiting to be asked about changes in configuration or to
receive new monitoring data. The downside is that proxies will often be deployed
to monitor secure networks, such as DMZs, and other segments with strict outgoing
traffic policies. In these scenarios, it would be very difficult to obtain permission for
the proxy to initiate contact with the server. And it's not just a matter of policies;
DMZs are isolated as much as possible from internal networks for extremely good
and valid reasons. On the other hand, it's often easier and more acceptable from a
security point of view to initiate a connection from the internal network to a DMZ. In
these cases, a passive proxy will be the preferred solution.
Connection- and configuration-wise, a passive proxy is almost the mirror image
of the active version. This time, it's the server that needs to connect periodically to
the proxy to send over configuration changes and to request any measurements the
proxy may have taken. On the proxy configuration file, once you've set ProxyMode=1
to signify that this is a passive proxy, you don't need to do anything else. On the
server side, there are three variables you need to check:
• StartProxyPollers=:
This represents the number of processes dedicated to manage passive proxies
and should match the number of passive proxies you have deployed.
• ProxyConfigFrequency=:
The server will update a passive proxy with configuration changes for the
number of seconds you have set in the preceding variable.
• ProxyDataFrequency=:
This is the interval, also in seconds, between two consecutive requests by the
server for the passive proxy's monitoring measurements.
There are no further differences between the two modes of operation for proxies.
You can still use the zabbix[proxy, "proxy name", lastaccess] item to check a
passive proxy's availability, just as you did for the active one:
Zabbix active proxy data flow
Send list of items
Zabbix
server
Request mon. data
Send item data
[ 68 ]
Zabbix
proxy
Chapter 2
At the price of a slightly increased workload for the server, when compared to active
proxies, a passive one will enable you to gather monitoring data from otherwise closed
and locked-down networks. At any rate, you can mix and match active and passive
proxies in your environment depending upon the flow requirements of specific
networks. This way, you will significantly expand your monitoring solution both in its
ability to reach every part of the network and in its ability to handle a large number of
monitored objects, while at the same time keeping the architecture simple and easy to
manage with a strong central core and many simple, lightweight yet effective satellites.
Monitoring Zabbix proxies
Since the proxy is the only component that allows us to split our Zabbix server
workload and is also the only way that we have to split our network topology topdown, we need to keep the Zabbix proxy under our watchful eyes.
We've already seen how to produce an item to monitor them and their respective
heartbeat; an this is not enough.
There are certain useful items that will help us, and all are contained in Template
App Zabbix Proxy. It is important to have a look at it and definitely use it.
Unfortunately, there isn't an item that allows us to check how many items are still on
the proxy queue to be sent.
This is the most obvious and critical check that you should have in place. This can be
solved with the following query against the proxy database:
SELECT ((SELECT MAX(proxy_history.id) FROM proxy_history)-nextid) FROM
ids WHERE field_name='history_lastid'
This query will return the number of items that the proxy still needs to send to the
Zabbix server. Then, the simple way to run this query against a SQLite3 database is
to add the following UserParameter on the proxy side:
UserParameter=zabbix.proxy.items.sync.remaining,/usr/bin/sqlite3 /
path/to/the/sqlite/database "SELECT ((SELECT MAX(proxy_history.
id) FROM proxy_history)-nextid) FROM ids WHERE field_name='history_
lastid'" 2>&1
If you have to choose to use a more robust database behind your proxy, for
instance MySQL, UserParameter will then be the following in the proxy agent
configuration file:
UserParameter=zabbix.proxy.items.sync.remaining, mysql -u <your
username here> -p'<your password here>' <dbname> -e 'SELECT ((SELECT
MAX(proxy_history.id) FROM proxy_history)-nextid) FROM ids WHERE
field_name=history_lastid' 2>&1
[ 69 ]
Distributed Monitoring
Now, all you need to do is set an item on the Zabbix server side, with a relative
trigger associated with it, that will track how your proxy is freeing its queue. This
item is shown in the next screenshot:
An example of the trigger that could be associated with this item can be:
{Hostname:zabbix.proxy.items.sync.remaining.min(10m)}>10000
This trigger will go on fire when the number in queue reaches the length of 10,000
items to send, which is a reasonable number; anyway, here you need to adjust this
particular item to the number of hosts monitored that you have behind your proxy
and the number of items that your proxy is acquiring.
[ 70 ]
Chapter 2
Security considerations
One of the few drawbacks of the whole Zabbix architecture is the lack of builtin security at the Zabbix protocol level. While it's possible to protect both the
web frontend and the Zabbix API by means of a standard SSL layer to encrypt
communications by relying on different authorities for identification, there's simply
no standard way to protect communication between the agents and the server,
between proxies and the server, or among nodes. There's no standard way even
when it comes to message authentication (the other party is indeed who it says it is),
when it comes to message integrity (the data has not been tampered with), or when it
comes to message confidentiality (no one else can read or understand the data).
If you've been paying attention to the configuration details of agents, proxies, and
nodes, you may have noticed that all that a Zabbix component needs to know in
order to communicate with another component is its IP address. No authentication is
performed as relying on only the IP address to identify a remote source is inherently
insecure. Moreover, any data sent is clear text as you can easily verify by running
tcpdump (or any other packet sniffer):
$ zabbix_sender -v -z 10.10.2.9 -s alpha -k sniff.me -o "clear text
data"
$ tcpdump
-s0 -nn -q -A port 10051
00:58:39.263666 IP 10.10.2.11.43654 > 10.10.2.9.10051: tcp 113
E....l@[email protected]...........'C..."^......V.......
.Gp|.Gp|{
"request":"sender data",
"data":[
{
"host":"alpha",
"key":"sniff.me",
" value":"clear text data"}]}
Certainly, simple monitoring or configuration data may not seem much, but at the
very least, if tampered with, it could lead to false and unreliable monitoring.
While there are no standard counter measures to this problem, there are a few
possible solutions to it that increase in complexity and effectiveness from elementary,
but not really secure, to complex and reasonably secure. Keep in mind that this is not
a book on network security, so you won't find any deep, step-by-step instructions on
how to choose and implement your own VPN solution. What you will find is a brief
overview of methods to secure the communication between the Zabbix components,
which will give you a practical understanding of the problem, so you can make
informed decisions on how to secure your own environment.
[ 71 ]
Distributed Monitoring
No network configuration
If, for any reason, you can do absolutely nothing else, you should, at the very least,
specify a source IP for every Zabbix trapper item so that it wouldn't be too easy
and straightforward to spoof monitoring data using the zabbix_sender utility.
Use macro {HOST.CONN} in a template item so that every host will use its own IP
address automatically:
More importantly, make sure that remote commands are not allowed on agents. That
is, EnableRemoteCommands in the zabbix_agentd.conf file must be set to 0. You may
lose a convenient feature, but if you can't protect and authenticate the server-agent
communication, the security risk is far too great to even consider taking it.
[ 72 ]
Chapter 2
Network isolation
Many environments have a management network that is separated and isolated from
your production network via nonrouted network addresses and VLANs. Network
switches, routers, and firewalls typically handle traffic on the production network but
are reachable and can be managed only through their management network address.
While this makes it a bit less convenient to access them from any workstation, it
also makes sure that any security flaw in your components (consider, for example, a
network appliance that has a faulty SSL implementation that you can't use, doesn't
support SNMP v3, or has Telnet inadvertently left open) is contained in a separated
and difficult-to-reach network. You may want to put all of the server-proxy and
master-child communication on such an isolated network. You are just making it
harder to intercept monitoring data and you may be leaving out the server-agent
communication, but isolating traffic is still a sensible solution even if you are going to
further encrypt it with one of the solutions outlined in the following sections.
On the other hand, you certainly don't want to use this setup for a node or proxy
that is situated in a DMZ or another segregated network. It's far more risky to bypass
a firewall through a management network than to have your monitoring data pass
through the said firewall. Of course, this doesn't apply if your management network
is also routed and controlled by the firewall, but it's strongly advised that you verify
that this is indeed the case before looking into using it for your monitoring data.
Simple tunnels
So far, we haven't really taken any measures to secure and encrypt the actual data
that Zabbix sends or receives. The simplest and most immediate way to do that is to
create an ad hoc encrypted tunnel through which you can channel your traffic.
Secure Shell
Fortunately, Secure Shell (SSH) has built-in tunneling abilities, so if you have to
encrypt your traffic in a pinch, you already have all the tools you need.
To encrypt the traffic from an active proxy to the server, just log on to the proxy's
console and issue a command similar to the following one:
$ ssh -N -f [email protected] -L 10053:localhost:10051
[ 73 ]
Distributed Monitoring
In the preceding command, -N means that you don't want the SSH client to execute
any commands other than just routing the traffic; the -f option makes the SSH
client go into the background (so you don't have to keep a terminal open or keep
a start script executing forever); [email protected] is a valid user (and the real
hostname or IP address) on the Zabbix server, and -L port:remote-server:port
sets up the tunnel. The first port number is what your local applications will connect
to, while the following host:port combination specifies what host and TCP port the
SSH server should connect to at the other end of the tunnel.
Now set your Server and ServerPort options in your zabbix_proxy.conf to
localhost and 10053 respectively.
What will happen is that, from now on, the proxy will send data to port 10053 by
itself, where there's an SSH tunnel session waiting to forward all traffic via the SSH
protocol to the Zabbix server. From there, the SSH server will, in turn, forward it
to a local port 10051 and, finally, to the Zabbix daemon. While all of the Zabbix
components don't natively support data encryption for the Zabbix protocol, you'll
still be able to make them communicate while keeping message integrity and
confidentiality; all you will see on the network with such a setup will be standard,
encrypted SSH traffic data on the TCP port 22.
To make a Zabbix server contact a passive proxy via a tunnel, just set up a
listening SSH server on the proxy (you should already have it in order to remotely
administrate the machine) and issue a similar command as the one given earlier on
the Zabbix server, making sure to specify the IP address and a valid user for the
Zabbix proxy. Change the proxy's IP address and connection-port specifications on
the web frontend, and you are done.
To connect to Zabbix nodes, you need to set up two such tunnels, one from the
master to the child and one from the child to the master.
On the master, run the following command:
$ ssh -N -f [email protected] -L 10053:localhost:10051
On the child, run the following command:
$ ssh -N -f [email protected] -L 10053:localhost:10051
Due the critical role covered by the SSH tunnel, it is a good
practice to instruct the SSH client to send keep-alive packets to
the server; an example of this usage is shown right after this tip.
ssh -o ServerAliveInterval=60 -N -f user@zabbix.[child|master] -L
10053:localhost:10051
[ 74 ]
Chapter 2
In the above example, we've seen how to set keep-alive packets; the value of
ServerAliveInterval is expressed in seconds and represents the frequency used to
send packets to maintain alive the session. Also, it would be a good practice to monitor
this channel, and if there are issues, to kill the broken SSH process and restart it.
One of the ways to monitor whether an SSH tunnel is alive or
not can be implemented adding the option:
ExitOnForwatdFailure=yes
This is specified in the command line. Doing that, we only need
to monitor whether the process is alive as the SSH will exit if
there are failures.
Stunnel
Similar functionalities can be obtained using the stunnel program. The main
advantage of using stunnel over SSH is that, with stunnel, you have a convenient
configuration file where you can set up and store all your tunneling configurations,
while with SSH, you'll have to script the preceding commands somehow if you want
the tunnels to be persistent across your machine's reboots.
Once installed, and once you have created the copies of the obtained SSL certificates
that the program needs, you can simply set up all your port forwarding in the /
etc/stunnel/stunnel.conf file. Considering, for example, a simple scenario
with a Zabbix server that receives data from an active proxy and exchanges data
with another node after having installed stunnel and SSL certificates on all three
machines, you could have the following setup.
On the Zabbix server's stunnel.conf file, add the following lines:
[proxy]
accept = 10055
connect = 10051
[node - send]
accept = localhost:10057
connect = node.server:10057
[node – receive]
accept = 10059
connect = 10051
[ 75 ]
Distributed Monitoring
On the Zabbix proxy's stunnel.conf, add the following lines:
[server]
accept = localhost:10055
connect = zabbix.server:10055
On the other node's stunnel.conf, add the following lines:
[node - send]
accept = localhost:10059
connect = node.server:10059
[node – receive]
accept = 10057
connect = 10051
Just remember to update the host and port information for proxies and servers in
their respective configuration files and web frontend forms.
As you can see, the problem with port-forwarding tunnels is that the more tunnels
you set up, the more different ports you have to specify. If you have a large number
of proxies and nodes or if you want to encrypt the agent data as well, all the port
forwarding will quickly become cumbersome to set up and keep track of. This is a
good solution if you just want to encrypt your data on an insecure channel among a
handful of hosts, but if you want to make sure that all your monitoring traffic is kept
confidential, you'll need to resort to a more complete VPN implementation.
A full-blown VPN
This is not the place to discuss the relative merits of different VPN implementations,
but if you do use a VPN solution in your network, consider switching all Zabbix
monitoring to your encrypted channel. Of course, unless you want the whole world
to look at your monitoring data, this is practically mandatory when you link two
nodes or a server and a proxy from distant geographical locations that are connected
only through the Internet. In that case, you hopefully already have a VPN, whether
a simple SSL one or a full-blown IPsec solution. If you don't have it, protecting your
Zabbix traffic is an excellent reason to set up one.
[ 76 ]
Chapter 2
These workarounds will protect your traffic and, in the best-case scenario, will
provide basic host authentication, but keep in mind that until Zabbix supports some
sort of security protocol on the application level, tunneling and encryption will only
be able to protect the integrity of your monitoring data. Any user who gains access
to a Zabbix component (whether it's a server, proxy, or agent) will be able to send
bogus data over the encrypted channel, and you'll have no way to suspect foul play.
So, in addition to securing all communication channels, you also need to make sure
that you have good security at the host level. Starting from Zabbix 3.0, the dialogue
will support encryption done with TLS, and the support will be given between the
server, agent, and proxy. Anyway, this will be available only from Zabbix 3.0. Until
then, we will need to continue to use the alternatives explained in this chapter.
Summary
In this chapter, we saw how to expand a simple, standalone Zabbix installation into
a vast and complex distributed monitoring solution. By now, you should be able
to understand how Zabbix proxies work, how they pass monitoring information
around, what their respective strong points and possible drawbacks are, and what
their impact in terms of hardware requirements and maintenance is.
You also learned about when and how to choose between an active proxy and a
passive one, when there is the case to use a more robust database, such as MySQL,
and more importantly, how to mix and match the two features into a tailor-made
solution for your own environment.
Finally, you now have a clear understanding of how to evaluate possible security
concerns regarding monitored data and what possible measures you can take to
mitigate security risks related to a Zabbix installation.
In the next chapter, we will conclude with an overview on how to deploy Zabbix in
a large environment by talking about high availability at the three levels: database,
monitoring server, and web frontend.
[ 77 ]
High Availability and Failover
Now that you have a good knowledge of all the components of a Zabbix
infrastructure, it is time to implement a highly available Zabbix installation. In a
large environment, especially if you need to guarantee that all your servers are up
and running, it is of vital importance to have a reliable Zabbix infrastructure. The
monitoring system and Zabbix infrastructure should survive any possible disaster
and guarantee business continuity.
High availability is one of the solutions that guarantee business continuity and
provides a disaster recovery implementation; this kind of setup cannot be missed
in this book.
This chapter begins with the definition of high availability, and it further describes
how to implement an HA solution.
In particular, this chapter considers the three-tier setup that we described earlier:
• The Zabbix GUI
• The Zabbix server
• Databases
We have described how to set up and configure each one of the components on high
availability. All the procedures presented in this chapter have been implemented and
tested in a real environment.
In this chapter, we will cover the following topics:
• Understanding what high availability, failover, and service level are
• Conducting an in-depth analysis of all the components (the Zabbix server,
the web server, and the RDBMS server) of our infrastructure and how they
will fit into a highly available installation
• Implementing a highly available setup of our monitoring infrastructure
[ 79 ]
High Availability and Failover
Understanding high availability
High availability is an architectural design approach and associated service
implementation that is used to guarantee the reliability of a service. Availability is
directly associated with the uptime and usability of a service. This means that the
downtime should be reduced to achieve an agreement on that service.
We can distinguish between two kinds of downtimes:
• Scheduled or planned downtimes
• Unscheduled or unexpected downtimes
To distinguish between scheduled downtimes, we can include:
• System patching
• Hardware expansion or hardware replacement
• Software maintenance
• All that is normally a planned maintenance task
Unfortunately, all these downtimes will interrupt your service, but you have to agree
that they can be planned into a maintenance window that is agreed upon.
The unexpected downtime normally arises from a failure, and it can be caused by
one of the following reasons:
• Human error
• Hardware failure
• Software failure
• Physical events
Unscheduled downtimes also include power outages and high-temperature
shutdown, and all these are not planned; however, they cause an outage. Hardware
and software failure are quite easy to understand, whereas a physical event is
an external event that produces an outage on our infrastructure. A practical
example can be an outage that can be caused by lightning or a flood that leads
to the breakdown of the electrical line with consequences on our infrastructure.
The availability of a service is considered from the service user's point of view;
for example, if we are monitoring a web application, we need to consider this
application from the web user's point of view. This means that if all your servers are
up and running, but a firewall is cutting connections and the service is not accessible,
this service cannot be considered available.
[ 80 ]
Chapter 3
Understanding the levels of IT service
Availability is directly tied with service level and is normally defined as a
percentage. It is the percentage of uptime over a defined period. The availability that
you can guarantee is your service level. The following table shows what exactly this
means by considering the maximum admitted downtime for a few of the frequently
used availability percentages:
Availability percentage
Max downtime
per year
Max downtime
per month
Max downtime
per week
90% called one nine
36.5 days
72 hours
16.8 hours
95%
18.25 days
36 hours
8.4 hours
99% called two nines
3.65 days
7.20 hours
1.68 hours
99.5%
1.83 days
3.60 hours
50.4 minutes
99.9% called three nines
8.76 hours
43.8 minutes
10.1 minutes
99.95%
4.38 hours
21.56 minutes
5.04 minutes
99.99% called four nines
52.56 minutes
4.32 minutes
1.01 minutes
99.999% called five nines
5.26 minutes
25.9 seconds
6.05 seconds
99.9999% called six nines
31.5 seconds
2.59 seconds
0.605 seconds
99.99999% called seven nines
3.15 seconds
0.259 seconds
0.0605 seconds
Uptime is not a synonym of availability. A system can be
up and running but not available; for instance, if you have
a network fault, the service will not be available, but all the
systems will be up and running.
The availability must be calculated end to end, and all the components required to
run the service must be available. The next sentence may seem a paradox; the more
hardware you add and the more failure points you need to consider, the greater the
difficulty in implementing an efficient solution. Also, an important point to consider
is how easy the patching of your HA system and its maintenance will be. A truly
highly available system implies that human intervention is not needed; for example, if
you need to agree to a five nines service level, the human (your system administrator)
will have only one second of downtime per day, so here the system must respond to
the issue automatically. Instead, if you agree to a two nines service level agreement
(SLA), the downtime per day can be of 15 minutes; here, the human intervention is
realistic, but unfortunately this SLA is not a common case. Now, while agreeing to an
SLA, the mean time to recovery is an important factor to consider.
[ 81 ]
High Availability and Failover
Mean Time To Recovery (MTTR) is the mean time that a
device will take to recover from a failure.
The first thing to do is to keep the architecture as simple as possible and reduce the
number of actors in play to a minimum. The simpler the architecture, the less the
effort required to maintain, administer, and monitor it. All that the HA architecture
needs is to avoid a single point of failure, and it needs to be as simple as possible. For
this reason, the solution presented here is easy to understand, tested in production
environments, and quite easy to implement and maintain.
Complexity is the first enemy of high availability.
Unfortunately, a highly available infrastructure is not designed to achieve the
highest performance possible. This is because it is normal for an overhead to be
introduced to keep two servers updated, and a highly available infrastructure is not
designed for maximum throughput. Also, there are implementations that consider
using the standby server as a read-only server to reduce the load on a primary node,
using then an unused/inactive server.
A highly available infrastructure is not designed to achieve
maximum performance or throughput.
Some considerations about high
availability
Every HA architecture has common problems to solve or common questions to
respond to:
• How the connection can be handled
• How the failover can be managed
• How the storage is shared or replicated to other sites
[ 82 ]
Chapter 3
There are some production-stable and widely used solutions for each one of those
questions. Let's study these questions in detail:
• How the connection can be handled
One of the possible answers to this question is just one word—VIP (Virtual
IP). Basically, every software component needs to communicate or is
interconnected with different logical layers, and those components are
often deployed on different servers to divide and equalize the workload.
Much of the communication is TCP/IP-based, and here the network protocol
gives us a hand.
It is possible to define a VIP that is assigned to the active servers and all
the software required to be configured to use that address. So if there is a
failover, the IP address will follow the service and all the clients will continue
to work. Of course, this solution can't guarantee that there isn't downtime
at all, but it will be limited by time and will be for a short period of time.
From an administration point of view, apart from checking the failover, the
administrator doesn't need to reconfigure anything.
• How the failover can be managed
The answer to this question is: use a resource manager. You need to think
of a smart way to move a faulty service to the standby node that is
independent of SLA as soon as possible. To achieve the minimum downtime
possible, you need to automate the service failover on the standby node and
give the business continuity. The fault needs to be found as soon as possible
when it happens.
• How the storage is shared or replicated to the other site
This last question can be implemented with different actors, technologies, and
methodologies. You can use a shared disk, a replicated Logical Unit Number (LUN)
between two storages, or a replicated device with software. Unfortunately, using a
replicated LUN between two storages is quite expensive. This software should be closer
to the kernel and should be working on the lowest layer possible to be transparent from
the operating system's perspective, thereby keeping things easy to manage.
Automating switchover/failover with a
resource manager
The architecture that you are going to implement needs a component to automate
switchover or failover; basically, as said earlier, it requires a resource manager.
[ 83 ]
High Availability and Failover
One of the resource managers that is widely used and is production mature is
Pacemaker. Pacemaker is an open source, high-availability resource manager
designed for small and large clusters. Pacemaker is available for download at
http://clusterlabs.org/.
Pacemaker provides interesting features that are really useful for your cluster,
such as:
• Detecting and recovering server issues at the application level
• Supporting redundant configurations
• Supporting multiple node applications
• Supporting startup/shutdown ordering applications
Practically, Pacemaker replaces you and is automated and fast. Pacemaker does the
work that a Unix administrator normally does in the event of a node failure. It checks
whether the service is no more available and switches all the configured services
on the spare node; plus, it does all this work as quickly as possible. This switchover
gives us the time required to do all the forensic analysis while all the services are still
available. In another context, the service would be simply unavailable.
There are different solutions that provide cluster management. Red Hat Cluster Suite
is a popular alternative. It is not proposed here as it is not really completely tied to
Red Hat; however, it is definitely developed with this distribution in mind.
Replicating the filesystem with DRBD
Distributed Replicated Block Device (DRBD) has some features that are the
defining points of this solution:
• This is a kernel module
• This is completely transparent from the point of view of RDBMS
• This provides realtime synchronization
• This synchronizes writes on both nodes
• This automatically performs resynchronization
• This practically acts like a networked RAID 1
The core functionality of DRBD is implemented on the kernel layer; in particular,
DRBD is a driver for a virtual block device, so DRBD works at the bottom of the
system I/O stack.
DRBD can be considered equivalent to a networked RAID 1 below the OS's
filesystem, at the block level.
[ 84 ]
Chapter 3
This means that DRBD synchronization is synced to the filesystem. The worst-case
scenario and more complex to handle is a filesystem replication for a database. In
this case, every commit needs to be acknowledged on both nodes before it happens,
and all the committed transactions are written on both nodes; DRBD completely
supports this case.
Now, what happens when a node is no longer available? It's simple; DRBD will
operate exactly as a degraded RAID 1 would. This is a strong point because, if your
Disaster Recovery site goes down, you don't need to do anything. Once the node
reappears, DRBD will do all the synchronization work for us, that is, rebuilding and
resynchronizing the offline node.
Implementing high availability on
a web server
Now that you know all the software components in play, it's time to go deep into a
web server HA configuration. This proposed design foresees Apache, bonded to a
virtual IP address, on top of two nodes. In this design, the HTTPD or, better, Apache
is on top of an active/passive cluster that is managed by Corosync/Pacemaker.
It is quite an easy task to provide a highly available configuration for the Zabbix GUI
because the web application is well defined and does not produce or generate data
or any kind of file on the web server. This allows you to have two nodes deployed
on two different servers—if possible, on two distant locations—implementing a
highly available fault-tolerant disaster-recovery setup. In this configuration, since
the web content will be static, in the sense that it will not change (apart from the case
of system upgrade), you don't need a filesystem replication between the two nodes.
The only other component that is needed is a resource manager that will detect the
failure of the primary node and coordinate the failover on the secondary node. The
resource manager that will be used is Pacemaker/Corosync.
The installation will follow this order:
1. Installing the HTTPD server on both nodes.
2. Installing Pacemaker.
3. Deploying the Zabbix web interface on both nodes.
4. Configuring Apache to bind it on VIP.
5. Configuring Corosync/Pacemaker.
6. Configuring the Zabbix GUI to access RDBMS (on VIP of PostgreSQL).
[ 85 ]
High Availability and Failover
The following diagram explains the proposed infrastructure:
Secondary (node2)
Web server
Primary (node1)
Primary (node1)
/dev/drbd0
Web server
Z
Zabbix Server
Configuring HTTPD HA
Pacemaker is a sophisticated cluster resource manager that is widely used with a lot
of features. To set up Pacemaker, you need to:
• Install Corosync
• Install Pacemaker
• Configure and start Corosync
It is time to spend a couple of lines on this part of the architecture. Corosync is
a software layer that provides the messaging service between servers within the
same cluster.
Corosync allows any number of servers to be a part of the cluster using different
fault tolerant configurations, such as Active-Active, Active-Passive, and N+1.
Corosync, in the middle of its tasks, checks whether Pacemaker is running and
practically bootstraps all the process that is needed.
To install this package, you can run the following command:
$ yum install pacemaker corosync
[ 86 ]
Chapter 3
Yum will resolve all dependencies for you; once everything is installed, you can
configure Corosync. The first thing to do is copy the sample configuration file
available at the following location:
$ cp /etc/corosync/corosync.conf.example /etc/corosync/corosync.conf
To configure Corosync, you need to choose an unused multicast address and a port:
$ export MULTICAST_PORT=4000
$ export MULTICAST_ADDRESS=226.94.1.1
$ export BIND_NET_ADDRESS=`ip addr | grep "inet " |grep brd |tail -n1 |
awk '{print $4}' | sed s/255/0/`
$ sed -i.bak "s/.*mcastaddr:.*/mcastaddr:\ $MULTICAST_ADDRESS/g" /etc/
corosync/corosync.conf
$ sed -i.bak "s/.*mcastport:.*/mcastport:\ $MULTICAST_PORT/g" /etc/
corosync/corosync.conf
$ sed -i.bak "s/.*bindnetaddr:.*/bindnetaddr:\ $BIND_NET_ADDRSS/g" /etc/
corosync/corosync.conf
Please take care to allow the multicast traffic through the 4000
port running this command from root:
iptables -I INPUT -p udp -m state --state NEW -m
multiport --dports 4000 -j ACCEPT
Follow up the preceding steps with:
service iptables save
Now you need to tell Corosync to add the Pacemaker service and create the /etc/
corosync/service.d/pcmk file with the following content:
service {
# Load the Pacemaker Cluster Resource Manager
name: pacemaker
ver: 1
}
At this point, you need to propagate the files you just configured on node2:
/etc/corosync/corosync.conf
/etc/corosync/service.d/pcmk
After that, you can start Corosync and Pacemaker on both nodes:
$ /etc/init.d/corosync start
$ /etc/init.d/pacemaker start
[ 87 ]
High Availability and Failover
Check the cluster status using the following command:
$ crm_mon
Examine the configuration using the following command:
$ crm configure show
Understanding Pacemaker and STONITH
Shoot The Other Node In The Head (STONITH) can introduce a weak point in this
configuration; it can cause a split-brain scenario, especially if servers are in two distant
locations where numerous causes that can prevent communication between them. The
split-brain scenarios happen when each node believes that the other is broken and that
it is the first node. Then, when the second reboot occurs, it shoots the first and so on.
This is also known as the STONITH death match.
There are basically three issues that can cause one node to STONITH the other:
• The nodes are alive but unable to communicate with each other
• A node is dead
• An HA resource failed to stop
The first cause can be avoided by ensuring redundant communication paths and by
handling the multicast properly. This involves the whole network infrastructure, and
if you buy a network service from a vendor, you cannot expect safety or trust, and
multicasts will not be well managed. The second cause is obvious, and it is unlikely
that the node causes the STONITH death match.
The third cause is not easy to understand. This can be clarified with an example.
Basically, an HA resource is started on a node. If it is started, the resource will be
monitored indefinitely; if the start fails, the resource will be started and stopped and
then restarted in either the current node or the second node. If the resource needs to
be stopped and the stop happens, the resource is restarted on the other node. Now,
if the stop fails, the node will be fenced STONITH because it is considered the safe
thing to do.
If the HA resource can't be stopped and the node is
fenced, the worse action is killing the whole node. This
can cause data corruption on your node, especially if there
is an ongoing transactional activity, and this needs to be
avoided. It's less dangerous if the HA service is a resource,
such as an HTTP server that provides web pages (without
transactional activity involved); however, this is not safe.
[ 88 ]
Chapter 3
There are different ways to avoid the STONITH death match, but we want the
proposed design to be as easy as possible to implement, maintain, and manage, so
the proposed architecture can live without the STONITH actor that can introduce
issues if not managed well and configured.
Pacemaker is distributed with STONITH enabled. STONITH is
not really necessary on a two-node cluster setup.
To disable STONITH, use the following command:
$ crm configure property stonith-enabled="false"
Pacemaker – is Quorum really needed?
Quorum refers to the concept of voting; it means each node can vote with regard
to what can happen. This is similar to democracy, where the majority wins and
implements decisions. For example, if you have a three-node (or more) cluster and
one of the nodes in the pool fails, the majority can decide to fence the failed node.
With the Quorum configuration, you can also decide on a no-Quorum policy; this
policy can be used for the following purposes:
• Ignore: No action is taken if a Quorum is lost
• Stop (default option): This stops all resources on the affected cluster node
• Freeze: This continues running all the existing resources but doesn't start
the stopped ones
• Suicide: This can fence all nodes on the affected partition
All these considerations are valid if you have a three-node or more (nodes)
configuration. Quorum is enabled by default on most configurations, but this
can't be applied to two-node clusters because there is no majority to elect the
winner and get a decision.
The following command needs to be disabled to apply the ignore rule:
$ crm configure property no-quorum-policy=ignore
[ 89 ]
High Availability and Failover
Pacemaker – the stickiness concept
It is obviously highly desirable to prevent healthy resources from being moved around
the cluster. Moving a resource always requires a period of downtime that can't be
accepted for a critical service (such as the RDBMS), especially if the resource is healthy.
To address this, Pacemaker introduces a parameter that expresses how much a service
prefers to stay running where it is actually located. This concept is called stickiness.
Every downtime has its cost, which is not necessarily represented by an expense that is
tied to the little downtime period needed to switch the resource to the other node.
Pacemaker doesn't calculate this cost associated with moving resources and will do
so to achieve the optimal resource placement.
On a two-node cluster, it is important to specify the
stickiness; this will simplify all the maintenance tasks.
Pacemaker can't decide on switching the resource to a
maintenance node without disrupting the service.
Note that Pacemaker's optimal resource placement does not always agree with what
you would want to choose. To avoid this movement of resources, you can specify a
different stickiness for every resource:
$ crm configure property default-resource-stickiness="100"
It is possible to use INFINITY instead of a number on the
stickiness properties. This will force the cluster to stay on that
node until it's dead, and once the INFINITY node comes up,
all will migrate back to the primary node:
$ crm configure property default-resourcestickiness="INFINITY"
Pacemaker – configuring Apache/HTTPD
The Pacemaker resource manager needs to access the Apache server's status to
know the status of HTTPD. To enable access to the server's status, you need to
change the /etc/httpd/conf.d/httpd.conf file as follows:
<Location /server-status>
SetHandler server-status
Order deny,allow
Deny from all
Allow from
127.0.0.1 <YOUR-NETWOR-HERE>/24
</Location>
[ 90 ]
Chapter 3
For security reasons, it makes sense to deny access to this
virtual location and permit only your network and the
localhost (127.0.0.1).
Once this is done, we need to restart Apache by running the following command
from root:
$ service httpd restart
This kind of configuration foresees two web servers that will be called www01 and
www02 to simplify the proposed example. Again, to keep the example as simple as
possible, you can consider the following addresses:
• www01 (eth0 192.168.1.50 eth1 10.0.0.50)
• www02 (eth0 192.168.1.51 eth1 10.0.0.51)
Now the first step to perform is to configure the virtual address using the
following commands:
$ crm configure
crm(live)configure#
primitive vip ocf:heartbeat:IPaddr2 \
> params ip="10.0.0.100"
# please note that 10.0.0.100 is the pacemaker ip address
> nic="eth1" \
> cidr_netmask="24" \
> op start interval="0s" timeout="50s" \
> op monitor interval="5s" timeout="20s" \
> op stop interval="0s" timeout="50s"
crm(live)configure#
show
# make sure
node www01.domain.example.com
node www02.domain.example.com
primitive vip ocf:heartbeat:IPaddr2 \
params ip="10.0.0.100" nic="eth1" cidr_netmask="24" \
op start interval="0s" timeout="50s" \
op monitor interval="5s" timeout="20s" \
op stop interval="0s" timeout="50s"
property $id="cib-bootstrap-options" \
[ 91 ]
High Availability and Failover
dc-version="1.1.2-f059ec7cedada865805490b67ebf4a0b963bccfe" \
cluster-infrastructure="openais" \
expected-quorum-votes="2" \
no-quorum-policy="ignore" \
stonith-enabled="false"
rsc_defaults $id="rsc-options" \
resource-stickiness="INFINITY" \
migration-threshold="1"
crm(live)configure# commit
crm(live)configure# exit
Using commit, you can enable the configuration. Now, to be sure that everything
went fine, you can check the configuration using the following command:
$ crm_mon
You should get an output similar to the following one:
============
Last updated: Fri Jul 10 10:59:16 2015
Stack: openais
Current DC: www01.domain.example.com
- partition WITHOUT quorum
Version: 1.1.2-f059ec7cedada865805490b67ebf4a0b963bccfe
2 Nodes configured, , unknown expected votes
1 Resources configured.
============
Online: [ www01.domain.example.com
vip
www02.domain.example.com
(ocf::heartbeat:IPaddr2):
]
Started www01.domain.example.com
To be sure that the VIP is up and running you can simply ping it
$ ping 10.0.0.100
PING 10.0.0.100 (10.0.0.100) 56(84) bytes of data.
64 bytes from 10.0.0.100: icmp_seq=1 ttl=64 time=0.012 ms
64 bytes from 10.0.0.100: icmp_seq=2 ttl=64 time=0.011 ms
64 bytes from 10.0.0.100: icmp_seq=3 ttl=64 time=0.008 ms
64 bytes from 10.0.0.100: icmp_seq=4 ttl=64 time=0.021 ms
[ 92 ]
Chapter 3
Now you have the VIP up and running. To configure Apache in the cluster, you need
to go back to the CRM configuration and tell Corosync that you will have
a new service, your HTTPD daemon, and that it will have to group it with the VIP.
This group will be called "web server".
This configuration will tie the VIP and the HTTPD, and both will be up and running
on the same node. We will configure the VIP using the following commands:
$ crm configure
crm(live)configure# primitive httpd ocf:heartbeat:apache \
> params configfile="/etc/httpd/conf/httpd.conf" \
> port="80" \
> op start interval="0s" timeout="50s" \
> op monitor interval="5s" timeout="20s" \
> op stop interval="0s" timeout="50s"
crm(live)configure# group webserver vip httpd
crm(live)configure# commit
crm(live)configure# exit
Now you can check your configuration using the following command:
$ crm_mon
============
Last updated: Fri Jul 10 10:59:16 2015
Stack: openais
Current DC: www01.domain.example.com - partition WITHOUT quorum
Version: 1.1.2-f059ec7cedada865805490b67ebf4a0b963bccfe
2 Nodes configured, unknown expected votes
1 Resources configured.
============
Online: [ www01.domain.example.com www02.domain.example.com ]
Resource Group: webserver
vip
example.com
(ocf::heartbeat:IPaddr2):
Started www01.domain.
httpd
example.com
(ocf::heartbeat:apache):
Started www01.domain.
Note that since you are not using Quorum, you need to make
sure that the crm_mon display: partition WITHOUT
Quorum and unknown expected votes are normal.
[ 93 ]
High Availability and Failover
Configuring the Zabbix server for high
availability
A high-availability cluster for a Zabbix server is easier to configure compared to
Apache or a database server. Whether it's a standalone server or a node that is
a part of a distributed setup, the procedure is exactly the same, as shown in the
following diagram:
Secondary Node
Z
Zabbix Server
Primary (node1)
Primary (node1)
/dev/drbd0
Web server
Primary Node
Z
Zabbix Server
Once you have installed Corosync and Pacemaker on the two nodes (see the
previous sections for details), you will also install Zabbix on the nodes that will
make the cluster. You will then need to configure Zabbix to listen to the virtual IP
address that you have identified for the cluster. To do so, change both SourceIP and
ListenIP to the appropriate value in the zabbix_server.conf configuration file:
SourceIP=10.10.1.9
ListenIP=10.10.1.9
Needless to say, change the IP value to the one that you have
reserved as a virtual IP for the Zabbix cluster and that is
appropriate for your environment.
[ 94 ]
Chapter 3
You can now proceed to disable STONITH using the following command:
$ crm configure property stonith-enabled="false"
If you have just two nodes, you also need to disable Quorum; otherwise, the cluster
won't know how to obtain a majority:
$ crm configure property no-quorum-policy=ignore
And finally, set the service stickiness high enough so that you don't have a service
going back and forth between the nodes and it stays where it is unless you manually
move it or the active node goes down:
$ crm configure property default-resource-stickiness="100"
Much like the Apache/HTTPD cluster configuration, you now need to define a
primitive for the virtual IP:
$ crm configure primitive Zbxvip ocf:heartbeat:IPaddr2 \
params ip="10.10.1.9" iflabel="httpvip" \
op monitor interval="5"
For the Zabbix server, define the primitive using the following command:
$ crm configure primitive Zabbix lsb::zabbix_server \
op monitor interval="5"
Just as in the previous section, all that is now left to do is group the primitives
together, set up colocation, and service StartOrder—and you are done:
$ crm configure group Zbx_server Zbxvip Zabbix meta target-role="Started"
$ crm configure colocation Ip_Zabbix inf: Zbxvip Zabbix
$ crm configure order StartOrder inf: Zbxvip Zabbix
As you can see, the simpler the components, the easier it is to set them up in a cluster
configuration using Pacemaker. While it is still fairly easy and simple, things start
to change when you turn to configure the most critical part of any high-availability
setup: the database and data storage.
Implementing high availability for
a database
Implementing high availability for a database is not an easy task. There are a lot
of ways to implement a high-availability configuration using different software
and complexity.
[ 95 ]
High Availability and Failover
The architecture proposed here is fully redundant; it is one of the possible solutions
that are widely used in large environments. You need two database servers and two
installations of the same software and operating system to implement this solution.
Obviously, since servers are twins and tied together, they need to have the same
software, have the same release patch, and basically, be identical.
Since we are going to have two different servers, it is clear that the data needs to be
replicated between them; this implies that your server needs to be interconnected with
a dedicated network connection that is capable of providing the needed throughput.
In this design, your server can be placed in the same location or in two different data
centers that provide a reliable disaster-recovery solution. In this case, we are going to
provide a highly available design.
There are different ways to provide data replication between two servers. They
are as follows:
• Filesystem replication
• Shared disk failover
• Hot/warm standby using PITR
• Trigger-based master-standby replication
• Statement-based replication middleware
• Asynchronous multimaster replication
• Synchronous master replication
There are positive and negative sides to each one of them. Among all these
options, we can exclude all the solutions that are trigger-based because all of them
introduce an overhead on the master node. Also, adding a user-lever layer can be
imprecise/inexact.
Between these options, there are a few solutions that permit a low or really low mean
time to recovery and are safe from data loss. The following solutions guarantee that,
if there is a master failure, there will no data loss:
• Shared disk failover
• Filesystem replication
• Statement-based replication middleware
A solution that adopts a shared disk failover cluster implies the use of a shared
SAN. This means that if you want to place your server on a separate server farm in a
different location, this system will be really expensive.
[ 96 ]
Chapter 3
If the solution adopts a warm and hot standby using Point-In-Time Recovery (PITR)
and your node goes down, you need enough free space to handle and store all the
transaction log files generated. This configuration, by design, needs a secondary
database (identical to the master node) that is a warm standby and waits for the
log transaction. Once the transaction has arrived, the RDBMS needs to apply the
transaction on your secondary node.
In this case, if the secondary node goes down, we need to be warned because the
primary database will produce the archived log files that are not shipped, and this
can bring your infrastructure to a halt. In a large environment, the transactional
activity is normally heavy, and if the fault happens to be out of the normal working
hours, this HA configuration needs to be handled.
Another way is the PostgreSQL synchronous replication. If the secondary node
goes down, this configuration would need a reload to prevent the hanging of
the transaction from hanging.
Trigger-based configurations are heavy and dangerous because they imply that a
trigger can go on firing every insert and replicate the same insert on the secondary
node by introducing a feasible overhead. Partitioning with inheritance is not
supported well by this method. Also, this method does not give us a warranty
against data loss when the master fails.
Infrastructures that include a second standby database introduce a second actor,
that is, if the database is down or unreachable, it shouldn't cause a master to hang.
Nowadays, with PostgreSQL 9.1, synchronous replication is a viable solution. These
configurations unfortunately add certain constraints: the transmission must be
acknowledged before the commit happens, and the transmission doesn't guarantee
that you will get a reply.
This practically means that if the secondary node goes down, the primary database
will hang until the slave receives the transaction and notifies back to the master
that this one has been acquired. The result is that a primary node can hang for an
indefinite period of time, and this practically doubles the risk of downtime.
An issue on the slave's node shouldn't impact the primary node. This practically
doubles the risk of downtime and is not acceptable in the context of high availability.
Clustering of PostgreSQL
The cluster presented here is simple and designed to have as few actors in play as
possible but with the high-availability design in mind.
[ 97 ]
High Availability and Failover
The architecture shown in the following diagram is efficient. It has a minimum
number of actors in play and is easy to monitor, maintain, and upgrade:
Secondary (node2)
/dev/drbd0
TCP/IP DR:BD
Primary (node1)
/dev/drbd0
Web server
Z
Zabbix Server
Mirrored logical volume with LVM and DRDB
LVM2 is the Linux implementation of Logical Volume Manager (LVM) on the
Linux logical device mapper framework. LVM2, apart from the name, doesn't have
anything in common with the previous one.
The basic concepts of LVM2 are as follows:
• Physical Volume (PV): This is the actual physical partition or storage system
on which the LVM system is built.
• Volume Group (VG): This is the basic administrative unit. It may include
one or more PVs. Every VG has a unique name and can be extended at
runtime by adding additional PVs or enlarging the existing PV.
• Logical Volume (LV): This is available as a regular block device to the Linux
kernel, and its components can be created at runtime within the available
volume groups. Logical volumes can be resized when online and also moved
from one PV to another PV if they are on the same VG.
[ 98 ]
Chapter 3
• Snapshot Logical Volume (SLV): This is a temporary point-in-time copy
of an LV. The strong point is that if the size is really big (several hundred
gigabytes), the space required is significantly less than the original volume.
The partition-type Linux LVM that owns the signature 0x8E
is used exclusively for LVM partitions. This, however, is not
required. LVM indeed recognizes the PV group by a signature
written on the PV initialization.
SLV
...
LV
LV
SLV
Volume Group (VG)
PV
...
PV
Since a logical volume, once created, is simply seen as a block device, you can use
DRBD on it.
Prerequisite tasks to start with DRBD on LVM
While setting up DRBD on LVM, there are certain basic steps to bear in mind:
• LVM needs to know about your DRBD devices
• LVM caching needs to be disabled
• Remember to update initramfs with the new kernel device map
[ 99 ]
High Availability and Failover
LVM, by default, scans all block devices founded on /dev while looking for PV
signatures; hence, we need to set an appropriate filter on /etc/lvm/lvm.conf:
filter = ["a|sd.*|", "a|drbd.*|", "r|.*|"]
This filter accepts all the SCSI and DRBD disks. Now, we need to rescan all your
volume groups with the following command:
# vgscan
It is important that you remember to disable LVM caching because DRBD disks
will disappear in the event of a failure. This is normal when we face a fault, and if
caching is not disabled, it is possible that you will see the disk as available when in
reality it is not.
This is done by adding the following line in /etc/lvm/lvm.conf:
write_cache_state = 0
Now that the cache has been disabled, it is possible that we still have a portion or
piece of cache on your disks that was generated previously. We need to clean up the
following location:
/etc/lvm/cache/.cache
Now it's better to regenerate the kernel device map files with the following
command:
# update-initramfs –u
Now it is possible for us to go ahead with the configuration.
Creating a DRBD device on top of the LVM partition
Now that your caching is disabled and the LVM is properly configured, we need to
create your PV. To initialize your SCSI partitions as physical volumes, we run the
following commands from the root account:
$ pvcreate /dev/sda1
Physical volume "/dev/sda1" successfully created
$pvcreate /dev/sdb1
Physical volume "/dev/sdb1" successfully created
The given output tells us that the volume has been initialized. Now you can create
a low-level VG, vgpgdata:
$ vgcreate vgpgdata /dev/sda1 /dev/sda2
Volume group "vgpgdata" successfully created
[ 100 ]
Chapter 3
Finally, you can create your volume or a better logical volume that will be used as
DRBD's block device:
$ lvcreate --name rpgdata0 --size 10G local
Logical volume "rpgdata0" created
All these steps need to be repeated in the same order on both your nodes. Now you
need to install DRBD on both nodes using the following command:
$ yum install drbd kmod-drbd
To install DRBD, it is important to have the EXTRAS
repositories enabled.
Now edit the drbd.conf file located in /etc/drbd.conf and create the rpgdata0
resource as follows:
resource rpgdata0 {
device /dev/drbd0;
disk /dev/local/rpgdata0;
meta-disk internal;
on <host1> { address <address_host1>:<port>; }
on <host2> { address <address_host2>:<port>; }
}
Replace host1, host2, address_host1, and
address_host2 with the two hostnames and their
respective network addresses.
Make sure that you have copied the drbd.conf file on both nodes before proceeding
with the next section. Disable automatic start for DRBD because it will be managed
by Pacemaker:
$ chkconfig drbd off
Enabling resources in DRBD
Now, before we initialize our DRBD service, it is important to do a bit of server-side
configuration. Here, SELinux can cause quite a few issues, so the best approach with
RedHat 6.X is to disable SELinux.
To disable or set SELinux to permissive, you need to edit the configuration file
/etc/sysconfig/selinux by setting the SELinux option as follows:
SELINUX=permissive
[ 101 ]
High Availability and Failover
This needs to be done on both nodes; once done, you need to reboot and can check
whether the status has been properly retrieved with this command from root:
# sestatus
SELinux status:
enabled
SELinuxfs mount:
/selinux
Current mode:
permissive
Mode from config file:
permissive
Policy version:
24
Policy from config file:
targeted
Here, we see that Current mode is set to permissive.
Now it is time to add an iptables rule to allow connectivity across port 7788 by
adding the following rule to our iptable. We can directly edit the /etc/sysconfig/
iptables file by adding the following line:
-A INPUT –m stat –state NEW –m tcp –p tcp –-dport 7788 –j ACCEPT
Then, we need to restart iptables with:
# service iptables restart
iptables: Setting chains to policy ACCEPT: nat mangle filte[
OK
]
iptables: Flushing firewall rules:
[
OK
]
iptables: Unloading modules:
[
OK
]
iptables: Applying firewall rules:
[
OK
]
Now that the configuration file has been copied on all your nodes and we've
finished with SELinux and iptables, it is time to initialize the device and create
the required metadata.
This initialization process needs to be executed on both nodes and can be run from
root using the following command:
$ drbdadm create-md rpgdata0
v08 Magic number not found
Writing meta data...
initialising activity log
NOT initializing bitmap
New drbd meta data block successfully created.
This is the initialization process and needs to be executed only
on a new device.
[ 102 ]
Chapter 3
Now you can enable the rpgdata0 resource:
$ drbdadm up rpgdata0
The process can be observed by looking at the /proc virtual filesystem:
$ tail /proc/drbd
version: 8.4.1 (api:1/proto:86-100)
GIT-hash: 91b4c048c1a0e06837625f65d312b38d47abara80 build by buildsystem@
linbit, 2013-02-20 12:58:48
0: cs:Connected ro:Secondary/Secondary ds:Inconsistent/Inconsistent C
r----ns:0 nr:0 dw:0 dr:0 al:0 bm:0 lo:0 pe:0 ua:0 ap:0 ep:1 wo:b
oos:524236
The Inconsistent/Inconsistent state here, at this point,
is normal. You need to specify which node is the master and
which will be the source of this synchronization.
At this point, DRBD has allocated the disk and network and is ready to begin the
synchronization.
Defining a primary device in DRDB
The primary promotion is quite easy; you need go to the primary node and run the
following command:
$ drbdadm primary rpgdata0
Now the server on which you run this command becomes the master of the
replication server, and you can create the PV on that new device. So, on the master
node, you need to run the following command:
$ pvcreate /dev/drbd0
Physical volume "/dev/drbd0" successfully created
Create your VG, which, in this example, will be secured_vg_pg:
$ vgcreate secured_vg_pg /dev/drbd0
Volume group "secured_vg_pg" successfully creatced
Finally, it is possible to create an LV on that PV using the following command:
$ lvcreate -L 6G -n secured_lv_pg secured_vg_pg
[ 103 ]
High Availability and Failover
In this example, we reserved a space for snapshots; so, if you ever want one, you
have enough space for that. Finally, it is possible to set up the filesystem.
Creating a filesystem on a DRBD device
Now it is important to check whether the DRBD service is disabled from the startup
and shutdown lists because this service will be managed directly from Pacemaker.
Once you disable the service, it is possible to create the filesystem on the new device
but before that, it is important to do the following:
• Create a mountpoint
• Create a filesystem
• Mount the filesystem and make it available
You can create your own mountpoint, but this step-by-step installation will
use /db/pgdata:
$ mkdir -p -m 0700 /db/pgdata
Now, there are different filesystems supported by most of the distributions; RedHat
6.0 completely supports XFS. XFS has an important feature that permits parallel
access to the filesystem. It supports parallel read/write. XFS allows us to write the
same files from multiple threads concurrently; this, obviously, is a big improvement
for a large database table, and it also reduces the contention on filesystems.
To install XFS and the relative utils, use the following command:
$ yum install xfsprogs
XFS allows write access to the same file for multiple thread
concurrency; this is interesting, especially in DRBD use, where
contention on filesystems becomes an important factor.
Once installed and available, you can format the logical volume using the following
command:
$ mkfs.xfs /dev/secured_vg_pg/secured_lv_pg
Once created, the filesystem can't be reduced but only enlarged
using the xfs_growfs command.
[ 104 ]
Chapter 3
Now you can mount the filesystem using the following command:
$ mount -t xfs -o noatime,nodiratime,attr2 /dev/secured_vg_pg/secured_lv_
pg /db/pgdata
Do not forget to add this partition on automount (fstab);
otherwise, you will lose your partition after a reboot.
Everything can be changed to your PostgreSQL process owner, usually postgres:
$ chown postgres:postgres /db/pgdata
$ chmod 0700 /db/pgdata
The filesystem creation steps need to be done only on the
primary node.
Now the filesystem is mounted, formatted, and ready for PostgreSQL.
Pacemaker clusters – integrating DRBD
Pacemaker makes DRBD extremely powerful in a really wide variety of scenarios.
There are some attention points that have already been discussed when we presented
Pacemaker/Corosync. These points are as follows:
• Disable STONITH
• Disable Quorum
• Enable stickiness
As discussed earlier in this chapter, it is really important to avoid split-brain
scenarios and STONITH death matches. Just as a reminder, to disable STONITH,
you can run the following command:
$ crm configure property stonith-enabled="false"
Since this again is a two-node cluster, it is strongly recommended that you disable
Quorum. The command that permits us to do this is as follows:
$ crm configure property no-quorum-policy=ignore
[ 105 ]
High Availability and Failover
Now, it is preferred that stickiness be enabled. This argument has been discussed
earlier in the chapter. Anyway, as a quick reminder, we can say that, by enabling
stickiness, we have a guarantee of a preferred node over another. This will help you
to keep your cluster on one side and have a preferred site where everything should
run. The command for this is as follows:
$ crm configure property default-resource-stickiness="100"
Enabling the DRBD configuration
This section explains how to enable the DRBD-backend service in your Pacemaker
cluster. There are a few steps to be followed:
• Add DRDB to Pacemaker
• Add and define the master/slave resource
You need to have a master/slave resource that controls which node is primary and
which one is secondary. This can be done with the following command:
$ crm configure primitive drbd_pg ocf:linbit:drbd \
params drbd_resource="rpgdata0" \
op monitor interval="15" \
op start interval="0" timeout="240" \
op stop interval="0" timeout="120"
Once done, you need to set up a resource that can promote or demote the DRBD
service on each node. Keep in mind that the service needs to run on both the nodes at
all times with a different state, thus defining a master/slave resource as follows:
$ crm configure ms ms_drbd_pg drbd_pg \
meta master-max="1" master-node-max="1" clone-max="2" \
clone-node-max="1" notify="true"
Pacemaker – the LVM configuration
Now you need to configure Pacemaker to:
• Manage the LVM
• Manage the filesystem
[ 106 ]
Chapter 3
Because of the design and working of DRBD, the actual active volume will be
invisible on the secondary node. On the secondary node, you can't mount or handle
this volume. Having said that, you need to help DRBD to find devices:
$ crm configure primitive pg_lvm ocf:heartbeat:LVM \
params volgrpname="secured_vg_pg" \
op start interval="0" timeout="30" \
op stop interval="0" timeout="30"
With the preceding configuration, Pacemaker will search for a usable volume on
DRBD devices and will be available using the DRBD resource promotion. Since the
filesystem adopted on DRBD devices is XFS, you need to define how to mount and
handle this device:
$ crm configure primitive pg_fs ocf:heartbeat:Filesystem \
params device="/dev/secured_vg_pg/secured_lv_pg" directory="/db/pgdata" \
options="noatime,nodiratime" fstype="xfs" \
op start interval="0" timeout="60" \
op stop interval="0" timeout="120"
Since LVM is the last layer on this configuration, you can take advantage of snapshot
capabilities and a good level of isolation.
Pacemaker – configuring PostgreSQL
Now you can add the PostgreSQL configuration to the cluster.
PostgreSQL installation is not covered here because it is
already discussed in Chapter 1, Deploying Zabbix.
The following lines add a primitive to Pacemaker that will set a PostgreSQL health
check every 30 seconds and define a timeout of 60 seconds to retrieve the response:
$ crm configure primitive pg_lsb lsb:postgresql \
op monitor interval="30" timeout="60" \
op start interval="0" timeout="60" \
op stop interval="0" timeout="60"
This command extends the start and stop timeout because it
will handle big databases. It can also happen that Pacemaker
may be required to give time to complete a checkpoint on
shutdown and a recovery on startup.
[ 107 ]
High Availability and Failover
Pacemaker uses those parameters in a primary manner to determine whether
PostgreSQL is available or not.
Pacemaker – the network configuration
Up until now, you haven't configured a predefined IP address for PostgreSQL. Since
it doesn't make sense to have different addresses in the event of a switchover or
failover, you need to set up a virtual IP that will follow your service. This prevents
any change of configuration for all your clients. You can use a cluster name or an IP
address. For that, you need to issue the following lines:
$ crm configure primitive pg_vip ocf:heartbeat:IPaddr2 \
params ip="192.168.124.3" iflabel="pgvip" \
op monitor interval="5"
NOTE: change the address 192.168.124.3 with your own.
Here, it is not specified that the ARP address, IPaddr2, will automatically send five
ARP packets, and this value can be increased if necessary.
Pacemaker – the final configuration
Now you have all the required components ready to be tied together in a group that
will contain all your resources. The group is PGServer:
$ crm configure group PGServer pg_lvm pg_fs pg_lsb pg_vip
$ crm configure colocation col_pg_drbd inf: PGServer ms_drbd_pg:Master
The Master server specifies that your PGServer group depends on the master/slave
setup reporting a master status that happens exclusively on an active node. It is also
true that the PGServer group depends on the DRBD master.
Now it is important to specify the right order to start and shutdown all the services.
We will use the following command to do so:
$ crm configure order ord_pg inf: ms_drbd_pg:promote PGServer:start
The :promote and :start options are fundamental; they
mean that once ms_drdb_pg is promoted, PGServer will
start. With this precise order of events, if you omit :start,
Pacemaker can choose the start/stop order, and it might end
up in a broken state.
[ 108 ]
Chapter 3
Cluster configuration – the final test
Finally, the cluster is ready! What do we do next? It is simple! You can break your
own cluster, play with the configuration, and verify that all is fine before we go live
with this new infrastructure.
The faults that need to be tested are as follows:
• The node goes offline
• Manual failover of the cluster
• Primary crash
• Secondary crash
• Forceful synchronization of all the data
Run the following command:
$ crm node standby HA-node2
If all is fine, crm_mon will respond with the following:
Node HA-node2: standby
Online: [ HA-node1 ]
You can easily fix this state by firing the following command:
$ crm node online HA-node2
Until now, it has been quite easy. Now you can try a failover of the whole cluster
using the following command:
$ crm resource migrate PGServer HA-node2
You can migrate PGServer to the second node. If that becomes
unavailable, Pacemaker will move to the primary node until
the secondary return. This is because the migrate command
will give a higher score to the named node, and this will win
against your specified stickiness.
The server can be migrated back with the following:
$ crm resource unmigrate PGServer
[ 109 ]
High Availability and Failover
Now you can switch off the secondary node and Pacemaker will respond with
the following:
Online: [ HA-node1 ]
OFFLINE: [ HA-node2 ]
Master/Slave Set: ms_drbd_pg [drbd_pg]
Masters: [ HA-node1 ]
Stopped: [ drbd_pg:1 ]
After that, you can start up the secondary node again. Now switch off the secondary
node and Pacemaker will respond with the following:
Online: [ HA-node1 HA-node2 ]
Master/Slave Set: ms_drbd_pg [drbd_pg]
Masters: [ HA-node1 ]
Slaves: [ HA-node2 ]
Now, as a final test, you can invalidate all the data on the secondary node with the
following command:
$ drbdadm invalidate-remote all
Alternatively, from the secondary node, you can run the following command:
$ drbdadm invalidate all
This will force DRBD to consider all the data on the secondary node out of sync.
Therefore, DRBD will resync all the data on the secondary node before getting it
from the primary node.
DRBD performance and optimization
There are certain aspects that can be improved and that should be considered when
you implement a DRBD cluster. There are some optimizations that can be applied.
You need to consider that if your database, or more specifically, the second node of
the DRBD cluster, is in a different location that is far away from your data center, the
network bandwidth can have efficient synchronization, which plays a fundamental
role. Another thing that needs to be considered on a disaster recovery site is the
bandwidth and its cost. It is also important to calculate and understand how much
data is required and the transfer rate that we can reach or need.
[ 110 ]
Chapter 3
DRBD efficient synchronization
Synchronization is a distinct process and can't be considered on the same lines as
device replication. While replication happens only the first time you start up the
device, synchronization and resynchronization as well are decoupled from incoming
writes. On the proposed architecture, synchronization is necessary when:
• The link has been interrupted
• The server has a fault on the primary node
• The server has a fault on the secondary node
DRBD doesn't synchronize blocks sequentially and not in the order they were
originally written.
While synchronization is ongoing, during the process
you will have partly obsolete data and partly updated
data on the disk.
The service will continue to run on the primary node while the background
synchronization is in progress. Since this configuration has an LVM layer on top of
DRBD, it is possible to use snapshots during the synchronization; this is a strong
point of this architecture. While synchronization is ongoing, you are in a delicate
phase because there is a single point of failure; only the primary node is working
fine, and if something happens here, you might completely lose all the data and the
secondary node might contain bad data. This critical situation can be mitigated with
the LVM snapshot.
The use of snapshots before beginning synchronization can
give you hands-on experience in that situation because data
on the secondary node is consistent and valid but not recently
updated. Enabling snapshots before beginning synchronization
will reduce the Estimated Time to Repair (ETR), which is also
known as Recovery Time Objective (RTO).
To automate the snapshot, you can add the following lines to your DRBD configuration:
resource RESOURCE_NAME {
handlers {
before-resync-target "/usr/lib/drbd/snapshot-resync-target-lvm.
sh";
after-resync-target "/usr/lib/drbd/unsnapshot-resync-target-lvm.
sh";
}
}
[ 111 ]
High Availability and Failover
The snapshot-resync-target-lvm.sh script is called before we begin the
synchronization, and the unsnapshot-resync-target-lvm.sh script will remove
the snapshot once the synchronization is complete.
If the script fails, the synchronization will not commence.
To optimize the synchronization support for DRBD, a checksum-based
synchronization is required. A checksum-based synchronization is more efficient
in the sense that brute force overwrites and blocks synchronization, which is
not enabled by default. With these features enabled, DRBD reads blocks before
synchronizing them and calculating a hash of the contents. It compares the hash
calculated with the same data obtained from the same sector on the out-of-sync
secondary node, and if the hash matches, DRBD omits rewriting these blocks.
To enable this feature, you need to add the following lines on the DRBD
configuration:
resource <resource>
net {
csums-alg <algorithm>;
}
...
}
The <algorithm> tag is any message digest supported from the kernel cryptographic
API, usually one among sha1, md5, and crc32c.
If this change is done on an existing resource, you need to
copy the changed drbd.conf file on the secondary client
and thereafter run:
drbdadm adjust <resource>
Enabling DRBD online verification
Online verification enables a block-by-block data integrity check in a very efficient
way. This is particularly interesting for efficiency in bandwidth usage; additionally,
it doesn't interrupt or break redundancy in any way.
Online verification is a CPU-intensive process; it will impact
the CPU load.
[ 112 ]
Chapter 3
DRDB, with this functionality, will calculate a cryptographic digest of every block on
the first node, and then this hash is sent to the peer node that will do the same check.
If the digest differs, the block will be marked out of sync and DRBD will retransmit
only the marked blocks. This feature is not enabled by default and can be enabled by
adding the following lines in drbd.conf:
resource <resource>
net {
verify-alg <algorithm>;
}
...
}
Also, here <algotithm> can be any digest supported by the cryptographic API,
usually by sha1, md5, or crc32c. Once configured, it is possible to run online
verification with the following command:
$ drbdadm verify <resource>
Since the check introduced will ensure that both nodes are
perfectly in sync, it is advised that you schedule a weekly or
a monthly check within crontab.
If you have an out-of-sync block, it is possible to resync it simply with the
following command:
$ drbdadm disconnect <resource>
$ drbdadm connect <resource>
DRBD – some networking considerations
When you use a block-based filesystem over DRBD, it is possible to improve the
transfer rate, enlarging Maximum Transmission Unit (MTU) to higher values.
A block-based filesystem will have a noticeable improvement. Block-based
filesystems include EXT3, ReiserFS, and GFS. The filesystem proposed here on this
architecture is extent-based and is not expected to see high improvement by enabling
the jumbo frame.
DRBD permits us to set up the synchronization rate. Normally, DRBD will try to
synchronize the data on the secondary node as quickly as possible to reduce the
inconsistent data time. Anyway, you need to prevent the degrading of a performance
that is caused by the bandwidth consumed for the synchronization.
[ 113 ]
High Availability and Failover
Make sure that you set up this parameter in relation to the
bandwidth available; for instance, it doesn't make any sense
to set up a rate that is higher than the maximum throughput.
The maximum bandwidth used from the background process of resynchronization is
limited by a parameter rate expressed in bytes; so, 8192 means 8 MiB. To fix the rate,
you can change the DRBD configuration file by adding in the following code:
resource <resource>
disk {
resync-rate 50M;
...
}
...
}
The rule to calculate the right rate and the resync rate is MAX_
ALLOWED_BANDWIDTH * 0.3. It means that we are going to
use 30 percent of the maximum bandwidth available.
The sync rate follows exactly the same rule and can be specified as well on the
drbd.conf file:
resource <resource>
syncer {
rate 50M;
...
}
...
}
The syncer rate can be temporarily modified with the following
command:
drbdsetup /dev/drbdnum syncer -r 120M
The resync rate can be temporarily changed with the following
command:
drbdadm disk-options --resync-rate=110M <resource>
Both these rates can be reverted with the following command:
drbdadm adjust resource
[ 114 ]
Chapter 3
DRBD gives us other interesting parameters to fine-tune the system and optimize
performance; of course, those that follow are not solutions to all the throughput
issues. They can vary from system to system, but it is useful to know that they exist,
and you can get some benefit from them.
In particular, there are two parameters. They are as follows:
• max-buffers
• max-epoch-time
The first property (max-buffers) represents the maximum number of buffer DRBDs.
The second property (max-epoch-time) represents the maximum number of write
requests permitted between two write barriers. Both can be changed inside the
drbd.conf file:
resource <resource> {
net {
max-buffers 8000;
max-epoch-size 8000;
...
}
...
}
The default value for both is 2,048, but both can be changed
to 8,000. This is a reasonable value for most of the modern
RAID-SCSI controllers.
There is another network optimization that can be done. Change the send buffer of
the TCP/IP. By default, this value is set to 128 K, but if you are in a high-throughput
network, such as a gigabit network, it make sense to increase this value to 512 K.
resource <resource> {
net {
sndbuf-size 512K;
...
}
...
}
If you set these properties to 0, the DRBD will use the
auto-tuning feature, thus adapting the TCP to send the
buffer to the network.
[ 115 ]
High Availability and Failover
To close this optimization section, it is important to say that DRBD manages certain
other parameters:
• no-disk-barrier
• no-disk-flushes
• no-disk-drain
My personal advice is that you stay away from them if you don't really know what
kind of hardware you have. Set them to represent a big iron on the system RAID.
These parameters disable the write barriers, disk flush, and drain. Usually, all these
features are managed directly from the controller. It doesn't make any sense to
enable DRBD to manage them.
Summary
In this chapter, you learned some fundamental concepts about high availability
and service clustering. You also learned how to apply them to the Zabbix server
architecture using the open source Pacemaker service manager suite and filesystem
replication with DRBD. We also taught you the value of keeping things light and
simple by choosing as few nodes as possible while maintaining a robust, redundant
architecture. This completes the first part of the book that was focused on choosing
the optimal Zabbix solution for an environment of any size. By choosing the right
hardware, supporting software (refer to the Distributed monitoring section in Chapter 1,
Deploying Zabbix), and high availability for the most sensitive components, you should
now have Zabbix installed that is perfectly tailored to your needs and environment.
In the rest of the book, we will focus on using this setup to actually monitor your
network and servers and make use of the data collected beyond simple alerts. The
next chapter will focus on data collection and use many of Zabbix's built-in item types
to obtain monitoring data from a number of simple, complex, or aggregated sources.
[ 116 ]
Collecting Data
Now that you have a Zabbix installation that is properly sized for your environment,
you will want to actually start monitoring it. While it's quite easy to identify which
hosts and appliances, physical or otherwise, you may want to monitor, it may not be
immediately clear what actual measurements you should take on them. The metrics
that you can define on a host are called items, and this chapter will discuss their key
features and characteristics. The first part will be more theoretical and will focus on
the following:
• Items as metrics, not for status checks
• Data flow and directionality for items
• Trapper items as a means to control the data flow
We will then move to a more practical and specific approach and will discuss how to
configure items to gather data from the following data sources:
• Databases and ODBC sources
• Java applications, the JMX console, and SNMP agents
• SSH monitoring
• IMPI items
• Web page monitoring
• Aggregated and calculated items
[ 117 ]
Collecting Data
Gathering items as raw data
One of the most important features that sets Zabbix apart from most other
monitoring solutions is that its main mode of interaction with the monitored objects
is focused on gathering raw data as opposed to alerts or status updates. In other
words, many monitoring applications have the workflow (or variation) as shown in
the following diagram:
Data
measurement
Status sent
to server
Trigger logic
Event logging
actions, etc.
That is, an agent or any other monitoring probe is asked to not only take a
measurement, but also incorporate a kind of status decision about the said
measurement before sending it to the main server's component for further processing.
On the other hand, the basic Zabbix workflow is subtly, but crucially, different, as
shown in the following diagram:
Data
measurement
Trigger
logic
Data sent to
server
Event logging
actions, etc.
Here, an agent or monitoring probe is tasked with just the measurement part,
and then it sends the said measurement to the server component for storage and
eventually for further processing.
The data is not associated with a specific trigger decision (pass/fail, ok/warning/
error, or any other variation) but is kept on the server as a single data point or
measurement. Where applicable, that is, for numeric types, it's also kept in an
aggregate and trending format as minimum, maximum, and average, over different
periods of time. Keeping data separated from the decision logic, but all in a single
place, gives Zabbix two distinct advantages.
[ 118 ]
Chapter 4
The first one is that you can use Zabbix to gather data on things that are not directly
related to the possible alerts and actions that you have to take, but related to the
overall performance and behavior of a system. A classic example is that of a switch
with many ports. You may not be interested in being alerted about anomalous traffic
on every single port (as it may also be difficult to exactly define anomalous traffic on
a single port with no contextual information), but you may be interested in gathering
both port-level and switch-level traffic measurement in order to establish a baseline,
evaluate possible bottlenecks, or plan for an expansion of your network infrastructure.
Similar cases can be made about the CPU and core usage, storage capacity, number of
concurrent users on a given application, and much more. At its simplest, Zabbix could
even be used to gather the usage data and visualize it in different graphs and plots,
without even touching its powerful trigger and correlation features, and still prove to
be an excellent investment of your time and resources.
Speaking of triggering, the second big advantage of having a full, central database
of raw data as opposed to a single measurement (or at best, just a handful of
measurements of the same item) is that, for every trigger and decision logic need that
you may have, you can leverage the whole measurement database to exactly define
the kind of event that you want to monitor and be alerted about. You don't need to
rely on a single measurement; you don't even need to rely on the latest measurement,
plus a few of the previous ones of the same item or limit yourself to items from the
same host. In fact, you can correlate anything with anything else in your item history
database. This is a feature that is so powerful that we have dedicated an entire chapter
to it, and you can go directly to the next one if that's what you want to read about. It
would suffice to say that all this power is based on the fact that Zabbix completely
separates its data-gathering functions from its trigger logic and action functions. All of
this is based on the fact that measurements are just measurements and nothing else.
So, in Zabbix, an item represents a single metric—a single source of data and
measurements. There are many kinds of native Zabbix items even without
considering the custom ones that you can define using external scripts. In this
chapter, you will learn about some of the less obvious but very interesting ones.
You will see how to deal with databases, how to integrate something as alien as
SNMP traps to the Zabbix mindset, how to aggregate the existing items together
to represent and monitor clusters, and more. As you lay a solid foundation, with
sensible and strategic item definition and data gathering, you will be able to
confidently rely on it to develop your event management and data visualization
functions, as you will see in the following chapters.
[ 119 ]
Collecting Data
Understanding the data flow for
Zabbix items
A Zabbix item can be understood by its bare essentials—an identifier, data type, and
associated host. These are the elements that are generally more useful for the rest
of Zabbix's components. The identifier (that's usually the name and the associated
item key) and the associated host are used to distinguish a single item among
the thousands that can be defined in a monitoring environment. The data type is
important so that Zabbix knows how to store the data, how to visualize it (text data
won't be graphed, for example), and most importantly, what kind of functions can be
applied to it in order to model triggers and the process further.
The item's name is a descriptive label that is meant to be easily
read, while the item's key follows a specific syntax and defines
exactly the metric that we want to measure.
Two other very important elements that are common to all the items are the history
(and trends) retention period and item type. We already saw in Chapter 1, Deploying
Zabbix, how history retention directly affects the size of the monitoring database,
how to estimate it, and how to strike a balance between the performance and data
availability. On the other hand, the item type is essential as it tells Zabbix how the
item data is actually going to be made available to the server, which, in other words,
means how Zabbix is going to collect the data: through an agent, an SNMP query, an
external script, and so on.
As you probably already know, there's a fair number of different item types. While
it's fairly easy to understand the difference between an SSH item and an ODBC
one, it's also important to understand how the data is passed around between the
server and its probes and whether they are a Zabbix agent, a server-side probe, or an
external check of some kind. To this end, we'll first concentrate on the Zabbix agent
and the difference between a passive item and an active item.
First of all, the active and passive concepts have to be understood from the
agent's point of view and not the server's. Furthermore, they serve to illustrate the
component that initiates a connection in order to send or receive configuration
information and monitor data, as shown in the following diagram:
Zabbix item passive
Zabbix
server
Request
Response
[ 120 ]
Zabbix
agent
Chapter 4
So, a standard Zabbix item is considered passive from the agent's point of view. This
means that it's the server's job to ask the agent, at the time intervals defined for the
item, to get the desired measurement and report it back immediately. In terms of
network operations, a single connection is initiated and brought down by the server
while the agent is in the listening mode.
At the other end, in the case of a Zabbix active item, it's the agent's job to ask the
server what monitoring data it should gather and at what intervals. It then proceeds
to schedule its own measurements and connects back to the server to send them over
for further processing. In terms of network operations, the following are the two
separate sessions involved in the process:
• The agent asks the server about items and monitoring intervals
• The agent sends the monitoring data it collected to the server
Unlike standard passive items, you'll need to configure an agent so that it knows
which server it should connect to for the purpose of configuration and data
exchange. This is, of course, defined in the zabbix_agentd.conf file for every agent;
just set ServerActive as the hostname or the IP address of your Zabbix server,
and set RefreshActiveChecks to the number of seconds the agent should wait
before checking whether there are any new or updated active item definitions. The
following diagram shows this:
Zabbix item active
Zabbix
server
Cfg.Req.
Cfg.Resp.
Item data
Data ack.
Zabbix
agent
Apart from the network connection initiation, the main difference between a
passive item and an active item is that, in the latter, it's impossible to define flexible
monitoring intervals. With a passive item, you can define different monitoring
intervals based on the time of the day and the day of the week. For example, you
could check the availability of an identity management server every minute during
office hours and every 10 minutes during the night. On the other hand, if you use an
active item, you are stuck with just one option to monitor the intervals.
You may also have noticed a more-than-passive resemblance between the Zabbix
active and passive items, and the resemblance between the functionality and features
of the Zabbix active and passive proxies.
[ 121 ]
Collecting Data
In fact, you can choose between the active and passive items in much the same
way, and for the same reasons you choose between an active or passive proxy in
Chapter 2, Distributed Monitoring, to offload some of the server's scheduling jobs and
to work around the restrictions and limitations of your network and the routing or
firewall configuration.
There is, of course, one main difference between proxies and agents. It's not the
fact that a proxy can gather monitoring data from many different hosts, while
an agent is theoretically (but not practically, it's certainly possible to stretch its
functionality using custom items that rely on scripts or external applications) limited
to monitoring just the host it's installed on.
The main difference when it comes to the data flow is that the mode of operation
of a proxy is applied to all the hosts and items that the proxy manages. In fact, it
doesn't care about the nature of the items a proxy has to monitor. However, when
an active proxy gathers its data (whether with active or passive agent items, external
scripts, SNMP, SSH, and so on), it will always initiate all connections to the server.
The same goes for a passive proxy; it doesn't matter whether all the items it has to
monitor are active agent items. It will always wait for the main server for updates on
configuration and measurement requests.
On the other hand, an active or passive item is just an item of many. A host can be
defined by a mix of active and passive items; so, you can't assume that an agent will
always initiate all its connections to the server. To do that, all of the items that rely on
the agent have to be defined as active, including the future ones.
Understanding Zabbix trapper items
An extreme version of an active item that still relies on the Zabbix agent protocol is
the Zabbix trapper item. Unique among all other item types, a trapper item does not
have a monitoring interval defined at the server level. In other words, a server will
know whether a Zabbix trapper item is defined, its data type, the host it's associated
with, and the retention period for both history and trends. But it will never schedule
a check for the item nor pass the scheduling and monitoring interval information to
any proxy or agent. So, it's up to the specific probe to be scheduled in some way and
then send the information about the gathered data to the server.
[ 122 ]
Chapter 4
Trapper items are, in some respects, the opposite of Zabbix's external checks from
a data flow's point of view. As you probably already know, you define an external
check item type when you want the server to execute an external script to gather
measurements instead of asking an agent (Zabbix, SNMP, or others). This can exact
an unexpected toll on the server's performance as it has to fork a new process for
every external script it has to execute and then wait for the response. As the number of
external scripts grows, it can significantly slow down the server operations to the point
of accumulating a great number of overdue checks while it's busy executing scripts. An
extremely simple and primitive, yet effective, way to work around this problem (after
reducing the number of external scripts as much as possible, of course) is to convert all
external check items to trapper items, schedule the execution of the same scripts used
in the external checks through the crontab or any other scheduling facility, and modify
the scripts themselves so that they use zabbix_sender to communicate the measured
data to the server. When we talk about the Zabbix protocol in Chapter 8, Handling
External Scripts, you'll see quite a few examples of this setup.
The data flow overview
This is a rundown of item types, classified with the connection type, with a proposed
alternative if you want, for any reason, to turn it around. As you can see, Zabbix
Trapper is often the only possible, albeit clunky or clumsy, alternative if you
absolutely need to reverse a connection type. Note that, in the following table, the
term Passive means that the connection is initiated by the server, and Active means
that the connection is initiated by whatever probe is used. While this may seem
counterintuitive, it's in fact incoherent with the same terms as applied to proxies and
agents, as shown in the following table:
Item Type
Direction
Alternative
Zabbix agent
Passive
Zabbix agent(active)
Zabbix agent (active)
Active
Zabbix agent
Simple check
Passive
Zabbix trapper
SNMP agent
Passive
Zabbix trapper (SNMP traps are
completely different in nature)
SNMP trap
Active
N/A
Zabbix internal
N/A (data about the server
monitoring itself)
N/A
Zabbix trapper
Active
Depends on the nature of the
monitored data
Zabbix aggregate
N/A (uses data already
available in the database)
N/A
External check
Passive
Zabbix trapper
[ 123 ]
Collecting Data
Item Type
Direction
Alternative
Database monitor
Passive
Zabbix trapper
IPMI agent
Passive
Zabbix trapper
SSH agent
Passive
Zabbix trapper
TELNET agent
Passive
Zabbix trapper
JMX agent
Passive
Zabbix trapper
Calculated
N/A (uses data already in
the database)
N/A
In the next few paragraphs, we'll dive deeper into some of the more complex and
interesting item types.
Database monitoring with Zabbix
Zabbix offers a way to query any database using SQL queries. The result retrieved
from the database is saved as the item value and can have, as usual, triggers
associated with it. This functionality is useful in many applications. This gives you
a way to monitor the user currently connected to a database, the number of users
connected to your web portal, or simply retrieve metrics from the DBMS engine.
Delving into ODBC
ODBC is a layer—a translation layer between Database Management Systems
(DBMS) and the application. The application uses the ODBC function through
the linked ODBC driver manager. The ODBC driver has been implemented and
developed in concert with most of the DBMS vendors to enable their database to
interoperate with this layer. The configuration file specifies the driver to load all the
connection parameters for each Data Source Name (DSN), and all the DSNs are
enumerated and defined inside this file. DSN also gives the functionality to present
the entire database in a human-readable format. The DSN file needs to be protected.
In the proposed setup, it is advisable to use a different Unix account for your Zabbix
server, which will make things easy. As there is only one Zabbix server, the only user
that needs to access this file is the Zabbix server user. This file should be owned by
this user and made unreadable to others. DSNs are contained in the odbc.ini file
in the ect folder. This file will contain all the DSNs for all the different databases to
which we want to connect. Take care to protect this file, and prevent other people
from accessing this file because it can contain passwords.
[ 124 ]
Chapter 4
There are two open source versions of ODBC available—unixODBC and iODBC.
Zabbix can use both of them, but before you can use them, the first thing to do is
enable Zabbix to use ODBC and install the unixODBC layer. There are two ways to
do that: one is with the package manager, and the other one is to go through the old
way of downloading and compiling it from the source (currently, the latest stable
version is 2.3.2):
$ wget ftp://ftp.unixodbc.org/pub/unixODBC/unixODBC-2.3.2.tar.gz
$ tar zxvf unixODBC-2.3.2.tar.gz
$ cd unixODBC-2.3.2
$ ./configure --prefix=/usr --sysconfdir=/etc
$ make
$ make install
If you are on a 64-bit system, you have to specify the 64-bit version of
libraries with --libdir, as follows:
./configure --prefix=/usr --sysconfdir=/etc --libdir=/
usr/lib64
The default locations are /usr/bin for binary and /usr/lib or /usr/lib64 for
libraries depending on the version you have installed.
If you're looking to install unixODBC via the package manager, you need to run the
following command from root:
$ yum -y install unixODBC unixODBC-devel
Installing database drivers
unixODBC supports a wide and almost complete list of databases. Most of the
following widely diffused databases are supported:
• MySQL
• PostgreSQL
• Oracle
• DB2
• Sybase
• Microsoft SQL Server (via FreeTDS)
The complete list of databases supported by unixODBC is
available at http://www.unixodbc.org/drivers.html.
[ 125 ]
Collecting Data
MySQL ODBC drivers
Now, if you have previously installed unixODBC via the package manager, you can
follow the same procedure, for example, on Red Hat with the following command:
$ yum install mysql-connector-odbc
Otherwise, they are also available as a packet; you only need to download the
package, for example, mysql-connector-odbc-5.1.13-linux-glibc2.5-x8664bit.tar.gz.
Then, decompress the package and copy the contents in the /usr/lib/odbc and /
usr/lib64/odbc/ directories as follows:
$ tar xzf mysql-connector-odbc-5.1.13-linux-glibc2.5-x86-64bit.tar.gz
$ mkdir /usr/lib64/odbc/
$ cp /usr/src/ mysql-connector-odbc-5.1.13-linux-glibc2.5-x86-64bit/lib/*
/usr/lib64/odbc/
Now you can check whether all the needed libraries are present on your system
using the ldd command.
This can be done on a 32-bit system with the following command:
$ ldd /usr/lib /libmyodbc5.so
This can be done on a 64-bit system using the following command:
$ ldd /usr/lib64 /libmyodbc5.so
If nothing is marked as Not Found, this means that all the needed libraries are found
and you can go ahead; otherwise, you need to check what is missing and fix it.
All the installed ODBC database drivers are listed in /etc/obcinst.ini; this file, for
MySQL 5, should contain the following:
[mysql]
Description = ODBC for MySQL
Driver
= /usr/lib /libmyodbc5.so
Setup
= /usr/lib/libodbcmyS.so
A 64-bit system should contain the following:
[mysql]
Description = ODBC for MySQL
Driver64
= /usr/lib64/libmyodbc5.so
Setup64
= /usr/lib64/libodbcmyS.so
[ 126 ]
Chapter 4
For all the available ODBC options, refer to the official
documentation available at http://dev.mysql.com/
doc/refman/5.1/en/connector-odbc-info.html.
Data sources are defined in the odnc.ini file. You need to create a file with the
following content:
[mysql-test]
# This is the driver name as specified on odbcinst.ini
Driver = MySQL5
Description = Connector ODBC MySQL5
Database = <db-name-here>
USER= <user-name-here>
Password = <database-password-here>
SERVER = <ip-address-here>
PORT = 3306
It is possible to configure ODBC to use a secure SSL connection,
but you need to generate a certificate and configure both the
sides (ODBC and server) to enable that. Refer to the official
documentation for this.
PostgreSQL ODBC drivers
In order to access a PostgreSQL database via ODBC, you need to install the
appropriate drivers. They will be used by the Zabbix server to send the queries to
any PostgreSQL database via the ODBC protocol.
The official ODBC drivers for PostgreSQL are available at http://www.postgresql.
org/ftp/odbc/versions/src/.
Perform the following steps to work with the PostgreSQL database:
1. You can download, compile, and install the psqlODBC driver with the
following commands:
$ tar -zxvf psqlodbc-xx.xx.xxxx.tar.gz
$ cd psqlodbc-xx.xx.xxxx
$ ./configure
$ make
$ make install
[ 127 ]
Collecting Data
2. The configuring script accepts different options; some of the most important
ones are as follows:
--with-libpq=DIR postgresql path
--with-unixodbc=DIR path or direct odbc_config file (default:yes)
--enable-pthreads= thread-safe driver when available (not on all
platforms)
3. Alternatively, you can even choose the rpm packages here and then run the
following command:
$ yum install postgresql-odbc
4. Having compiled and installed the ODBC driver, you can create the /etc/
obcinst.ini file, or if you have installed the rpm, just check that the file
exists with the following content:
[PostgreSQL]
Description
= PostgreSQL driver for Linux
Driver
= /usr/local/lib/libodbcpsql.so
Setup
= /usr/local/lib/libodbcpsqlS.so
Driver64
= /usr/lib64/psqlodbc.so
Setup64
= /usr/lib64/libodbcpsqlS.so
5. Now, odbcinst can be invoked by passing your template to that command.
$ odbcinst -i -d -f template_filepsql
ODBC supports encrypted logins with md5 but not with
crypt. Bear in mind that only the login is encrypted after
login. ODBC sends all the queries in plain text. As of Version
08.01.002, psqlODBC supports SSL encrypted connections,
which will protect your data.
6. As the psqlODBC driver supports threads, you can alter the thread
serialization level for each driver entry. So, for instance, the content of
odbcinst.ini will be as follows:
[PostgreSQL]
Description
Driver
Setup
Threading
=
=
=
=
PostgreSQL driver for Linux
/usr/local/lib/libodbcpsql.so
/usr/local/lib/libodbcpsqlS.so
2
7. Now you need to configure the odbc.ini file. You can also use odbcinst
here, providing a template or simply a text editor, as follows:
$ odbcinst -i -s -f template_file
[ 128 ]
Chapter 4
8. You should have inside your odbc.ini file something similar to the
following:
[PostgreSQL]
Description
Driver
Trace
TraceFile
Database
Servername
UserName
Password
Port
Protocol
ReadOnly
RowVersioning
ShowSystemTables
ShowOidColumn
FakeOidIndex
ConnSettings
=
=
=
=
=
=
=
=
=
=
=
=
=
=
=
=
Postgres to test
/usr/local/lib/libodbcpsql.so
Yes
sql.log
<database-name-here>
<server-name-or-ip-here>
<username>
<password>
5432
6.4
No
No
No
No
No
Oracle ODBC drivers
Oracle is another widely used database and provides an ODBC driver as well. The
following is a description of how to install Oracle's ODBC because at http://www.
unixodbc.org, there isn't much information about it.
1. The first thing to do is get the instant client from the Oracle website. Oracle
provides some of the instant client packets as rpm and tar.gz, as shown in
the following commands:
$ rpm –I oracle-instantclient11.2-basic-11.2.0.1.0-1.i386.
rpm oracle-instantclient11.2-odbc-11.2.0.1.0-1.i386.rpm oracleinstantclient11.2-sqlplus-11.2.0.1.0-1.i386.rpm
2. Then, you need to configure some environment variables as follows:
$ export ORACLE_HOME=/usr/lib/oracle/11.2/client
$ export ORACLE_HOME_LISTNER=/usr/lib/oracle/11.2/client/bin
$ export LD_LIBRARY_PATH=$LD_LIBRARY_PATH :/usr/lib/oracle/11.2/
client/lib
$ export SQLPATH=/usr/lib/oracle/11.2/client/lib
$ export TNS_ADMIN=/usr/lib/oracle/11.2/client/bin
[ 129 ]
Collecting Data
3. Now, you need to configure the /etc/odbcinst.ini file. This file should
have the following content:
[Oracle11g]
Description = Oracle ODBC driver for Oracle 11g
Driver
= /usr/lib/oracle/11.2/client/lib/libsqora.so.11.1
4. In the odbc.ini file, the relative DSN entry needs to be configured as follows:
[ORCLTEST]
Driver
=
ServerName =
Database
=
DSN
=
Port
=
Oracle 11g ODBC driver
<enter-ip-address-here>
<enter-sid-here>
ORCLTEST
1521
5. You can test the connection as usual with the following command:
$ isql -v ORCLTEST
+---------------------------------------+
| Connected!
|
|
|
| sql-statement
|
| help [tablename]
|
| quit
|
+---------------------------------------+
6. Now your ODBC connection is fine.
unixODBC configuration files
Now, you are enabled to connect to most of the common databases. To check the
connection, you can test it using isql, as follows:
1. If you didn't specify the username and password inside the odbc.ini file, it
can be passed to the DSN with the following syntax:
$ isql <DSN> <user> <password>
2. Otherwise, if everything is specified, you can simply check the connection
with the following command:
$ isql mysql-test
3. If all goes well, you should see the following output:
+---------------------------------------+
| Connected!
|
[ 130 ]
Chapter 4
|
|
| sql-statement
|
| help [tablename]
|
| quit
|
|
|
+---------------------------------------+
SQL>
If you get an error from unixODBC, such as Data source
name not found and no default driver specified,
make sure that the ODBCINI and ODBCSYSINI environment
variables are pointing to the right odbc.ini file. For
example, if your odbc.ini file is in /usr/local/etc, the
environments should be set as follows:
export ODBCINI=/usr/local/etc/odbc.ini
export ODBCSYSINI=/usr/local/etc
4. If a DSN is presenting issues, the following command can be useful:
$ isql -v <DSN>
This enables the verbose mode, which is very useful to debug a connection.
A good thing to know is that /etc/obcinst.ini is a common file, hence you'll have
all your unixODBC entries there.
Compiling Zabbix with ODBC
Now if you connect to the target database that is to be monitored, it is time to
compile the Zabbix server with ODBC support by performing the following steps:
If your Zabbix is already up and running, don't run the make
install command during a normal installation as it will
copy too many files, and it's possible that some of them will
be overwritten. In this case, it is better to just copy the Zabbix
server's executable file.
1. Now you can get the configure command line with all the options used as
specified in Chapter 1, Deploying Zabbix, by adding the --with-unixodbc
parameter as follows:
$ ./configure --enable-server -–with-postgresql --with-net-snmp
--with-libcurl --enable-ipv6 --with-openipmi --enable-agent
--with-unixodbc
[ 131 ]
Collecting Data
2. You should see the following between the output lines:
checking for odbc_config... /usr/local/bin/odbc_config
checking for main in -lodbc... yes
checking whether unixodbc is usable... yes
3. This will confirm that all the needed ODBC binaries are found and are usable.
Once the configuring phase is completed, you can run the following command:
$ make
4. Once this is completed, just take a backup of the previous zabbix_server
file that was installed, and copy the new version.
5. On starting zabbix_server, take a look into the log file, and you should see
the following output:
****** Enabled features ******
SNMP monitoring: YES
IPMI monitoring: YES
WEB monitoring: YES
Jabber notifications: YES
Ez Texting notifications: YES
ODBC: YES
SSH2 support: YES
IPv6 support: YES
******************************
This means that all went fine.
Database monitor items
Now it is time to use the Zabbix ODBC functionality. In order to do so, you need to
create an item of the Database monitor type, as shown in the following screenshot:
[ 132 ]
Chapter 4
The item where the retrieved value will be stored is identified by the item key
as follows:
db.odbc.select[<unique short description>]
<unique short description> is a string that must be unique and can be whatever
you want. An example is as follows:
db.odbc.select[web_user_connected_on_myapp]
Inside the Additional parameters field, you need to specify the following:
DSN=<database source name>
user=<user name>
password=<password>
sql=<query>
Where the DSN should exist in /etc/odbc.ini and whether the username and
password are stored in the DSN definition or not can be specified here. In the last
line, you need to specify the SQL query.
[ 133 ]
Collecting Data
Some considerations about the ODBC SQL query
The following are some restrictions to the use of, and things to consider about,
a SQL query:
• The SQL must begin with a select clause
• The SQL can't contain any line breaks
• The query must return only one value
• If the query returns multiple columns, only the first one is read
• If the query returns multiple rows, only the first column of the first
row is read
• Macros are not to be replaced (for example, {HOSTNAME})
• The SQL command must begin with lowercase, that is, sql=
• The query needs to terminate before the timeout
• The query must return exactly the value type specified; otherwise, the item
will be unsupported
As you can see, there are only some limitations that you can accept. In particular, you
can't call a function if that function returns only one value. You can't execute a stored
procedure; you can only select the data. Also, the query can't contain any line breaks,
so long and complex queries will not be easily readable.
The following are some other points to consider:
• If the database is particularly loaded, it can respond with a delay (the login
can also suffer a delay caused by the workload)
• Every query executes a login
• If the database is listening on 127.0.0.1, the connection can have issues
• If you use proxies, they too need to be compiled with the unixODBC support
If you consider a database that will be under heavy stress, don't have a pool
introduced for an overhead that is not necessary. Also, in this case, it is possible that
just to have a connection, you need to wait for more than 5 seconds.
The 5 seconds mentioned previously is not a random value; indeed, the timeout of a
connection is defined when you open a connection. During the initialization of that, you
need to define your expected timeout before considering the connection impossible.
Zabbix defines this timeout in the following command:
src/libs/zbxdbhigh/odbc.c
[ 134 ]
Chapter 4
On line 130 of the file, we have the definition of the connection timeout for Zabbix
as follows:
SQLSetConnectAttr(pdbh->hdbc, (SQLINTEGER)SQL_LOGIN_TIMEOUT,
(SQLPOINTER)5, (SQLINTEGER)0);
This (SQLPOINTER)5 sets SQL_LOGIN_TIMEOUT to 5 seconds. If your database doesn't
respond in 5 seconds, you will get the following error inside the log file:
[ODBC 3.51 Driver]Can't connect to MySQL server on 'XXX.XXX.XXX.XXX' (4)]
(2003).
In the case of SQL_LOGIN_TIMEOUT, you can consider
increasing it to 15 seconds and recompile the server and
proxy as follows:
SQLSetConnectAttr(pdbh->hdbc,
(SQLINTEGER)SQL_LOGIN_TIMEOUT, (SQLPOINTER)15,
(SQLINTEGER)0);
Zabbix JMX monitoring
Version 2.0 of Zabbix has a native support to monitor applications using JMX. The
actor that monitors the JMX application is a Java daemon called the Zabbix Java
gateway. Basically, it works like a gateway. When Zabbix wishes to know the value of
a JMX counter, it simply asks the Java gateway, and the gateway will do all the work
for Zabbix. All the queries are done using the JMX management API from Oracle.
The Zabbix Java gateway is in the early stages of development, thus providing great
functionality but still experiencing some challenges.
The distinguishing characteristic of this method is that the application only needs to
be started with the JMX remote console enabled and doesn't need to implement or
extend the class or write new code to handle the Zabbix request because the entire
request is a standard JMX.
The default way to enable the JMX console is to start the Java application with the
following parameters:
-Dcom.sun.management.jmxremote
-Dcom.sun.management.jmxremote.port=<put-your-port-number-here>
-Dcom.sun.management.jmxremote.authenticate=false
-Dcom.sun.management.jmxremote.ssl=false
[ 135 ]
Collecting Data
With these parameters, you are going to configure the JMX interface on the
application's side. As usual, you need to define a port, the authentication method,
and the encryption.
This basic setup is the simplest and easiest way, but unfortunately, it is not the safest
and most secure configuration.
Considering JMX security aspects
Now, as you are going to open a door in your application, you are basically exposing
your application to a security attack. The JMX console, on most of the widely diffused
application servers, is not only an entry point to get values from the counter, but also
something that is a lot more sophisticated. Basically, with a JMX console open in an
application server, you can deploy an application. Start it, stop it, and so on, as you
can figure out what a hacker can deploy, and start an application, or cause an issue on
the running one. The JMX console can be called from the application server looping
itself, using the post and get methods. Adding malicious content in the HEAD section
of a web page results in the server that has a JMX console that is not secured and is
easily hackable, which is the weakest point of your infrastructure. Once an application
server is compromised, your entire network is potentially exposed, and you need to
prevent all this. This can be done through the following steps:
1. The first thing to do is enable the authentication as follows:
-Dcom.sun.management.jmxremote.authenticate=true
2. Now you need to specify a file that will contain your password, as follows:
-Dcom.sun.management.jmxremote.password.file=/etc/java-6penjdk/management/jmxremote.password
There are potential security issues with password authentication
for JMX remote connectors. Once the client obtains the remote
connector from an insecure RMI registry (the default), such as for
all the man-in-the-middle attacks, an attacker can start a bogus
RMI registry on the target server right before the valid original
one is started and can then steal the client's passwords.
[ 136 ]
Chapter 4
3. Another good thing to do is to profile the users, specifying the following
parameter:
-Dcom.sun.management.jmxremote.access.file=/etc/java-6penjdk/management/jmxremote.access
4. The access file, for instance, should contain something similar to
the following:
monitorRole readonly
controlRole readwrite
5. The password file should be as follows:
monitorRole <monitor-password-here>
controlRole <control-password-here>
6. Now, to avoid password stealing, you should enable the SSL as follows:
-Dcom.sun.management.jmxremote.ssl=true
7. This parameter is consequently tied with the following ones:
-Djavax.net.ssl.keyStore=<Keystore-location-here>
-Djavax.net.ssl.keyStorePassword=<Default-keystorepassword>
-Djavax.net.ssl.trustStore=<Trustore-location-here>
-Djavax.net.ssl.trustStorePassword=<Trustore-password-here>
-Dcom.sun.management.jmxremote.ssl.need.client.auth=true
The -D parameter will be written in the startup file of your
application or application server as, after this configuration,
your startup file will contain sensitive data (your keyStore and
trustStore passwords) that needs to be protected and not be
readable from other accounts in the same group or by other users.
Installing a Zabbix Java gateway
To compile the Java gateway, perform the following steps:
1. First of all, you need to install the required packages:
$ yum install java-devel
2. Then, you need to run the following command:
$ ./configure --enable-java
[ 137 ]
Collecting Data
3. You should get an output as follows:
Enable Java gateway:
yes
Java gateway details:
Java compiler:
javac
Java archiver:
jar
4. This shows that the Java gateway is going to be enabled and compiled after
the following command is used:
$ make && make install
5. The Zabbix Java gateway will be installed at the following location:
$PREFIX/sbin/zabbix_java
6. Basically, the directory structure will contain the following file—the
Java gateway:
bin/zabbix-java-gateway-2.0.5.jar
7. The libraries needed by the gateway are as follows:
lib/logback-classic-0.9.27.jar
lib/logback-core-0.9.27.jar
lib/android-json-4.3_r3.1.jar
lib/slf4j-api-1.6.1.jar
8. Here are two configuration files:
lib/logback-console.xml
lib/logback.xml
9. The scripts to start and stop the gateway are as follows:
shutdown.sh
startup.sh
10. This is a common script sourced from the start and stop scripts that contain
the following configuration:
settings.sh
[ 138 ]
Chapter 4
11. Now, if you have enabled the SSL communication, you need to enable the
same security level on the Zabbix Java gateway. To do this, you need to add
the following parameter in the startup script:
-Djavax.net.ssl.*
12. Once all this is set, you need to specify the following inside the Zabbix server
configuration:
JavaGateway=<ip-address-here>
JavaGatewayPort=10052
If you would like to use the Java gateway from your
proxy, you need to configure both JavaGateway and
JavaGatewayProperties in the proxy configuration file.
13. Since, by default, Zabbix doesn't start any Java poller, you need to specify
that too, as follows:
StartJavaPollers=5
14. Restart the Zabbix server or proxy once that is done.
15. Now you can finally start the Zabbix Java gateway by running the startup.
sh command.
The logs will be available at /tmp/zabbix_java.log with the verbosity "info".
As the Zabbix Java gateway uses the logback library, you can
change the log level or the log file location by simply changing
the lib/logback.xml file. In particular, the following XML
tags need to be changed:
<fileNamePattern>/tmp/zabbix_java.log.%i</
fileNamePattern><root level="info">
Here, you can change all the logrotation parameters as well.
[ 139 ]
Collecting Data
If you need to debug a Zabbix Java Gateway issue, another useful thing to know is
that you can start the Java gateway in console mode. To do that, you simply need to
comment out the PID_FILE variable contained in settings.sh. If the startup.sh
script doesn't find the PID_FILE parameter, it starts the Java gateway as a console
application, and Logback uses the lib/logback-console.xml file instead. This
configuration file, other than enabling the log on console, changes even the log level
to debug. Anyway, if you're looking for more details about logging on the Zabbix
Java gateway, you can refer directly to the SLF4J user manual available at http://
www.slf4j.org/manual.html.
Configuring Zabbix JMX
Now it is time to create a JMX monitored host with its relatively monitored JMX
items. To do that, inside the host configuration, you need to add a JMX interface and
address, as shown in the following screenshot:
Once you have done that for each of the JMX counters you want to acquire, you need
to define an item of the JMX agent type. Inside the definition of the JMX agent, you
need to specify the username, password, and the JMX query string. The JMX key is
composed of the following:
• Object name of MBean
• Attribute name, that is, the attribute name of MBean
[ 140 ]
Chapter 4
The following screenshot shows the Item configuration window:
[ 141 ]
Collecting Data
Data type in this configuration window permits us to store the unsigned integer
values (such as 0 and 1) as numbers or as Boolean values (such as true or false).
JMX keys in detail
MBean is quite a simple string defined in your Java application. The other
component is a bit more complex indeed; the attribute can return primitive data
types or composite data.
The primitive data types are simple types, such as integers and strings. For instance,
you can have a query such as the following:
jmx[com.example:Type=Test,weight]
This will return the weight expressed as a numerical floating point value.
If the attribute returns composite data, it is a bit more complicated but is handled
since dots are supported. For instance, you can have a pen that can have two values
that represent color and the remaining ink, usually dot separated, as shown in the
following code:
jmx[com.example:Type=Test,pen.remainink]
jmx[com.example:Type=Test,pen.color]
Now, if you have an attribute name that includes a dot in its name, such as all.pen,
you need to escape the dot, as shown in the following code:
jmx[com.example:Type=Test,all\.pen.color]
If your attribute name also contains a backslash (\), this needs to be escaped twice, as
shown in the following code:
jmx[com.example:Type=Test,c:\\utility]
If the object name or attribute name contains spaces or commas, it needs to be
double-quoted:
jmx[com.example:type=Hello,""c:\\documents and settings""]
Issues and considerations about JMX
Unfortunately, JMX support is not as flexible and customizable as it should be; at
least at the time of writing this book, JMX still had some problems.
[ 142 ]
Chapter 4
For instance, from my personal experience, I know that JBoss, which is one of the
most widely used application servers, can't be successfully enquired. The JMX
endpoint is currently hardcoded into JMXItemChecker.java as follows:
service:jmx:rmi:///jndi/rmi://" + conn + ":" + port + "/jmxrmi"
Some applications use different endpoints for their JMX management console. JBoss
is one of them. The endpoint is not configurable as per the host or frontend, and you
can't add a parameter to specify this endpoint on the host's configuration window.
Anyway, the development is really active and things are getting better and are
improving every day. At the moment, the status is that the Zabbix Java gateway
needs some improvement. Also, the current implementation of the Zabbix Java
gateway suffers because of the workload; if you have more than 100 JMX items per
host, the gateway needs to be restarted periodically. It is possible that you face some
errors of the following kind:
failed: another network error, wait for 15 seconds
This is followed by:
connection restored
Also, there is another aspect to consider: in a real-word scenario, it might happen
that you have multiple JVMs running on the same hosts. In this case, you need
to configure each JMX port creating multiple items and host aliases, one for each
network interface; well, this scenario can't be resolved with low-level discovery
and requires a lot of manually redundant configuration work. It is fundamental
that the implementer of the Zabbix monitoring infrastructure knows not only all
the strong points of the product but also the cons and limitations. The implementer
can then choose whether they want to develop something in-house, use an open
source alternative, try to fix the possible issues, or ask the Zabbix team for a new
functionality or fix.
Zabbix SNMP monitoring
Simple Network Monitoring Protocol (SNMP) may not be as simple as the name
suggests; it's a de facto standard for many appliances and applications. It's not just
ubiquitous—it's often the only sensible way in which one can extract the monitoring
information from a network switch, disk array enclosure, UPS battery, and so on.
[ 143 ]
Collecting Data
The basic architecture layout for SNMP monitoring is actually straightforward.
Every monitored host or appliance runs an SNMP agent. This agent can be queried
by any probe (whether it's just a command-line program to do manual queries or a
monitoring server such as Zabbix) and will send back information on any metric it
has made available or even change certain predefined settings on the host itself as
a response to a set command from the probe. Furthermore, the agent is not just a
passive entity that responds to the get and set commands but can also send warnings
and alarms as SNMP traps to a predefined host when some specific conditions arise.
Things get a little more complicated when it comes to metric definitions. Unlike
a regular Zabbix item, or any other monitoring system, an SNMP metric is part
of a huge hierarchy, a tree of metrics that spans hardware vendors and software
implementers across all of the IT landscape. This means that every metric has to be
uniquely identified with some kind of code. This unique metric identifier is called
OID and identifies both the object and its position in the SNMP hierarchy tree.
OIDs and their values are the actual content that is passed in the SNMP messages.
While this is most efficient from a network traffic point of view, OIDs need to be
translated into something usable and understandable by humans as well. This is done
using a distributed database called Management Information Base (MIB). MIBs
are essentially text files that describe a specific branch of the OID tree, with a textual
description of its OIDs, their data types, and a human-readable string identificator.
MIBs let us know, for example, that OID 1.3.6.1.2.1.1.3 refers to the system uptime
of whatever machine the agent is running on. Its value is expressed as an integer,
in hundredths of a second and can generally be referred to as sysUpTime. The
following diagram shows this:
1.3.6.1.2.1.1.3
iso (1)
org (3)
dod (6)
internet (1)
mgmt (2)
mib-2 (1)
system (1)
sysDescr (1)
interfaces (2)
sysObjectID (2)
at (3)
sysUptime (3)
[ 144 ]
ip (4)
...
sysContact (4)
...
Chapter 4
As you can see, this is quite different from the way Zabbix agent items work, both
in terms of the connection protocol, item definition, and organization. Nevertheless,
Zabbix provides facilities to translate from SNMP OIDs to Zabbix items—if you
compiled the support for the server in SNMP, it will be able to create the SNMP
queries natively, and with the help of a couple of supporting tools, it will also be able
to process SNMP traps.
This is, of course, an essential feature if you need to monitor appliances that only
support SNMP and have no way of installing a native agent on network appliances
in general (switcher, routers, and so forth), disk array enclosures, and so on. But the
following may be reasons for you to actually choose SNMP as the main monitoring
protocol in your network and completely dispense with Zabbix agents:
• You may not need many complex or custom metrics apart from what is
already provided by an operating system's SNMP OID branch. You, most
probably, have already set up SNMP monitoring for your network equipment,
and if you just need simple metrics, such as uptime, CPU load, free memory,
and so on, from your average host, it might be simpler to rely on SNMP for it
as well instead of the native Zabbix agent. This way, you will never have to
worry about agent deployment and updates—you just let the Zabbix server
contact the remote SNMP agents and get the information you need.
• The SNMP protocol and port numbers are well known by virtually all the
products. If you need to send monitoring information across networks, it
might be easier to rely on the SNMP protocol instead of the Zabbix one. This
could be because traffic on the UDP ports 161 and 162 is already permitted
or because it might be easier to ask a security administrator to allow access to
a well-known protocol instead of a relatively more obscure one.
• SNMP Version 3 features built-in authentication and security. This means
that, contrary to the Zabbix protocol, as you have already seen in Chapter 2,
Distributed Monitoring, SNMPv3 messages will have integrity, confidentiality,
and authentication. While Zabbix does support all three versions of SNMP,
it's strongly advised that you use Version 3 wherever possible because it's the
only one with real security features. In contrast, Version 1 and 2 only have a
simple string sent inside a message as a very thin layer of security.
[ 145 ]
Collecting Data
• While there may be good reasons to use SNMP monitoring as much as
possible in your Zabbix installation, there are still a couple of strong reasons
to stick with the Zabbix agent. The Zabbix agent has a few, very useful builtin metrics that would need custom extensions if implemented through an
SNMP agent. For example, if you want to monitor a log file, with automatic
log rotation support, and skip old data, you just need to specify the logrt[]
key for a Zabbix active item. The same thing applies if you want to monitor
the checksum, the size of a specific file, or the Performance Monitor facility
of the Windows operating system, and so on. In all these cases, the Zabbix
agent is the most immediate and simple choice.
• The Zabbix agent has the ability to discover many kinds of resources that
are available on the host and report them back to the server, which will, in
turn, automatically create items and triggers and destroy them when the said
resources are not available anymore. This means that with the Zabbix agent,
you will be able to let the server create the appropriate items for every host's
CPU, mounted filesystem, number of network interfaces, and so on. While
it's possible to define low-level discovery rules based on SNMP, it's often
easier to rely on the Zabbix agent for this kind of functionality.
So, once again, you have to balance the different features of each solution in order to
find the best match for your environment. But generally speaking, you could make
the following broad assessments: if you have simple metrics but need strong security,
go with SNMP v3; if you have complex monitoring or automated discovery needs and
can dispense with strong security (or are willing to work harder to get it, as explained
in Chapter 2, Distributed Monitoring), go with the Zabbix agent and protocol.
That said, there are a couple of aspects worth exploring when it comes to Zabbix
SNMP monitoring. We'll first talk about simple SNMP queries and then about
SNMP traps.
SNMP queries
An SNMP monitoring item is quite simple to configure. The main point of interest
is that while the server will use the SNMP OID that you provided to get the
measurement, you'll still need to define a unique name for the item and, most
importantly, a unique item key. Keep in mind that an item key is used in all of
Zabbix's expressions that define triggers, calculated items, actions, and so on. So, try
to keep it short and simple, while easily recognizable. As an example, let's suppose
that you want to define a metric for the incoming traffic on network port number 3 of
an appliance, the OID would be 1.3.6.1.2.1.2.2.1.10.3, while you could call the
key something similar to port3.ifInOctects, as shown in the following screenshot:
[ 146 ]
Chapter 4
If you don't already have your SNMP items defined in a template, an easy way to get
them is using the snmpwalk tool to directly query the host that you need to monitor
and get information about the available OIDs and their data types.
[ 147 ]
Collecting Data
For example, the following command is used to get the whole object tree from the
appliance at 10.10.15.19:
$ snmpwalk -v 3 -l AuthPriv -u user -a MD5 -A auth -x DES -X priv -m ALL
10.10.15.19
You need to substitute the user string with the username
for the SNMP agent, auth with the authentication password
for the user, priv with the privacy password, MD5 with the
appropriate authentication protocol, and DES with the privacy
protocol that you defined for the agent. Please remember that
the authentication password and the privacy password must be
longer than eight characters.
The SNMP agent on the host will respond with a list of all its OIDs. The following is
a fragment of what you could get:
HOST-RESOURCES-MIB::hrSystemUptime.0 = Timeticks: (8609925)
23:54:59.25HOST-RESOURCES-MIB::hrSystemDate.0 = STRING: 2013-728,9:38:51.0,+2:0
HOST-RESOURCES-MIB::hrSystemInitialLoadDevice.0 = INTEGER: 393216
HOST-RESOURCES-MIB::hrSystemInitialLoadParameters.0 = STRING: "root=/dev/
sda8 ro"
HOST-RESOURCES-MIB::hrSystemNumUsers.0 = Gauge32: 2
HOST-RESOURCES-MIB::hrSystemProcesses.0 = Gauge32: 172
HOST-RESOURCES-MIB::hrSystemMaxProcesses.0 = INTEGER: 0
HOST-RESOURCES-MIB::hrMemorySize.0 = INTEGER: 8058172 KBytes
HOST-RESOURCES-MIB::hrStorageDescr.1 = STRING: Physical memory
HOST-RESOURCES-MIB::hrStorageDescr.3 = STRING: Virtual memory
HOST-RESOURCES-MIB::hrStorageDescr.6 = STRING: Memory buffers
HOST-RESOURCES-MIB::hrStorageDescr.7 = STRING: Cached memory
HOST-RESOURCES-MIB::hrStorageDescr.8 = STRING: Shared memory
HOST-RESOURCES-MIB::hrStorageDescr.10 = STRING: Swap space
HOST-RESOURCES-MIB::hrStorageDescr.35 = STRING: /run
HOST-RESOURCES-MIB::hrStorageDescr.37 = STRING: /dev/shm
HOST-RESOURCES-MIB::hrStorageDescr.39 = STRING: /sys/fs/cgroup
HOST-RESOURCES-MIB::hrStorageDescr.53 = STRING: /tmp
HOST-RESOURCES-MIB::hrStorageDescr.56 = STRING: /boot
[ 148 ]
Chapter 4
Let's say that we are interested in the system's memory size. To get the full OID for it,
we will reissue the snmpwalk command using the fn option for the -O switch. These
will tell snmpwalk to display the full OIDs in a numeric format. We will also limit the
query to the OID we need, as taken from the previous output:
$ snmpwalk -v 3 -l AuthPriv -u user -a MD5 -A auth -x DES -X priv -m ALL
-O fn 10.10.15.19 HOST-RESOURCES-MIB::hrMemorySize.0
.1.3.6.1.2.1.25.2.2.0 = INTEGER: 8058172 KBytes
And there we have it. The OID we need to put in our item definition is
1.3.6.1.2.1.25.2.2.0.
SNMP traps
SNMP traps are a bit of an oddball if compared to all the other Zabbix item types.
Unlike other items, SNMP traps do not report a simple measurement but an event of
some type. In other words, they are the result of a kind of check or computation made
by the SNMP agent and sent over to the monitoring server as a status report. An
SNMP trap can be issued every time a host is rebooted, an interface is down, a disk is
damaged, or a UPS has lost power and is keeping the servers up using its battery.
This kind of information contrasts with Zabbix's basic assumption, that is, an item is
a simple metric not directly related to a specific event. On the other hand, there may
be no other way to be aware of certain situations if not through an SNMP trap either
because there are no related metrics (consider, for example, the event the server is
being shut down) or because the appliance's only way to convey its status is through a
bunch of SNMP objects and traps.
So, traps are of relatively limited use to Zabbix as you can't do much more than build
a simple trigger out of every trap and then notify about the event (not much point
in graphing a trap or building calculated items on it). Nevertheless, they may prove
essential for a complete monitoring solution.
To manage SNMP traps effectively, Zabbix needs a couple of helper tools: the
snmptrapd daemon, to actually handle connections from the SNMP agents, and
a kind of script to correctly format every trap and pass it to the Zabbix server for
further processing.
The snmptrapd process
If you have compiled an SNMP support into the Zabbix server, you should already
have the complete SNMP suite installed, which contains the SNMP daemon, the
SNMP trap daemon, and a bunch of utilities, such as snmpwalk and snmptrap.
[ 149 ]
Collecting Data
If it turns out that you don't actually have the SNMP suite installed, the following
command should take care of the matter:
# yum install net-snmp net-snmp-utils
Just as the Zabbix server has a bunch of daemon processes that listen on the TCP port
10051 for incoming connections (from agents, proxies, and nodes), snmptrapd is the
daemon process that listens on the UDP port 162 for incoming traps coming from
remote SNMP agents.
Once installed, snmptrapd reads its configuration options from an snmptrapd.conf
file, which can be usually found in the /etc/snmp/ directory. The bare minimum
configuration for snmptrapd requires only the definition of a community string in
the case of versions 1 and 2 of SNMP, which is as follows:
authCommunity log public
Alternatively, the definition of a user and a privacy level in the case of SNMP
Version 3 is as follows:
createUser -e ENGINEID user MD5 auth DES priv
You need to create a separate createUser line for every remote
Version 3 agent that will send traps. You also need to substitute all
the user, auth, priv, MD5, and DES strings with what you have
already configured on the agent, as explained in the previous note.
Most importantly, you need to set the correct ENGINEID for every
agent. You can get it from the agent's configuration itself.
With this minimal configuration, snmptrapd will limit itself to log the trap to syslog.
While it could be possible to extract this information and send it to Zabbix, it's
easier to tell snmptrapd how it should handle the traps. While the daemon has no
processing capabilities of its own, it can execute any command or application by
either using the trapHandle directive or leveraging its embedded perl functionality.
The latter is more efficient as the daemon won't have to fork a new process and
wait for its execution to finish, so it's the recommended one if you plan to receive a
significant number of traps. Just add the following line to snmptrapd.conf:
perl do "/usr/local/bin/zabbix_trap_receiver.pl";
You can get the zabbix_trap_receiver script from the
Zabbix sources. It's located in misc/snmptrap/zabbix_
trap_receiver.pl.
[ 150 ]
Chapter 4
Once it is restarted, the snmptrapd daemon will execute the perl script of your
choice to process every trap received. As you can probably imagine, your job doesn't
end here—you still need to define how to handle the traps in your script and find
a way to send the resulting work over to your Zabbix server. We'll discuss both of
these aspects in the following section.
The perl trap handler
The perl script included in the Zabbix distribution works as a translator from an
SNMP trap format to a Zabbix item measurement. For every trap received, it will
format it according to the rules defined in the script and will output the result in a
log file. The Zabbix server will, in turn, monitor the said log file and process every
new line as an SNMP trap item, basically matching the content of the line to any trap
item defined for the relevant host. Let's see how it all works by looking at the perl
script itself and illustrating its logic:
#!/usr/bin/perl
#
# Zabbix
# Copyright (C) 2001-2013 Zabbix SIA
#
#########################################
#### ABOUT ZABBIX SNMP TRAP RECEIVER ####
#########################################
# This is an embedded perl SNMP trapper receiver designed for
# sending data to the server.
# The receiver will pass the received SNMP traps to Zabbix server
# or proxy running on the
# same machine. Please configure the server/proxy accordingly.
#
# Read more about using embedded perl with Net-SNMP:
#
http://net-snmp.sourceforge.net/wiki/index.php/Tut:Extending_
snmpd_using_perl
This first section contains just the licensing information and a brief description of
the script. Nothing that's worth mentioning, except a simple reminder—check that
your perl executable is correctly referenced in the first line, or change it accordingly.
The following section is more interesting, and if you are happy with the script's
default formatting of SNMP traps, it may also be the only section that you will ever
need to customize:
#################################################
#### ZABBIX SNMP TRAP RECEIVER CONFIGURATION ####
[ 151 ]
Collecting Data
#################################################
$SNMPTrapperFile = '/tmp/zabbix_traps.tmp';
$DateTimeFormat = '%H:%M:%S %Y/%m/%d';
Just set $SNMPTrapperFile to the path of the file that you wish the script to log its
trap to, and set the SNMPTrapperFile option in your zabbix_server.conf file to the
same value. While you are at it, also set StartSNMPTrapper to 1 in zabbix_server.
conf so that the server will start monitoring the said file.
$DateTimeFormat, on the other hand, should match the format of the actual SNMP
traps you receive from the remote agents. Most of the time, the default value is
correct, but take the time to check it and change it as needed.
The following section contains the actual logic of the script. Notice how the bulk of
the logic is contained in a subroutine called zabbix_receiver. This subroutine will
be called and executed towards the end of the script but is worth examining in detail:
###################################
#### ZABBIX SNMP TRAP RECEIVER ####
###################################
use Fcntl qw(O_WRONLY O_APPEND O_CREAT);
use POSIX qw(strftime);
sub zabbix_receiver
{
my (%pdu_info) = %{$_[0]};
my (@varbinds) = @{$_[1]};
The snmptrapd daemon will execute the script and pass the trap that it just received.
The script will, in turn, call its subroutine, which will immediately distribute the trap
information into two lists—the first argument is assigned to the %pdu_info hash and
the second one to the @varbinds array:
# open the output file
unless (sysopen(OUTPUT_FILE, $SNMPTrapperFile,
O_WRONLY|O_APPEND|O_CREAT, 0666))
{
print STDERR "Cannot open [$SNMPTrapperFile]:
$!\n";
return NETSNMPTRAPD_HANDLER_FAIL;
}
[ 152 ]
Chapter 4
Here, the script will open the output file or fail graciously if it somehow cannot. The
next step consists of extracting the hostname (or IP address) of the agent that sent the
trap. This information is stored in the %pdu_info hash we defined previously:
# get the host name
my $hostname = $pdu_info{'receivedfrom'} || 'unknown';
if ($hostname ne 'unknown') {
$hostname =~ /\[(.*?)\].*/;
$hostname = $1 || 'unknown';
}
Now, we are ready to build the actual SNMP trap notification message. The first
part of the output will be used by Zabbix to recognize the presence of a new trap
(by looking for the ZBXTRAP string and knowing which of the monitored hosts the
trap refers to). Keep in mind that the IP address or hostname set here must match
the SNMP address value in the host configuration as set using the Zabbix frontend.
This value must be set even if it's identical to the main IP/hostname for a given host.
Once the Zabbix server has identified the correct host, it will discard this part of the
trap notification:
# print trap header
#
timestamp must be placed at the beginning of the first line
(can be omitted)
#
the first line must include the header "ZBXTRAP [IP/DNS
address] "
#
* IP/DNS address is the used to find the corresponding SNMP
trap items
#
* this header will be cut during processing (will not appear
in the item value)
printf OUTPUT_FILE "%s ZBXTRAP %s\n",
strftime($DateTimeFormat, localtime), $hostname;
After the notification header, the script will output the rest of the trap as received by
the SNMP agent:
# print the PDU info
print OUTPUT_FILE "PDU INFO:\n";
foreach my $key(keys(%pdu_info))
{
printf OUTPUT_FILE " %-30s %s\n", $key,
$pdu_info{$key};
}
[ 153 ]
Collecting Data
The printf statement in the previous code will circle over the %pdu_info hash and
output every key-value pair:
# print the variable bindings:
print OUTPUT_FILE "VARBINDS:\n";
foreach my $x (@varbinds)
{
printf OUTPUT_FILE " %-30s type=%-2d value=%s\n",
$x->[0], $x->[2], $x->[1];
}
close (OUTPUT_FILE);
return NETSNMPTRAPD_HANDLER_OK;
}
The second printf statement, printf OUTPUT_FILE " %-30s type=%-2d
value=%s\n", $x->[0], $x->[2], $x->[1];, will output the contents of the @
varbinds array one by one. This array is the one that contains the actual values
reported by the trap. Once done, the log file is closed and the execution of the
subroutine ends with an exit message:
NetSNMP::TrapReceiver::register("all", \&zabbix_receiver) or
die "failed to register Zabbix SNMP trap receiver\n";
print STDOUT "Loaded Zabbix SNMP trap receiver\n";
The last few lines of the script set the zabbix_receiver subroutine as the actual
trap handler and give feedback about its correct setup. Once the trap handler starts
populating the zabbix_traps.log log file, you need to define the corresponding
Zabbix items.
As you've already seen, the first part of the log line is used by the Zabbix trap
receiver to match a trap with its corresponding host. The second part is matched to
the aforesaid host's SNMP trap item's RegExp definitions, and its contents are added
to every matching item's history of values. This means that if you wish to have a
startup trap item for a given host, you'll need to configure an SNMP trap item with
an snmptrap["coldStart"] key, as shown in the following screenshot:
[ 154 ]
Chapter 4
From now on, you'll be able to see the contents of the trap in the item's data history.
Monitoring Zabbix SSH
The SSH monitoring functionality provided by Zabbix, since it's server-triggered
and even agentless, is quite useful. This specific functionality is precious as it allows
us to run remote commands on a device that doesn't support the Zabbix agent. This
functionality is tailor-made for all the cases where, for support reasons, we can't
install a Zabbix agent. Some practical cases are given as follows:
• A third-party, vendor-specific appliance where you can't install software
• A device that has a custom-made operating system or a closed
operating system
To be able to run SSH checks, Zabbix needs to be configured
with SSH2 support; here, the minimum supported libssh2 is
Version 1.0.0.
[ 155 ]
Collecting Data
SSH checks support for two different kinds of authentication:
• SSH with username and password
• Key file based authentication
To use the username/password pair authentication, we don't need to do any special
configuration; it is enough to have compiled Zabbix with the SSH2 support.
Configuring the SSH key authentication
To use the key authentication, the first thing to do is configure zabbix_server.conf;
in particular, we need to change the following entry:
# SSHKeyLocation=
Uncomment this line and specify the directory that contains the public and private
keys for instance:
# SSHKeyLocation=/home/zabbixsvr/.ssh
Once this is done, you need to restart the Zabbix server from root with the following
command:
$ service zabbix-server restart
Now, we can finally create a new pair of SSH keys running the following command
from root:
$ sudo -u zabbix ssh-keygen -t rsa -b 2048
Generating public/private rsa key pair.
Enter file in which to save the key (/home/zabbix/.ssh/id_rsa):
Created directory '/home/zabbix/.ssh'.
Enter passphrase (empty for no passphrase):
Enter same passphrase again:
Your identification has been saved in /home/zabbix/.ssh/id_rsa.
Your public key has been saved in /home/zabbix/.ssh/id_rsa.pub.
The key fingerprint is:
a9:30:a9:ce:c6:22:82:1d:df:33:41:aa:df:f3:e4:de zabbix@localhost.
localdomain
The key's randomart image is:
+--[ RSA 2048]----+
|
|
|
|
[ 156 ]
Chapter 4
|
|
|
..
+o
|
...o..
.
|
S
|
|
|
|.o.+ ....
|
|=o= ..=o .
|
|ooo.. .*+ E
|
+-----------------+
Now, on the remote host, we need to create a dedicated restricted account as we
don't want to expose the system but only monitor it, and then we can finally copy
our keys. In the following example, we are supposed to have created the account
zabbix_mon on the remote host:
$ sudo -u zabbix ssh-copy-id zabbix_mon@<remote-host-ip>
Now you can check whether everything went fine by simply triggering a remote
connection with:
$ sudo -u zabbix ssh zabbix_mon@<remote-host-ip>
Now, if all has been properly configured, we will have a session on the remote host.
Finally, we can define a custom item to retrieve the output of uname –a and then have
the kernel version retrieved as an item. This is shown in the following screenshot:
[ 157 ]
Collecting Data
This requires some consideration; first of all, it is possible that libssh2 truncates
the output to 32 K, in which case it is better to be aware. Also, it is better to always
use the fully qualified path for all the command specified. Here too, it is worth
considering that the SSH can introduce a delay and can slow down the whole
process. All those considerations are valid even for the Telnet agent checks. The
negative side is that, of course, Telnet is not encrypted and is not a secure protocol.
Also, as you know, it supports only username and password authentication.
Especially if you're going to use Telnet, it is fundamental, if not critical, to have a
read-only account made for Telnet checks.
Monitoring Zabbix IPMI
Nowadays, you can quickly monitor the health and availability of you devices using
IPMI. Definitely, the main requirement here is that your device supports Intelligent
Platform Management Interface (IPMI). IPMI is a hardware level specification
that is software neutral, meaning it is not tied in any way with BIOS and operating
systems. One interesting feature is that the IPMI interface can be available even when
the system is in the powered-down state. This is possible because inside each IPMIenabled device, there is a separate device that consumes less power, independent
of any other board or software. Nowadays, IPMI is fully supported by most server
vendors, and talking about servers, it is usually exposed by the management cards:
HP ILO, IBM RSA, Sun SSP, DELL RDAC, and so on.
If you would like to know in detail how IMPI works, since is a standard designed by
Intel, you can find the documentation at http://www.intel.com/content/www/us/
en/servers/ipmi/ipmi-specifications.html.
Obviously, to perform an IPMI check, you need to have compiled Zabbix with IPMI
--with-openipmi support, please refer to Chapter 1, Deploying Zabbix.
IPMI uses a request-response protocol over a message-based interface to dialogue
with all the device components, but more interesting is that other than retrieving
components metrics or accessing the non-volatile system event log, you even can
retrieve data from all the sensors installed in your hardware.
The first steps with IPMI
First of all, you need to make sure that you've installed all the required packages;
otherwise, you can install them with this command executed from root:
$ yum install ipmitool OpenIPMI OpenIPMI-libs
[ 158 ]
Chapter 4
Now, we can already retrieve temperature metrics using IPMI, for instance, using
the following command:
$ ipmitool sdr list | grep Temp
Ambient Temp | 23 degrees C
| ok
CPU 1 Temp
| 45 degrees C
| ok
CPU 2 Temp
| disabled
| ns
CPU 3 Temp
| disabled
| ns
CPU 4 Temp
| disabled
| ns
Note that in the previous example, we've got three disabled lines as those CPU
sockets are empty. As you can see, we can quickly retrieve all the internal parameters
via the IPMI interface. Now, it is interesting to see all the possible states that can
apply to our IPMI ID, which is CPU 1 Temp, please note that since the IPMI ID
contains spaces, we need to use the double quote notation:
$ ipmitool event "CPU 1 Temp" list
Finding sensor CPU 1 Temp... ok
Sensor States:
lnr : Lower Non-Recoverable
lcr : Lower Critical
lnc : Lower Non-Critical
unc : Upper Non-Critical
ucr : Upper Critical
unr : Upper Non-Recoverable
Those are all the possible CPU 1 Temp states. Now, IPMI is a simple, read-only
protocol, but you can even simulate errors or configure parameters. We are now
going to simulate a low-temperature threshold, just to see how this works. Running
the following command, you can simulate a -128 degrees Celsius reading:
$ ipmitool event "CPU 1 Temp" "lnc : Lower Non-Critical"
Finding sensor CPU 1 Temp... ok
0 | Pre-Init Time-stamp | Temperature CPU 1 Temp | Lower Non-critica l |
going low | Reading -128 < Threshold -128 degrees C
Now, we can quickly verify that this has been logged in the system event log with:
$ ipmitool sel list | tail -1
1c0 | 11/19/2008 | 21:38:22 | Temperature #0x98 | Lower Non-critical
going low
[ 159 ]
Collecting Data
This is one is the best nondisruptive tests that we can do to
make you aware that it's required to profile read-only IPMI
accounts. Using the admin IPMI account, you can reset
your management controller, trigger a shutdown, trigger a
power-reset, change the boot list, and so on.
Configuring IPMI accounts
To configure an IPMI account, you have essentially two ways:
• Use the management interface itself (RDAC, ILO, RS, and so on)
• Using OS tools and then OpenIPMI
First of all, it is better to change the default root password; you can do it with:
$ ipmitool user set password 2 <new_password>
Here, we are resetting the default password for the root account that has the
user ID 2.
Now, it is important to create a Zabbix user account that can query the signor's data
and has no rights to restart a server or change any configuration.
In the next line, we are creating the Zabbix user with the user ID 3; please check
whether you already have the user ID 3 in your system. First of all, define the user
login with this command from root:
$ ipmitool user set name 3 zabbix
Then, set the relative password:
$ ipmitool user set password 3
Password for user 3:
Password for user 3:
Now, we need to grant our Zabbix the required privileges:
$ ipmitool channel setaccess 1 3 link=on ipmi=on callin=on privilege=2
Activate the account:
$ ipmitool user enable 3
Verify that all is fine:
$ ipmitool channel getaccess 1 3
Maximum User IDs
: 15
[ 160 ]
Chapter 4
Enabled User IDs
: 2
User ID
: 3
User Name
: zabbix
Fixed Name
: No
Access Available
: call-in / callback
Link Authentication
: enabled
IPMI Messaging
: enabled
Privilege Level
: USER
The use we've just created is named zabbix, and it has the USER privilege level.
Anyway, the account is not enabled to access from the network; to enable this account,
we need to activate the MD5 authentication for LAN access for this user group:
$ ipmitool lan set 1 auth USER MD5
We can verify this with:
$ ipmitool lan print 1
Set in Progress
: Set Complete
Auth Type Support
: NONE MD5 PASSWORD
Auth Type Enable
: Callback :
: User
: MD5
: Operator :
: Admin
: MD5
: OEM
:
Now we can finally run the queries remotely from our Zabbix server directly with
this command:
$ ipmitool –U Zabbix –H <ip-of-IPMI-host-here> -I lanplus sdr list | grep
Temp
Ambient Temp | 23 degrees C
| ok
CPU 1 Temp
| 45 degrees C
| ok
CPU 2 Temp
| disabled
| ns
CPU 3 Temp
| disabled
| ns
CPU 4 Temp
| disabled
| ns
Now we are ready to use our Zabbix server to retrieve IPMI items.
[ 161 ]
Collecting Data
Configuring Zabbix IPMI items
When you're looking for IPMI metrics, the most difficult part is the setup that we've
just done. In Zabbix, the setup is quite easy. First of all, we need to uncomment the
following line in zabbix_server.conf:
# StartIPMIPollers=0
Change the value to something reasonable for the amount of IPMI interface you're
going to monitor. Anyway, this is not critical; the most important part is to enable
the IPMI Zabbix poller that is disabled by default. In this example, we will use:
StartIPMIPollers=5
Now, we need to restart Zabbix from root by running:
$ service zabbix-server restart
Now, we can finally switch on the web interface and start adding IPMI items.
The first step is configure the IPMI parameters at the host level and then go to
Configuration | Host. There, we need to add IPMI interface, the relative port, as
shown in the following screenshot:
Then, we need to switch on the IPMI tab, which is where the other configuration
parameters are.
In the IPMI tab for Authentication algorithm, select MD5, and as per our example
configuration done previously, for the Privilege level, select User. In the Username
field, you can write Zabbix, and in Password, you can write the password you've
specified during the configuration, as shown in the following screenshot:
[ 162 ]
Chapter 4
Now, we can add our item of the type IPMI agent. As per the previous example, the
item we're acquiring here is CPU 1 Temp, and the the Type is Numeric (float). The
following screenshot shows this:
[ 163 ]
Collecting Data
Configuring the Zabbix side of IPMI is a straightforward process; anyway, if you're
using a different OpenIPMI version, please be aware that there are known issues
with OpenIPMI Version 2.0.7, and that Zabbix is not working fine with this version.
Then, the version 2.0.14 or later is required to make it work. In some devices, such as
network temperature sensors that have only one interface card, logically, the same
card will expose even the IPMI interface. If this is your case, please bear in mind to
configure it on the same IP address as that of your device. Another important thing
to know about IPMI is that the names of discrete sensors have been changed between
OpenIPMI 2.0.16, 2.0.17, 2.0.18, and 2.0.19. Thus, it is better to check the correct name
using the OpenIPMI version that you have deployed in the Zabbix server.
Monitoring the web page
In this day and age, web applications are virtually ubiquitous. Some kinds of
websites or a collection of web pages is typically the final product or the service of
a complex structure that comprises different databases, application servers, web
servers, proxies, network balancers and appliances, and more. When it comes to
monitoring duties, it makes sense to go just a step further and monitor a resulting
site or web page in addition to all the backend assets that enable the said page. The
advantages as far as warnings and notifications go, are fairly limited, as failure to
reach a web page is certainly a critical event. But it hardly gives any insight into
what may be the actual problem if you haven't set up the correct metrics and triggers
on the backend side. On the other hand, it may be crucial to have a collection of data
about a website's performance. In order to anticipate possible problems, substantiate
SLA reporting, and plan for hardware or software upgrades.
One big advantage of Zabbix's web-monitoring facilities is the scenario concept. You
can define a single web scenario that is composed of many simple steps, each one
building on the previous and sharing a common set of data. Furthermore, every such
definition includes the automatic creation of meaningful items and graphs, both at the
scenario level (overall performance) and at the single-step level (local performance).
This makes it possible to not only monitor a single web page but also simulate entire
web sessions so that every component of a web application will contribute to the final
results. A single scenario can be very complex and requires a great number of items
that would end up being difficult to track and group together. This is the reason why
web monitoring in Zabbix has its own web configuration tab and interface, separate
from regular items, where you can configure monitoring on a higher level.
[ 164 ]
Chapter 4
To perform web monitoring, the Zabbix server must be
initially configured with cURL (libcurl) support. Please
refer to Chapter 1, Deploying Zabbix.
Web scenarios support plain HTTP/HTTPS, BASIC, NTLM, form-based
authentication, cookies, submission of form fields, and checking of page content in
addition to the HTTP code responses.
For all their power, web scenarios also suffer from a few limitations when it comes to
monitoring the modern Web.
First of all, JavaScript is not supported, so you can't simulate a complete AJAX
session exactly as a human user would experience it. This also means that any kind
of automated page reloads won't be executed in the scenario.
Furthermore, while you can submit forms, you have to know in advance both the
name of the fields and their content. If either of them is generated dynamically from
page to page (as many ASP.NET pages are to keep the session information), you
won't be able to use it in subsequent steps.
These may seem to be negligible limitations, but they may prove to be quite
important if you need to monitor any site that relies heavily on client-side
elaborations (JavaScript and friends) or on dynamic tokens and form fields. The
reality is that an increasing number of web applications or frameworks use one or
both of these features.
Nevertheless, even with these limitations, Zabbix's web monitoring facilities prove
to be a very useful and powerful tool that you may want to take full advantage of,
especially if you produce a lot of web pages as the final result of an IT pipeline.
[ 165 ]
Collecting Data
Authenticating web pages
To create a web scenario, you need to go through Configuration | Host and then
click on Create scenario. You'll see a window, as shown in the following screenshot:
Within this form, you can define parameters other than the usual ones, such as
Name, Application, and Update interval, which represents the frequency with
which our scenario is executed. Even the user Agent and the number of Retries
can be defined. Once you've defined the user Agent that you would like to use,
Zabbix will act as the selected browser by presenting itself as the browser defined.
Regarding Retries, it is important to know that Zabbix will not repeat a step due to a
wrong response or a mismatch of the required string.
[ 166 ]
Chapter 4
Another important and new section is Headers. Here, you can specify the HTTP
headers that will be sent when Zabbix executes a request.
The custom headers are supported starting from Zabbix 2.4. In
this field, you can use the HOST.* macros and user macros.
There are three methods of authentication supported for web monitoring; you can
see them in the relative Authentication tab, as shown in the following screenshot:
Those method are Basic, NTLM, and form-based. The first two are fairly
straightforward and just need to be defined at the scenario level. The NTLM
authentication will provide two additional fields to enter the username and
password. Starting with Zabbix 2.2, we have now fully supported the use of user
macros in the username and password fields. Again, on this tab, we can even enable
the SSL verification. The SSL verify peer checkbox enables the web server certificate
checking, and the SSL verify host checkbox is used to verify the Common Name
field or the Subject Alternate Name field of the web server certificate. The SSL
certificate file checkbox is used for client-side authentication; here, you need to
specify a PEM certificate file. If the PEM certificate contains even the private key, you
can avoid specifying the relative key on SSL key file and SSL key password.
[ 167 ]
Collecting Data
The certificate location can be configured in the main
configuration file, zabbix_server.conf. There are indeed
three SSL configuration parameters: SSLCertLocation,
SSLKeyLocation, and SSLCALocation.
Both fields, SSL certificate files and SSL key file, support HOST.* macros.
Coming back to authentication, we need to highlight form-based authentication,
which relies on the ability of the client (a Zabbix server in this instance) to keep the
session cookies, and which is triggered when the said client submits a form with
the authentication data. While defining a scenario, you'll need to dedicate a step
just for the authentication. To know which form fields you'll need to submit, look at
the HTML source of the page containing the authentication form. In the following
example, we'll look at the Zabbix authentication page. Every form will be slightly
different, but the general structure will largely be the same (here, only the login form
is shown in an abbreviated manner):
<form action="index.php" method="post">
<input type="hidden" name="request" class="input hidden" value="" />
<!-- Login Form -->
<div>Username</div>
<input type="text" id="name" name="name" />
<div>Password</div>
<input type="password" id="password" name="password" />
<input type="checkbox" id="autologin" name="autologin" value="1"
checked="checked" />
<input type="submit" class="input" name="enter" id="enter"
value="Sign in" />
</form>
You need to take note of the input tags and their name options because these are
the form fields you are going to send to the server to authenticate. In this case, the
username field is called name, the password field is called password, and finally, the
submit field is called enter and has the value Sign in.
[ 168 ]
Chapter 4
We are now ready to create a scenario; we will then define our scenario as shown in
the following screenshot:
As you can see, in the Variables field, we have defined two variables that we're
going to use in the next steps and then in the authentication step. This is a useful
feature as it allows us to the variable defined across the scenario.
[ 169 ]
Collecting Data
The next thing to do is the authentication, and then we need to add one step to our
scenario, as shown in the following screenshot:
[ 170 ]
Chapter 4
Please note the usage of the predefined variables {user} and {password}. As per the
required string, we can use Connected, which appears right in the footer once you're
connected, and, of course, Required status codes will be 200. In this example, we are
defining a new variable that represents the authentication token. This variable will be
used during the logout process and will be populated by the data received. From now
on, every URL that you'll check or every form that you'll submit, will be in the context
of an authenticated session, assuming the login process was successful, of course.
Starting with Zabbix 2.4, each step defined supports web
redirects. If the checkbox is flagged Zabbix, set the cURL option
CURLOPT_FOLLOWLOCATION (http://curl.haxx.se/
libcurl/c/CURLOPT_FOLLOWLOCATION.html). Also, it is
possible to retrieve only the header for each page instead of
setting the cURL option CURLOPT_NOBODY. More information
is available at http://curl.haxx.se/libcurl/c/
CURLOPT_NOBODY.html.
Logging out
One common mistake when it comes to web monitoring is that the authentication
part is taken care of at the start of a scenario but rarely at the end during logout. If
you don't log out of a website, depending on the system used to keep track of the
logged-in users and active sessions, a number of problems may arise.
Active sessions usually range from a few minutes to a few days. If you are
monitoring the number of logged-in users, and your session's timeouts are on the
longer side of the spectrum, every login scenario would add to the number of active
users reported by the monitoring items. If you don't immediately log out at the end
of the scenario, you may, at the very least, end up with monitoring measurements
that are not really reliable, and they would show a lot of active sessions that are
really just monitoring checks.
In the worst-case scenario, your identity manager and authentication backend
may not be equipped to handle a great number of non-expiring sessions and may
suddenly stop working, bringing your whole infrastructure to a grinding halt. We
can assure you that these are not hypothetical situations but real-life episodes that
occurred in the authors' own experience.
[ 171 ]
Collecting Data
At any rate, you certainly can't go wrong by adding a logout step to every web
scenario that involves a log in. You'll make sure that your monitoring actions won't
cause any unforeseen problem, and at the very least, you will also test the correct
functioning of your session's tear-down procedures. Logout steps are also usually
quite easy as they normally involve just a GET request to the correct URL. In the case
of the Zabbix frontend, you would create the following final step (as shown in the
following screenshot) before ending the scenario:
[ 172 ]
Chapter 4
Once you have defined this logout step, your scenario will look similar to the
following screenshot:
Please note the use of the {sid} variable in the logout string. Also, in this example,
we have used zabbix-web-gui. This obviously needs to be replaced with your own
web server.
Furthermore, please consider that every new session uses up a small amount of
computing resources whether it's disk space or memory. If you create a large number
of sessions in a short time, due to frequent checks, you could end up significantly
degrading the website's performances. So, take care to:
• Include all the required steps within your scenario
• Avoid duplicating scenarios for simple checks
• Always define a logout step
• Bear in mind that the frequency needs to be a reasonable value and doesn't
affect the monitored system
Also, it is important to know that you can't skip steps included in web scenarios.
They are all executed in the defined order. Also, if you need a more verbose log, you
can increase it at the real-time HTTP poller using the following command:
$ zabbix_server –R log_level_increase="http poller"
As a last tip, bear in mind that the history for which we are monitoring items is of 30
days and for 90 trends.
[ 173 ]
Collecting Data
Aggregated and calculated items
Until now, every item type described in this chapter could be considered a way to
get raw measurements as single data points. In fact, the focus of the chapter has been
more on setting up Zabbix to retrieve different kinds of data than on what is actually
collected. This is because on the one hand, a correct setup is crucial for effective data
gathering and monitoring, while on the other hand, the usefulness of a given metric
varies wildly across environments and installations, depending on the specific needs
that you may have.
When it comes to aggregated and calculated items though, things start to become
really interesting. Both types don't rely on probes and measurements at all; instead,
they build on existing item values to provide a whole new level of insight and
elaboration on the data collected in your environment.
This is one of the points where Zabbix's philosophy of decoupling measurements
and triggering logic really pays off, because it would be quite cumbersome,
otherwise, to come up with similar features, and it would certainly involve a
significant amount of overhead.
The two types have the following features in common:
• Both of them don't make any kind of checks (agent-based, external, SNMP,
JMX, or otherwise) but directly query the Zabbix database to process the
existing information.
• While they have to be tied to a specific host because of how the Zabbix data
is organized, this is a loose connection compared to a regular item. In fact,
you could assign an aggregated item to any host regardless of the item's
specifics, although it's usually clearer and easier if you define one or more
simple dedicated hosts that will contain aggregated and calculated items so
that they'll be easier to find and reference.
• Aggregated and calculated items only work with numeric data types—there's
no point in asking for the sum or the average of a bunch of text snippets.
Aggregated items
The simpler of the two types discussed here, aggregated items can perform different
kinds of calculations on a specific item that is defined for every host in a group. For
every host in a given group, an aggregated item will get the specified item's data
(based on a specified function) and then apply the group function on all of the values
collected. The result will be the value of the aggregated item measurement at the
time that it was calculated.
[ 174 ]
Chapter 4
To build an aggregated item, you first need to identify the host group that you are
interested in and then identify the item, shared by all the group's hosts, which will
form the basis of your calculations. For example, let's say that you are focusing on
your web application servers, and you want to know something about the active
sessions of your Tomcat installations. In this case, the group would be something
similar to Tomcat Servers, and the item key would be jmx["Catalina:type=Manag
er,path=/,host=localhost",activeSessions].
Next, you need to decide how you want to retrieve every host's item data. This is
because you are not limited to just the last value but can perform different kinds of
preliminary calculations. Except for the last function, which indeed just retrieves
the last value from the item's history, all the other functions take a period of time as a
further argument.
Function
avg
Description
sum
This is the sum of all values in a specified time period
min
This is the minimum value recorded in a specified
time period
max
This is the maximum value recorded in a specified
time period
last
This is the latest value recorded
count
This is the number of values recorded in a specified
time period
This is the average value in a specified time period
What you now have is a bunch of values that still need to be brought together. The
following table explains the job of the group function:
Function
grpavg
Description
grpsum
This is the sum of all values collected
grpmin
This is the minimum value in a collection
grpmax
This is the maximum value in a collection
This is the average of all the values collected
Now that you know all the components of an aggregated item, you can build the
key; the appropriate syntax is as follows:
groupfunc["Host group","Item key",itemfunc,timeperiod]
[ 175 ]
Collecting Data
The Host group part can be defined locally to the aggregated
item definition. If you want to bring together data from different
hosts that is not part of the same group and you don't want to
create a host group just for this, you can substitute the host group
name with a list of the hosts—["HostA, HostB, HostC"].
Continuing with our example, let's say that you are interested in collecting the
average number of active sessions on your Tomcat application server every hour. In
this case, the item key would look as follows:
grpavg["Tomcat servers",
"jmx["Catalina:type=Manager,path=/,
host=localhost",activeSessions]", avg, 3600]
You could also use 1h or 60m as a time period if you don't want
to stick to the default of using seconds.
Using the same group and a similar item, you would also want to know the peak
number of concurrent sessions across all servers, this time every 5 minutes, which
can be done as follows:
grpsum["Tomcat servers",
"jmx["Catalina:type=Manager,path=/,host=localhost",maxActive]",
last, 0]
Simple as they are, aggregated items already provide useful functionality, which
would be harder to match without a collection of measurements as simple data that
is easily accessible through a database.
Calculated items
This item type builds on the concept of item functions expressed in the previous
paragraphs and takes it to a new level. Unlike aggregated items, with calculated
ones, you are not restricted to a specific host group, and more importantly, you
are not restricted to a single item key. With calculated items, you can apply any of
the functions available for the trigger definitions to any item in your database and
combine different item calculations using arithmetic operations. As with other item
types that deal with specialized pieces of data, the item key of a calculated item is
not used to actually define the data source but still needs to be unique so that you
can refer to the item in triggers, graphs, and actions. The actual item definition is
contained in the formula field, and as you can imagine, it can be as simple or as
complex as you need.
[ 176 ]
Chapter 4
In keeping with our Tomcat server's example, you could have a calculated item that
gives you a total application throughput for a given server as follows:
last(jmx["Catalina:type=GlobalRequestProcessor,name=http8080",bytesReceived]) +
last(jmx["Catalina:type=GlobalRequestProcessor,name=http8080",bytesSent]) +
last(jmx["Catalina:type=GlobalRequestProcessor,name=http8443",bytesReceived]) +
last(jmx["Catalina:type=GlobalRequestProcessor,name=http-8443",
bytesSent]) +
last(jmx["Catalina:type=GlobalRequestProcessor,name=jk-8009",
bytesReceived]) +
last(jmx["Catalina:type=GlobalRequestProcessor,name=jk8009",bytesSent])
Alternatively, you could be interested in the ratio between the active sessions and the
maximum number of allowed sessions so that, later, you could define a trigger based
on a percentage value instead of an absolute one, as follows:
100*last(jmx["Catalina:type=Manager,path=/,
host=localhost",activeSessions]) /
last(jmx["Catalina:type=Manager,path=/,host=localhost",
maxActiveSessions])
As previously stated, you don't need to stick to a single host either in your
calculations.
The following is how you could estimate the average number of queries on the
database per single session, on an application server, every 3 minutes:
avg(DBServer:mysql.status[Questions], 180) /
avg(Tomcatserver:Catalina:type=Manager,path=/,host=localhost",
activeSessions], 180)
The only limitation with calculated items is that there are no easy group functions
such as those available to aggregated items. So, while calculated items are essentially
a more powerful and flexible version of aggregated items, you still can't dispense
with aggregated items, as you'll need them for all group-related functions.
Despite this limitation, as you can easily imagine, the sky is the limit when it comes
to calculated items. Together with aggregated items, these are ideal tools to monitor
the host's group performances, such as clusters and grids, or to correlate different
metrics on different hosts that contribute to the performance of a single service.
Whether you use them for performance analysis and capacity planning or as the
basis of complex and intelligent triggers, or both, the judicious use of aggregated and
calculated items will help you to make the most out of your Zabbix installation.
[ 177 ]
Collecting Data
Summary
In this chapter, we delved into various aspects of item definitions in Zabbix. At this
point, you should know the main difference between a Zabbix item and a monitoring
object of other products and why Zabbix's approach of collecting simple, raw data
instead of monitoring events is a very powerful one. You should also know the ins
and outs of monitoring the data flow traffic and how to affect it based on your needs
and environment. You should be comfortable to move beyond the standard Zabbix
agent when it comes to gathering data and be able to configure your server to collect
data from different sources—database queries, SNMP agents, IPMI agents, web
pages, JMX consoles, and so on.
Finally, you have, most probably, grasped the vast possibilities implied by the two
powerful item types—aggregated and calculated.
In the next chapter, you'll learn how to present and visualize all the wealth of data
you are collecting using graphs, maps, and screens.
[ 178 ]
Visualizing Data
Zabbix is a flexible monitoring system. Once implemented on an installation, it is
ready to support a heavy workload and will help you acquire a huge amount of
every kind of data. The next step is to graph your data, interpolate, and correlate
the metrics between them. The strong point is that you can relate different type of
metrics on the same axis of time, analyzing patterns of heavy and light utilization,
identifying services and equipment that fail most frequently in your infrastructure,
and capturing relationships between the metrics of connected services.
Beyond the standard graphs facility, Zabbix offers you a way to create your custom
graphs and to add them on your own template, thus creating an easy method to
propagate your graphs across all the servers. Those custom graphs (and also the
standard and simple graphs) can be collected into screens. Inside Zabbix, a screen
can contain different kinds of information—simple graphs, custom graphs, other
screens, plain text information, trigger overviews, and so on.
In this chapter, we will cover the following topics:
• Generating custom graphs
• Creating and using maps with shortcuts and nested maps
• Creating a dynamic screen
• Creating and setting up slides for a large monitor display
• Generating an SLA report
[ 179 ]
Visualizing Data
As a practical example, you can think of a big data center, where there are different
layers or levels of support; usually, the first level of support needs to have a general
overview of what is happening on your data center, the second level can be the
first level of support divided for typology of service, for example, DBA, application
servers, and so on. Now, your DBA (second level of support) will need the entire
database-related metrics, whereas an application server specialist most probably will
need all the Java metrics, plus some other standard metrics, such as CPU memory
usage. Zabbix's responses to this requirement are maps, screens, and slides.
Once you create all your graphs and have retrieved all the metrics and messages
you need, you can easily create screens that collect, for instance, all the DBA-related
graphs plus some other standard metrics; it will be easy to create a rotation of
those screens. The screen will be collected on slides, and each level of support will
see its groups of screens in a slide show, which has an immediate qualitative and
quantitative vision of what is going on.
Data center support is most probably the most complex slide show to implement,
but in this chapter, you will see how easy it is to create it. Once you have all the
pieces (simple graphs, custom graphs, triggers, and so on), you can use them and
also reuse them on different visualization types. On most of the slides, for instance,
all the vital parameters, such as CPU, memory, swap usage, and network I/O, need
to be graphed. Once done, your custom graphs can be reused in a wide number
of dynamic elements. Zabbix provides another great functionality, that is, the
ability to create dynamics maps. A map is a graphical representation of a network
infrastructure. All those features will be discussed in this chapter.
When you are finally ready to implement your own custom visualization screen, it
is fundamental to bear in mind the audience, their skills or background, and their
needs. Basically, be aware of what message you will deliver with your graphs.
Graphs are powerful tools to transmit your message; they are a flexible instrument
that can be used to give more strength to your speech as well as give a qualitative
overview of your service or infrastructure. This chapter is pleasant and will enable
you to communicate using all the Zabbix graphical elements.
[ 180 ]
Chapter 5
Graphs
Inside Zabbix, you can divide the graphs into two categories—simple graphs and
custom graphs. Both of these are analyzed in the next section.
Analyzing simple graphs
Simple graphs in Zabbix are something really immediate since you don't need to put
in a lot of effort to configure this feature. You only need to go to Monitoring | Latest
data, eventually filter by the item name, and click on the graph. Zabbix will show
you the historical graph, as shown in the following screenshot:
Clearly, you can graph only numeric items, and all the other kinds of data, such as
text, can't be shown on a graph. On the latest data item, you will see the graph link
instead—a link that will show the history.
No configuration is needed, but you can't customize
this graph.
[ 181 ]
Visualizing Data
At the top of the graphs, there is the time period selector. If you enlarge this period,
you will see the aggregated data. As long as the period is little and you would like
to see very recent data, you will see a single line. If the period is going to enquire the
database for old data, you will see three lines. This fact is tied to history and trends;
since the values are contained in the history table, the graph will only show one line.
Once you're going to retrieve data from the trends, there will be three lines, as shown
in the following screenshot:
In the previous screenshot, we can see three lines that define a yellow area. This area
is designed by the minimum and maximum values, and the green line represents the
mean value. For a quite complete discussion about trends/history tables, see Chapter
1, Deploying Zabbix. Here, it is important to have all those three values graphed.
The longevity of an item in history is defined in the
item itself in the field Keep history (in days) and
persistence on the trends table is defined in the Keep
trends (in days) field.
In the following screenshot, you can see how the mean values may vary with respect
to the minimum and maximum values. In particular, it is interesting to see how the
mean value remains almost the same at 12:00 too. You can see quite an important
drop in the CPU idle time (the light-green line) that didn't influence the mean value
(green line) too much since, most likely, it was only a small and quick drop, so it is
basically lost on the mean value but not on our graph since Zabbix preserves the
minimum and maximum values.
[ 182 ]
Chapter 5
Graphs show the working hours with a white background, and the non-working
hours in gray (using the original template); the working time is not displayed if the
graph needs to show more than 3 months. This is shown in the following screenshot:
Simple graphs are intended just to graph some on-the-spot metrics and check a
particular item. Of course, it is important to interpolate the data; for instance, on the
CPU, you have different metrics and it is important to have all of them.
Analyzing ad hoc graphs
This is a brand-new feature available, starting with Zabbix 2.4. It's actually a very
nice feature as it enable you to create on the fly an ad hoc graph.
Now Zabbix can graph and represent, on the same graph, multiple metrics related to
the same timescale.
Thanks to this new functionality, everyone without
administrative privileges can produce graphs on the
fly with a few clicks.
[ 183 ]
Visualizing Data
To have an ad hoc graph generated for your metrics, you simply need to go to
Monitoring | Latest data and, from there, mark the checkbox relative to the item
you would like to graph, as shown in the following screenshot:
At the bottom of the same page, you need to choose in the drop-down menu the
kind of graph you prefer—the default graph is stacked, but it can be switched to the
standard graph—and then, click on Go.
The result of our example is shown in the following screenshot:
[ 184 ]
Chapter 5
Note that on this screen, you can quickly switch between Stacked and Normal.
This feature doesn't keep you tied with a host-specific
graph. This means that everyone is now enabled to generate
a graph with data coming from many different hosts; for
example, you can relate the CPU of your DB server with the
one coming from the application server.
Now we can dig a little into those ad hoc graphs and see some nice features.
Hacking ad hoc graphs
Now let's see something that can be quickly reused later on your screens.
Zabbix generates URLs for custom ad hoc graphs, such as http://<YOUR-ZABBIX-
GUI>/zabbix/history.php?sid=<SID >&form_refresh=2&action=batchgraph&i
temids[23701]=23701&itemids[23709]=23709&itemids[23705]=23705&itemids
[23707]=23707&itemids[23704]=23704&itemids[23702]=23702&graphtype=1&p
eriod=3600.
This URL is composed of many components:
• sid: This represents your session ID and is not strictly required
• form_refresh: This is a kind of refresh option—not strictly required
• itemids[id]=value: This is the actual item that Zabbix will show you on the
graph
• action=[batchgraph|showgraph]: This specifies the kind of graph we want
It is quite interesting to see how we can quickly switch from the default batchgraph
action in the URL by just replacing it with showgraph. The main difference here is
that batchgraph will show you only average values in the graph. Instead, it can be
a lot more useful to use showgraph, which includes the triggers—the maximum and
minimum values for each item.
[ 185 ]
Visualizing Data
An example of the same graph seen before with showgraph is as follows:
Here, you can clearly see that you now have the trigger included. Since you can find
it very useful to use this kind of approach, especially when you're an applicationspecific engineer and you're looking for standard graphs that are not strictly required
on your standard template, let's see another hidden functionality.
Now if you want to retrieve the graph directly to reuse it somewhere else, the
only thing you need to do is call with the same parameter, but instead of using
the history.php page, you need to use chart.php. The output will be the
following screenshot:
[ 186 ]
Chapter 5
The web page will display only the pure graph. Then, you can quickly save the most
used graphs among your favorites and retrieve them with a single click!
Analyzing custom graphs
We have only discussed the graph components here rather than the full interaction
functionality and their importance in seeing historical trends or delving into
a specific time period on a particular date. Zabbix offers the custom graphs
functionality—these graphs need to be created and customized by hand. For
instance, there are certain predefined graphs on the standard Template OS Linux.
To create a custom graph, you need to go to Configuration | Hosts (or Templates),
click on Graphs, and then on Create graph.
General graphs should be created in templates so that they
can be easily applied to a group of servers. An example is the
graph of CPU utilization on Template OS Linux. This one is
quite general; it is composed of several metrics aggregated
and is nice to have across all your Linux servers.
[ 187 ]
Visualizing Data
Graphs on Zabbix are really a strong point of the monitoring infrastructure. Inside
this custom graph, you can choose whether you want to show the working time and
the legend using different kinds of graphs. The details of the CPU Utilization graph
are shown in the following screenshot:
As you can see, the following graph is stacked and shows the legend of the x axis
defined with a fixed y axis scale. In this particular case, it doesn't make any sense to
use a variable for the minimum or maximum values of the y axis since the sum of
all the components represents the whole CPU and each component is a percentage.
Since a stacked graph represents the sum of all the stacked components, this one will
always be 100 percent, as shown in the following screenshot:
[ 188 ]
Chapter 5
There are a few considerations when it comes to triggers and working hours. These
are only two checks, but they change the flavor of the graph. In the previous graph,
the working hours are displayed on the graph but not the triggers, which is mostly
because there aren't triggers defined for those metrics. The working hours, as
mentioned earlier, are displayed in white. Displaying working hours is really useful
in all the cases where your server has two different life cycles or serves two different
tasks. As a practical example, you can think about a server placed in New York that
monitors and acquires all the market transactions of the U.S. market. If the working
hours—as in this case—coincide with the market's opening hours, the server will,
most probably, acquire data most of the time. Think about what will happen if the
same trading company works in the Asian market; most probably, they will enquire
the server in New York to see what happened while the market was open. Now, in
this example, the server will provide a service in two different scenarios and have the
working hours displayed in a graph, which can be really useful.
Displaying the working time in graphs is useful. See whether
your trigger goes on fire in this period.
[ 189 ]
Visualizing Data
Now, if you want to display the triggers in your graph, you only need to mark the
Show triggers checkbox, and all the triggers defined will be displayed on the graph.
Now, it can happen that you don't see any lines about the triggers in your graph; for
instance, look at the following screenshot:
Now where is your expected trigger line? Well, it is simple. Since the trigger is
defined for a processor load greater than five, to display this line you need to make a
few changes in this graph, in particular the Y axis MIN value and Y axis MAX value
fields. In the default, predefined CPU load graph, the minimum value is defined as
zero and the maximum value is calculated. Both need to be changed as follows:
[ 190 ]
Chapter 5
Now refresh your graph. Finally, you will see the trigger line, which wasn't visible in
the previous chart because the CPU was almost idle, and the trigger threshold was
too high and not displayed due to the auto-scaling on the y axis. This is shown in the
following screenshot:
As you probably already noticed, Zabbix doesn't display
periods shorter than an hour. The minimum graph period is
about 1 hour.
Zabbix supports the following kinds of custom graph:
• Normal
• Stacked
• Pie
• Exploded
[ 191 ]
Visualizing Data
Zabbix also supports different kinds of drawing styles. Graphs that display the
network I/O, for instance, can be made using gradient lines; this will draw an
area with a marked line for the border, so you can see the incoming and outgoing
network traffic on the same scale. An example of this kind is shown in the following
screenshot, which is easy to read. Since you don't have the total throughput to have
graphed the total amount from the incoming packet, the outgoing packet is the
better one to be chosen for a stacked graph. In stacked graphs, the two areas are
summarized and stacked, so the graph will display the total bandwidth consumed.
To highlight the difference between a normal graph and a stacked one, the following
screenshot displays the same graph during the same time period, so it will be easier
to compare them:
[ 192 ]
Chapter 5
As you can see, the peaks and the top line are made by aggregating the network
input and output of your network card. The preceding graph represents the whole
network traffic handled by your network card.
Reviewing all the combinations of graph properties
Zabbix is quite a flexible system and the graphs are really customizable to better
explore all the possible combinations of attributes and parameters that can be
customized. All the possible combinations of graph attributes are reviewed in the
following table:
Parameter
Description
Name
This is the graph name (note that this needs to be unique)
Width
This is the graph width in pixels
Height
This is the graph height in pixels
Graph type
Normal (values displayed as lines, filled region, bold lines, dots,
dashed lines, and gradient lines)
• Stacked values are displayed as stacked areas
• Pie values are displayed as a pie
• Exploded values are displayed as a pie but exploded
Show legend
If checked, the graph will display the legend.
Show working time
If checked, the non-working hours will be in gray and working
hours in a white background.
Show triggers
If checked, a single trigger line is displayed (note that this is not
available for pie and exploded).
Percentile line (left/
right)
Note that this is only available on normal graphs. If checked, it
displays a line where the value falls under the percentage (for
example, for 90, it will display a line where 90 percent of the
values fall under).
Y axis MIN/MAX
value
This sets the minimum and maximum value for the y axis, which
can be any of the following:
• Calculated: The minimum and maximum values will be
calculated on the basis of the displayed area
• Fixed: The fixed value will be used as per maximum or
minimum
• Item: The last value of the selected item will be used as
minimum/maximum
3D View
This displays the graphs in 3D (note that this is only available for
pie and exploded pie graphs).
[ 193 ]
Visualizing Data
This second table describes the item configuration:
Parameter
Description
Sort order
This represents the priority for a particular item over an other and is
useful to give priority to the region displayed, for example, in front of
or behind the other items. Here, you can drag and drop items in the
right order. Note that zero is the first processed item; Zabbix supports
up to 100 items.
Name
The name of the item is displayed here. The metric name is composed
in the form of <source> : <metric_name>. This means that if you
are inside the host configuration, you will see <hostname>:<metric_
name>. If you are creating the graphs inside a template, you will see
<template_name>:<metric_name>.
Type
Note that this is available only for the pie and exploded pie graphs:
• Simple
• Graph sum
Function
This determines the value to display if more than one is present; it can
be one of the following:
• All: This shows minimum, average, and maximum values
• Min: This only shows minimum values
• Avg: This only shows average values
• Max: This only shows maximum values
Draw style
This is only available for normal graphs:
• Line
• Filled region
• Bold line
• Dot
• Dashed line
Y axis side
Note: This is available only on stacked and normal graphs and defines
the y axis side for each element.
Colour
Other than the standard displayed on the palette, you can set all the
colors that you want in the RGB hex format.
[ 194 ]
Chapter 5
You can easily play with all those functionalities and
attributes. In version 2.0 of Zabbix, you have a Preview tab
that is really useful when you're configuring a graph inside
a host. If you're defining your graph at a template level, this
tab is useless because it doesn't display the data. When you
are working with templates, it is better to use two windows to
see in real time by refreshing (the F5 key) the changes directly
against the host that inherits the graphs from the template.
All the options previously described are really useful to customize your graphs as
you have understood that graphs are really customizable and flexible elements.
You can display only three trigger lines, and if the graph is
less than 120 pixels, triggers are not displayed; so, take care to
properly set up your graphs and check all the changes.
Visualizing the data through maps
Zabbix provides a powerful element to visualize data and a topological view in
Zabbix, which will help you to create maps. Maps are a graphical representation
of your physical infrastructure, where you can display your server, network
components, and the interconnection between them.
The great thing is that maps on Zabbix are completely dynamic, which means that
you will see your active warnings, issues, and triggers represented on the map, with
different icons, colors, and labels. This is a powerful representation of your data
center or of the service that you're representing. The elements that you can put in a
map are as follows:
• Host
• Host groups
• Triggers
• Images
• Maps
[ 195 ]
Visualizing Data
All those elements are dynamically updated by triggers or using macros, thus
providing a complete status of the maps and their elements.
To enable a user to create, configure, or customize maps, the user
needs to be of the Zabbix administrator type. This means that there
isn't a role dedicated to map creation. Also, the user needs to have
a read/write permission on all the hosts that he needs to put into
a map. This means that there isn't a way to restrict the privileges
to map creation only, but you can limit the administration to a
certain number of hosts included in a group.
An example of a map that you can easily produce with Zabbix is shown in the
following screenshot:
[ 196 ]
Chapter 5
In the preceding screenshot, you can see that there are a lot of graphical
combinations of icons, round backgrounds, and information. To better understand
what this map represents, it is important to see how Zabbix treats hosts and triggers
in a map. In the following screenshot, you can see all the possible combinations of
trigger severity and status change:
The preceding screenshot illustrates, from left to right, the following:
• A host that doesn't have a trigger on fire
• A host with the trigger severity that is shown as Not classified in the alarm
• A host with the trigger severity Information in the alarm
• A host with the trigger severity Warning in the alarm
• A host with the trigger severity Average in the alarm
• A host with the trigger severity High in the alarm
• A host with the trigger severity Disaster in the alarm
The trigger line follows the same classification.
The trigger severity is expressed with the background
color and not with the name that you see under the HOST
label. The label in red color is the name of the trigger.
In the preceding screenshot, triggers are callers, just
as their classification says, to simply make the picture
more verbose. Please notice that in the case of TRIGGER
representation, right after the TRIGGER label is displayed,
the trigger status is displayed and not the trigger name that
is on fire, as in the case of HOST.
[ 197 ]
Visualizing Data
Now if a trigger changed recently, its status will be displayed as shown in the
following diagram:
Now if a host has issues and a trigger is on fire, this will be represented with the
following icons:
Please note that, in this case, the icon is shown with arrows because it just changed
the status. The following screenshot shows that there are six problems:
As you can see, there are different triggers with problems. The one that has the most
critical severity is the one that gives the color to the circle around the icon. Once all
the triggers are acknowledged, the icon will show a green circle around it, as shown
in the following screenshot:
[ 198 ]
Chapter 5
The second icon displays details of all the problems that your host is facing and the
number of unacknowledged ones, so you have an immediate status of how many
issues are under control and how many are new.
The third icon with the square background is a host that has been disabled,
represented in gray; it will be in red once it becomes unreachable.
Creating your first Zabbix map
Map configuration can be easily reached by navigating to Configuration |
Maps | Create map. The resulting window that you will see is shown in the
following screenshot:
[ 199 ]
Visualizing Data
Most of the properties are quite intuitive; the Name field needs to be a unique name,
and Width and Height are expressed in pixels.
If you define a large size, and the second time, you want
to reduce it, it is possible that some of your hosts will
fall outside the map and are no more visible. Don't be
scared; nothing is lost. They are still inside the map, only
not displayed. You can restore them to their original size,
and they will appear again.
Now we will take a look at all the other parameters:
• Background image: In the background image field, you can define your
map's background, choosing between loaded backgrounds.
Zabbix, by default, doesn't have any backgrounds defined. To add
your own background, you need to go to go to Administration
| General, and select Images from the listbox. Please check to
add your image as Background and not Icon. A good source for
royalty-free maps is www.openstreetmap.org.
• Automatic icon mapping: This flag enables user-defined icon mapping
for a certain host inventory field. This can be defined by navigating to
Administration | General | Icon mapping.
• Icon highlight: This is the flag responsible for generating the round
background around the icon with the same color as that of the most critical
severity trigger.
• Mark elements on trigger status change: This flag is responsible for
highlighting a trigger status change (with the red triangle shown earlier in
the screenshot displaying the status change).
Markers are displayed only for 30 minutes, after which they
will be removed, and the changed trigger status will become
the new normal status.
• Advanced labels: This check enables you to customize the label's type for all
the elements that you can put in a map. So, for each one of those items—host,
host group, trigger, map, and image—you can customize the label type. The
possible label types are as follows:
°°
Label: This is the icon label
°°
IP Address: This is the IP address (available only on the host)
[ 200 ]
Chapter 5
°°
Element name: This is the element name, such as hostname
°°
Status only: This is only for the status, so it will be OK/PROBLEM
°°
Nothing: This means that there is no label at all
°°
Custom label: A free test area (macros are allowed)
• Icon label location: This field defines where you will see all the labels by
default. This can be selected among the following values: Bottom, Left,
Right, and Top.
• Problem display: This listbox permits you to choose between the following:
°°
All: A complete problem count will be displayed
°°
Separated: This displays the unacknowledged problem count
separated as a number of the total problem count
°°
Unacknowledged only: With this selected, only the unacknowledged
problem count will be displayed
• URLs: Here, a URL for each kind of element can be used with a label.
This label is a link, and here you can use macros, for example, {MAP.ID},
{HOSTGROUP.ID}, {HOST.ID}, and {TRIGGER.ID}.
Starting with Zabbix 2.2, a new feature has been introduced. The map configuration
feature provides you with the option of defining the lowest trigger severity.
With this configuration, only the triggers at the defined level or more will still be
displayed in the map; this will reduce the number of triggers displayed, and all the
triggers with a severity below the defined one will not be displayed. This section is
highlighted in the previous screenshot within a green rectangle.
The level that you have selected within the map configuration can be overwritten
when viewing maps in Monitoring | Maps by selecting the desired Minimum
severity, as shown in the following screenshot:
Important considerations about macros
and URLs
The URL section is powerful, but here an example is needed because the usage is not
intuitive and simple.
[ 201 ]
Visualizing Data
Now, if you see a trigger on fire or an alarm that is escalating, most probably the
next action that you will take is to check the latest data of your host or jump to a
screen that will group the graphs, triggers, and data that you need to check to have
an idea of what is happening and do a first-level analysis. In a practical case of
first-level support, once a server is highlighted and shows triggers with problems,
it can be useful to have a link that will go straight ahead to the latest data of that
host and also the screen. To automate this and reduce the number of clicks, you
can simply copy the link of the desired page; for instance, the link to the latest data
would be something similar to http://<YOUR-ZABBIX-SERVER>/zabbix/latest.
php?sid=eec82e6bdf51145f&form_refresh=1&groupid=2&hostid=10095.
Now, looking into the URL to automate the jump to the latest data, you need to
replace the variant part of the URL with the macros wherever available.
The sid value in the URL represents the session ID; it is passed to avoid the
one-click attack, also known as session riding. This field can be removed. The
groupid value in the specific latest data example can be omitted, so the URL can
be reduced to http://<YOUR-ZABBIX-SERVER>/zabbix/latest.php?form_
refresh=1&hostid=10095.
Now, the link is easy to generate. You can simply replace the hostid value with the
macro {HOST.ID} as http://<YOUR-ZABBIX-SERVER>/zabbix/latest.php?form_
refresh=1&hostid={HOST.ID}.
And configure the URL as shown in the following screenshot:
In the preceding screenshot, you can see that there is a link configured to General
Screen that collects the most important graphs. The http://<ZABBIX-SERVER>/
zabbix/screens.php?sid=eec82e6bdf51145f&form_refresh=1&fullscreen=0&
elementid=17&groupid=2&hostid=10094&period=3600&stime=20140807161304
URL is generated from the screen page of a particular host.
This time again, you can omit the sid value in the preceding URL since it specifies a
period. If this parameter is absent, you will be taken to a screen that displays the last
hour of data. You can also remove the stime, groupid, and elementid values. The
reduced URL will be http://<ZABBIX-SERVER>/zabbix/screens.php?form_refre
sh=1&fullscreen=0&hostid=10094& groupid=2.
[ 202 ]
Chapter 5
Now, to make it dynamic, you need to replace the values of hostid and groupid
with the macros, such as http://<ZABBIX-SERVER>/zabbix/screens.php?form_re
fresh=1&fullscreen=0&hostid={HOST.ID}&groupid={HOSTGROUP.ID}.
The result of this customization is shown in the following screenshot:
As you can see, by clicking on the host that has issues you have two new shortcuts
other than Latest Data and General Screen, with a link that is dynamically created
for each host.
This kind of behavior allows you to create a master-detail view. In this case, the
master is your map, and the detail can be, for instance, the screen or the latest data
window. You can create custom menus that can run a script or bring you directly to
the trigger status or the Host screens.
Here, you can add more scripts to run against the host. To
add another script (and see it in the Scripts section), you need
to go to Administration | Scripts. This will take you to the
script's administration panel.
[ 203 ]
Visualizing Data
Finally, inside the map
Once you have completed this setup, you can begin the nice part of the configuration.
Once inside the map, the options that you will find is quite simple and user friendly,
as shown in the following screenshot:
In the map, you can add an element by clicking on the + sign and remove it
by clicking on the - sign. The element will appear in the upper-left corner of
the map. By clicking on that icon, a configuration panel will appear, as shown
in the following screenshot:
[ 204 ]
Chapter 5
The element type, by default, is Icon. In the preceding screenshot, it is marked as
Host, but it can be any one of the following:
• Host: This icon will represent the status of all the triggers of the selected host
• Map: This icon will represent the status of all the elements of the map
• Trigger: This icon will represent the status of the single trigger selected
• Host group: This icon will represent the status of all the triggers of all the
hosts that belong to the selected group
• Image: This icon will just be an image not linked to any source (trigger host
and so on)
The Label section is another strong point of the element. Here, you can freely write
normal text or use macros.
The next field may vary depending on what you choose as the element type and can
be one of the following:
• Host: This selects the host
• Map: This selects the map
• Trigger: This selects the trigger
• Host group: This selects the host group
• Icon (default): This selects the icon to be used
With Host group, you can group all your hosts as per
the location, for example, city, nations, or continents. This
will group all the trigger statuses per location in a nice
representation. You can also add a custom URL.
Hosts and triggers have already been covered and are quite intuitive to understand.
Probably, it is not immediately understood why we should insert a map inside a
map. An efficient use of this scenario is that you can produce a nice drilldown with
a general map view that gathers together all the submaps detailed per location or
nation. This helps you to produce a drilldown until the final destination; for instance,
try to think about a drilldown that comes from nations, down to the city, and deep
into the data center, ending on the rack where your server is contained.
The Icon element inside a map is an image that can have a URL associated with.
Their function is to add a graphic element to your map that contains the URL, and
have the shortcuts directly on your own map.
[ 205 ]
Visualizing Data
Right after that, there is the Icons section. Here, if you checked the Automatic icon
selection checkbox, icon mapping (defined in the map configuration) would be used
to choose the icons to be used.
Defining an icon mapping in the map configuration will save
you a lot of clicks. Also, it is a repetitive task. So, for instance,
you can define your standard icons for the hosts, and they will
then be used here.
If you haven't defined an icon mapping or if you want to use an item different from
the previous choice, you can specify the icons that will be used in those cases, which
can be one of the following:
• Default
• Problem
• Maintenance
• Disable
The Coordinates section expresses the exact location of the element in pixels and, as
the previous item, you can configure a dedicated URL for this kind of host too.
Imagine that you have produced different kinds of screens (the screens will be
discussed later in this chapter): one that collects all the metric graphs and triggers
used to monitor an application server and another one with all the metrics needed
to monitor the status of your database. Well, here, if your host is a DBMS, you can
create a URL to jump directly to the RDBMS screen. If it is an application server, you
can create a custom URL that will take you directly to the application server screens,
and so on.
As you can see, this is an interesting feature and will make your map useful to your
support team.
Selecting elements
In the map configuration, you can select multiple elements by selecting the first
one, and then, keeping the Ctrl (or Shift) key pressed, selecting the other elements.
For a multiple selection, you can drag a rectangle area, which will then select all the
elements in the drawn rectangle.
[ 206 ]
Chapter 5
Once you have selected more than one element, the element form switches to the
Mass update elements window, as shown in the following screenshot:
Here, you can update the icons, labels, and label locations for all the selected
hosts in bulk.
To have an efficient update of all the labels, it is strongly advised that you
use macros.
Now, it's time to inter link your servers in exactly the way that they are physically
connected. To create a link between two hosts, you only need to select
the hosts that need to be linked together and click on the + symbol in the Link
section of the map.
[ 207 ]
Visualizing Data
The links section will appear right below the Mass update elements form, as shown
in the following screenshot:
You can customize your link with labels and also change the representation type and
color. You can choose between Line, Bold line, Dot, and Dashed line.
An option to keep in mind here is the possibility of connecting the link indicator to a
trigger, so basically, the link will change its color once a trigger is on fire.
Here, you can connect the link to multiple triggers and
associate a different color to each one of them so that you
can understand which trigger is changing your link.
Playing with macros inside maps
Previously, we discussed the Label section where you can customize the label in
your graphs. Here, I think an example can clarify a lot the power of this section and
how this can improve and introduce benefits in your maps. As an example, you
can play with macros inside the map. Now, you have certain requirements for this,
such as you need to show the hostname, IP address, the status of triggers events (the
number of acknowledged events and the number of unacknowledged ones), and the
network traffic of your network interfaces, directly in the map.
[ 208 ]
Chapter 5
This seems challenging work and, in fact it, is, but if you have a bit of knowledge
about macros, this becomes an easy task. The request can be satisfied with the
following code:
{HOSTNAME}
{HOST.CONN}
trigger events ack: {TRIGGER.EVENTS.ACK}
trigger events unack: {TRIGGER.EVENTS.UNACK}
Incoming traffic: {{HOSTNAME}:net.if.in[eth0].last(0)}
Outgoing traffic: {{HOSTNAME}:net.if.out[eth0].last(0)}
The first macro, {HOSTNAME}, will display the hostname of your selected host. The
second macro, {HOST.CONN}, will display the IP address. The information about
the triggers events, whether acknowledged or unacknowledged, is expressed in the
next two lines using the macros {TRIGGERS.EVENTS.ACK} and {TRIGGER.EVENTS.
UNACK}. The last two lines are more interesting because they are a composition of
two nested macros.
In particular, to display the incoming traffic of your first network interface, you
can ask Zabbix to retrieve the last value of the net.if.in[eth0] item. This kind of
expression needs the hostname to be evaluated, so you need to write your hostname,
that is, HOST-A (in this example) or use macros.
The last piece of information that Zabbix needs to produce as the requested output
is the hostname. As mentioned earlier, this can be replaced with the {HOSTNAME}
macro. So, the complete expression will be as follows:
Incoming traffic: {{HOSTNAME}:net.if.in[eth0].last(0)}
Obviously, for outgoing traffic, the expression is more or less the same, except that
you need to retrieve the net.if.out[eth0] item of the network card. The result is
shown in the following image:
[ 209 ]
Visualizing Data
Use {HOSTNAME} or {HOST.NAME} in all the labels and all
the places where it is possible, so it will make things easy in
the event of a mass update.
This is a comprehensive and charming output, wherein, without any clicks, you have
your needed information directly in your map. In this example, you used the last()
value of your item, but the other functions are also supported here such as last(),
min(), max(), and avg().
Macros can be used in the same manner on links; an example is shown in the
following screenshot:
In the preceding screenshot, the traffic data on the link is generated using the same
method that was previously explained. All those macro usages make your maps a lot
more dynamic and appealing.
Visualizing through screens
In the previous section, we discussed adding custom URLs and introduced shortcuts
to a screen section. Now it's time to go deep into screens. Screens are easy to generate
and very intuitive to handle. Basically, a screen is a page that can display multiple
Zabbix elements, such as graphs, maps, and text. One of the main differences
between screens and maps is that in maps, you can place a lot of elements, but you
can't, for instance, add a graph or the trigger status. They have two different targets.
The screen can group all the elements that are common into a particular kind of
server to have a complete picture of the situation.
Creating a screen
To create a screen, you need to navigate to Configuration | Screen | Create. A form
will appear, asking for the screen name and the initial size in terms of columns and
rows. After this step, you need to come back inside the screen that you just created.
[ 210 ]
Chapter 5
In this part of the configuration, you will probably notice that there isn't a Save
button. This is because screens are saved automatically every time that you complete
an action, such as adding a graph. The screen appears similar to a table (basically, it
is a table), as shown in the following screenshot:
Now, if you need more rows or columns, you only need to click on the + sign where
you want to add fields as rows or as columns.
On a screen, you can add the following kinds of elements:
• Action log: This displays the history of recent actions
• Clock: This displays a digital or analog clock with the current server time
or local time
• Data overview: This displays the latest data for a group of hosts
• Graph: This displays whether the graphs are single or custom
• History of events: This displays n lines (you can specify how many) of the
latest events
• Host group issues: This displays the status of triggers filtered by hostgroup
• Host issues: This displays the status of triggers filtered by the host
• Hosts info: This displays high-level, host-related information
• Map: This displays a single map
• Plain text: This shows plain text data
• Screen: This displays another screen (one screen may contain other screens
inside it)
• Server info: This displays the high-level server information
• Simple graph: This displays a single, simple graph
• Simple graph prototype: This displays a simple graph based on the item
generated by low-level discovery
• System status: This displays the system status (it is close to Dashboard)
• Triggers info: This displays the high-level trigger-related information
• Triggers overview: This displays the status of triggers for a selected host group
• URL: Here, you can include content from an external source
[ 211 ]
Visualizing Data
All those sources have two common configuration parameters—the column span and
the row span. With the column span, you can extend a cell to a certain number of
columns. With the row span, you can extend a cell for a certain number of rows. For
instance, in a table of two columns, if you indicate a column span of two, the cell will
be centered in the table and will be widened with exactly two fields. This is useful to
add a header to your screen.
Once you have inserted and configured your elements on the screen, you can move
them using drag and drop, and all your settings will be preserved.
You can freely drag and drop your configured elements; they
will not lose their settings.
Most of the elements are not dynamic, which means that they will not be
dynamically applied to all your hosts in a group.
Dynamic elements
Zabbix provides dynamic elements that are really useful:
•
•
•
•
•
•
Graphs
Graph prototype
Simple graphs
Simple graph prototype
URL
Plain text
The dynamic item Graph prototypes are based on custom graph prototypes created
in low-level discovery (LLD) rules. Practically the Simple graph prototype is based
on item prototypes in low-level discovery. While monitoring, the screen cell will
display a graph created from an LLD-generated item. Please note that if the item is
not generated, nothing will be displayed.
Also, starting with Zabbix 2.4, the URLs are now dynamic items. To properly
support this new functionality, now we can use several macros in the URL field:
{HOST.CONN}, {HOST.DNS}, {HOST.ID}, {HOST.IP}, {HOST.HOST}, {HOST.NAME},
and {$MACRO} user macro. These macros are quite useful, and we can do a lot with
them, generating dynamic URLs to retrieve data from an external source.
To properly see the dynamic URL elements displayed in
Monitoring | Screens, you need to select a host. Without a
selected host, you can only see the message No host selected.
[ 212 ]
Chapter 5
Dynamic items can be identified by checking the following option:
Now, for instance, you can add a map in your screen and some dynamic elements,
such as graphs. When you add a dynamic element at the top of the screen, you
will have a bar with some listboxes that will help you to change the target of your
dynamic elements, as shown in the following screenshot:
An example of a screen that mixes dynamic elements and standard elements is
shown in the following screenshot:
[ 213 ]
Visualizing Data
Obviously, when you choose and host this, it will affect only the dynamic graphs.
You can switch between your two hosts and change the x axis. This will update
all the dynamic elements on the same time base, making it easy to relate elements
between them.
Pie graphs and exploded pie graphs will display only the
average value for your chosen period. To relate different groups
of metrics between them, it is better to use a custom graph.
Visualizing the date through a slide show
Once you have created all your screens, you can provide a slide show to your
helpdesk that implements a screen rotation.
Creating a slide show is easy; go to Configuration | Slide shows | Create slide
show. A window, as shown in the following screenshot, will appear:
You can see the slide show configuration in the preceding screenshot. This
configuration screen is really intuitive; Name identifies the name of your slide show,
and in Default delay (in seconds), you need to specify the default delay that will be
applied to all the screens in the slide show.
In the Slides section—enumerated in the preceding screenshot to have a
visualization order—you can specify a different delay for each one of them. Basically,
you can customize how long each screen will be displayed. Once saved, your slide
show will be available to be displayed upon navigating to Monitoring | Screens,
and then you can choose in the Slide shows drop-down menu on the right-hand
side after your slide show name.
[ 214 ]
Chapter 5
In the slide show, you can only create a screen rotation. So,
to add a single element, such as a graph or a map, on your
rotation, you need to create a screen that contains your
elements to be displayed. Using this method, you can basically
add all that can be represented on a screen on the slide show.
If you want to speed up or slow down your slide show, you can change the refresh
multiplier that will appear by clicking on the Menu icon (on the right-hand side of
the listbox), which will return a window, as shown in the following screenshot:
Controlling center slides and the big
display challenge
Displaying data on a big display is something challenging; first of all, you need to
know who your target will be, their skills, and which role they exactly cover. After
that, it is important to see where the screen is physically and its resolution.
You will most probably need to create an ad hoc screen for a big display to fit better
on a widescreen. Screens for widescreen need to be developed horizontally. Most of
the screens are usually developed with a web page in mind, so most probably they
need to be scrolled down and up to read all the graphs. Such kinds of screens will
not fit on your widescreen.
You need to bear in mind that the slide show doesn't scroll up and down
automatically. You can add JavaScript to make it possible, but it is really complex to
implement a screen that will rightly handle this scrolling up and down, and all this
effort can be hardly justified. It is better and more productive to produce screens
such that slide shows fit in the screen dimensions and resolution.
[ 215 ]
Visualizing Data
Considerations about slides on a big display
Once you have understood who your target is, their knowledge, and the typology
of the work they do, you are already in a stable position. Now you can apply best
practices that are generally useful when you need to show data on a big display.
Basically, they need to be one of the following:
• Easy to read (comprehensible)
• Fit the big screen display
• Non-interactive
• Delay between the screens should be chosen as appropriate
First of all, keep things easy. This is a general rule: the easier the representations, the
less the effort required by the helpdesk to read them. An easy and comprehensive
screen will improve the helpdesk's reaction, which is our goal. You need to provide
information in the best way. Never overload your screen with information; you need
to choose the right amount of information to be displayed, and the fonts need to be
comprehensive. Essentially, you need to choose which cut will have every screen,
and the challenge is to choose how to display your monitored services.
If you need to monitor a large number of services, you need to choose the time to
change the slide; don't spend too much time on the same screen. Keeping a screen for
too much time on the monitor can become annoying, especially when the helpdesk is
waiting to see the next slide. Unfortunately, there isn't a rule; you need to spend time
with the first-level support and check with them as to what is the perfect timing.
One thing that simplifies the work is that you don't need to think about complex
screens. A widescreen display doesn't need the drill-down feature implemented.
People will just look at the screen, and the analysis will be done from their workstation.
Triggers are always welcome as they are easy to read, comprehensive, and
immediate. But take care not to fill a page with them as it will then be unreadable.
Automated slide show
Once your slides are created and you are ready to run them, it is time to think about
the user. Your widescreen and the relative workstation dedicated to this task need to
have an account for sure.
In a real-world scenario, we do not want to see the login page on a big display. To
avoid this, it is better to create a dedicated account with some customization.
[ 216 ]
Chapter 5
The requirements are as follows:
• Avoid automatic disconnection
• Avoid the clicks needed to display the slide show
Both these features will be appreciated by your helpdesk.
To avoid automatic disconnection, there is a flag on the user configuration form that
is designed just for that—the Auto-login flag. Once selected, you need to log in only
the first time.
The Auto-login flag will work only if your browser supports
cookies; please ensure that plugins, antiviruses, and so on are
not blocked.
Now since you have created a dedicated account, you need to customize the URL
(after logging in) section; here, you need to link the URL to your screen.
To retrieve the appropriate URL, browse to your slide show and copy your link. For
this example, the link would be http://<your-zabbix-server> /zabbix/slides.
php?sid=4258s278fa96eb&form_refresh=1&fullscreen=0&elementid=3.
Basically, you need to know the elementid value of your slide show. In the
following URL, you can remove the sid parameter. The definitive URL in our case
will be http://<your-zabbix-server> /zabbix/slides.php? form_refresh=1&
fullscreen=0&elementid=3.
To jump directly to the full-screen mode, change the
fullscreen=0 parameter to fullscreen=1. This will
further reduce human interaction.
Now this account has a first page. After login, the slide show starts in the fullscreen
mode with really little human interaction.
To properly present an automated slide show, it is very useful
to run the browser in the fullscreen mode by pressing F11.
[ 217 ]
Visualizing Data
IT services
The last graphical element that will be discussed in this chapter is a high-level view
of our monitored infrastructure. In a business-level view, there is no provision for
low-level details, such as CPU usage, memory consumption, and free space. What
the business would like to see is the availability of your services provided and the
service-level agreements of your IT services.
Zabbix covers this point with IT services. A service is a hierarchical view of your
service. Now imagine that you need to monitor your website (we discussed SLAs
in Chapter 1, Deploying Zabbix). You need to identify your service components, for
example, web server, application server, and DB server. For each one of them, you
need to identify triggers that tell you whether the service is available or not. The
hierarchical view is the one represented in the following screenshot:
In this hierarchy, each node has a status; this status is calculated on the basis of
triggers and propagated to the higher level with the selected algorithm. So, the
lowest level of IT services is managed via triggers.
Triggers are the core of IT service calculations; so, as you can
imagine, they are of particular importance and really critical.
You need to find out which your effective items are, to check
for this trigger generation.
Triggers with the severities Information and Not classified are not considered
and don't affect the SLA calculation.
[ 218 ]
Chapter 5
Configuring an IT service
The way to configure an IT service is by navigating to Configuration | IT services;
you can create your service here. The following screenshot displays a service
previously configured:
By clicking on a service, you can add a service, edit the current service, or delete
it. The service configuration is composed of three forms: the first one describes the
service, the second tab is dedicated to the dependencies, and the third is dedicated to
the time.
On the service tab, you need to define your own service name. In this particular
example, the website SLA is calculated; of course, a website is composed of different
components, such as the web server, application server, and a DBMS. In a threelevel environment, they are usually on a dedicated server. Now, since all the three
components are vital for our merchant website, we need to calculate the SLA
propagating the problems. This means that if the child of our website has a problem,
the whole website has a problem, and this will reflect in the SLA calculation.
Zabbix provides the following three options in the status calculation algorithm:
• Do not calculate: This option ignores the status calculation completely.
• Problem, if at least one child has a problem: This means that if each
one of our three components has an issue, the service will be considered
unavailable. This is the case when each one of the servers doesn't have a
failover node.
• Problem, if all the children has a problem: To propagate the problem, all
the children need to be affected by the problem. This case is typical for a
clustered or load-balanced service, where there are many nodes to provide
a service, and all the nodes need to be down to propagate the issue to the
parent node.
Once you define the algorithm, you need to define the SLA percentage of your
service. This is used to display the SLA issue with different colors in the report.
[ 219 ]
Visualizing Data
The next step is the trigger definition that will enable Zabbix to know when your
service has an issue. Since Zabbix provides a hierarchical view, you can have a
service composed of many components, so the intermediate level can avoid a trigger
definition that is needed on the lowest level.
The last option is Sort order (0->999). This, of course, doesn't affect the SLA
calculation but is only for cosmetic purposes. To visualize a report, for instance, your
three levels are sorted in a logical order as the web server, application server, and
database server. All that is previously discussed is shown in the following screenshot:
The following screenshot shows the dependencies; here, you don't need to define
each one of them because they are defined automatically once you design your
hierarchical view. Now, it is possible that one of your services is already defined for
a reason in another layer of the service. If this is the case, you only need to mark the
service as soft linked by checking the Soft checkbox:
If a service has only soft-linked dependencies, it can be deleted.
In this case, you don't need to delete all the child services first;
this can be used to quickly delete the whole service.
[ 220 ]
Chapter 5
The last tab is used to set the service time. By default, Zabbix considers that a
service needs to be available 24 hours a day, for 7 days of the week, and the whole
year (24x7x365). Fortunately, for system administrators, not all the services have
this requirement. If this is true of you, you can define your Uptime and Downtime
periods, as shown in the following screenshot:
The periods defined here are basically Uptime and Downtime
windows. A problem that occurs during a Downtime window
will not affect the SLA calculation. Here, it is possible to also
add a one-time downtime, which is useful to define an agreed
maintenance without an impact on the SLA.
Once you have completed the hierarchical definition of your service, the result is
available by navigating to Monitoring | IT services.
Summary
In this chapter, we covered all the graphical elements that Zabbix provides and
showed you how to use them in an efficient way. This chapter also enabled you
to deliver efficient slide shows to your helpdesk, making you aware of the best
practices in this difficult task. Now, you probably understood that this part of
the Zabbix setup will require time to be well implemented. Also, it is easier to
understand for a non-technical audience, and the information provided with the
graphical elements has a big impact on your audience. This forces you to be precise
and take a lot of care in this task, but this will be paid back to you by providing a lot
of powerful elements to use and adding more strength to your argument. All those
graphical elements are fundamentals if you need to argue with the business or the
purchase manager to expand the business or buy hardware.
In the next chapter, you will see how to manage complex triggers and trigger
conditions. The next chapter will also make you aware of the right amount of
triggers and alarms that you should implement so as not to be overloaded by alarms,
with the consequence of losing the critical ones.
[ 221 ]
Managing Alerts
Checking conditions and alarms is the most characteristic function of any monitoring
system, and Zabbix is no exception. What really sets Zabbix apart is that every alarm
condition or trigger (as it is known in this system) can be tied not only to a single
measurement, but also to an arbitrary complex calculation based on all of the data
available to the Zabbix server. Furthermore, just as triggers are independent from
items, the actions that the server can take based on the trigger status are independent
from the individual trigger, as you will see in the subsequent sections.
In this chapter, you will learn the following things about triggers and actions:
• Creating complex, intelligent triggers
• Minimizing the possibility of false positives
• Setting up Zabbix to take automatic actions based on the trigger status
• Relying on escalating actions
An efficient, correct, and comprehensive alerting configuration is a key to the success
of a monitoring system. It's based on extensive data collection, as discussed in
Chapter 4, Collecting Data, and eventually leads to managing messages, recipients,
and delivery media, as we'll see later in the chapter. But all this revolves around the
conditions defined for the checks, and this is the main business of triggers.
[ 223 ]
Managing Alerts
Understanding trigger expressions
Triggers are quite simple to create and configure—choose a name and a severity,
define a simple expression using the expression form, and you are done. The
expression form, accessible through the Add button, lets you choose an item, a
function to perform on the item's data, and some additional parameters and gives an
output as shown in the following screenshot:
You can see how there's a complete item key specification, not just the name, to
which a function is applied. The result is then compared to a constant using a
greater than operator. The syntax for referencing item keys is very similar to that for
a calculated item. In addition to this basic way of referring to item values, triggers
also add a comparison operator that wraps all the calculations up to a Boolean
expression. This is the one great unifier of all triggers; no matter how complex the
expression, it must always return either a True value or a False value. This value
is, of course, directly related to the state of a trigger, which can only be OK if the
expression evaluates to False, or PROBLEM if the expression evaluates to True. There
are no intermediate or soft states for triggers.
A trigger can also be in an UNKNOWN state if it's impossible to
evaluate the trigger expression (because one of the items has
no data, for example).
A trigger expression has two main components:
• Functions applied to the item data
• Arithmetical and logical operations performed on the functions' results
[ 224 ]
Chapter 6
From a syntactical point of view, the item and function component has to be enclosed
in curly brackets, as illustrated in the preceding screenshot, while the arithmetical
and logical operators stay outside the brackets:
Selecting items and functions
You can reference as many items as you want in a trigger expression as long as
you apply a single function to every single item. This means that, if you want to
use the same item twice, you'll need to specify it twice completely, as shown in the
following code:
{Alpha:log[/tmp/operations.log,,,10,skip].nodata(600)}=1 or
{Alpha:log[/tmp/operations.log,,,10,skip].str(error)}=1
The previously discussed trigger will evaluate to PROBLEM if there are no new lines in
the operations.log file for more than 10 minutes or if an error string is found in the
lines appended to that same file.
Zabbix doesn't apply short-circuit evaluation of the and and or
(previously, until Zabbix 2.4, they were expressed with & and |)
operators; every comparison will be evaluated regardless of the
outcome of the preceding ones.
Of course, you don't have to reference items from the same host; you can reference
different items from different hosts and on different proxies too (if you can access
them), as shown in the following code:
{Proxy1:Alpha:agent.ping.last(0)}=0 and
{Proxy2:Beta:agent.ping.last(0)}=0
Here, the trigger will evaluate to PROBLEM if both the hosts Alpha and Beta are
unreachable. It doesn't matter that the two hosts are monitored by two different
proxies. Everything will work as expected as long as the proxy where the trigger is
defined has access to the two monitored hosts' historical data. You can apply all the
same functions available for calculated items to your items' data. The complete list
and specification are available on the official Zabbix wiki (https://www.zabbix.
com/documentation/2.4/manual/appendix/triggers/functions), so it would
be redundant to repeat them here, but a few common aspects among them deserve a
closer look.
[ 225 ]
Managing Alerts
Choosing between seconds and a number of
measurements
Many trigger functions take a sec or #num argument. This means that you can
either specify a time period in seconds or a number of measurements, and the
trigger will take all of the item's data in the said period and apply the function to it.
So, the following code will take the minimum value of Alpha's CPU idle time in the
last 10 minutes:
{Alpha:system.cpu.util[,idle].min(600)}
The following code, unlike the previous one, will perform the same operation on the
last ten measurements:
{Alpha:system.cpu.util[,idle].min(#10)}
Instead of a value in seconds, you can also specify shortcuts
such as 10m for 10 minutes, 2d for 2 days, and 6h for 6 hours.
Which one should you use in your triggers? While it obviously depends on your
specific needs and objectives, each one has its strengths that make it useful in the
right context. For all kinds of passive checks initiated by the server, you'll often want
to stick to a time period expressed as an absolute value. A #5 parameter will vary
quite dramatically as a time period if you vary the check interval of the relative item.
It's not usually obvious that such a change will also affect related triggers. Moreover,
a time period expressed in seconds may be closer to what you really mean to check
and thus may be easier to understand when you'll visit the trigger definition at a
later date. On the other hand, you'll often want to opt for the #num version of the
parameter for many active checks, where there's no guarantee that you will have a
constant, reliable interval between measurements. This is especially true for trapper
items of any kind and for log files. With these kinds of items, referencing the number
of measurements is often the best option.
[ 226 ]
Chapter 6
The date and time functions
All the functions that return a time value, whether it's the current date, the current
time, the day of the month, or the day of the week, still need a valid item as part of
the expression. These can be useful to create triggers that may change their status
only during certain times of the day or during certain specific days or, better yet,
to define well-known exceptions to common triggers when we know that some
otherwise unusual behavior is to be expected, for example, a case where there's a bug
in one of your company's applications that causes a rogue process to quickly fill up
a filesystem with huge log files. While the development team is working on it, they
ask you to keep an eye on the said filesystem and kill the process if it's filling the
disk up too quickly. As with many things in Zabbix, there's more than one way to
approach this problem, but you decide to keep it simple and find that, after watching
the trending data on the host's disk usage, a good indicator that the process is going
rogue is that the filesystem has grown by more than 3 percent in 10 minutes:
{Alpha:vfs.fs.size[/var,pused].delta(600)}>3
The only problem with this expression is that there's a completely unrelated process
that makes a couple of big file transfers to this same filesystem every night at 2 a.m.
While this is a perfectly normal operation, it could still make the trigger switch to a
PROBLEM state and send an alert. Adding a couple of time functions will take care of
that, as shown in the following code:
{Alpha:vfs.fs.size[/var,pused].delta(600)}>3 and
({Alpha:vfs.fs.size[/var,pused].time(0)}<020000 or
{Alpha:vfs.fs.size[/var,pused].time(0)}>030000 )
Just keep in mind that all the trigger functions return a numerical value, including
the date and time ones, so it's not really practical to express fancy dates, such as the
first Tuesday of the month or last month (instead of the last 30 days).
[ 227 ]
Managing Alerts
Trigger severity
Severity is little more than a simple label that you attach to a trigger. The web
frontend will display different severity values with different colors, and you will
be able to create different actions based on them, but they have no further meaning
or function in the system. This means that the severity of a trigger will not change
over time based on how long that trigger has been in a PROBLEM state, nor can you
assign a different severity to different thresholds in the same trigger. If you really
need a warning alert when a disk is over 90 percent full and a critical alert when it's
100 percent full, you will need to create two different triggers with two different
thresholds and severities. This may not be the best course of action though, as it
could lead to warnings that are ignored and not acted upon, critical warnings that
will fire up when it's already too late and you have already lost service availability,
just a redundant configuration with redundant messages and more possibilities of
mistakes, or an increased signal-to-noise ratio.
A better approach would be to clearly assess the actual severity of the potential for
the disk to fill up and create just one trigger with a sensible threshold and, possibly,
an escalating action if you fear that the warning could get lost among the others.
Choosing between absolute values and
percentages
If you look at many native agent items, you'll see that a lot of them can express
measurements either as absolute values or as percentages. It often makes sense to
do this while creating one's own custom items as both representations can be quite
useful in and of themselves. When it comes to creating triggers on them, though, the
two can differ quite a lot, especially if you have the task of keeping track of available
disk space.
Filesystem sizes and disk usage patterns vary quite a lot between different servers,
installations, application implementations, and user engagements. While a free space
of 5 percent of a hypothetical disk A could be small enough that it would make sense
to trigger a warning and act upon it, the same 5 percent could mean a lot more space
for a large disk array, enough for you to not really need to act immediately but plan a
possible expansion without any urgency. This may lead you to think that percentages
are not really useful in these cases and even that you can't really put disk-spacerelated triggers in templates as it would be better to evaluate every single case and
build triggers that are tailor-made for every particular disk with its particular usage
pattern. While this can certainly be a sensible course of action for particularly sensible
and critical filesystems, it can quickly become too much work in a large environment
where you may need to monitor hundreds of different filesystems.
[ 228 ]
Chapter 6
This is where the delta function can help you create triggers that are general enough
that you can apply them to a wide variety of filesystems so that you can still get
a sensible warning about each one of them. You will still need to create more
specialized triggers for those special, critical disks, but you'd have to anyway.
While it's true that the same percentages may mean quite a different thing for disks
with a great difference in size, a similar percentage variation of available space on a
different disk could mean quite the same thing: the disk is filling up at a rate that can
soon become a problem:
{Template_fs:vfs.fs.size[/,pfree].last(0)}<5 and
({Template_fs:vfs.fs.size[/,pfree].delta(1d)} or
{Template_fs:vfs.fs.size[/,pfree].last(0,1d) } > 0.5)
The previously discussed trigger would report a PROBLEM state not just if the
available space is less than 5 percent on a particular disk, but also if the available
space has been reduced by more than half in the last 24 hours (don't miss the
time-shift parameter in the last function). This means that no matter how big the disk
is, based on its usage pattern it could quickly fill up. Note also how the trigger would
need progressively smaller and smaller percentages for it to assume a PROBLEM state,
so you'd automatically get more frequent and urgent notifications as the disk is
filling up.
For these kinds of checks, percentage values should prove more flexible and easy to
understand than absolute ones, so that's what you probably want to use as a baseline
for templates. On the other hand, absolute values may be your best option if you
want to create a very specific trigger for a very specific filesystem.
Understanding operations as correlations
As you may have already realized, practically every interesting trigger expression is
built as a logical operation between two or more simpler expressions. Naturally, it
is not that this is the only way to create useful triggers. Many simple checks on the
status of an agent.ping item can literally save the day when quickly acted upon,
but Zabbix also makes it possible, and relatively easy, to define powerful checks that
would require a lot of custom coding to implement in other systems. Let's see a few
more examples of relatively complex triggers.
[ 229 ]
Managing Alerts
Going back to the date and time functions, let's say that you have a trigger that
monitors the number of active sessions in an application and fires up an alert if that
number drops too low during certain hours because you know that there should
always be a few automated processes creating and using sessions in that window of
time (from 10:30 to 12:30 in this example). During the rest of the day, the number of
sessions is neither predictable, nor that significant, so you keep sampling it but don't
want to receive any alert. A first, simple version of your trigger could look like the
following code:
{Appserver:sessions.active[myapp].min(300)}<5 and
{Appserver:sessions.active[myapp].time(0)} > 103000 and
{Appserver:sessions.active[myapp].time(0) } < 123000
The session.active item could be a custom script,
calculated item, or anything else. It's used here as a label to
make the example easier to read and not as an instance of
an actual ready-to-use native item.
The only problem with this trigger is that if the number of sessions drops below
five in that window of time but it doesn't come up again until after 12:30, the trigger
will stay in the PROBLEM state until the next day. This may be a great nuisance if you
have set up multiple actions and escalations on that trigger as they would go on for
a whole day no matter what you do to address the actual session's problems. But
even if you don't have escalating actions, you may have to give accurate reports on
these event durations, and an event that looks as if it's going on for almost 24 hours
would be both incorrect in itself and for any SLA reporting. Even if you don't have
reporting concerns, displaying a PROBLEM state when it's not there anymore is a kind
of false positive that will not let your monitoring team focus on the real problems
and, over time, may reduce their attention on that particular trigger.
A possible solution is to make the trigger return to the OK state outside the target
hours if it was in a PROBLEM state, as shown in the following code:
({Appserver:sessions.active[myapp].min(300)}<5 and
{Appserver:sessions.active[myapp].time(0)} > 103000 and
{Appserver:sessions.active[myapp].time(0) } < 123000)) or
({TRIGGER.VALUE}=1 and
{Appserver:sessions.active[myapp].min(300)}<0 and
({Appserver:sessions.active[myapp].time(0)} < 103000 or
{Appserver:sessions.active[myapp].time(0) } > 123000))
[ 230 ]
Chapter 6
The first three lines are identical to the trigger defined before. This time, there is one
more complex condition, as follows:
• The trigger is in a PROBLEM state (see the note about the TRIGGER.VALUE
macro)
• The number of sessions is less than zero (this can never be true)
• We are outside the target hours (the last two lines are the opposite of those
defining the time frame preceding it)
The TRIGGER.VALUE macro represents the current value of
the trigger expressed as a number. A value of 0 means OK, 1
means PROBLEM, and 2 means UNKNOWN. The macro can be used
anywhere you can use an item.function pair, so you'll typically
enclose it in curly brackets. As you've seen in the preceding
example, it can be quite useful when you need to define different
thresholds and conditions depending on the trigger's status itself.
The condition about the number of sessions being less than zero makes sure
that outside the target hours, if the trigger was in a PROBLEM state, the whole
expression will evaluate to false anyway. False means that the trigger is switching
to the OK state.
Here, you have not only made a correlation between an item value and a window
of time to generate an event, but you have also made sure that the event will always
spin down gracefully instead of potentially going out of control.
Another interesting way to build a trigger is to combine different items from the
same hosts or even different items from different hosts. This is often used to spot
incongruities in your system state that would otherwise be very difficult to identify.
An obvious case could be that of a server that serves content over the network.
Its overall performance parameters may vary a lot depending on a great number
of factors, so it would be very difficult to identify sensible trigger thresholds that
wouldn't generate a lot of false positives or, even worse, missed events. What may
be certain though is that if you see a high CPU load while network traffic is low, then
you may have a problem, as shown in the following code:
{Alpha:system.cpu.load[all,avg5].last(0)} > 5 and
{Alpha:net.if.total[eth0].avg(300)} < 1000000
[ 231 ]
Managing Alerts
An even better example would be about the necessity to check for hanging or
frozen sessions in an application. The actual way to do this would depend a lot on
the specific implementation of the said application, but for illustrative purposes,
let's say that a frontend component keeps a number of temporary session files in a
specific directory, while the database component populates a table with the session
data. Even if you have created items on two different hosts to keep track of these
two sources of data, each number taken alone will certainly be useful for trending
analysis and capacity planning, but they need to be compared to check whether
something's wrong in the application's workflow. Assuming that we have previously
defined a local command on the frontend's Zabbix agent that will return the number
of files in a specific directory, and that we have defined an odbc item on the database
host that will query the DB for the number of active sessions, we could then build a
trigger that compares the two values and reports a PROBLEM state if they don't match:
{Frontend:dir.count[/var/sessions].last(0)} <>
{Database:sessions.count.last(0)}
The <> term in the expression is the not equal operator that
was previously expressed as # is now expressed with <>
starting with Zabbix 2.4.
Aggregated and calculated items can also be very useful in building effective
triggers. The following one will make sure that the ratio between active workers and
the available servers doesn't drop too low in a grid or cluster:
{ZbxMain:grpsum["grid", "proc.num[listener]", last, 0].last(0)} /
{ZbxMain:grpsum["grid", "agent.ping", last, 0].last(0)} < 0.5
All these examples should help drive home the fact that once you move beyond
checking for simple thresholds with single-item values and start correlating different
data sources together in order to have more sophisticated and meaningful triggers,
there is virtually no end to all the possible variations of trigger expressions that you
can come up with.
By identifying the right metrics, as explained in Chapter 4, Collecting Data, and
combining them in various ways, you can pinpoint very specific aspects of your
system behavior; you can check log files together with the login events and
network activity to track down possible security breaches, compare a single server's
performance with the average server performance in the same group to identify
possible problems in service delivery, and do much more.
[ 232 ]
Chapter 6
This is, in fact, one of Zabbix's best-kept secrets that really deserve more publicity;
its triggering system is actually a sophisticated correlation engine that draws its
power from a clear and concise method to construct expressions as well as from the
availability of a vast collection of both current and historical data. Spending a bit of
your time studying it in detail and coming up with interesting and useful triggers
that are tailor-made for your needs will certainly pay you back tenfold as you will
end up not only with a perfectly efficient and intelligent monitoring system, but also
with a much deeper understanding of your environment.
Managing trigger dependencies
It's quite common that the availability of a service or a host doesn't depend only on
the said host by itself, but also on the availability of any other machine that may
provide connectivity to it. For example, if a router goes down, whereby an entire
subnet is isolated, you would still get alerts about all the hosts in the said network
that will suddenly be seen as unavailable from Zabbix's point of view even if it's
really the router's fault. A dependency relationship between the router and the hosts
behind it would help alleviate the problem because it would make the server skip
any trigger check for the hosts in the subnet in case the router becomes unavailable.
While Zabbix doesn't support the kind of host-to-host dependencies that other
systems do, it does have a trigger-to-trigger dependency feature that can largely
perform the same function. For every trigger definition, you can specify a different
trigger upon which your new trigger is dependent. If the parent trigger is in a
PROBLEM state, the trigger you are defining won't be checked until the parent returns
to the OK state. This approach is certainly quite flexible and powerful, but it also has
a couple of downsides. The first one is that one single host can have a significant
number of triggers, so if you want to define a host-to-host dependency, you'll need
to update every single trigger, which may prove to be quite a cumbersome task.
In this kind of situation, probably you can simplify the problem by adding your
triggers within a custom template. Anyway, if you have only specific cases, this will
not help as it would end up creating a template for each host, which is not ideal
and will move the problem to the template. You can, of course, rely on the mass
update feature of the web frontend as a partial workaround. A second problem is
that you won't be able to look at a host definition and see that there is a dependency
relationship with another host. Short of looking at a host's trigger configuration,
there's simply no easy way to display or visualize this kind of relationship in Zabbix.
[ 233 ]
Managing Alerts
A distinct advantage of having a trigger-level dependency feature is that you can
define dependencies between single services on different hosts. As an example, you
could have a database that serves a bunch of web applications on different web
servers. If the database is unavailable, none of the related websites will work, so
you may want to set up a dependency between the web monitoring triggers and
the availability of the database. On the same servers, you may also have some other
service that relies on a separate license server or an identity and authentication server.
You could then set up the appropriate dependencies so that you could end up having
some triggers depend on the availability of one server and other triggers depend on
the availability of another one, all in the same host. While this kind of configuration
can easily become quite complex and difficult to maintain efficiently, a select few,
well-placed dependencies can help cut down the amount of redundant alerts in a large
environment. This, in turn, would help you to focus immediately on the real problems
where they arise instead of having to hunt them down in a long list of trigger alerts.
Taking an action
Just as items only provide raw data and triggers are independent from them as they
can access virtually any item's historical data, triggers, in turn, only provide a status
change. This change is recorded as an event just as measurements are recorded as
item data. This means that triggers don't provide any reporting functionality; they
just check their conditions and change the status accordingly. Once again, what may
seem to be a limitation and lack of power turns out to be the exact opposite as the
Zabbix component in charge of actually sending out alerts or trying to automatically
resolve some problems is completely independent from triggers. This means that just
as triggers can access any item's data, actions can access any trigger's name, severity,
or status so that, once again, you can create the perfect mix of very general and very
specific actions without being stuck in a one-action-per-trigger scheme.
Unlike triggers, actions are also completely independent from hosts and templates.
Every action is always globally defined and its conditions checked against every
single Zabbix event. As you'll see in the following paragraphs, this may force you to
create certain explicit conditions instead of implicit conditions, but that's balanced
out by the fact that you won't have to create similar but different actions for similar
events just because they are related to different hosts.
An action is composed of the following three different parts that work together to
provide all the functionality needed:
• Action definition
• Action conditions
• Action operations
[ 234 ]
Chapter 6
The fact that every action has a global scope is reflected in every one of its
components, but it assumes critical importance when it comes to action conditions
as it's the place where you decide which action should be executed based on which
events. But let's not get ahead of ourselves, and let's see a couple of interesting things
about each component.
Defining an action
This is where you decide a name for the action and can define a default message that
can be sent as a part of the action itself. In the message, you can reference specific
data about the event, such as the host, item, and trigger names, item and trigger
values, and URLs. Here, you can leverage the fact that actions are global by using
macros so that a single action definition could be used for every single event in
Zabbix and yet provide useful information in its message.
You can see a few interesting macros already present in the default message when
you create a new action, as shown in the following screenshot:
[ 235 ]
Managing Alerts
Most of them are pretty self-explanatory, but it's interesting to see how you can, of
course, reference a single trigger—the one that generated the event. On the other
hand, as a trigger can check multiple items from multiple hosts, you can reference
all the hosts and items involved (up to nine different hosts and/or items) so that you
can get a picture of what's happening by just reading the message.
Other interesting macros can make the message even more useful and expressive.
Just remember that the default message can be sent not only via e-mail, but also
via chat or SMS; you'll probably want to create different default actions with
different messages for different media types so that you can calibrate the amount of
information provided based on the media available.
You can see the complete list of supported macros in the official documentation wiki
at https://www.zabbix.com/documentation/2.4/manual/appendix/macros/
supported_by_location, so we'll look at just a couple of the most interesting ones.
The {EVENT.DATE} and {EVENT.TIME} macros
These two macros can help you to differentiate between the time a message is sent and
the time of the event itself. It's particularly useful not only for repeated or escalated
actions, but also for all media where a timestamp is not immediately apparent.
The {INVENTORY.SERIALNO.A} and friends macros
When it comes to hardware failure, information about a machine's location, admin
contact, serial number, and so on, can prove quite useful to track it down quickly or
to pass it on to external support groups.
Defining the action conditions
This part lets you define conditions based on the event's hosts, trigger, and trigger
values. Just as with trigger expressions, you can combine different simple conditions
with a series of AND/OR logical operators, as shown in the next screenshot. You
can either have all AND, all OR, or a combination of the two, where conditions
of different types are combined with AND, while conditions of the same type are
combined with OR:
[ 236 ]
Chapter 6
Observe how one of the conditions is Trigger value = PROBLEM. Since actions are
evaluated for every event and since a trigger switching from PROBLEM to OK is an
event in itself, if you don't specify this condition the action will be executed both
when the trigger switches to PROBLEM and when the trigger switches back to OK.
Depending on how you have constructed your default message and what operations
you intend to do with your actions, this may very well be what you intended, and
Zabbix will behave exactly as expected.
Anyway, if you created a different recovery message in the Action definition form
and you forget the condition, you'll get two messages when a trigger switches back
to OK—one will be the standard message, and one will be the recovery message. This
can certainly be a nuisance as any recovery message would be effectively duplicated,
but things can get ugly if you rely on external commands as part of the action's
operations. If you forget to specify the condition Trigger value = PROBLEM, the
external, remote command would also be executed twice—once when the trigger
switches to PROBLEM (this is what you intended) and once when it switches back to
OK (this is quite probably not what you intended). Just to be on the safe side, and if
you don't have very specific needs for the action you are configuring, it's probably
better if you get into the habit of putting Trigger value = PROBLEM for every new
action you create or at least checking whether it's present in the actions you modify.
The most typical application to create different actions with different conditions is to
send alert and recovery messages to different recipients. This is the part where you
should remember that actions are global.
[ 237 ]
Managing Alerts
Let's say that you want all the database problems sent over to the database
administrators group and not the default Zabbix administrators group. If you just
create a new action with the condition that the host group must be DB Instances and,
as message recipients, choose your DB admins, they will certainly receive a message
for any DB-related event, but so will your Zabbix admins if the default action has no
conditions configured. The reason is that since actions are global, they are always
executed whenever their conditions evaluate to True. In this case, both the specific
action and the default one would evaluate to True, so both groups would receive a
message. What you could do is add an opposite condition in the default action so
that it would be valid for every event, except for those related to the DB Instances
host group. The problem is that this approach can quickly get out of control, and
you may find yourself with a default action full of the not in group conditions.
Truth is, once you start creating actions specific to message recipients, you either
disable the default action or take advantage of it to populate a message archive for
administration and reporting purposes.
Starting with Zabbix 2.4, there is another supported way of calculating action
conditions. As you can easily imagine, the And/Or type of calculation clearly
suffers from many limitations. Taking a practical example with two groups of the
same condition type, you can't use the AND condition within a group and the
OR condition within the other group. Starting with Zabbix 2.4, this limitation has
been bypassed. If you take a look at the possible options to calculating the action
condition, you can see that now we can choose even the Custom expression option,
as shown in the following screenshot:
[ 238 ]
Chapter 6
This new way allows us to use calculated formulas, such as:
• (A and B) and (C or D)
• (A and B) or (C and D)
But you can even mix the logical operators, as with this example:
• ((A or B) and C) or D
This opens quite a few interesting scenarios of usage, bypassing the previous
limitations.
Choosing the action operations
If the first two parts were just preparation, this is where you tell the action what it
should actually do. The following are the two main aspects to this:
• Operation steps
• The actual operations available for each step
As with almost everything in Zabbix, the simplest cases that are very straightforward
are most often self-explanatory; you just have a single step, and this step consists
of sending the default message to a group of defined recipients. Also, this simple
scenario can become increasingly complex and sophisticated but still manageable,
depending on your specific needs. Let's see a few interesting details about each part.
Steps and escalations
Even if an action is tied to a single event, it does not mean that it can perform a single
operation. In fact, it can perform an arbitrary number of operations called steps,
which can even go on for an indefinite amount of time or until the conditions for
performing the action are not valid anymore.
[ 239 ]
Managing Alerts
You can use multiple steps to both send messages as well as perform automated
operations. Alternatively, you can use the steps to send alert messages to different
groups or even multiple times to the same group with the time intervals that you
want as long as the event is unacknowledged or even not yet resolved. The following
screenshot shows a combination of different steps:
[ 240 ]
Chapter 6
As you can see, step 1 starts immediately, is set to send a message to a user group,
and then delays the subsequent step by just 1 minute. After 1 minute, step 2 starts
and is configured to perform a remote command on the host. As step 2 has a default
duration (which is defined in the main Action definition tab), step 3 will start after
about an hour. Steps 3, 4, and 5 are all identical and have been configured together—
they will send a message to a different user group every 10 minutes. You can't see
it in the preceding screenshot, but step 6 will only be executed if the event is not yet
acknowledged, just as step 7, which is still being configured. The other interesting bit
of step 7 is that it's actually set to configure steps 7 to 0. It may seem counterintuitive,
but in this case, step 0 simply means forever. You can't really have further steps if
you create a step N to 0, because the latter will repeat itself with the time interval
set in the step's Duration(sec) field. Be very careful in using step 0 because it will
really go on until the trigger's status changes. Even then, if you didn't add a Trigger
status="PROBLEM" condition to your action, step 0 can be executed even if the
trigger switched back to OK. In fact, it's probably best never to use step 0 at all unless
you really know what you are doing.
Messages and media
For every message step, you can choose to send the default message that you
configured in the first tab of the Action creation form or send a custom message that
you can craft in exactly the same way as the default one. You might want to add
more details about the event if you are sending the message via e-mail to a technical
group. On the other hand, you might want to reduce the amount of details or the
words in the message if you are sending it to a manager or supervisor or if you are
limiting the message to an SMS.
[ 241 ]
Managing Alerts
Remember that in the Action operation form, you can only choose recipients as
Zabbix users and groups, while you still have to specify any media address for every
user they are reachable to. This is done in the Administration tab of the Zabbix
frontend by adding media instances for every single user. You also need to keep in
mind that every media channel can be enabled or disabled for a user; it may be active
only during certain hours of the day or just for one or more specific trigger severity,
as shown in the following screenshot:
This means that even if you configure an action to send a message, some recipients
may still not receive it based on their own media configuration.
While Email, Jabber, and SMS are the default options to send messages, you still
need to specify how Zabbix is supposed to send them. Again, this is done in the
Media types section of the Administration tab of the frontend. You can also create
new media types there that will be made available both in the media section of user
configuration and as targets to send messages to in the Action operations form.
If you have more than one server and you need to use them for different purposes
or with different sender identifications, a new media type can be a different e-mail,
jabber, or SMS server. It can also be a script, and this is where things can become
interesting if not potentially misleading.
[ 242 ]
Chapter 6
A custom media script has to reside on the Zabbix server in the directory that is
indicated by the AlertScriptPath variable of zabbix_server.conf. When called
upon, it will be executed with the following three parameters passed by the server:
• $1: The recipient of the message
• $2: The subject of the message
• $3: The body of the main message
The recipient will be taken from the appropriate user-media property that you
defined for your users while creating the new media type. The subject and the
message body will be the default ones configured for the action or some step-specific
ones, as explained before. Then, from Zabbix's point of view, whether it's an old
UUCP link, a modern mail server that requires strong authentication, or a post to an
internal microblogging server, the script should send the message to the recipient
by whatever custom methods you intend to use. The fact is that you can actually
do what you want with the message; you can simply log it to a directory, send it to
a remote file server, morph it to a syslog entry and send it over to a log server, run
a speech synthesis program on it and read it aloud on some speakers, or record a
message on an answering machine (as with every custom solution); the sky's the
limit with custom media types. This is why you should not confuse custom media
with the execution of a remote command—while you could potentially obtain
roughly the same results with one or the other, custom media scripts and remote
commands are really two different things.
Remote commands
These are normally used to try to perform corrective actions in order to resolve
a problem without human intervention. After you've chosen the target host that
should execute the command, the Zabbix server will connect to it and ask it to
perform it. If you are using the Zabbix agent as a communication channel, you'll
need to set EnableRemoteCommands to 1, or the agent will refuse to execute any
command. Other possibilities include SSH, Telnet, and IPMI (if you have compiled
the relative options during server installation).
[ 243 ]
Managing Alerts
Remote commands can be used to do almost anything—kill or restart a process,
make space on a filesystem by zipping or deleting old files, reboot a machine,
and so on. They tend to seem powerful and exciting to new implementers, but in
the authors' experience, they tend to be fragile solutions that tend to break things
almost as often as they fix them. It's harder than it looks to make them run safely
without accidentally deleting files or rebooting servers when there's no need to. The
real problem with remote commands is that they tend to hide problems instead of
revealing them, which should really be the job of a monitoring system. Yes, they
can prove useful as a quick patch to ensure the smooth operation of your services,
but use them too liberally and you'll quickly forget that there actually are recurring
problems that need to be addressed because some fragile command somewhere
is trying to fix things in the background for you. It's usually better to really try to
solve a problem than to just hide it behind an automated temporary fix. This is not
just from a philosophical point of view as, when these patches fail, they tend to fail
spectacularly and with disastrous consequences.
So, our advice is that you use remote commands very sparingly and only if you
know what you are doing.
Summary
This chapter focused on what is usually considered the core business of a monitoring
system—its triggering and alerting features. By concentrating separately and
alternately on the two parts that contribute to this function—triggers and actions—it
should be clear to you how, once again, Zabbix's philosophy of separating all the
different functions can give great rewards to the astute user. You learned how to
create complex and sophisticated trigger conditions that will help you have a better
understanding of your environment and have more control over what alerts you
should receive. The various triggering functions and options as well as some of the
finer aspects of item selection, along with the many aspects of action creation, are not
a secret to you now.
In the next chapter, you will explore the final part of Zabbix's core monitoring
components: templates and discovery functions.
[ 244 ]
Managing Templates
For all the monitoring power of Zabbix's items, graphs, maps, and triggers, it would
be incredibly cumbersome to manually create every single one of these objects
for every monitored host. In the case of a large environment, with hundreds or
thousands of monitored objects, it would be practically impossible to manually
configure all the items, graphs, and triggers needed for each host.
Using the templates facility, you'll define different collections of items, triggers, and,
graphs in order to apply common configurations to any number of hosts, while still
being able to manage any single aspect you may need to tweak for any single host.
The perfect complement to the template facility is Zabbix's discovery feature. Using
it, you'll define a set of rules to let Zabbix know of new hosts without having to
manually create them. You can also take advantage of the low-level discovery
powers of the Zabbix agent so that you can automatically assign the correct items
even for those highly variable parts of a system, such as the number and nature of
disks, filesystems, and network interfaces.
In this chapter, you will learn the following things:
• Creating and leveraging the power of nested templates
• Combining different templates for the same hosts
• Using host discovery and actions to add templates to new hosts
• Configuring a low-level discovery to make templates even more general
Let's start from the beginning and see how a template is different from a regular host
even if they look almost the same.
[ 245 ]
Managing Templates
Creating templates
A host template is very similar to a regular host. Both are collections of items,
triggers, graphs, screens, and low-level discovery rules. Both need a unique name
just as any other entity in Zabbix. Both can belong to one or more groups. The
crucial difference is that a host has one or more means to be contacted so that the
Zabbix server can actually take item measurements on it, as illustrated in Chapter 4,
Collecting Data. These can be one or more IP addresses, or host names, that represent
agent interfaces, or SNMP, JMX, and IPMI ones. So, a host is an object that the Zabbix
server will ask for information to or wait for data from. A template, on the other
hand, doesn't have any access interface, so the Zabbix server will never try to check
whether a template is alive or ask it for the latest item measurements.
The creation of a template is very straightforward, and there is not much to say
about it. You navigate to the Configuration | Templates tab and click on the Create
template button. The template creation form that will appear is composed of three
different tabs. We'll look at the Linked templates tab and the Macros tab later in the
chapter as these are not essential to create a basic template. In fact, the only essential
element for a basic template is its name, but it can be useful to assign it to one or
more groups in order to find it more easily in the other section of the web interface.
If you have configured hosts already, you can also assign the template to the hosts
you're interested in directly from the template creation tab. Otherwise, you'll need
to go to the Hosts configuration tab and assign templates there. Once you're done,
the template is created and available in the template list, but it's still an empty object.
Your next job is to create the template's items, trigger, graphs, screens, and discovery
rules, if any.
Adding entities to a template
Adding an item or any other entity to a template is virtually identical to the same
operation performed on a regular host. This is especially true for items. As you
already know, item keys are the basic building blocks of the Zabbix monitoring
pipeline, and you don't have to specify any kind of address or interface when
you create them as Zabbix will take this kind of information from the host the
item is assigned to. This means that when you create items for a template, you are
effectively creating items for an ideal host that will be later applied to real ones once
you have linked the template to the hosts you want to monitor.
[ 246 ]
Chapter 7
Templates, just like hosts, are essentially collections of items,
triggers, and graphs. Since many of the concepts that we will
explore apply equally to items, triggers, and graphs, for the rest
of the chapter we'll use the term entity to refer to any of the three
types of objects. In other words, you can understand an item,
trigger, or graph every time you read entity, and items, triggers,
and graphs when you read entities as a collective term.
This applies to other types of entities as well, but as they always reference one or
more existing items, you need to make sure that you select the items belonging to the
right template and not to a regular host:
This may seem obvious, but it is far too easy to select the Items, Graphs, or Screens
contained in the template using the links at the top of the window.
The main difference between template entities and host entities, especially when
it comes to triggers, is that with template entities, macros are quite useful to make
trigger and graph names or parameters more expressive and adaptable.
We can summarize the entities that can be grouped in a template as:
• Items
• Triggers
• Graphs
• Applications
• Screens
• Low-level discovery rules
• Web scenarios (since Zabbix 2.2)
[ 247 ]
Managing Templates
It's important to also bear in mind that to be able to link a template to a host, the host
itself needs to have items with unique names. Then, if the host already contains the
template's items or a subset of them, we need to sort out the duplicates issue.
Using macros
As you've already seen in Chapter 6, Managing Alerts, macros are very useful to make
a message general enough for it to be applied to a wide range of events. It will be the
Zabbix server's job to substitute all the macros in a message with the actual content
based on the specific event it's handling. Since an action message is effectively a
template that has to be applied to a particular event, it's easy to see how the same
concept is essential for the effectiveness of host templates. What changes is the
context; while an event has a context that is quite rich since it can reference a trigger
and one or more different items and hosts, the context of a simple, regular host is
admittedly more limited. This is reflected in the number of macros available, as they
are just a handful:
Macro name
Macro translates
to
Notes
{HOST.CONN}
Hostname or IP
address of the
host
This will be identical to either {HOST.IP} or
{HOST.DNS} depending on the Connect to
option in the host's configuration form.
{HOST.DNS}
The host's
hostname
This must correspond to the host's fully qualified
domain name as defined in the domain's DNS
server.
{HOST.HOST}
The host's name
as defined in
Zabbix
This is the main host identifier. It must be unique
for the specific Zabbix server. If using an agent,
the same name must be present in the agent's
configuration on the host.
{HOST.IP}
The host's IP
address
A host can have more than one IP address. You
can reference them using {HOST.IP1}, {HOST.
IP2}, and so on, up to {HOST.IP9}.
{HOST.NAME}
The host's visible
name as defined
in Zabbix
This will be the name visible in lists, maps,
screens, and so on.
[ 248 ]
Chapter 7
To better clarify the differences between the various {HOST.*} macros, let's see an
example host configuration:
In this case, {HOST.HOST} will resolve to ZBX Main, {HOST.NAME} to Main Zabbix
Server, {HOST.IP} to 127.0.0.1, and {HOST.DNS} to zabbix.example.com.
Finally, since the Connect to option is set to IP, {HOST.CONN} will resolve to
127.0.0.1 as well.
The most obvious use of these macros is to make trigger and graph names more
dynamic and adaptable to the actual hosts they will be used into. Since a graph's name
is displayed as a header when viewing the graph, it's vital to distinguish between
different graphs of the same type belonging to different hosts, especially when they are
displayed together in a screen, as explained in Chapter 5, Visualizing Data.
A less obvious use of these macros is inside an item's key definition. We touched
briefly on external scripts in Chapter 4, Collecting Data, and you'll meet them again
in the next chapter, so we won't get into too much detail about them here. It would
suffice to say that from an item creation point of view, all you need to know about
an external script is its name and any parameters you may need to pass in order to
execute it correctly.
[ 249 ]
Managing Templates
Since external scripts, as is their nature, don't share any information with the rest of
Zabbix other than the arguments they are passed and their return value, it's often
essential to include the host's IP address or hostname as one of the arguments. This
ensures that the script will connect to the right host and collect the right data. A
single, well-configured script can perform the same operation on many different
hosts thanks to the template systems and macros, such as {HOST.CONN}, {HOST.IP},
and so on.
Take, for example, a script that checks whether a particular application is alive using
a custom protocol. You could have an external script, say app_check.sh, which
takes a host name or IP address as an argument, connects to it using the application's
protocol, and returns 1 if it's alive and well and 0 if the check fails. Your template
item's key would look similar to the following screenshot:
In these cases, using a macro as the argument to the item's key is the only way to
make an external check for a part of a template and is useful for any regular host.
[ 250 ]
Chapter 7
Another example would be that of a bunch of Zabbix hosts that don't represent
regular operating system machines, physical or virtual, but single applications or
single database instances. In a scenario like this, all the application hosts would
share the same connections and interfaces—those of the actual server hosting the
applications—and they would be linked to a template holding only items relevant to
application-level (or database-level) measurements. To keep things simple, let's say
that you have an application server (Alpha) hosting three different applications:
• A document archival facility (doku)
• A customer survey form manager (polls)
• A custom, internal microblogging site (ublog)
For each of these applications you are interested in, by and large, take the same
measurements:
• The number of active sessions
• The amount of memory consumed
• The number of threads
• The network I/O
• The number of connections to the database
Again, for simplicity's sake, let's say that you have a bunch of external scripts that,
given an IP address and an application name, can measure exactly the preceding
metrics. External script keys tend to be easy to read and self-explanatory, but all of
this can be equally applied to JMX console values, Windows performance counters,
database queries, and any other kind of items.
One way to monitor this setup is to create only one host, Alpha and, in addition to
all the regular OS- and hardware-monitoring items, a number of items dedicated
to application measurements, which are repeated for each one of them. This can
certainly work, but if you have to add a new application, you'll need to create all the
items, triggers, and graphs related to it even if they differ from the rest by just the
application's name.
[ 251 ]
Managing Templates
As that is the only difference in an otherwise identical collection of entities, a more
flexible solution would be to split the monitoring of every application to a different
host and apply a common template.
A host, from Zabbix's point of view, is just a collection of
entities with one or more connection interfaces. It doesn't have
to be an actual, physical (or virtual!) machine with a regular
operating system. Any abstract but coherent collection of
metrics and a means to retrieve them can be configured as a
host in Zabbix. Typical examples are applications, database
instances, and so on.
Instead of creating many similar items, triggers, and so on for the host, Alpha, you
would create a custom application template and fill it with items that would look
similar to the following screenshot:
[ 252 ]
Chapter 7
You can then create one host for each application, with Alpha's IP address as the
connection interface, and with the application's name as the hostname. Linking
the template you just created to the hosts would give you the same basic results as
before but with much more flexibility; adding an application to be monitored now is
a simple matter of creating a host and linking it to the correct template. If you move
an application from one server to another, you just need to update its IP address. If
you put all these application hosts in a separate group, you can even grant access to
their monitoring data to a specific group of users without necessarily giving them
access to the application server's monitoring data. And, it goes without saying that
adding, deleting, or modifying an entity in the template apply immediately to all the
monitored applications.
User-defined macros
A special class of macros is user-defined, template- and host-level macros. You
can configure them in the Macros tab of every host or template creation and
administration form. They are quite simple as they only provide a translation facility
from a custom label to a predefined, fixed value. The following screenshot shows this:
When used in a template, they prove quite useful in defining common thresholds
for triggers, so if you need to modify a bunch of time-out triggers, you can just
modify the {$NODATA} macro instead of changing every single trigger that uses it.
User-defined macros can be used everywhere built-in macros can be used.
If a user macro is used in items or triggers in a template, it is better
to add that macro to the template in any case even if is defined
on a global level. Doing so once you've exported your template to
XML, you can freely import it into another system without taking
the care to have all the user macros properly configured.
[ 253 ]
Managing Templates
The usefulness is even greater when used in connection with nested templates, as
we'll see in a short while.
The most common use cases of global and host macros are:
• Using all the advantages of a template with host-specific attributes: port
numbers, filenames, accounts, and so on
• Using global macros for one-click configuration changes and fine-tuning
A practical example of macro usage can be the use of host-level macros in the item
keys, such as Status of SSH daemon:
net.tcp.service[ssh,,{$SSH_PORT}]
This item can be assigned to multiple hosts once you've defined at the host level
the value of {$SSH_PORT}. By doing so, you're generalizing a custom item where
$SSH_PORT may change across servers; this can be done for HTTP services too,
among others.
Importing and exporting templates
Zabbix provides a good and useful import/export functionality. The objects that can
be exported and imported are the following:
• Templates: This includes all directly attached items, triggers, graphs, screens,
discovery rules, and template linkage
• Hosts: This includes all directly attached items, triggers, graphs, discovery
rules, and template linkage
• Network maps: This includes all related images; map export/import is
supported since Zabbix 1.8.2
• Images
• Screens
Using the Zabbix API, it is possible to export and import even
the host groups.
[ 254 ]
Chapter 7
The export functionality is quite easy to understand; anyway, the import function
has been extended. The following screenshot captures this discussion:
The import section is divided into three columns; the first one, Update existing, will
force the update if an element is already defined. This function is fundamental if you
want to update an element or simply add the missing objects. The second column,
Create new, is quite simple to understand as it will enable the new element. The third
and last column has been added with Zabbix 2.4. Delete missing, if selected, will
delete all the elements that have not been exported if they are present in our setup.
As you can see, the Template objects are well defined as we can decide to export only
Template screens, Template linkage and/or Templates.
[ 255 ]
Managing Templates
Linking templates to hosts
To link a template to a host, you can either select the hosts you want to link from the
template's configuration form, as we saw in the Creating templates section, or you can
choose the template you need for a host in that host's configuration form by going
into the Template tab.
Once linked, a host will inherit all of the template's entities. Previously existing entities
with the same name will be overwritten, but entities not included in the template will
remain as they are and will not be touched in any way by the linking operation.
All entities will maintain their original template's name when displayed in
the configuration section of the web interface even when viewed from a host
configuration page. However, this doesn't mean that modifying them from a
template's configuration tab is the same as modifying them from a linked host's
configuration tab.
If you modify an entity (item, trigger, graph, and so on) from a template's
configuration tab, the modifications will apply immediately to all linked hosts. On the
other hand, if you modify a template entity from a particular host's configuration tab,
the changes will only apply to that host and not on a template level. While this can be
useful to address any special circumstances for an otherwise regular host, it can also
generate some confusion if you make many local changes that can become hard to
keep track of. Moreover, not every aspect of a template entity can be modified at the
host level. You can change the frequency of an item, for example, but not its key.
Unlinking a template from a host doesn't eliminate its entities unless you unlink
and clear it. Be careful with this operation as all the items' historical data and trends
would become unavailable. If you have collected any actual data, it's probably better
to just unlink a template from a host and then disable any unused items and triggers,
while retaining all of their historical data.
Nesting templates
Just as you can link a template to a host, you can also link a template to another
template. The operation is identical to linking a template to a host; you navigate
to the Linked templates tab in a template's configuration form and choose the
templates you want to link.
While this may seem an awkward operation, it can prove quite useful in two cases.
The first application of nested templates is to make user macros even more
general. Since a template inherits all of its linked templates' entities and properties,
any custom macro will also be inherited and, thus, made available to the actual
monitored hosts.
[ 256 ]
Chapter 7
To take a concrete example, let's say you have a Template Macros template
containing a {$PFREE} user macro with the value 5, among many others. You could
use this macro to represent the amount of free disk space in percentages to check
against, free available memory, or any other such threshold. This template could be
linked to both the Template OS Linux and Template OS Windows templates, and the
{$PFREE} macro used in these templates' triggers. From now on, if you ever need to
modify the default value of the free disk space percentage to check against, you'll just
need to change the original Template Macros template, and the updated value will
propagate through the linked templates down to the monitoring hosts.
A second, somewhat more limited but still useful, way to use nested templates is to
extend the inheritance beyond macros to all the other entities. This may become an
advantage when you have a common set of features on a given technological layer but
different uses on other layers. Let's take, for instance, the case where you have a large
number of virtually identical physical servers that host just a couple of versions of
operating systems (Linux and Windows, for simplicity's sake) but that in turn perform
many different specialized functions: database, file server, web server, and so on.
You can certainly create a few monolithic templates with all the items you need for
any given server, including hardware checks, OS checks, and application-specific
ones. Alternatively, you can create a sort of hierarchy of templates. A common,
hardware-level template that enables IPMI checks will be inherited by a couple
of OS-specific templates. These, in turn, will be inherited by application-specific
templates that will have names such as Linux Apache Template or Win Exchange
Template. These templates will have all the items, triggers, and graphs specific to the
applications that they are meant to monitor in addition to all the OS-specific checks
they have inherited from the OS-level templates and the hardware-specific ones
they have inherited from the HW-level templates. This means that, when creating a
host, you will still just need to link it to a single template, but you'll also have a lot
of flexibility in creating new templates and nesting them or modifying existing ones
in only one place and watching the changes propagate along the template-linking
chain. This also means maximum generality, while still maintaining the ability to
make host-specific customizations if you need to.
Combining templates
Another way to make templates modular is to create specific templates for any
given technological layer and product but not link them in a hierarchy at the
template level.
[ 257 ]
Managing Templates
You can instead link them—as many as you want—directly to the host you need
to monitor as long as they don't have any conflicting or overlapping item names or
keys. As in the preceding scenario, Host A could have an IPMI checks template, an
OS Linux one, and an Apache server one linked, while Host B could have an IPMI
checks template and an OS Linux one but then also have a PostgreSQL database
template.
The end result is practically the same as the nested templates solution described
previously, so which one should you choose? This is largely a matter of preference,
but a possible criterion could be that if you have a relatively low number of lowlevel templates and good consistency in your hardware, OS, and technological
configuration, the nested solution might be easier to manage. You'll only have to
connect the templates once and then use them on a large number of hosts. This
approach also works well with the host discovery facility as it keeps things simple
when linking templates to hosts. If, on the other hand, you have a great number of
low-level templates and great variability in your technological configuration and
landscape, you may just as well pick and choose the templates you need when you
create your hosts. Any pre-configuration, in fact, would only prove too rigid to be
really useful. This approach works well if you want to always ponder how you are
creating and configuring your hosts and also need a great deal of local customization
that would make any aggressive inheritance feature a moot point.
Discovering hosts
A third way to link templates to hosts is to let the server do it automatically by
combining Zabbix's host-discovery facility with discovery actions.
Zabbix's discovery facilities consist of a set of rules that periodically scan the network
to look for new hosts or disappearing ones according to predetermined conditions.
The three methods that Zabbix can use to check for new or disappeared hosts, given
an IP range, are:
• The availability of a Zabbix agent
• The availability of an SNMP agent
• Response to simple external checks (FTP, SSH, and so on)
• These checks can also be combined, as illustrated in the following example:
[ 258 ]
Chapter 7
As you can see, when enabled, this rule will check every hour in the IP range
192.168.1.1-255 for any server that:
• Responds to an ICMP ping probe
• Has a correctly configured Zabbix agent that will return a value when asked
for the system.uname item
• Has an SMTP listening port, which is usually associated with a mail server
As usual, with all things Zabbix, a discovery rule will not do anything by itself,
except generate a discovery event. It will then be the job of Zabbix's actions facility
to detect the said event and decide whether and how to act on it. Discovery event
actions are virtually identical to trigger event actions. As you saw trigger event
actions in Chapter 6, Managing Alerts, the following are the only differences when it
comes to discovery events.
[ 259 ]
Managing Templates
First, action conditions are a bit different, as can be expected, as shown in this
following screenshot:
Instead of hostnames and trigger specifications, you can set conditions based on
things such as Discovery status, Service type, and Uptime/Downtime. The Received
value condition is of particular interest as it allows things such as differentiating
between operating systems, application versions, and any other information you can
get from a Zabbix or SNMP agent query.
This kind of information will be critical when it comes to configuring the action's
operations. The following screenshot shows this:
[ 260 ]
Chapter 7
Sending a message and executing a remote command are the exact equivalents of
the same operations available to trigger event actions. On the other hand, if adding
(or removing) a host is quite a self-explanatory action when it comes to adding to a
host group or linking to a template, it becomes clear that a good set of actions with
specific received value conditions and template-linking operations can give a high
level of automation to your Zabbix installation.
This high level of automation is probably more useful in rapidly changing
environments that still display a good level of predictability depending on the
kind of hosts you can find, such as fast-growing grids or clusters. In these kinds
of environments, you can have new hosts appearing on a daily basis and perhaps
old hosts disappearing at almost the same rate, but the kind of host is more or
less always the same. This is the ideal premise for a small set of well-configured
discovery rules and actions, so you don't have to constantly and manually add or
remove the same types of hosts. On the other hand, if your environment is quite
stable or you have very high host-type variability, you may want to look more
closely at what and how many hosts you are monitoring as any error can be much
more critical in such environments.
[ 261 ]
Managing Templates
On the other hand, limiting discovery actions to sending messages about
discovered hosts can prove quite useful in such chaotic environments or where
you don't directly control your systems' inventory and deployment. In such a
case, getting simple alerts about new hosts, or disappearing ones, can help the
monitoring team keep Zabbix updated despite any communication failure between
IT departments—accidental or otherwise.
The active agent auto-registration
Starting with Zabbix 2.0, it is possible to instruct the active Zabbix agent for autoregistration. This way, new hosts can be added for monitoring without configuring
them manually on the server. The auto-registration of an unknown host can be
triggered when an active agent asks for checks. This feature can be precious to
implement an automatic monitoring of new cloud nodes. When a new node in the
cloud comes up, Zabbix will automatically start collecting performance metrics and
checking the availability of the host.
The active agent auto-registration can also monitor hosts that have passive checks.
When the active agent asks for checks, provide them to the Zabbix server's ListenIP
and ListenPort configuration parameters defined in the agent configuration file.
Please note that if you have multiple IP addresses specified,
only the first one will be sent to the server.
On the server side, Zabbix uses the IP and port that has been received by the agent.
Here, in the event that the IP address has been delivered, Zabbix
will use the IP address seen during the incoming connection.
Also, if the port value is not delivered, Zabbix uses port 10050.
Configuring the auto-registration
Let's see how we can configure this feature; we will look first at the agent side. On
the agent side, you need to have the Server parameter specified within the agent
configuration file. Then, if you've specified even the Hostname parameter in zabbix_
agentd.conf, the server will use it to register the new monitored host; otherwise,
Zabbix will use the physical hostname.
[ 262 ]
Chapter 7
On the server side, we need to configure an action, select Configuration | Actions,
select Auto registration as the event source, and then click on Create action.
In the screenshot that follows, we've created an action named Active autoregistration:
The real-case scenario
Here, you can play as much as you want with automation. If the hosts that will
be auto-registering are supposed to be only supported for active monitoring (for
instance, hosts that are behind a firewall), then it is worth creating a specific template
and linking it to the new hosts. Let's see how we can play with auto-registration.
Here, to customize properly and automate the host configuration, we can define
HostMetadata and HostMetadataItem on the agent side. A good example to
understand this automation can be the following scenario—we would like to link
Template OS Linux to all the auto-registered Linux hosts.
To do this, we need to add the following value to the /etc/zabbix/zabbix_agentd.
conf agent configuration file:
HostMetadataItem=system.uname
Then, in our real-world scenario, HostMetadataItem will contain:
Linux servername.example.com 2.6.32-504.16.2.el6.x86_64 #1 SMP Wed Apr
22 06:48:29 UTC 2015 x86_64 x86_64 x86_64 GNU/Linux
[ 263 ]
Managing Templates
Then, on the frontend, our action will be configured as follows:
With Conditions such as Host metadata like Linux, the Operations tab will contain
the elements shown in the following screenshot:
As you can see, once all the Conditions of the relative tab are satisfied, the Operation
tab will link the host to Template OS Linux.
Now, as you can see, if we package the agent with the configuration file premade, we
can heavily reduce the startup time of new hosts.
Low-level discovery
An even more useful and important feature of Zabbix templates is their ability
to support special kinds of items, which are called low-level discovery rules.
Once applied to actual hosts, these rules will query the host for whatever kind of
resources they are configured to look for: filesystems, network interfaces, SNMP
OIDs, and more. For every resource found, the server will then dynamically create
items, triggers, and graphs according to special entity prototypes connected to the
discovery rules.
[ 264 ]
Chapter 7
The great advantage of low-level discovery rules is that they take care of the
more variable parts of a monitored host, such as the type and number of network
interfaces, in a dynamic and general way. This means that, instead of manually
creating specific items and triggers of every host's network interfaces or filesystems
or creating huge templates with any possible kind of item for a particular operating
system and keeping most of these items disabled, you can have a reasonable number
of general templates that will adapt themselves to the specifics of any given host by
creating on the fly any entity needed based on discovered resources and previously
configured prototypes.
Out of the box, Zabbix supports four discovery rules:
• Network interfaces
• Filesystem types
• SNMP OIDs
• CPUs and CPU cores
As discovery rules are effectively a special kind of item, you can create your own
rules, provided you understand their peculiarity compared to regular items.
If we don't consider the fact that you need to create and manage low-level discovery
rules in the Discovery rules section of the template configuration and not in the
usual Items section, the main difference between the two kinds of items is that while
a regular item usually returns a single value, as explained in Chapter 4, Collecting
Data, a discovery item always returns a list of macro/value pairs expressed in JSON.
This list represents all the resources found by the discovery items together with the
means to reference them.
The following table shows Zabbix's supported discovery items and their return
values together with a generalization that should give you an idea on how to create
your own rules:
Discovery item key
vfs.fs.discovery
Item type
Zabbix
agent
Return values
{"data": [
{"{#FSNAME}":<path>",
"{#FSTYPE}":"<fstype>"},
{"{#FSNAME}":<path>",
"{#FSTYPE}":"<fstype>"},
{"{#FSNAME}":<path>",
"{#FSTYPE}":"<fstype>"},
…
] }
[ 265 ]
Managing Templates
Discovery item key
Item type
Return values
net.if.discovery
Zabbix
agent
{"data":[
{"{#IFNAME}":"<name>"},
{"{#IFNAME}":"<name>"},
{"{#IFNAME}":"<name>"},
…
]}
system.cpu.
discovery
Zabbix
agent
{"data": [
{"{#CPU.NUMBER}":"<idx>",
STATUS}":"<value>"},
{"{#CPU.NUMBER}":"<idx>",
STATUS}":"<value>"},
{"{#CPU.NUMBER}":"<idx>",
STATUS}":"<value>"},
…
] }
"{#CPU.
"{#CPU.
"{#CPU.
snmp.discovery
SNMP
(v1, v2, or
v3) agent
{"data":[
{"{#SNMPINDEX}":"<idx>",
"{#SNMPVALUE}":"<value>},
{"{#SNMPINDEX}":"<idx>",
"{#SNMPVALUE}":"<value>},
{"{#SNMPINDEX}":"<idx>",
"{#SNMPVALUE}":"<value>},
…
]}
custom.discovery
Any
{"data":[
{"{#CUSTOM1}":"<value>","{#CUSTOM2}":"
<value>"},
{"{#CUSTOM1}":"<value>","{#CUSTOM2}":"
<value>"},
{"{#CUSTOM1}":"<value>","{#CUSTOM2}":"
<value>"},
…
]}
As with all SNMP items, an item key is not really important
as long as it is unique. It's the SNMP OID value that you ask
an agent for that makes the difference; you can create different
SNMP discovery rules that look for different kinds of resources
by changing the item key and looking for different OID values.
The custom discovery example is even more abstract as it will
depend on the actual item type.
[ 266 ]
Chapter 7
As you can see, a discovery item always returns a list of values, but the actual
contents of the list change depending on what resources you are looking for. In the
case of a filesystem, the returned list will contain values such as {#FSNAME}:/usr,
{#FSTYPE}:btrfs, and so on, for every discovered filesystem. On the other hand,
a network discovery rule will return a list of the names of the discovered network
interfaces.
When configuring a template's discovery rules, you don't need to care about the
actual values returned in such lists, nor the lists' length. The only thing you have to
know is the name of the macros that you can reference in your prototypes. These are
the second half of the mechanisms of low-level discovery. You create them as regular
template entities, thus making sure that you use the discovery item macros where
needed, as exemplified in the following screenshot:
When you apply the template to a host, it will create items, triggers, and graphs
based on the resources discovered by the discovery items and configured according
to the discovery prototypes.
Custom discovery rules, from this point of view, work exactly in the same way as
custom items whether you decide to use agent-side scripts (thereby using a custom
zabbix.agent item key), external scripts, database queries, or anything else. The
only things you have to make sure of is that your custom items' return values must
respect the JSON syntax as shown in the preceding table and that you reference your
custom macros in the entities' prototypes that you will create.
Now, let's see how you can create a custom script to implement simple,
low-level discovery.
[ 267 ]
Managing Templates
In this example, we're going to use low-level discovery to find all the hard disks
connected to a physical server. First of all, here we require a script, and this script
needs to be deployed to the agent side and, of course, needs to produce JSONformatted output.
The shell script used in this example is the following:
#!/bin/bash
disks=`ls -l /dev/sd* | awk '{print $NF}' | sed 's/[0-9]//g' | uniq`
elementn=`echo $disks| wc -w`
echo "{"
echo "\"data\":["
i=1
for disk in $disks
do
if [ $i == $elementn ]
then
echo "
{\"{#DISKNAME}\":\"$disk\",\"{#SHORTDISKNAME}\":\"${di
sk:5}\"}"
else
echo "
{\"{#DISKNAME}\":\"$disk\",\"{#SHORTDISKNAME}\":\"${di
sk:5}\"},"
fi
i=$((i+1))
done
echo "]"
echo "}"
This script will produce the following JSON-formatted output:
{
"data":[
{"{#DISKNAME}":"/dev/sda","{#SHORTDISKNAME}":"sda"},
{"{#DISKNAME}":"/dev/sdb","{#SHORTDISKNAME}":"sdb"},
{"{#DISKNAME}":"/dev/sdc","{#SHORTDISKNAME}":"sdc"},
...
]
}
Practically, the script lists all the sd<X> devices after taking care to remove the
duplicates, if present, and even the partition.
[ 268 ]
Chapter 7
To enable the script on the agent side, we need to change the zabbix_agentd.conf
configuration file and add the following lines:
EnableRemoteCommands=1
UnsafeUserParameters=1
UserParameter=discovery.hard_disk,/<location-of-our-script>/discover_
hdd.sh
Of course, once done, we need to restart the Zabbix agent on the remote machine.
Now it's time to define the discovery rule, as shown in the next screenshot:
Then, we need to define the item and trigger prototype based on #DISKNAME or
#SHORTDISKNAME we've just found. A good example of an item prototype is the I/O
currently in progress on our discovered hard disk. To acquire this metric, we can
simply check /proc/diskstats:
$ grep sda /proc/diskstats |head -1 | awk '{print $12}'
19
[ 269 ]
Managing Templates
And, as you can see, we get back the number of I/Os done at the moment.
For greater detail about /proc/diskstats, refer to the
official kernel documentation available at https://www.
kernel.org/doc/Documentation/ABI/testing/
procfs-diskstats.
You can see that there are quite a few interesting metrics that we can acquire
and historicize for capacity planning and management. Then, we can register
UserParameter in our Zabbix agent to retrieve those metrics. A good set of
them can be:
UserParameter=custom.vfs.dev.read.ops[*],grep $1 /proc/diskstats |
head -1 | awk '{print $$4}'
UserParameter=custom.vfs.dev.read.ms[*],grep $1 /proc/diskstats | head
-1 | awk '{print $$7}'
UserParameter=custom.vfs.dev.write.ops[*],grep $1 /proc/diskstats |
head -1 | awk '{print $$8}'
UserParameter=custom.vfs.dev.write.ms[*],grep $1 /proc/diskstats |
head -1 | awk '{print $$11}'
UserParameter=custom.vfs.dev.io.active[*],grep $1 /proc/diskstats |
head -1 | awk '{print $$12}'
UserParameter=custom.vfs.dev.io.ms[*],grep $1 /proc/diskstats | head
-1 | awk '{print $$13}'
UserParameter=custom.vfs.dev.read.sectors[*],grep $1 /proc/diskstats |
head -1 | awk '{print $$6}'
UserParameter=custom.vfs.dev.write.sectors[*],grep $1 /proc/diskstats
| head -1 | awk '{print $$10}'
Once done, we need to restart the agent. We can now test the metric on the agent
side itself with:
[root@ localhost ~]# zabbix_get -s 127.0.0.1 -k custom.vfs.dev.
io.active[sda]
27
Now, let's define Item prototype using #SHORTDISKNAME, as shown in
the next screenshot:
[ 270 ]
Chapter 7
The {#SHORTDISKNAME} macro is used in the item's key, and, in the item's name,
we're going to use {#DISKNAME}. Note that the $1 macro from the script references
the first argument of the item's key. With the same process, we can create the
prototype for all the other registered items. When you configure a template's
discovery rules, there is no need to care about the actual values returned in their lists
or about the list's length. The only thing that you have to know is the name of the
macro that you can reference in your prototypes.
You can create them as regular template entities, such as Item prototype, Trigger
prototype, Graph prototype, and Host prototype, making sure you use the
discovery item macros where needed, and Zabbix will take care of the rest for you,
by creating as many items as there are elements in the list returned by the discovery
rule for each item prototype, as many triggers as there are elements in the list
returned for each trigger prototype, and so on. The following screenshot shows this:
[ 271 ]
Managing Templates
Host prototypes can be created with the low-level discovery rule, and then, when a
server is discovered, the prototypes become real hosts. It is important to know that
prototypes, before becoming discovered, cannot have their own items and triggers
other than those from the linked templates. When a host is discovered, the hosts will
belong to an existing host and will take the same IP of the existing host.
Summary
This chapter concludes the central part of the book, which is dedicated to developing
a deeper understanding of the Zabbix monitoring system's core functions. The
effective configuration and use of templates build on all the knowledge gained
from using and analyzing items, graphs and screens, triggers, and actions. To this
knowledge, this chapter has added a few template-specific aspects that should
help to tie all of the previous chapters together. From choosing what to monitor
and how to configure different item types, to putting together information-rich
visualization items, at this point in the book, you can perform all the tasks associated
with implementing and managing a monitoring system. You should also be able
to select the triggers and actions that are most significant in order to maximize the
expressiveness of your alerts, while avoiding false positives. Finally, you should not
have any problems bringing it all together through the use of macros and nested and
combined templates in order to apply a consistent and meaningful configuration to
a wide range of hosts and to further automate these operations through host-level
discovery actions and the low-level discovery facilities of Zabbix's templates.
The final part of the book will be about further customization options for Zabbix,
how to extend its functionality, and how to really integrate it with the rest of your IT
management systems in order to bring out its full power.
The next chapter will focus on writing extension scripts for Zabbix and its
monitoring protocol.
[ 272 ]
Handling External Scripts
Until now, you have learned how most of a server's components work and how to
leverage Zabbix to acquire data from various external sources. Considering that, set
up your monitoring system in a large, heterogeneous, and complex infrastructure.
Most probably, you will find a different custom device, server appliance, and
proprietary hardware. Usually, all those devices have an interface to be enquired, but,
unfortunately, it often happens that most of the metrics are not exposed via Simple
Network Management Protocol (SNMP) or any other standard query method.
Let's consider a practical example. Nowadays, all the UPSes own a temperature
sensor, and if you are in a complex infrastructure, it is possible that those UPS's are
custom made and out of standard, and, most probably, this sensor can be enquired
only with a tool provided from the UPS vendor. Now, the temperature of a UPS
is a critical parameter, especially if the UPS is a big, custom-made UPS. It is really
important to monitor these metrics.
Imagine that your cooling system is not working properly; receiving an alarm right
when the temperature reaches over the warning level is fundamental. On the other
hand, predicting the failure will save a lot of money. Also, even if the physical
damage is not really expensive, the downtime can cost a lot of money and have a
terrible impact on your business. A good example is the case of a trading company.
In this scenario, everything should be in perfect working order. In this environment,
there is terrible competition to achieve better performance against competitors—
buying a stock option some milliseconds before the others is a big advantage. Here, it
is easy to understand that, if servers are not performing well, it is already an issue; if
they are down, it is a complete disaster for the company. This example explains how
critical it is to predict a failure. Moreover, it is important to understand how critical it
is to retrieve all functioning parameters of your infrastructure. This is where Zabbix
comes to the rescue, providing interesting methods to retrieve data that interacts
with the operating system, eventually enabling you to use a command-line tool.
Zabbix's responses to this kind of requirement are as follows:
• External checks (server side)
[ 273 ]
Handling External Scripts
• UserParameter (agent side)
• Zabbix_sender: This binary can be used on both the agent side and the
server side
• A simple, efficient, and easy-to-implement communication protocol
This chapter will entirely explore those alternatives to interact with the operating
system and receive data from external sources. In this chapter, you will learn that
there isn't a general, optimal, valid solution for all the problems, but each of them
has its pros and cons. This chapter will make you aware of all the things that need to
be considered when you implement a custom check. The analysis proposed in this
chapter will enable you to choose the best solution for your problems.
This chapter will cover the following points:
• Writing a script and making it available as external scripts
• The advantages and disadvantages of scripts on the server side and on the
agent side
• Exploring alternative methods to send data to your Zabbix server
• Detailed documentation about the Zabbix protocol
• Commented educational implementation of the Zabbix sender protocol
External checks
Zabbix provides features to cover all the items that cannot be retrieved with the
standard agent. In real life, it is possible that you are not able to install the standard
agent on the device that you would like to monitor. A practical example is the UPS,
all the servers that, for some reason, cannot be compromised when installing external
software, or all the appliances that cannot have custom software installed.
Now, for all those reasons, you cannot have an agent on your device but you need to
monitor the vital parameters of this device, the only feasible solution for which is to
use an external check.
The script's placement
The script's location on Zabbix is defined in the zabbix_server.conf configuration
file. Since Zabbix Version 2.0, the default location has changed to /usr/local/
share/zabbix/externalscripts.
[ 274 ]
Chapter 8
The default location depends on the compile time from
the datadir variable. Actually, the default location is
${datadir}/zabbix/externalscripts. This rule is
valid for both proxy and server components.
Previously, it was defined as /etc/zabbix/externalscripts; anyway, you can
change it by simply specifying a different location on zabbix_server.conf using
the ExternalScripts parameter:
### Option: ExternalScripts
# Mandatory: no
# Default:
# ExternalScripts=${datadir}/zabbix/externalscripts
ExternalScripts=/usr/lib/zabbix/externalscripts
There are some important enhancements in external checks and scripts have been
introduced since Zabbix versions 2.2 and 2.4:
• The key syntax now supports multiple comma-separated parameters
• There is support for user macros in script commands
• User parameters, global scripts, and external checks now return the standard
error along with the standard output—this can be managed within your
trigger
• There is support for multiline values
Now, let's see how external checks work in detail.
Going deep into external checks
Now, it is time for a practical example. This is an easy example to understand how
an external script works. In the following example, we will count the number of open
files for a specified user. The first thing to do is create the script and place it in the
ExternalScripts location. The script will be called lsof.sh and will contain the
following code:
#!/bin/bash
if grep -q $1 /etc/passwd
then lsof -u $1 | tail -n +2 |wc -l
else
echo 0
fi
[ 275 ]
Handling External Scripts
This software requires the username as an input parameter; check whether the
username exists on the system, and then return the number of open files for
that account.
Now, you only need to create a new item of the External check type. In the Key
field, enter lsof.sh["postgres"], as shown in the following screenshot:
Now, on navigating to Monitoring | Latest Data, it is possible to see the data
retrieved by our script:
The external script must be come back in a reasonable time; otherwise, the item will
be marked as unsupported.
Until now, we've considered the case of a Zabbix server that
directly monitors a host using an external script. Bear in mind that
if your host is monitored via a Zabbix proxy, the script needs to be
placed on the proxy itself as the script must run from the proxy.
Now that you know how ExternalScripts works, it is time to see how we can
implement something more complex thanks to this feature.
In the next example, we will monitor certain remote Oracle instances. There are
some prerequisites to have this setup fully working: an Oracle client installed
with a working sqlplus, a tnsping, and an account configured on your Oracle
database target.
[ 276 ]
Chapter 8
The latest version of this software is available for download at http://www.
smartmarmot.com/product/check_ora.
Anyway, it is interesting to see how it evolved from Version 1.0. Version 1.0 is
available for download directly on the Zabbix forum at https://www.zabbix.com/
forum/showthread.php?t=13666.
This script is a good example of an external check. Basically, to have everything
properly configured, you need to do the following:
1. Create a user account on all your monitored databases.
2. Configure your Oracle client.
3. Decompress the package on your external script location.
4. Configure your database account at <EXTERNAL_SCRIP_LOCATION>/check_
ora/credentials.
5. Create a host with the same name as your database instance.
The last point is of particular importance and is a particular mode of using Zabbix.
This method can be reused every time you need to aggregate metrics that are not
tied to a real host but to a service. To do a practical example, if you have a DBMS that
can failover against another server, you can simply create a Zabbix fake host that is
called with the same name as that of your database. Now, if the services do failover,
you don't have an interruption on your collected data because the failover process
is transparent from the server that provides the service. This method is applied here
because the Oracle client will handle a failover automatically once properly configured.
Now, you can go ahead and create a host with the same name as that of your SID,
for example, you have an Oracle instance to monitor that is defined as ORCL on
tnsnames.ora; thus, the Zabbix host will be ORCL.
You can create hosts tied to the name of the service; this
enables you to abstract the service from the host that is
providing the service.
The detailed configuration of an Oracle client is out of the scope of this book. Once
you complete the configuration, you can test the script by simply running the
following command:
check_ora.sh[-i <instance> -q <query>]
[ 277 ]
Handling External Scripts
In the preceding command line, <instance> represents your instance name and
<query> is the query file that you would like to run. There is a large number of
query files prebuilt in the check_ora directory; you can check all of them against
your database.
The usage of Oracle SID or an Oracle instance name as the
hostname on Zabbix is really useful here. It can be expanded by
the {HOSTNAME} macro, so you can simply create a key such
as check_ora.sh [-i {HOSTNAME} –q query] on your
template, and it will be expanded across all your databases.
Now, in the Zabbix host, you need to create the item to retrieve the external check,
and the key will be as follows:
check_ora.sh[-i {HOSTNAME} –q <queryhere>]
For example:
key="check_ora.sh[-i {HOSTNAME} -q lio_block_changes]"
The template is available on the forum at the same location. Note that {HOSTNAME} is
expanded with the hostname, which, in our case, is exactly the Oracle instance name.
You can have a generalized template using the {HOSTNAME} macro, and their items
are propagated across all your databases' hosts.
Now, the life cycle of this item will be the following:
1. Zabbix calls the script.
2. The script will perform the following:
°°
Log in to the database
°°
Execute the query and retrieve the value
°°
Return the value on the standard output; Zabbix will receive the
value, and, if it is valid, it will be stored
Going inside the script
The core function of check_ora.sh is execquery(). The function is the following:
execquery () {
start_time=$(date +%s)
#
echo "Time duration: $((finish_time - start_time)) secs."
echo "BEGIN check_ora.sh $1 $2 `date`" >> /tmp/checkora.log
cd $SCRIPTDIR;
sqlplus -S $1 <<EOF | sed -e 's/^\ *//g'
[ 278 ]
Chapter 8
set echo off;
set tab off;
set pagesize 0;
set feedback off;
set trimout on;
set heading off;
ALTER SESSION SET NLS_NUMERIC_CHARACTERS = '.,';
@$2
EOF
finish_time=$(date +%s)
echo "END check_ora.sh $1 $2 `date`" >> /tmp/checkora.log
echo "check_ora.sh $1 $2 Time duration: $((finish_time - start_time))
secs." >> /tmp/checkora.log
}
This function will begin producing log information on /tmp/checkora.log:
start_time=$(date +%s)
#
echo "Time duration: $((finish_time - start_time)) secs."
echo "BEGIN check_ora.sh $1 $2 `date`" >> /tmp/checkora.log
Those are useful to understand which external check is ongoing and against which
database. Plus, in the log file, you will find the elapsed time for the whole operation:
finish_time=$(date +%s)
echo "END check_ora.sh $1 $2 `date`" >> /tmp/checkora.log
echo "check_ora.sh $1 $2 Time duration: $((finish_time - start_time))
secs." >> /tmp/checkora.log
}
Since this file is shared (between the check_ora.sh process) and the Zabbix calls are
not serialized, it is important to report the script-calling line twice so that you can
identify exactly which stating line corresponds to which finish line. Here, to avoid
any doubt, the elapsed is calculated and reported on the finish message.
After the script, call sqlplus:
sqlplus -S $1 <<EOF | sed
-e 's/^\ *//g'
Here, sed cleans up the white space at the beginning of the output. This is because
the returned data is a number that cannot begin with blank spaces; if that happens,
the item will become unsupported!
The following code snippet makes an Oracle client less verbose:
set echo off;
set tab off;
[ 279 ]
Handling External Scripts
set
set
set
set
pagesize 0;
feedback off;
trimout on;
heading off;
The preceding lines are important to avoid noise in the output. The following code
snippet explains the separator that should be used:
ALTER SESSION SET NLS_NUMERIC_CHARACTERS = '.,';
This section is important because you can have databases installed for different
reasons with different character sets. Also, the client can use a different separator for
decimals. You need to avoid all the uncontrolled charset conversions, and this is a
general rule. Finally, the script executes the query file in the following way:
@$2
EOF
The output is returned in a standard output and is collected from Zabbix.
General rules for writing scripts
This script covers all the critical points that you need to pay attention to:
• Don't introduce unwanted characters into the output
• Be aware of the type; so, if a number is expected, remove all the unneeded
characters (such as heading spaces)
• Avoid local conversions of numbers; the case of the dot and comma is
a good example
• Have a log, keeping in mind that external scripts are not serialized, so you
can have your log messages mixed in your log file
• Be aware of the time spent by the script from when the script is called until
the script provides the output
• Those scripts, of course, run with the Zabbix server user, so perhaps you
need to take care of file permissions and sudo privileges
Starting with Zabbix 2.4, the standard output is tied together
with the standard error; it is important to manage all the
exceptions and errors within the script.
[ 280 ]
Chapter 8
Remember that, if the requested script is not found or the Zabbix server has no
permissions to execute it, the item will become unsupported. Also, in the case of a
timeout, in both of the preceding cases an error message will be displayed and the
forked process for the script will be killed.
Considerations about external checks
In this section, you have seen how external checks can be executed and how a
complex task, such as database monitoring, is handled with them. If you have few
external checks to implement, this can be a feasible solution to retrieve metrics. This
kind of approach with externals checks, unfortunately, is not the solution to all the
problems. On the other hand, you need to consider that they are really resource
intensive and were once widely applied. Since external checks are on the server side,
it is better not to overload the Zabbix server.
Each ExternalScripts script requires the Zabbix server to
start a fork process; running many scripts can decrease Zabbix's
performance a lot.
The Zabbix server is the core component of your monitoring infrastructure, and you
can't steal resources from this server.
The user parameter
The simple thing to do is to avoid extensive resource usage by your script by placing
the script on the agent side. Zabbix provides an alternative method, and the script
should instead be on the server side and load the Zabbix server; it can be offloaded
to the agent side with UserParameter.
UserParameter is defined on the agent configuration file. Once it is configured, it
is treated in the same way as all the other Zabbix agent items by simply using the
key specified in the parameter option. To define a user parameter, you need to add
something similar to the following to the agent configuration file:
UserParameter=<key>,<shell command>
Here, key must be unique and the shell command represents the command to
execute. The command can be specified here inline and doesn't need to be a script, as
shown in the following example:
UserParameter=process.number, ps -e |wc -l
[ 281 ]
Handling External Scripts
In this example, the process.number key will retrieve the total number of processes
on your server.
With the same kind of approach, you can check the number of users currently
connected with the following code:
UserParameter=process.number, who |wc -l
The flexible user parameter
It is easy to understand that using this method you are going to define a large
number of entries inside the agent configuration file. This is not the right approach
because it is better to keep the configuration file simple.
Zabbix provides an interesting UserParamenter feature to avoid the proliferation
of those items on the agent side—the flexible user parameter. This feature is enabled
with an entry of this kind:
UserParameter=key[*],<shell command>
Here, key still needs to be unique, and the [*] term defines that this key accepts
the parameters. The content between the square brackets is parsed and substituted
with $1...$9; please note that $0 refers to the command itself. An example of
UserParameter can be the following:
UserParameter=oraping[*],tnsping $1 | tail -n1
This command will execute tnsping to your SID, passing it as $1. You can apply the
same method in the process to count specified users as follows:
UserParameter=process.number[*], ps -e |grep ^$1 | wc -l
Then, if we want to move to the agent side for the first script that returns the number
of open files for a defined user, the configuration will be the following:
UserParameter=lsof.sh[*],/usr/local/bin/lsof.sh $1
[ 282 ]
Chapter 8
Once this has been added, you only need to restart the agent. On the server side, you
need to switch the item Type to Zabbix agent and save it. The following screenshot
depicts this discussion:
With the same method, you can configure the check_ora.sh script to check the
database with the following code:
UserParameter=check_ora.sk[*],check_ora.sh –i $1 –q $2
On the Zabbix server side, you need to create an item of the Zabbix agent type or the
Zabbix agent (active) type, and on the key you need to specify:
check_ora.sk[<databasename> <query_to_execute>]
You can test UserParameter using the command line, as previously
described, or using the zabbix_get utility. With zabbix_get, you
don't need to wait to see data between the latest data, and it is easier
to debug what is happening on the agent side.
There are methods to test whether your UserParameter is working fine and the
agent is able to recognize it. The first one is with zabbix_get; for example, in the
case of losf.sh from the Zabbix server, we can use the following:
# zabbix_get -s 127.0.0.1 -p 10050 -k lsof.sh["postgres"]
2116
[ 283 ]
Handling External Scripts
The response is the result of the operation. Alternatively, we can log on to the
monitored host and run the following command:
#/usr/sbin/zabbix_agentd -t lsof.sh["postgres"]
lsof.sh[postgres][/usr/local/bin/lsof.sh postgres] [t|2201]
Again, this will display the output and the script that is called.
Considerations about user parameters
With UserParameter, you moved the script from the server side to the agent side.
The workload introduced by the script is now on the agent side, and you avoided
resource stealing on the server side. Another point to consider is that this approach
divides the workload between multiple servers. Obviously, each agent will monitor
the database present on its hosts.
The UserParameter parameters are really flexible. To enable them on the agent
side, you need to change the configuration file and restart the agent. Also, here
you need to be sure that the returned value is properly set; if it isn't properly set,
it will be discarded.
Now, between the cons, you need to consider the observer effect (discussed in
Chapter 1, Deploying Zabbix) introduced with this kind of monitoring. You need to
keep things as lightweight as possible, especially because the agent runs on the same
server that provides the service.
The usage of UserParameter implies that you need to distribute the scripts and the
relative updates across all your servers. In this example, where you want to monitor
Oracle, you need to consider how many different versions of operating systems
and software you need to handle. It is possible that in time, you will need to handle
a myriad of different flavors of your scripts and software. This myriad of scripts,
versions, and so on will force you to have centralized deployment, that is, all the
versions of the scripts are stored in a centralized repository. In addition, you need
to take care of the workload added by your scripts and, if they don't handle all the
possible exceptions well, this can be a really complex scenario to manage.
UserParamenter is really good, flexible, and sometimes indispensable to solve
some monitoring requirements, but is not designed for massive monitoring against
the same host. For all these reasons, it is time to explore another way to massively
monitor the items that Zabbix doesn't support natively.
[ 284 ]
Chapter 8
The following are certain very important points about external scripts and
UserParamenter:
• All pieces of input are passed as parameters to the script and should properly
be properly sanitized within the script to prevent command injection.
• All values are returned via STDOUT and should be in the format of the
expected return type. Returning nothing will cause the Zabbix server to flag
this item as unsupported.
• Make sure that all scripts terminate in a short period of time.
• Make sure that scripts do not share or lock any resources, or have any
other side effects, to prevent race conditions or incorrect interactions from
incurring multiple executions.
Sending data using zabbix_sender
Until now, you have seen how to implement external checks on both the server side
and the agent side, which involves moving the workload from the monitoring host to
the monitored host. You can understand how both methods in the case of heavy and
extensive monitoring are not the best approach since we are thinking of placing Zabbix
in a large environment. Most probably, it is better have a server dedicated to all our
checks and use those two functionalities for all the checks that are not widely run.
Zabbix provides utilities designed to send data to the server. This utility is zabbix_
sender, and with it, you can send the item data to your server using the items of a
Zabbix trapper type.
To test the zabbix_sender utility, simply add a Zabbix trapper item to an existing
host and run the command:
zabbix_sender -z <zabbixserver> -s <yourhostname> -k <item_key> -o
<value>
You will get a response similar to the following:
Info from server: "Processed 1 Failed 0 Total 1 Seconds spent 0.0433214"
sent: 1; skipped: 0; total: 1
You just saw how easy the zabbix_sender utility is to use. That said, now we can
dedicate a server to all our resource-intensive scripts.
[ 285 ]
Handling External Scripts
The new script
Now, we can change the script that has been previously used as an external check
and add UserParameter to a new version that sends traps to your Zabbix server.
The core part of the software will be as follows:
CONNECTION=$( grep $HOST\; $CONNFILE | cut -d\; -f2) || exit 3;
RESULT=$( execquery $CONNECTION $QUERY.sql);
if [ -z "$RESULT" ]; then
send $HOST $KEY "none"
exit 0;
fi
send $HOST $QUERY "$RESULT"
exit 0;
This code executes the following steps:
1. Retrieving the connection string from a file:
CONNECTION=$( grep $HOST\; $CONNFILE | cut -d\; -f2) || exit 3;
2. Executing the query specified into the $QUER.sql file:
RESULT=$( execquery $CONNECTION $QUERY.sql);
3. Checking the result of the query and if it is not empty, sending the value to
Zabbix; otherwise, the value is replaced with "none":
if [ -z "$RESULT" ]; then
send $HOST $KEY "none"
exit 0;
fi
send $HOST $KEY "$RESULT"
In this code, there are two main functions in play: one is the execquery() function
that basically is not changed, and the other is the send() function. The send()
function plays a key role in delivering data to the Zabbix server:
send () {
MYHOST="$1"
MYKEY="$2"
MYMSG="$3"
zabbix_sender -z $ZBX_SERVER -p $ZBX_PORT -s $MYHOST -k $MYKEY -o
"$MYMSG";
}
[ 286 ]
Chapter 8
This function sends the values passed by using a command line just as with the one
already used to test the zabbix_sender utility. The value sent on the server side will
have the corresponding item of the trapper kind, and Zabbix will receive and store
your data.
Now, to automate the whole check process, you need a wrapper that polls
between all your configured Oracle instances, retrieves the data, and sends it
to Zabbix. The wrapper acquires the database list and the relative credential to
log in from a configuration file, and you need to call your check_ora_sendtrap.sh
script recursively.
Writing a wrapper script for
check_ora_sendtrap
Since this script will run from crontab, as the first thing, it will properly set up the
environment to source a configuration file:
source /etc/zabbix/externalscripts/check_ora/globalcfg
Then, go down to the script directory. Please note that the directory structure has not
been changed for compatibility purposes:
cd /etc/zabbix/externalscripts
Then, it begins to execute all the queries against all the databases:
for host in $HOSTS; do
for query in $QUERIES; do
./check_ora_sendtrap.sh -r -i $host -q ${query%.sql} &
sleep 5
done;
./check_ora_sendtrap.sh -r -i $host -t &
sleep 5
./check_ora_sendtrap.sh -r -i $host -s &
done;
Note that this script executes all the queries and retrieves the tnsping time and the
connection time for each database. There are two environment variables that are
used to cycle between hosts and queries; they are populated with two functions:
HOSTS=$(gethosts)
QUERIES=$(getqueries)
[ 287 ]
Handling External Scripts
The gethost functions retrieve the database name from the configuration file:
/etc/zabbix/externalscripts/check_ora/credentials
gethosts () {
cd /etc/zabbix/externalscripts/check_ora
cat credentials | grep -v '^#' | cut -d';' -f 1
}
The getquery function goes down into the directory tree, retrieving all the query
files present:
getqueries () {
cd /etc/zabbix/externalscripts/check_ora
ls *.sql
}
Now, you only need to schedule the wrapper script on crontab by adding the
following entry to your crontab:
*/5 * * * * /etc/zabbix/externalscripts/check_ora_cron.sh
Your Zabbix server will store and graph data.
All the software discussed here is available on SourceForge at
https://sourceforge.net/projects/checkora released
on GPLv3 and at http://www.smartmarmot.com/.
The pros and cons of the dedicated
script server
With this approach, we have a dedicated server that retrieves data. This means you
do not overload the server that provides your service or the Zabbix server, and this is
really a good point.
Unfortunately, this kind of approach lacks flexibility, and in this specific case, all the
items are refreshed every 5 minutes. On the other hand, with the external checks or
UserParameter, the refresh rate can vary and be customized per item.
In this particular case, where a database server is involved, there is an observer
effect introduced by our script. The query can be as lightweight as you want, but to
retrieve an item, sqlplus will ask Oracle for a connection. This connection will be
used only for a few seconds (the time needed to retrieve the item), after which the
connection is closed. All this workflow basically lacks connection pooling. Using
connection pooling, you can perceptibly reduce the observer effect on your database.
[ 288 ]
Chapter 8
Reducing the overhead with connection pooling is a general
concept, and it is not tied with a vendor-specific database.
Databases, in general, will suffer if they are hammered with
frequent requests for a new connection and a close connection.
Pooling the connection is always a good thing to do in general. To better understand
the benefit of this methodology, you can consider a complex network with a path
that crosses different firewalls and rules before arriving at a destination; this is
the clear advantage to have a persistent connection. To have a pool of persistent
connections kept valid with keep-alive packed reduces the latency to retrieve
the item from your database and, in general, the network workload. Creating a
new connection involves the approval process of all the firewalls crossed. Also,
you need to bear in mind that, if you are using Oracle, first a connection request
is made against the listener that will require a callback once accepted and so on.
Unfortunately, connection pooling can't be implemented with the shell components.
There are different implementations of connection pooling, but before we go deep
into the programming side, it is time to see how Zabbix protocols work.
Working with Zabbix protocols
Zabbix protocols are quite simple; this is a strong point because it is simple to
implement your own custom agent or software that sends data to Zabbix.
Zabbix supports different versions of protocols. We can divide the protocols into
three families:
• Zabbix get
• Zabbix sender
• Zabbix agent
The Zabbix get protocol
The Zabbix get protocol is really simple and easy to implement. Practically, you only
need to send data to your Zabbix server at the port 10050.
This protocol is so simple that you can implement it with a shell script as well:
This is a textual protocol and is used to retrieve data from the agent
directly. [root@zabbixserver]# telnet 127.0.0.1 10050
Trying 127.0.0.1...
Connected to 127.0.0.1.
Escape character is '^]'.
[ 289 ]
Handling External Scripts
agent.version
ZBXD2.0.6Connection closed by foreign host.
This example shows you how to retrieve the agent version simply with a telnet.
Please note that the data is returned with a header that is ZBXD, followed by the data
that represents the actual response 2.0.6.
This simple protocol is useful to retrieve data directly from the agent installed into
our server and use it in a shell script.
This protocol is useful to identify the agent version without logging on to the server
and to check all the instances of UserParameter defined against an agent.
The Zabbix sender protocol
The Zabbix sender protocol is a JSON-based protocol. The message composition is
the following:
<HEADER><DATA_LENGTH><DATA>
The <HEADER> section is of 5 bytes, and it is in the form ZBXD\x01. Actually, only
the first 4 bytes are the header; the next byte is used to specify the protocol version.
Currently, only Version 1 is supported (0 x 01 HEX).
The <DATA_LENGTH> section is 8 bytes in length and in the hex format. So, for
instance, 1 is formatted as 01/00/00/00/00/00/00/00, an 8-byte (or 64-bit) number
in the hex format.
It is followed by <DATA>. This section is expressed in the JSON format.
From version 2.0.3, Zabbix can receive only 128 MB of data to
prevent the server from running out of memory. This limit has
been added to protect the server from crashes caused by a large
amount of data input.
To send the value, the JSON message needs to be in the following form:
<HEADER><DATALEN>{
"request":"sender data",
"data":[
{
"host":"Host name 1",
"key":"item_key",
"value":"XXX",
"clock":unix_time_format
[ 290 ]
Chapter 8
},
{
"host":"Host name 2",
"key":"item_key",
"value":"YYY"
}
],
"clock":unix_time_format
}
In the previous example, as you can see, multiple items are queued on the same
message if they come from different hosts or are referred to as different item keys.
The "clock" term is optional in this protocol and can be omitted
on the JSON object as well as at the end of the data section.
Once all the items are received, the server will send back the response. The response
has the following structure:
<HEADER><DATALEN>{
"response":"success",
"info":"Processed 6 Failed 1 Total 7 Seconds spent 0.000283"
}
This example reports a response message; the following are some considerations:
• The response has a status that can be [success|failure] and refers to the
whole transmission of your item list to the Zabbix server.
• It is possible, as shown in this example, that some of the items failed. You
simply receive a notification and you can't do much more than notify and
write this status in a log file.
It is important to keep track of the time spent to send
your item list because if this value becomes high or has a
detectable variation, it means that our Zabbix server suffers
on receiving items.
[ 291 ]
Handling External Scripts
Unfortunately, this protocol does not give you feedback on which items failed and
the reason for failure. At the time of writing this, there are two requested features
that are still pending:
• To have a more readable output, visit https://support.zabbix.com/
browse/ZBXNEXT-935
• To identify the failed items, visit https://support.zabbix.com/browse/
ZBXNEXT-246
Now you know how the Zabbix sender protocol works on version 1.8 and higher.
Another issue is that the Zabbix sender protocol until now doesn't support any
kind of encryption, which can cause an issue in the case of sensitive data that is sent
in clear text. We also need to consider the case of a hacker who would like to hide
his activity behind a large number of alarms or triggers on fire. With this protocol,
the hacker can easily send a false alarm in order to set the trigger on fire and then
proceed with his activity unnoticed.
Fortunately, this feature has now been taken into consideration, and the team is
working on an SSL version or, better, a TLS version.
For more information, you can have a look at the ticket at https://support.
zabbix.com/browse/ZBXNEXT-1263.
An interesting undocumented feature
There is an interesting sender's feature that is not widely known and not well
documented. While going deep into protocol analysis, the first thing to do is read the
official documentation, and the second is to check how Zabbix will implement it; it is
possible that not all the minor changes are updated in the documentation.
Then, looking into the zabbix_sender code, you can find the section where the
protocol is implemented:
zbx_json_addobject(&sentdval_args.json,
zbx_json_addstring(&sentdval_args.json,
ZBX_JSON_TYPE_STRING);
zbx_json_addstring(&sentdval_args.json,
JSON_TYPE_STRING);
zbx_json_addstring(&sentdval_args.json,
value, ZBX_JSON_TYPE_STRING);
[ 292 ]
NULL);
ZBX_PROTO_TAG_HOST, hostname,
ZBX_PROTO_TAG_KEY, key, ZBX_
ZBX_PROTO_TAG_VALUE, key_
Chapter 8
The preceding code snippet implements the Zabbix JSON protocol and, in particular,
this section:
"host":"Host name 1",
"key":"item_key",
"value":"XXX",
Until here, the protocol has been well documented. Right after these lines there are
interesting sections that add one more property to our JSON item.
if (1 == WITH_TIMESTAMPS)
zbx_json_adduint64(&sentdval_args.json, ZBX_PROTO_TAG_CLOCK,
atoi(clock));
Here, a timestamp is provided within the item and is added as a property of the
JSON object, after which the item is closed as follows:
zbx_json_close(&sentdval_args.json);
The clock is defined as an unsigned int64 variable.
This is a really important property because, if you write your own zabbix_sender,
you can specify the timestamp of when the item has been retrieved.
The important thing is that by testing this section, Zabbix stores the clock time of
when the item has been retrieved at the specified clock time on the database.
Using the clock properties in JSON items
Now this property can be used to optimize your sender. Zabbix supports 128 MB of
data for a single connection. Of course, it is better to be far from that limit because if
we reach that limit, it is a sign that our implementation is not well done.
The clock feature can be used in two scenarios:
• If buffer items need to be sent and if they are sent inside a single connection
in bursts
• If the server is not available, you can cache and send the item later
The first usage of this feature is clearly an optimization to keep the whole
communication as lightweight as possible, and reducing the number of connections
against our Zabbix server can prevent issues.
[ 293 ]
Handling External Scripts
The second way to enable this is to implement a robust sender, which can handle a
Zabbix server downtime and preserve your item in a cache, ready to be sent once
the server is backed up and running. Please be aware not to flood the server if it is
not reachable for a long period of time. Manage the communication by sending a
reasonable number of items and not a long trail of items.
The Zabbix agent protocol
This protocol is a bit more complex because it involves more phases and the dialogue
is more articulated. When an active agent starts, the first thing it does is connect to
the server and ask for a task to perform, in particular, which item is to be retrieved
and the relative timing.
Also, in the following code, the form of the protocol is the same as used previously:
<HEADER><DATA_LENGTH><DATA>
The <HEADER>, <DATA_LENGTH>, and <DATA> tags are as explained in the previous
section.
The dialogue begins when the agent sends the following request to the server:
<HEADER><DATALEN>{
"request":"active checks",
"host":"<hostname>"
}
With this kind of request, the agent is going to ask for a specified hostname in the
active checklist. The server response will, for instance, be as follows:
<HEADER><DATALEN>{
"response":"success",
"data":[{
"key":"log[\/var\/log\/localmessages,@errors]",
"delay":1,
"lastlogsize":12189,
"mtime":0
},
{
"key":"agent.version",
"delay":"900"
}]
"regexp":[
{
"name":"errors",
"expression":"error",
[ 294 ]
Chapter 8
"expression_type":0,
"exp_delimiter":",",
"case_sensitive":1
}]
}
The Zabbix server must respond with success, followed by the list of items and the
relative delay.
In the case of log and logrt items, the server should
respond with lastlogsize. The agent needs to know this
parameter to continue the work. Also, mtime is needed for
all the logrt items.
"regexp", which, in this example, is the response back to the agent, will exist only if
you have defined global or regular expressions. Note that if a user macro is used, the
parameter key is resolved and the original key is sent as key_orig. The original key
is the user macro name.
Once the response is received, the agent will close the TCP connection and will
parse it. Now, the agent will start to collect the items at their specified period. Once
collected, the items will be sent back to the server:
<HEADER><DATALEN>{
"request":"agent data",
"data":[
{
"host":"HOSTNAME",
"key":"log[\/var\/log\/localmessages]",
"value":"Sep 16 18:26:44 linux-h5fr dhcpcd[3732]: eth0: adding default
route via 192.168.1.1 metric 0",
"lastlogsize":4315,
"clock":1360314499,
"ns":699351525
},
{
"host":"<hostname>",
"key":"agent.version",
"value":"2.0.1",
"clock":1252926015
}
],
"clock":1252926016
}
[ 295 ]
Handling External Scripts
While implementing this protocol, make sure to send back
lastlogsize for all the log-type items and mtime for the
logrt items.
The server will respond with:
{
"response":"success",
"info":"Processed 2 Failed 0 Total 2 Seconds spent 0.000110"
}
Also, there is a possibility that some items have not been accepted, but, currently,
there isn't a way to know which ones they are.
Some more possible responses
To complete the protocol description, you need to know that there are some
particular cases to handle:
• When a host is not monitored
• When a host does not exist
• When the host is actively monitored but there aren't active items
In the first case, when a host is not monitored, the agent will receive the following
response from the server:
<HEADER><DATALEN>{
"response":"failed",
"info":"host [Host name] not monitored"
}
In the second case, when the host does not exist, the agent will receive the following
response:
<HEADER><DATALEN>{
"response":"failed",
"info":"host [Host name] not found"
}
In the last case, when the host is monitored but does not have active items, the agent
will receive an empty dataset:
<HEADER><DATALEN>{
"response":"success",
"data":[]
}
[ 296 ]
Chapter 8
The low-level discovery protocol
The low-level discovery protocol provides an automated way to create items,
triggers, and graphs for different entities on a computer. For instance, Zabbix can
automatically start monitoring filesystems or network interfaces on your machine
without the need to create items for each filesystem or network interface manually.
Actually, the results found thanks to the discovery can trigger many different
actions, such as even removing unneeded entities such as items and so on. This
functionality gives a lot of flexibility to our monitoring system. Zabbix, indeed, lets
you customize and create a brand-new low-level discovery rule to discovery any
type of Zabbix entity.
Let's see which one is the output used by a low-level discovery item such as vfs.
fs.discovery. To see the output, we can simply run the following command:
$ zabbix_get –s 127.0.0.1 –k vfs.fs.discovery
{"data":[
{"{#FSNAME}":"/","{#FSTYPE}":"rootfs"},
{"{#FSNAME}":"/proc","{#FSTYPE}":"proc"},
{"{#FSNAME}":"/sys","{#FSTYPE}":"sysfs"}
…
]}]
Here, we've reduced the output; anyway, as you can see, the output is easy
to understand. First of all, this is a JSON-formatted output and is mostly in
key-value format.
Then, as we saw in Chapter 7, Managing Templates, we can create all the scripts we
need to properly automate the discovery of entities that need to be monitored.
Of course, every agent-side script must be registered as UserParameter of
zabbix_agent.conf. Otherwise, if it is a server-side global script, it must be
deployed in ExternalScriptspath that you've configured in zabbix_server.conf.
Let's see another example of a low-level discovery script that can be reused and will
be useful to map all the open ports across your network. As we discussed in Chapter 7,
Managing Templates, we need to have a JSON-formatted output with the port open and
the relative protocol. To acquire this information, we can use nmap. To install nmap on
Red Hat, you need to run the following command from root:
$ yum install nmap
[ 297 ]
Handling External Scripts
This will install the only external component that we require. Now, to map all the
open ports on a server, the best option is to run the script from the Zabbix server as
it is possible that those ports are opened locally but hidden behind a firewall and are
not accessible from our Zabbix server. Then, if we cannot reach them, we can't even
monitor them. A command to run a quick port scan uses the –T<0-5> option, which
sets the timing template (a higher number means a faster template). In this script, we
are using the option –T4, followed by the –F (fast mode) option:
#!/bin/sh
#Start with JSON Header
echo '{'
echo ' "data":['
PORTS=( $(nmap -T4 -F ${1} | grep 'open' | cut -d" " -f1 ) )
COUNTER=${#PORTS[@]}
for PORT in "${PORTS[@]}"; do
COUNTER=$(( COUNTER - 1))
if [ $COUNTER -ne 0 ]; then
echo ' { "{#PORT}":"'$(echo $PORT| cut -d/ -f1)}'",
"{#PROTO}":"'$(echo $PORT| cut -d/ -f2)'" },'
else
#it's the last element.
#To have valid JSON We don't add a trailing comma
echo ' { "{#PORT}":"'$(echo $PORT| cut -d/ -f1)}'",
"{#PROTO}":"'$(echo $PORT| cut -d/ -f2)'" }'
fi
done
#End with JSON footer
echo ' ]'
echo '}'
The script running a port scan against the IP address specified will retrieve all the
open ports that are not firewalled and the relative protocol. The output that the script
produces is the following:
# ports_ldd.sh 192.168.1.1
{
"data":[
{ "{#PORT}":"22}", "{#PROTO}":"tcp" },
{ "{#PORT}":"25}", "{#PROTO}":"tcp" },
{ "{#PORT}":"53}", "{#PROTO}":"tcp" },
{ "{#PORT}":"80}", "{#PROTO}":"tcp" },
{ "{#PORT}":"111}", "{#PROTO}":"tcp" },
{ "{#PORT}":"631}", "{#PROTO}":"tcp" },
[ 298 ]
Chapter 8
{ "{#PORT}":"3306}", "{#PROTO}":"tcp" },
{ "{#PORT}":"5432}", "{#PROTO}":"tcp" }
]
}
This is the kind of output that we are expecting and, as you can see, is ready to be
used. Of course, the script must be placed in your ExternalScripts location. Then,
we can start creating the new Discovery rule tab, as shown in the following screenshot:
This will make the two variables {#PORT} and {#PROTO} ready to be used inside the
prototypes. Let's create the Item prototype with the following properties:
• Name: Status of port {#PORT}/{#PROTO}
• Type: Simple check
• Key: net.tcp.service[{#PROTO},,{#PORT}]
• Type of information: Numeric (unsigned)
• Data type: Boolean
[ 299 ]
Handling External Scripts
This is shown in the following screenshot:
Then, we need to create the relative trigger prototype with the following information:
• Name: {#PROTO} port {#PORT}
• Expression: {Template_network:net.tcp.service[{#PROTO},,{#PORT}].
last(0)}=0
With this kind of configuration, the discovery will do all the jobs for you, will find all
the open ports that are reachable on a server, and will create the item and the relative
trigger that will go on fire once the port is not accessible.
Here, we are considering the case that you want to monitor
all the services available on a server and then the trigger will
send you an alarm if the port is not reachable. It is important to
consider even the other case, where you're in a DMZ and you
want to have a trigger if, for some reason, a service is reachable.
One typical example is the database listener port, which should
be accessible only within the DMZ and not from outside it.
[ 300 ]
Chapter 8
This is just an example of automation, a simple one actually, but we can push the
automation more. You can consider a network where you have a well-defined
domain of services and you know the daemon in use or where at least the daemon
banner is not changed to hide the service identity. In this case, a useful discovery
customization would find all the open ports and, once the service behind them is
identified, apply the relative template to the monitored server. For instance, we can
think of port 80 as open, with an Apache service behind it, and then apply an Apache
template ad hoc made to the host. This would definitely automate and reduce the
initial startup cost and time.
Communicating with Zabbix
Now you know how the Zabbix protocol works, so it is time to see some code that
implements this protocol. To keep things easy, we have described an example of the
zabbix_sender protocol—the simplest way to send data to Zabbix.
Zabbix uses JSON to describe the object contained in the data. There are a lot of
efficient JSON libraries that can be used, but to make things easier here, those
libraries will not be used.
Implementing the Zabbix_sender protocol
in Java
Here, you will see a really simple implementation of the zabbix_sender protocol
that, as you know, is the easy way to send traps to Zabbix.
The piece of code that follows has been kept as simple as possible, and the scope
is to provide an example from which you can start to develop your own Zabbix
monitoring component:
private String buildJSonString(String host, String item,Long
timestamp, String value){
return "{"
+ "\"request\":\"sender data\",\n"
+ "\"data\":[\n"
+
"{\n"
+
"\"host\":\"" + host + "\",\n"
+
"\"key\":\"" + item + "\",\n"
+
"\"value\":\"" + value.replace("\\", "\\\\") +
"\",\n"
+
"\"clock\":" + timestamp.toString()
+
"}]}\n" ;
}
[ 301 ]
Handling External Scripts
This piece of code simply returns the JSON message to send it as a body. You only
need to provide the host and item or, better, the item key, value, and timestamp to
include into the message, and it will return a JSON-formatted string object.
Now, once you have retrieved all your item values, you simply need to generate
the JSON message, open a connection, and send the message. To open a connection
against your Zabbix server, we can use the following lines of code:
String data = buildJSonString( host,item,value);
zabbix = new Socket(zabbixServer, zabbixPort);
zabbix.setSoTimeout(TIMEOUT);
out = new OutputStreamWriter(zabbix.getOutputStream());
int length = data.length;
In this code, as you see the program open a socket, define the timeout, and retrieve
the message length, it is now ready to send the message. Please remember that the
message is composed with <HEADER><DATALEN><MESSAGE>. A simple way to send
the header and the data length is the following:
out.write(new byte[] {
'Z', 'B', 'X', 'D',
'\1',
(byte)(length & 0xFF),
(byte)((length >> 8) & 0x00FF),
(byte)((length >> 16) & 0x0000FF),
(byte)((length >> 24) & 0x000000FF),
'\0','\0','\0','\0'});
This portion of code writes the message on the socket that actually contains the host,
item, and value:
out.write(data);
Remember to flush the data, close the socket, and complete the delivery as follows:
out.flush();
out.close();
Now, we need to see what the Zabbix server will say about our item:
in = zabbix.getInputStream();
final int read = in.read(response);
String respStatus = (String) getValue(response);
if (read !=2 || respStatus.equals(ZBX_SUCCESS)) {
in.close();
}
[ 302 ]
Chapter 8
If the response is that of a success, you can close InputStream.
This example is fully working, but it is only for educational purposes. There are
different things to improve before considering it ready for production. Anyway,
this is a good starting point. This example can be extended by handling multiple
JSON objects on the data section, thus increasing the number of objects passed per
connection. You need to limit the connection numbers and avoid flooding your
Zabbix server with connections just to send an item. Items can be buffered and sent
together; for instance, if you have a group of items with the same schedule, all of
them can be sent together.
When you retrieve your items, it is important to keep track of the timestamps. To do
so, you can add the timestamp to your item and know when it has actually retrieved
this metric.
In the previous example, the timestamp is not sent since it is optional, but it is a good
practice to include it, especially if you're buffering an item; when you send it, the
items will have the right timestamp.
Implementing the Zabbix sender protocol in
Python
Nowadays, a lot of applications are written in Python, and it is a programing
language that is widely diffused and known. For this reason, this is an example
of a fundamental threat that can be the starting point for your custom zabbix_
sender in Python. This piece of code can be extended and integrated directly into
your software. Having a functionality integrated into the application can be really
interesting because the application itself can send its health status to your Zabbix
server. Now, it is time to take a look at the piece of code and how it works.
First, you need to define the structure and import simplejson used here to add the
host, key, item value, and clock in the JSON format:
import simplejson as smplj
items_data = []
Now, retrieve the timestamp from the items; if it is null, we will get the current
timestamp:
clock = zbxit.clock or time.time()
[ 303 ]
Handling External Scripts
Now, you can begin to create the JSON object to include it in the Zabbix message:
items_data.append(('\t\t{\n'
'\t\t\t"host":%s,\n'
'\t\t\t"key":%s,\n'
'\t\t\t"value":%s,\n'
'\t\t\t"clock":%s}') % (smplj.dump(zbxit.
host), smplj.dump(zbxit.key), smplj.dump(zbxit.value), clock))
Now that your item has been transformed into a JSON object, it is time for
the header:
json_items = ('{\n'
'\t"request":"sender data",\n'
'\t"data":[\n%s]\n'
'}') % (',\n'.join(items_data))
The next step is to retrieve the length of our message to add it on the header:
data_len = struct.pack('<Q', len(json_items))
As previously discussed, here the message is put on the form
<HEADER><DATALEN>+<JSON ITEM> as follows:
packet = 'ZBXD\1' + data_len + json_items
Then, the socket is going to be open and the packet will be sent:
zabbix = socket.socket()
zabbix.connect((zabbix_host, zabbix_port))
zabbix.sendall(packet)
Once the packet has been sent, it is time to retrieve the Zabbix server response:
resp_hdr = _recv_all(zabbix, 13)
Next check whether it is valid:
if not resp_hdr.startswith('ZBXD\1') or len(resp_hdr) != 13:
return False
resp_body_size = struct.unpack('<Q', resp_hdr[5:])[0]
resp_body = zabbix.recv(resp_body_size)
zabbix.close()
resp = smplj.loads(resp_body)
if resp.get('response') != 'success':
return False
return True
This piece of code is a good starting point to develop the Zabbix sender protocol
in Python.
[ 304 ]
Chapter 8
Some considerations about agent
development
Now, you probably don't see when to begin the development of your software that
sends a trap to Zabbix. But before beginning to write the code, it is fundamental to
keep in mind the requirements and the problem.
Until now, you have two examples, and you can easily start to send a trap to the
Zabbix server even if they are not completely engineered components.
As the first point, it is important to understand whether it is only needed to send the
data to Zabbix at a specified time schedule that is not directed from the Zabbix server.
Those two pieces of code implement the Zabbix sender protocol, but the frequency
with which the items are retrieved and sent can't be defined from the Zabbix server.
Here, it is important to keep in mind who will drive your software. Is it the Zabbix
server or your software? To enable Zabbix to drive the sampling frequency, you need
to implement the Zabbix agent protocol. The agent protocol is a bit more articulated
and a bit more complex to implement. Anyway, the two examples proposed have all
the components needed to properly handle the agent protocol.
There is another point to consider. Usually, developers have their own preference for
a programming language. Here, it is important to use the right instrument to solve
the problem. A practical example would be to monitor your Oracle database. So,
your software will need to interact with commercial software; the easy and logical
choice is to use Java. Now, all the Python fans will stick up their nose! Here, more
than the preference, it is important keep in mind what is better supported from the
monitored entity.
Oracle and databases in general produce standard industry-engineered drivers
for Java to interact with them. Most of the database vendors provide and, more
importantly, update, fix, and develop their JDBC drivers continuously. It is better to
delegate a bit of work to vendors. Also, they know their products better, and you can
get assistance on that.
Java has a lot of well-engineered components that will make your life easy in the
difficult task of monitoring a database. For instance, the JDBC framework, together
with the database driver, will provide efficient connection pooling that can be
configured to:
•
•
•
•
Handle a minimum number, and a maximum number, of connections
Validate the connection before using it for your software
Send a keep-alive packet (useful to avoid firewall issues)
Handle a reap time, removing all the idle connections (reducing the total
number of connections on the monitored server)
[ 305 ]
Handling External Scripts
Those are only a few of the points covered by JDBC. All these points will help you to
keep the monitoring lightweight and efficient.
An example of software made to monitor databases in general is
DBforBIX available at http://sourceforge.net/projects/
dbforbix/ or http://www.smartmarmot.com/product/
dbforbix/.
Summary
In this chapter, we introduced you to the all the possible ways that will help you
to interact with the server, thus enabling Zabbix to acquire items and metrics that
are otherwise unsupported. In this chapter, we saw the steps required to move the
Oracle monitoring script from the server side to the client side and then to its final
destination—the dedicated server. Here, you learned how a simple script grows until
it becomes a complex external software. In each step, you saw the progress and an
analysis of the pros and cons of each location that the script passed. This does not
mean that you need a dedicated server for all your checks, but if your monitoring of
the script is widely and extensively used, then it is a good practice. For each location
passed, you saw the positive side and the negative side of that particular placement.
Now, you have a global vision of what can be done and which is the right place or
point to act. Now, the Zabbix protocols have no more secrets, and you can extend
Zabbix ideally without any limits.
In the next chapter, you will learn how to interact with Zabbix using the API. The
next chapter will explain how you can take advantage of the Zabbix API for massive
deployments of hosts and users, and massive and repetitive operations in general.
[ 306 ]
Extending Zabbix
Understanding the Zabbix monitoring protocol allows us to write scripts, agents,
and custom probes. In other words, it allows us to freely extend Zabbix's monitoring
capabilities by expanding its means to collect data.
When it comes to actually controlling and administrating its monitoring objects,
though, the only point of access that we have mentioned until now is the web
frontend. Whether you need to add a user, change the sampling frequency of an item,
or look at historical data, you always need to use the frontend as a user interface.
This is certainly a convenient solution for day-to-day activities as all you need to
have is access to a simple browser. The frontend itself is also quite powerful and
flexible as you can conveniently perform mass operations on many objects of the
same type and control different proxies from the same spot.
On the other hand, not every large and complex operation can be performed
conveniently through a web application, and sometimes, you don't need to just
visualize data, but you need to export it and feed it to other programs in order to
further analyze it. This is where the Zabbix API comes in. As you will learn in this
chapter, Zabbix's JSON-RPC API provides all the functions available to the frontend,
including user management, monitoring configurations, and access to historical data.
In the following pages, we will cover the following topics:
• Writing code to connect to the API and make queries through it
• Creating custom operations to manage your installation
• Writing complex and conditional mass operations
• Exporting monitoring data in a number of different formats
Let's start with a look at the general API architecture and the way to set up your code
in order to interact with it.
[ 307 ]
Extending Zabbix
Exploring the Zabbix API
Zabbix provides an entry point to interact with, manipulate, configure, and create
objects in Zabbix. This API is available through its PHP frontend at http://<yourzabbix-server>/zabbix/api_jsonrpc.php.
The communication protocol is JSON-based, and the medium used is obviously
HTTP/HTTPS.
Zabbix's JSON-RPC API provides a nice interface and exposes a lot of functionalities.
Once authenticated, it will allow you to perform any kind of operation on Zabbix
objects. Now, if you need to configure Zabbix in a large or very large network, this
Zabbix API can be really useful. As a practical example, you can consider that you
may need to add a large number of devices that, most probably, are already defined
in a separate document. The API provides the entry point to add all of them in
Zabbix by simply using a dedicated script.
The Zabbix API was introduced with Zabbix Version 1.8 and went through changes
up until the current Version 2.4. This version can be considered more stable and
mature, but it is still officially in the draft state, so things may change a little in
the future versions. This does not mean that it's not suitable for a production
environment; on the contrary, the bigger the installation, the more beneficial can be
the usage of the API to script for complex and time-consuming operations.
The following code is a simplified JSON request to the Zabbix API:
{
"jsonrpc": "2.0",
"method": "method.name",
"params": {
"param_1_name": "param_1_value",
"param_2_name": "param_2_value"
},
"id": 1,
"auth": "159121ba47d19a9b4b55124eab31f2b81"
}
The following points explain what the preceding lines of code represent:
• "jsonrpc": "2.0": This is a standard JSON PRC parameter that is used to
identify the protocol version; this will not change across your requests.
• "method": "method.name": This parameter defines the operation that
should be performed; for instance, it can be host.create or item.update.
[ 308 ]
Chapter 9
• "params": This specifies the parameter needed by the method in JSON. Here,
if you want to create an item, the most common parameters will be "name"
and "key_".
• "id": 1: This field is useful to tie a JSON request to its response. Every
response will have the same "id" provided in the request. This "id" is useful
when you are going to send multiple requests at once if those requests don't
need to be serialized or be sequential.
• "auth": "159121ba47d19a9b4b55124eab31f2b81": This is the
authentication token used to identify an authenticated user; for more details,
refer to the next section.
For a detailed description of all the possible parameters and
methods, refer to the official Zabbix documentation available
at https://www.zabbix.com/documentation/2.4/
manual/appendix/api/api.
Now, it is important to remember that the whole communication usually is on HTTP.
This is something to consider if we interact with Zabbix from our workstation or
from a different network location. To interact with the Zabbix API, the first thing you
need is authentication by the server, and here, it is clear how important it is to have
the whole communication encrypted and to use a secured channel. There are two
different exposures for you to consider:
• Use https instead of http; otherwise, the whole authentication will be in the
clear format and readable
• Be aware of the sensitivity of the data being transmitted
Now, it is time to perform the first step here with the API. The step you can do is ask
the version after the authentication.
First steps through the API
The first thing we can do is start interacting with the Zabbix API. Since the API
requires POST to better understand the protocol, we will use curl.
With curl, you can quickly and easily transfer data from/to a service using different
protocols, and here, we use HTTP in this first example; even if the channel is not
secure, it is not a problem as we're simply asking the Zabbix version and as we are
not yet logging in or receiving sensitive data.
$ curl --include --netrc --request POST --header "Content-Type:
application/json" http://127.0.0.1/zabbix/api_jsonrpc.php –d @[ 309 ]
Extending Zabbix
Between the options, we set the Content-Type header as JSON and enable curl
to receive data from the standard input with -d@-. Once this is done, paste the
following JSON envelope:
{
"jsonrpc":"2.0",
"method":"apiinfo.version",
"id":1,
"auth":null,
"params":{}
}
Take care to close the standard input with Crtl + D.
Now, let's see the response:
HTTP/1.1 200 OK
Date: Sat, 04 Jul 2015 06:32:36 GMT
Server: Apache/2.2.15 (CentOS)
X-Powered-By: PHP/5.3.3
Access-Control-Allow-Origin: *
Access-Control-Allow-Headers: Content-Type
Access-Control-Allow-Methods: POST
Access-Control-Max-Age: 1000
Content-Length: 41
Connection: close
Content-Type: application/json
{"jsonrpc":"2.0","result":"2.4.5","id":1}
After the standard HTTP header of the response, we can see the result of our query,
that is, the Zabbix version "result":"2.4.5".
Please bear in mind that the apiinfo.version method has
been introduced with Zabbix 2.0.4. If you're working with an
old version of Zabbix, it might not be supported.
Authenticating through the API
Here, we discuss an example in a nutshell because this will show us how simple
communication is; later, we will analyze an example with Python since it is widely
used for rapid application development.
[ 310 ]
Chapter 9
To test the authentication from our shell, we can use curl once again. Here, since we
are going to authenticate our application to the Zabbix server, it is important to use
a secured connection and then https. For this test, you can log on to your Zabbix
server and write the following command:
$ curl --insecure --include --netrc --request POST --header "ContentType: application/json" https://127.0.0.1/zabbix/api_jsonrpc.php –d@-
Note that --insecure specifies to curl not to verify the server certificate. This
option produces a less secure connection, but since we are the localhost, it is
acceptable and will avoid a lot of certificate issues. Working on a practical example
without --insecure, curl will respond with the following error:
curl: (60) Peer certificate cannot be authenticated with known CA
certificates
More details here: http://curl.haxx.se/docs/sslcerts.html
Once this command is run, you can paste the following JSON envelope:
{
"jsonrpc": "2.0",
"method": "user.login",
"params": {
"user": "Admin",
"password": "my secret password"
},
"auth": null,
"id": 0
}
Take care to replace the "password" properties with your own password, and then
you can close the standard input using Crtl + D.
curl will take care to manage the whole HTTPS connection and will return the
server's full HTTP response. In this case, we are interested in the authentication
token that follows the standard web server response:
HTTP/1.1 200 OK
The remaining output is as follows:
Content-Type: application/json
{"jsonrpc":"2.0","result":"403bbcdc3c01d4d6e66f68f5f3057c3a","id":0}
[ 311 ]
Extending Zabbix
This response contains the token that we need to use for all the following queries on
the Zabbix server.
The token will expire according to the auto-logout option
set for the user who is authenticating.
Now, to see how all this work, we can use curl again:
# curl --insecure --include --netrc –request POST --header "Content-Type:
application/json" https://127.0.0.1/zabbix/api_jsonrpc.php –d @-
In this example, we are going to ask our server about the last history value for the
Processor load (15 min average per core) item. In this particular case, on this
server, the JSON envelope will be composed as follows:
{ "jsonrpc": "2.0",
"method": "history.get",
"params": {
"output": "extend",
"history": 0,
"hostids": "10096",
"itemid": "23966",
"sortfield": "clock",
"sortorder": "DESC",
"limit": 1
},
"auth": "403bbcdc3c01d4d6e66f68f5f3057c3a",
"id": 1
}
Remember that the request must contain the authentication token previously
obtained using the "user.authenticate" method.
Most of the APIs contain at least four methods: get, create,
update, and delete, but please be aware that certain APIs may
provide a totally different set of methods.
The server response in this case is the following:
HTTP/1.1 200 OK
{"jsonrpc":"2.0",
"result":[
{"hosts":
[{"hostid":"10096"}],
[ 312 ]
Chapter 9
"itemid":"23840",
"clock":"1381263380",
"value":"0.1506",
"ns":"451462502"}
],"id":1}
In this example, you have seen a way to use the authentication token to query the
historical data for a particular host/item. Of course, shell scripting is not the best
method to interact with the Zabbix API because it requires a lot of coding to manage
the "auth" token and it is better to use something more user friendly.
Using the PyZabbix library
Now that we have a clear understanding of the API's architecture and its JSON-RPC
protocol, we can move beyond the manual construction of the JSON objects and rely
on a dedicated library. This will allow us to focus on the actual features of the API
and not on the specifics of the implementation.
There are quite a few Zabbix API libraries available for different languages, but the
one we'll use for the rest of the chapter is PyZabbix, which is written by Luke Cyca
(https://github.com/lukecyca/pyzabbix/wiki). It's a small, compact Python
module that stays quite close to the API while still being easy to use. Moreover,
Python's interactive console makes it quite convenient to try features and build a
prototype before moving seamlessly to a complete script or application.
You can install PyZabbix very easily through Pip, the Python package installer:
$ pip install pyzabbix
Once the module has been installed, you'll be able to import it and use it in your
scripts to manage a Zabbix installation.
The first thing to do is create an object for the API server and get an authentication
token.
The following code fragments are shown as part of an interactive session, but they can also
be part of any Python code:
>>> from pyzabbix import ZabbixAPI
>>> zh = ZabbixAPI("https://127.0.0.1/zabbix/")
>>> zh.login("Admin", "zabbix")
[ 313 ]
Extending Zabbix
Needless to say, you have to use your actual Zabbix frontend URL and user
credentials for this code to work in your environment. If all goes well, this is actually
all there is to it. From now on, you can use the object handler to access any API
method in the following way:
>>> zh.host.get(output="refer")
The "refer" options will give you only the primary key and the foreign key for any
returned object:
[{'hostid': '9909900000010084'}, {'hostid': '9909900000010085'},
{'hostid': '9909900000010086'}, {'hostid': '9909900000010087'},
{'hostid': '9909900000010088'}]
Another advantage of using a Python library is that JSON data types map very
cleanly onto Python ones, so much so that most of the time you won't even need to
perform any additional type conversion. Here is a table that shows the specific types
supported by the Zabbix API and a few examples of how they look both in JSON and
within PyZabbix function calls:
Type
bool
JSON
pyzabbix
{"jsonrpc" : "2.0"
"method": "host.get",
"params" : {
"editable" : "true" }
"auth" : <....>
"id" : 1
}}
zh.host.
get(editable="true")
flag
{"jsonrpc" : "2.0"
"method": "host.get",
"params" : {
"countOutput" : "1" }
"auth" : <....>
"id" : 1
}}
zh.host.
get(countOutput=1)
integer
{"jsonrpc" : "2.0"
"method": "host.get",
"params" : {
"limit" : 10}
"auth" : <....>
"id" : 1
}}
zh.host.get(limit=10)
[ 314 ]
Chapter 9
Type
string
JSON
pyzabbix
{"jsonrpc" : "2.0"
"method": "host.get",
"params" : {
"sortfield": "name" }
"auth" : <....>
"id" : 1
}}
zh.host.
get(sortfield="name")
timestamp
{"jsonrpc": "2.0",
"method":
"event.get",
"params": {
"time_from":
"1349797228",
"time_till":
"1350661228",},
"auth": <...>,
"id": 1
}
zh.event.get(time_
from="1349797228", time_
till= "1350661228")
array
{"jsonrpc" : "2.0"
"method": "host.get",
"params" : {
"hostids" : [1001, 1002,
1003] }
"auth" : <....>
"id" : 1
}}
zh.host.
get(hostids=[1001, 1002,
1003])
object
{"jsonrpc" : "2.0"
"method": "host.get",
"params" : {
"filter": { "name":
["Alpha", "Beta"] }
"auth" : <....>
"id" : 1
} }
zh.host.
get(filter={"name":
["Alpha", "Beta"]})
query
{"jsonrpc" : "2.0"
"method": "host.get",
"params" : {
"output": "extend" }
"auth" : <....>
"id" : 1
}}
zh.host.
get(output="extend")
[ 315 ]
Extending Zabbix
The library creates the method requests on the fly, so it's fairly futureproof, which
means any new or updated methods in the API will be automatically supported.
We can now move on to explore a few concrete examples of API usage. In order to
keep the code readable and to focus on the API, and not on general programming
issues, all the examples will have a very simplistic and direct approach to data
handling, without much data validation or error management. While you can
certainly use the following fragments in interactive sessions or as part of more
complex applications (or even to build a suite of dedicated command-line tools),
you are strongly encouraged to make them more robust with the appropriate errorhandling and data validation controls.
Exploring the Zabbix API with JQuery
Another interesting project that we can download and check is JQZabbix. For more
information about this project, you can refer to https://github.com/kodai/
jqzabbix.
JQZabbix is a demo application readymade to test the Zabbix API and, sometimes, it
can be useful to have it installed somewhere as it allows a simple web browser to do
a JSON-RPC query against our Zabbix server without the need to write scripts.
To install the package, we need to download the package; here, we can simply clone
the GitHub repository with the following command:
$ mkdir jqzabbix && cd jqzabbix
$ git clone https://github.com/kodai/jqzabbix
The project will download a demo directory contained in the jqzabbix GitHub
clone. We need to create a new location that we can call jqzabbix under
DocumentRoot of httpd. Usually, the document root is located at /var/www/html,
but it is better to check the DocumentRoot directive under /etc/httpd/conf/httpd.
conf. Running the following command as root, we can now copy the required
jqzabbix files:
$ mkdir /var/www/html/jqzabbix
$ cp <your-jqzabbix-location>/demo/* /var/www/html/jqzabbix/
$ cp <your-jqzabbix-location>/jqzabbix/* /var/www/html/jqzabbix/
Now all you have to do to see it in action is edit the file main.js
changing the following entry:
// Zabbix server API url
var url = 'http://localhost/zabbix/api_jsonrpc.php';
[ 316 ]
Chapter 9
This url variable needs to contain the real IP address or DNS name of our
Zabbix server.
Once this is done, you can simply check by opening a browser. The home page is
available at http://<your-zabbix-server>/jqzabbix/.
Opening your browser, you'll see something similar to the following screenshot:
This application is interesting to see as it is an example of coding the Zabbix API
using jQuery. This application enables you to use most of the methods supported by
the Zabbix API:
[ 317 ]
Extending Zabbix
What follows, for instance, is the result of a host.get call:
Let's see with more details how this application works. You can take a look at the
main.js file. The first thing that is done is the creation of the jqzabbix object with
several options, which are mostly optional. The following are the default values:
server = new $.jqzabbix({
url: 'http://localhost/zabbix/api_jsonrpc.php', // URL of Zabbix
API
username: 'Admin',
// Zabbix login user name
password: 'zabbix', // Zabbix login password
basicauth: false,
// If you use basic authentication, set true
for this option
busername: '',
// User name for basic authentication
bpassword: '',
// Password for basic authentication
timeout: 5000,
// Request timeout (milli second)
limit: 1000,
// Max data number for one request
})
Then, check the Zabbix API version with the following calls:
server.getApiVersion();
If the request is completed successfully, it is time for authentication:
server.userLogin();
Once it is completed, the authentication ID is stored in server property. Now, you
can execute the normal API method as per their own definition:
server.sendAjaxRequest(method, params, success, error)
[ 318 ]
Chapter 9
Here, we have:
• method: The Zabbix API method listed on the Zabbix API document
• params: The Zabbix API method parameters
• success: The success callback function
• error: The error callback function
As you can see, this is a very simple package but it can be really useful to compare the
values returned by the API with your own scripts and so on. Plus, it is a good starting
point if you're thinking about coding a jQuery application. Here, thanks to the Zabbix
API, the only limit we have is our imagination, but the API thanks the developer for
allowing us to automate all the repetitive tasks and many maintenance tasks.
Mass operations
Now it is time to see the Python Zabbix API in action. Another common use of the
API facility is to automate certain operations that you can perform from the web
frontend, but they may be cumbersome or prone to errors. Things such as adding
many users or updating the host IP addresses after merging two different networks
fall under this category. The following fragments will assume that you already have
a Zabbix API handle just as shown in the previous paragraphs. In other words,
from now on, it will be assumed that your code will start with something similar
to the following (remember that the Zabbix URL and user credentials here are just
examples! Use your own URL and credentials):
#!/usr/bin/python
from pyzabbix import ZabbixAPI
user='Admin'
pwd='password'
url = 'https://127.0.0.1/zabbix/'
zh = ZabbixAPI(url)
zh.login(user=user, password=pwd)
[ 319 ]
Extending Zabbix
Redistributing hosts to proxies
We have seen in Chapter 2, Distributed Monitoring, that you can add hosts to a proxy
through the proxy configuration form or by updating every single host's monitored
by property. Both of these methods can be too slow and cumbersome if you have a
great number of hosts and you need to update more than just a handful of them. If
you just need to move an entire group of hosts from one proxy to another, you could
also use the mass update functionality of the frontend, but if you need to distribute
hosts to different proxies or work on just a few hosts from many different groups,
this approach won't scale well.
Here is one way to redistribute all the hosts monitored by a proxy to all the other
proxies in your Zabbix installation. A possible reason to do this is that you may be
doing some proxy maintenance and you need to bring it down for a while, but you
don't want to suspend monitoring for a whole bunch of hosts, so you redistribute
them to other proxies.
First, let's get the proxy ID and the proxy name:
proxy_name = "ZBX Proxy 1"
proxy_id = zh.proxy.get(filter={"host": proxy_name}, output="refer")
[0]['proxyid']
Once you have the proxy's ID, get the list of monitored hosts:
hlist = zh.proxy.get(selectHosts=['hostid'], proxyids=proxy_id,
output="refer")[0]['hosts']
hosts = [x['hostid'] for x in hlist]
Next, for simplicity's sake, let's just get the list of all other proxies, excluding the one
you are removing hosts from:
proxies =
proxyid]
[x['proxyid'] for x in zh.proxy.get() if x['proxyid'] !=
Now, we need to split the host list in as many roughly equal-sized chunks as the
number of proxies available:
nparts = int(round(len(hosts)/len(proxies))
hostchunks = [list(hosts[i:i+nparts]) for i in
range(0,len(hosts),nparts)]
The preceding code will divide your host list into as many sublists as the number of
proxies you have. All that is left to do is actually assign the hosts to the proxies:
for c in len(hostchunks):
zh.proxy.update(proxyid=proxies[c], hosts=hostchunks[c])
[ 320 ]
Chapter 9
And that's it. The proxy.update method will automatically reassign hosts, so you
don't even have to remove them first from the original one. You can, of course, make
things more robust by only selecting proxies in the same network as the one you are
doing maintenance on or by saving the host list so you can reassign it to the original
proxy once it's available.
Adding or updating users
Even if you rely on some external authentication method for your Zabbix users, such
as an LDAP server or Active Directory, no new user account will have any media
information set, nor will it belong to any group. This means that you'll still need
to manually configure every user unless you create new users or update existing
ones through some kind of code. For simplicity's sake, let's assume that you already
have a list of usernames, e-mail addresses, and the groups they should belong to, all
gathered in a semicolon-separated users.csv file that looks like the following:
adallevacche,[email protected],Admins
jdoe,[email protected],DB admins; App Servers
mbrown,[email protected],Net admins
The script that you are going to write will assume that the first field of every line
will contain the username (called alias in the API). The second field will contain an
e-mail address, while the last field will be a comma-separated list of user groups that
the user should belong to. Updating your users' information is quite simple. First,
you need to read into your script the contents of the users.csv file:
with open('users.csv', 'r') as f:
users = f.readlines()
Assuming that your Zabbix API connection object is called zh, you can now define a
couple of helper functions and variables. The mediatypeid will be needed to update
your users' media information. Assuming that you have only one e-mail media type
defined in your Zabbix installation, you can get its ID by calling the following:
mediatypeid = zh.mediatype.get(output="refer",
filter={"description": ['Email']})[0]['mediatypeid']
Unless you want to extend your .csv file with information about the severity and
the time period for each one of your users' media, you can also define a common
template for all e-mail contacts:
def mkusermedia(mediatype='', email='', mediaid=''):
return { "mediaid": mediaid
"mediatypeid": mediatype,
"sendto": email,
"active": 0,
[ 321 ]
Extending Zabbix
"severity": 63,
"period": "1-7,00:00-24:00"
}
Please note how 0 means enabled, while 1 means disabled for the active property.
Also, while the period property is fairly self-explanatory, the severity property
could look quite puzzling at first. It's actually a binary bitmap value and can be more
easily understood if you take into consideration the trigger severity values and put
them in order. Each severity level occupies a position of a 6-bit value:
Severity
Disaster
High
Average
Warning
Information
Not
classified
Enabled?
1
1
1
1
1
1
Decimal
value
111111 = 63
Since 63 equals 111111 in binary form, this means that the user will receive
notifications for every severity level. If you want to receive notifications only for the
disaster severity, you will have a 100000 bitmap and so a severity value of 32:
Severity
Disaster
High
Average
Warning
Information
Not
classified
Enabled?
1
0
0
0
0
0
Decimal
value
100000 = 32
Similarly, to get notifications for disaster and higher levels, you'll need a 110000
bitmap and a severity value of 48, and so on.
Severity
Disaster
High
Average
Warning
Information
Not
classified
Enabled?
1
1
0
0
0
0
Decimal
value
110000 = 48
The following helper function will get a list of group names and return a list of user
group IDs that actually exist, thus ignoring non-existing group names:
def getgroupids(grouplist):
return zh.usergroup.get(output=['usergrpid'], filter={"name":
grouplist.split(",")})
[ 322 ]
Chapter 9
We can now proceed to actually work the user list to either update existing users or
create new ones:
for u in users:
(alias, email, groups) = u.split(",")
user = zh.user.get(output=['userid'], filter={"alias": [alias]})
if not user:
zh.user.create(alias=alias,
passwd="12345",
usrgrps=getgroupids(groups),
user_medias=[mkusermedia(mediatype=mediatypeid,
email=email)])
The if statement checks whether the user exists. If not, the user.create method
will take care of creating it, adding it to the appropriate groups and creating the
media contact as well. You need to define a password even if your users will
authenticate from an external source. Depending on your password management
policies, your users should be strongly encouraged to change it as soon as possible,
or, better yet, you could directly generate a random password instead of using a
fixed string.
The second part of the if construct will get userid and update the user's
information:
else:
userid=user[0]['userid']
zh.user.update(userid=userid,srgrps=getgroupids(groups))
usermedia = zh.usermedia.get(filter={"userid" : userid},
output=['mediaid'])
zh.user.updatemedia(users = [userid],
medias=[mkusermedia(
mediaid=usermedia[0]['mediaid'],
mediatype=mediatypeid,
email=email)])
Please note the way you need to call two different methods here
for user groups and media instead of just one. The first one will
update group information; the second one will check for an
already-defined e-mail address, and the third will update the
said address or create a new one if it doesn't exist.
You can run the preceding code periodically to keep your user accounts updated.
Obvious improvements would be adding each user's name and surname or
getting user data directly from an LDAP server or any other source instead of
from a .csv file.
[ 323 ]
Extending Zabbix
Exporting data
Besides directly manipulating and monitoring internal objects, another compelling
use of the Zabbix API is to extract data for further analysis outside of the Zabbix
frontend. Maps, screens, graphs, triggers, and history tables can be excellent reporting
tools, but they are all meant to be used inside the frontend. Sometimes, you may need
the raw data in order to perform custom calculations on it—especially when it comes
to capacity planning—or you may need to produce a document with a few custom
graphs and other data. If you find yourself with such needs on a regular basis, it
makes sense to write some code and extract your data through the API. An interesting
feature of the get methods, which are the fundamental building blocks of any data
extraction code, is that they come with quite a few filters and options out of the box.
If you are willing to spend some time studying them, you'll find that you are able to
keep your code small and clean as you won't usually have to get lots of data to filter
through, but you'll be able to build queries that can be quite focused and precise.
Let's see a few short examples in the following paragraphs.
Extracting tabular data
Zabbix provides a way to group similar items in a host in order to navigate them
more easily when looking at the latest monitoring data. These item containers,
called applications, come in very handy when the number of items in a host is quite
consistent. If you group all CPU-monitoring items together under a label, say CPU,
all filesystem-related items under filesystems, and so on, you could find the data you
are looking for more easily. Applications are just labels tied to a specific template or
host and are just used to categorize items. This makes them simple and lightweight.
But it also means that they are not really used elsewhere in the Zabbix system.
Still, it's sometimes useful to look at the trigger status or event history, not just by the
host but by the application too. A report of all network-related problems regardless
of the host, host group, or specific trigger, could be very useful for some groups
in your IT department. The same goes for a report on filesystem events, database
problems, and so on.
Let's see how you can build a script that will export all events related to a specific
application into a .csv file. The setup is basically the same as the previous examples:
#!/usr/bin/python
from pyzabbix import ZabbixAPI
import sys
import csv
from datetime import datetime
appname = sys.argv[1]
[ 324 ]
Chapter 9
timeformat="%d/%m/%y %H:%M"
zh = ZabbixAPI("http://locahost/zabbix")
zh.login(user="Admin", password="zabbix")
As you can see, the application name is taken from the command line, while the
API's URL and credentials are just examples. When you use your own, you can also
consider using an external configuration file for more flexibility. Since events are
recorded using a Unix timestamp, you'll need to convert it to a readable string later
on. The timeformat variable will let you define your preferred format. Speaking of
formats, the .csv module will let you define the output format of your report with
more flexibility than a series of manual prints.
Now, you can proceed to extract all applications that share the name you passed on
the command line:
applications = zh.application.get(output="shorten", filter={"name":
[appname]})
Once we have the list of applications, you can get the list of items that belong to the
said application:
items = zh.item.get(output="count", applicationids=[x['applicationid']
for x in applications])
From there, you still need to extract all the triggers that contain the given items
before moving on to the actual events:
triggers = zh.trigger.get(output="refer", itemids=[x['itemid'] for x
in items])
Now, you can finally get the list of events that are related to the application you are
interested in:
events = zh.event.get(triggerids=[j['triggerid'] for j in triggers])
Here, only the event IDs are extracted. You didn't ask for a specific time period, so
it's possible that a great number of events will be extracted. For every event, we'll
also need to extract all related hosts, triggers, and items. To do that, let's first define a
couple of helper functions to get the host, item, and trigger names:
def gethostname(hostid=''):
return zh.host.get(hostids=hostid, output=['host'])[0]['host']
def getitemname(itemid=''):
return zh.item.get(itemids=itemid, output=['name'])[0]['name']
def gettriggername(triggerid=''):
return zh.trigger.get(triggerids=triggerid,
expandDescription="1", output=['description'])[0]['description']
[ 325 ]
Extending Zabbix
Finally, you can define an empty eventstable table and fill it with event
information based on what you have extracted until now:
eventstable = []
triggervalues = ['OK', 'problem', 'unknown']
for e in events:
eventid = e['eventid']
event = zh.event.get(eventids=eventid,
selectHosts="refer",
selectItems="refer",
selectTriggers="refer",
output="extend")
host = gethostname(event[0]['hosts'][0]['hostid'])
item = getitemname(event[0]['items'][0]['itemid'])
trigger = gettriggername(event[0]['triggers'][0]['triggerid'])
clock = datetime.fromtimestamp(int(event[0]['clock'])).
strftime(timeformat)
value = triggervalues[int(event[0]['value'])]
eventstable.append({"Host": host,
"Item": item,
"Trigger": trigger,
"Status": value,
"Time" : clock
})
Now that you have all the events' details, you can create the output .csv file:
filename = "events_" + appname + "_" + datetime.now().
strftime("%Y%m%d%H%M")
fieldnames = ['Host', 'Item', 'Trigger', 'Status', 'Time']
outfile = open(filename, 'w')
csvwriter = csv.DictWriter(outfile, delimiter=';',
fieldnames=fieldnames)
csvwriter.writerow(dict((h,h) for h in fieldnames))
for row in eventstable:
csvwriter.writerow(row)
outfile.close()
The report's filename will be automatically generated based on the application you
want to focus on and the time of execution. Since every event in the eventstable
array is dict, a fieldnames array is needed to tell the csv.DictWriter module
in what order the fields should be written. Next, a column header is written before
finally looping over the eventstable array and writing out the information we want.
[ 326 ]
Chapter 9
There are a number of ways that you can expand on this script in order to get
even more useful data. Here are a few suggestions, but the list is limited only
by your imagination:
• Ask for an optional time period to limit the number of events extracted
• Order events by host and trigger
• Perform calculations to add the event duration based on the change in the
trigger state
• Add acknowledged data if present
Creating graphs from data
At this point in the book, you should be familiar with Zabbix's powerful data
visualization possibilities. On the frontend, you can create and visualize many
kinds of graphs, maps, and charts that can help you to analyze and understand item
history data, changes in the trigger status over time, IT services availability, and so
on. Just as any other Zabbix capabilities, all of the visualization functions are also
exposed through the API. You can certainly write programs to create, modify, or
visualize screens, graphs, and maps, but unless you are building a custom frontend,
it's quite unlikely that you'll ever need to do so.
On the other hand, it may be interesting to extract and visualize data that is
otherwise too dispersed and hard to analyze through the frontend. A good example
of such data is trigger dependency. You may recall from Chapter 6, Managing Alerts,
that a trigger can depend on one or more other triggers such that it won't change to a
PROBLEM state if the trigger it depends on is already in a PROBLEM state.
As useful as this feature is, there's no easy way to see at a glance the triggers
that depend on other triggers, if those triggers, in turn, depend on other triggers,
and so on. The good news is that with the help of the Graphviz package and a
couple of lines of Python code, you can create a handy visualization of all trigger
dependencies.
The Graphviz suite of programs
Graphviz (http://www.graphviz.org) is a suite of graph visualization software
utilities that enables you to create arbitrary complex graphs from specially formatted
text data. The suite provides you with many features for data visualization and can
become quite complex to use, but it is quite simple to create a basic, functional setup
that you can later build on.
[ 327 ]
Extending Zabbix
If you do not have it installed on your system, Graphviz is just a yum install
command away if you are on a Red Hat Enterprise Linux system:
# yum install 'graphviz*'
The program you will use to create your graphs is called dot. Dot takes a graph text
description and generates the corresponding image in a number of formats. A graph
description looks similar to this:
digraph G {
main → node1 → node2;
main → node3;
main → end;
node2 → node4;
node2 → node5;
node3 → node4;
node4 → end;
}
Put the preceding graph in a graph.gv file and run the following command:
$ dot -Tpng graph.gv -o graph.png
You will obtain a PNG image file that will look somewhat similar to the following
diagram:
main
node1
node2
node3
node5
node4
end
[ 328 ]
Chapter 9
As you can see, it should be fairly simple to create a trigger-dependency graph once
we have extracted the right information through the API. Let's see how we can do it.
Creating a trigger dependency graph
The following is a Python script that will extract data about trigger dependencies
and output a dot language graph description that you can later feed into the dot
program itself:
#!/usr/bin/python
from pyzabbix import ZabbixAPI
zh = ZabbixAPI("https://127.0.0.1/zabbix")
zh.login(user="Admin", password="zabbix")
def gettriggername(triggerid=''):
return zh.trigger.get(triggerids=triggerid,
output=['description'])[0]['description']
In the first part, there are no surprises. A Zabbix API session is initiated and a simple
helper function, identical to the one shown before, is defined:
tr = zh.trigger.get(selectDependencies="refer", expandData="1",
output="refer")
dependencies = [(t['dependencies'], t['host'], t['triggerid']) for t
in tr if t['dependencies'] != [] ]
The next two lines extract all triggers and their dependencies and then create a list,
filtering out triggers that don't have any dependencies:
outfile = open('trigdeps.gv', 'w')
outfile.write('digraph TrigDeps {\n')
outfile.write('graph[rankdir=LR]\n')
outfile.write('node[fontsize=10]\n')
Here, the first few lines of the graph are written out to the output file, thus setting up
the graph direction from left to right and the font size for the nodes' labels:
for (deps, triggerhost, triggerid) in dependencies:
triggername = gettriggername(triggerid)
for d in deps:
depname = gettriggername(d['triggerid'])
dephost = d['host']
edge = '"{}:\\n{}" -> "{}:\\n{}";'.format(dephost, depname,
triggerhost, triggername)
outfile.write(edge + '\n')
[ 329 ]
Extending Zabbix
This is the core of the script. The double for loop is necessary because a single trigger
may have more than one dependency and you want to map out all of them. For every
dependency-trigger relationship found, an edge is defined in the graph file:
outfile.write('}\n')
outfile.close()
Once the script reaches the end of the list, there is nothing more to do except close
the graph description and close the output file.
Execute the script:
$ chmod +x triggerdeps.py
$ ./triggerdeps.py
You will get a trigdeps.gv file that will look somewhat similar to this:
digraph TrigDeps {
graph[rankdir=LR]
node[fontsize=10]
"Template IPMI Intel SR1630:\nPower" -> "Template IPMI Intel SR1630:\
nBaseboard Temp Critical [{ITEM.VALUE}]";
"Template IPMI Intel SR1630:\nBaseboard Temp Critical [{ITEM.VALUE}]"
-> "Template IPMI Intel SR1630:\nBaseboard Temp Non-Critical [{ITEM.
VALUE}]";
"Template IPMI Intel SR1630:\nPower" -> "Template IPMI Intel SR1630:\
nBaseboard Temp Non-Critical [{ITEM.VALUE}]";
"Template IPMI Intel SR1630:\nPower" -> "Template IPMI Intel SR1630:\
nBB +1.05V PCH Critical [{ITEM.VALUE}]";
"Template IPMI Intel SR1630:\nBB +1.05V PCH Critical [{ITEM.VALUE}]"
-> "Template IPMI Intel SR1630:\nBB +1.05V PCH Non-Critical [{ITEM.
VALUE}]";
"Template IPMI Intel SR1630:\nPower" -> "Template IPMI Intel SR1630:\
nBB +1.05V PCH Non-Critical [{ITEM.VALUE}]";
"Template IPMI Intel SR1630:\nPower" -> "Template IPMI Intel SR1630:\
nBB +1.1V P1 Vccp Critical [{ITEM.VALUE}]";
}
Just run it through the dot program in order to obtain your dependencies graphs:
$ dot -Tpng trigdeps.gv -o trigdeps.png
[ 330 ]
Chapter 9
The resulting diagram will probably be quite big; the following is a close up of a
sample resulting image:
Template IPMI Intel SR1630:
Baseboard Temp Critical [{ITEM.VALUE}]
Template IPMI Intel SR1630:
Baseboard Temp Non-Critical [{ITEM.VALUE}]
Template IPMI Intel SR1630:
Power
Template IPMI Intel SR1630:
BB+1.05V PCH Critical [{ITEM.VALUE}]
Template IPMI Intel SR1630:
BB+1.05V PCH Non-Critical [{ITEM.VALUE}]
Template IPMI Intel SR1630:
BB+1.1V P1 Vccp Critical [{ITEM.VALUE}]
From improving the layout and the node shapes, to integrating the graph generating
part into Python with its graphviz bindings, once again, there are many ways to
improve the script. Moreover, you could feed the image back to a Zabbix map using
the API, or you could invert the process and define trigger dependencies based on an
external definition.
Generating Zabbix maps from dot files
Now, it is interesting to see how starting with a Graphviz dot file, we can generate
a Zabbix map in an automated way. Here, the automation is quite interesting as
Zabbix is affected by certain boring issues, such as:
• You can't move multiple elements at the same time: https://support.
zabbix.com/browse/ZBXNEXT-161
• You can't add hosts in bulk: https://support.zabbix.com/browse/
ZBXNEXT-163
• You can't clone any existing map element: https://support.zabbix.com/
browse/ZBXNEXT-51
• When you are using icons, you can't select them automatically, so you
need to check their size and check whether they fit on your map: https://
support.zabbix.com/browse/ZBXNEXT-1608
[ 331 ]
Extending Zabbix
Those are already a good set of points to think about an automated way to speed up
a long and slow process. Graphviz provides us with a good tool to be used in this
case to generate an image and transform it into Zabbix's API calls. What we need
to do is:
1. Read out the dot file.
2. Generate the topology using graphviz.
3. Acquire all the coordinates from our topology that has been generated.
4. Use PyZabbix to connect to our Zabbix server.
5. Generate our topology in a fully automated way.
We can now, finally, start coding lines in Python; the following example is similar to
the one presented by Volker Fröhlich. Anyway, the code here has been changed and
fixed (it did not work well with Zabbix 2.4).
As the first thing, we need to import the ZabbixApi and networkx libraries:
import networkx as nx
from pyzabbix import ZabbixAPI
Then, we can define the Graphviz DOT file to use as a source; here, we can generate
our DOT file by exporting data from Zabbix itself, which involves taking care to
populate all the relations between the nodes. In this example, we are using a simple
line of code:
dot_file="/tmp/example.dot"
In the next lines, we will define our username, password, map dimension, and the
relative map name:
username="Admin"
password="zabbix"
width = 800
height = 600
mapname = "my_network"
What follows here is a static map to define the element type:
ELEMENT_TYPE_HOST = 0
ELEMENT_TYPE_MAP = 1
ELEMENT_TYPE_TRIGGER = 2
ELEMENT_TYPE_HOSTGROUP = 3
ELEMENT_TYPE_IMAGE = 4
ADVANCED_LABELS = 1
LABEL_TYPE_LABEL = 0
[ 332 ]
Chapter 9
Then, we can define the icons to use and the relative color code:
icons = {
"router": 23,
"cloud": 26,
"desktop": 27,
"laptop": 28,
"server": 29,
"sat": 30,
"tux": 31,
"default": 40,
}
colors = {
"purple": "FF00FF",
"green": "00FF00",
"default": "00FF00",
}
Now, we will define certain functions: the first one is to manage the login and the
second one is to define a host lookup:
def api_connect():
zapi = ZabbixAPI("http://127.0.0.1/zabbix/")
zapi.login(username, password)
return zapi
def host_lookup(hostname):
hostid = zapi.host.get({"filter": {"host": hostname}})
if hostid:
return str(hostid[0]['hostid'])
The next thing to do is read our dot file and start converting it into a graph:
G=nx.read_dot(dot_file)
Then, we can finally open our graph:
pos = nx.graphviz_layout(G)
Here, you can select your preferred algorithm. Graphviz
supports many different kind of layouts. You can change the
look and feel of your map as desired. For more information
about Graphviz, please check the official documentation
available at http://www.graphviz.org/.
[ 333 ]
Extending Zabbix
Then, the next thing to do, as the graph is already generated, is find the maximum
coordinates of the layout. This will enable us to scale our predefined map output
size better:
positionlist=list(pos.values())
maxpos=map(max, zip(*positionlist))
for host, coordinates in pos.iteritems():
pos[host] = [int(coordinates[0]*width/maxpos[0]*0.95coordinates[0]*0.1), int((height-coordinates[1]*height/maxpos[1])*0.95
+coordinates[1]*0.1)]
nx.set_node_attributes(G,'coordinates',pos)
Graphviz and Zabbix use two different data origins—Graphviz
starts from the bottom left corner and Zabbix works starting
from the top left corner.
Then, we need to retrieve selementids as they are required for links and even for
the node data coordinates:
selementids = dict(enumerate(G.nodes_iter(), start=1))
selementids = dict((v,k) for k,v in selementids.iteritems())
nx.set_node_attributes(G,'selementid',selementids)
nx.set_node_attributes(G,'selementid',selementids)
Now, we will define the map on Zabbix, the name, and the relative map size:
map_params = {
"name": mapname,
"label_type": 0,
"width": width,
"height": height
}
element_params=[]
link_params=[]
Finally, we can connect to our Zabbix server:
zapi = api_connect()
Then, prepare all the node information and the coordinates, and then set the icon
to use:
for node, data in G.nodes_iter(data=True):
# Generic part
map_element = {}
map_element.update({
[ 334 ]
Chapter 9
"selementid": data['selementid'],
"x": data['coordinates'][0],
"y": data['coordinates'][1],
"use_iconmap": 0,
})
Check, whether we have the hostname:
if "hostname" in data:
map_element.update({
"elementtype": ELEMENT_TYPE_HOST,
"elementid": host_lookup(data['hostname'].strip('"')),
"iconid_off": icons['server'],
})
else:
map_element.update({
"elementtype": ELEMENT_TYPE_IMAGE,
"elementid": 0,
})
We will now set labels for the images:
if "label" in data:
map_element.update({
"label": data['label'].strip('"')
})
if "zbximage" in data:
map_element.update({
"iconid_off": icons[data['zbximage'].strip('"')],
})
elif "hostname" not in data and "zbximage" not in data:
map_element.update({
"iconid_off": icons['default'],
})
element_params.append(map_element)
Now, we need to scan all the edges to create the element links based on the element.
We've identified selementids:
nodenum = nx.get_node_attributes(G,'selementid')
for nodea, nodeb, data in G.edges_iter(data=True):
link = {}
link.update({
"selementid1": nodenum[nodea],
"selementid2": nerodenum[nodeb],
[ 335 ]
Extending Zabbix
})
if "color" in data:
color = colors[data['color'].strip('"')]
link.update({
"color": color
})
else:
link.update({
"color": colors['default']
})
if "label" in data:
label = data['label'].strip('"')
link.update({
"label": label,
})
link_params.append(link)
# Join the prepared information
map_params["selements"] = element_params
map_params["links"] = link_params
Now, we have populated all map_params. We need to call Zabbix's API with
that data:
map=zapi.map.create(map_params)
The program is now complete, and we can let it run! In a real-case scenario, the time
spent to design a topology of more than 2,500 hosts is only 2-3 seconds!
We can test the software here that has been proposed against a dot file that contains
24 hosts:
[root@localhost]# time ./Generate_MyMap.py
real
0m0.005s
user
0m0.002s
sys
0m0.003s
[ 336 ]
Chapter 9
As you can see, our software is really quick… but let's check what has been
generated. In the next picture, you can see the map generated automatically
in 0.005 seconds:
The goal of this example was to see how we can easily automate complex and long
tasks using the Zabbix API. The same method proposed here is really useful when
you have to create or do the initial startup. Also, nowadays, there are quite a few
tools that can provide you with the data of the host already monitored, for example,
Cisco Prime or other vendor-specific management tools from where you can extract
a considerable amount of data, convert it into .dot, and populate the Zabbix hosts,
maps, and so on.
[ 337 ]
Extending Zabbix
Summary
In this chapter, we barely scratched the surface of what is possible once you begin
playing with the powerful Zabbix API. If you worked through the examples, we
can assume that you are comfortable with the JSON-RPC protocol, which is the
foundation of the API. You should know how to explore the various methods and
have some ideas on how to use them to make your Zabbix management tasks easier
or to further expand the system's data manipulation possibilities.
With the discussion of the API, we conclude our exploration of Zabbix's features.
The next and final chapter will build upon the knowledge you have gained until now
and use it to make Zabbix a more integral part of your IT infrastructure by opening
communication channels with other management systems.
[ 338 ]
Integrating Zabbix
A monitoring system is, by definition, all about connecting and communicating with
other systems. On the one hand, it needs to connect to its monitored objects in order
to take measurements and evaluate the service status. On the other hand, it needs
to be able to communicate the collected information outside of itself so that system
administrators can act on the data and an alarm is raised. In the previous chapters
of the book, we focused mainly on the first part of the equation, namely collecting
data, and always assumed that the second part, exposing data and warnings, would
involve sending a series of messages to human operators. While this is certainly the
most common setup, the one that will be at the core of every Zabbix deployment, it's
also true that it can prove to be quite limited in a large, complex IT environment.
Every managing system has a specific, detailed view of its environment that is
directly dependent on the function it must perform. Identity management systems
know all about users, passwords, and permissions, while inventory systems keep
track of hardware and software configurations and deployment. Trouble ticketing
systems keep track of current issues with users, while monitoring systems keep track
of the availability status and performance metrics of anything they can connect to.
As many of these systems actually share some common data among them, whether
it is user information, connection configuration, or anything else, it is vital that as
much of this data as possible is allowed to pass from one system to the next without
constant manual intervention on the part of the administrators.
It will be impossible for Zabbix or any monitoring system to come with an
out-of-the-box integration with any other arbitrary system in the world. Its
open source nature, clear protocol, and powerful APIs make it relatively easy to
integrate your monitoring system with any other IT management tools you have
deployed in your environment. This can be the subject of a book in itself, but we
will try to get you started on the path of Zabbix integration by looking at one such
integration possibility.
[ 339 ]
Integrating Zabbix
In this chapter, you will see a concrete example of integration between Zabbix and
WhatsApp™ and an example of integration between Zabbix and Request Tracker (RT).
I don't think there is any need to explain what WhatsApp is as it is a widely known
messaging system that now supports encryption and even phone calls using VoIP.
Request Tracker is the open source trouble ticket management system from Best
Practical (http://bestpractical.com/rt/). By the end of the chapter, you will be
able to do the following:
• Route an alert directly to your Unix system administrator and support via
WhatsApp
• Integrate custom media with Zabbix
• Relay an alert to a trouble ticketing system
• Keep track of which tickets relate to which events
• Update event acknowledgments based on the status of a ticket
• Automatically close specific tickets when a trigger returns to an OK state
There won't be any new concepts or Zabbix functionality explained here as we'll
explore some of the real-world applications made possible by the features we have
already learned about in the rest of the book.
Stepping into WhatsApp
WhatsApp is so widely used that it does not require any kind of presentation. More
interesting is that, on the other hand, the libraries that have been developed using the
WhatsApp communication protocol. In this example, we are going to use a Python
library, Yowsup, that will enable us to interact with WhatsApp. Anyway, during the
year, we had quite a few libraries that were developed around this service. Yowsup
has been used to create an unofficial WhatsApp client for Nokia N9 through the
Wazapp project, which was in use by more than 200K users. Another fully featured
unofficial client for Blackberry 10 has been created using Yowsup, which is a robust
component that we can use for our integration.
Let's have a look at the requirements:
• Python 2.6+, or Python 3.0 +
• Python packages: python-dateutil
• Python packages for end-to-end encryption: protobuf, pycrypto, and
python-axolotl-curve25519
• Python packages for yowsup-cli: argparse, readline, and pillow
(to send images)
[ 340 ]
Chapter 10
Then, we can start installing the required packages as root with yum:
$ yum install python python-dateutil python-argparse
Yum, as usual, will resolve all the dependencies for us; now we can finally start
downloading Yowsup. You need to decide whether you prefer to clone the Git
repository or download directly archive packages of master. In this example,
we will download the package:
# wget https://github.com/tgalal/yowsup/archive/master.zip
Once the zip archive has been saved, we can extract it using:
# unzip master.zip
This will expand the zip archive by reproducing the Git directory structure. Now, we
can step into the main directory:
# cd ./yowsup-master
And from there, we can build the project. To build the software, you need to have
installed even python-devel. You can install it with:
# yum install -y python-devel
Now, you can finally build the project using:
# python setup.py install
setup.py will resolve all the dependencies for us, avoiding the use of pip, which
installs all the dependencies and the required packages manually.
Getting ready to send messages
Now that we are finally ready to configure our package, the first thing to do is create
the configuration file. The configuration needs to be in the following form:
# cat ./yowsup.config
cc=
phone=
id=
password=
The field cc must be filled with the country code.
The phone field is composed of country code + area code + phone number. Please
remember that the country code must be provided without + or 00 leading.
[ 341 ]
Integrating Zabbix
The ID field is used in registration calls and for logging in. WhatsApp has recently
deprecated using IMEI/MAC to generate the account's password in updated
versions of their clients. Use the --v1 switch to try it anyway. Typically, this field
should contain the phone's IMEI if your account is set up on a Nokia or Android
device or the MAC address of the phone's WLAN for iOS devices. If you are not
trying to use existing credentials, you can leave this field blank or remove it.
Finally, password has the login password. You will get this password when you
register the phone number using yowsup-cli. If you are registering a number, you
need to leave this field blank and populate it once you have your password.
It is recommended that you set a permission 600 to the
configuration file, and since the command line will be used by
our Zabbix server account, you can enforce the security with a
sudo role provided only to your Zabbix account. Only then the
Zabbix server will be able to send out messages.
Registering the yowsup client
Now it's time to register our client, thus enabling it to send messages.
First of all, we need a phone number to sacrifice; this phone number will then be
used for this application. Here, it is important to have a real mobile number where
we can receive SMS.
To register our client, we need to properly fill in the configuration file as previously
explained. We need then to populate id and phone number in our yowsup.config
configuration file. We can let the other fields remain empty for now.
Once this is done, we can run the following command:
# ./yowsup-cli registration -c ./yowsup.config -r sms
INFO:yowsup.common.http.warequest:{"status":"sent","length":6,"method":"s
ms","retry_after":1805}
status: sent
retry_after: 1805
length: 6
method: sms
#
[ 342 ]
Chapter 10
Once this is done, we should receive an SMS in our phone in the NNN-NNN form.
We need to use this command as follows:
# ./yowsup-cli registration -c ./yowsup.config -R 117-741
INFO:yowsup.common.http.warequest:{"status":"ok","login":"41076XXXXXX","p
w":"w3cp6Vb7UAUlKG6/xhx/1K4hA=","type":"existing","expiration":146511959
9,"kind":"free","price":"\u20ac 0,89","cost":"0.89","currency":"EUR","pri
ce_expiration":1439763526}
status: ok
kind: free
pw: w3cp6Vb7UAUlKG6/xhx/1K4hA=
price: € 0,89
price_expiration: 1439763526
currency: EUR
cost: 0.89
expiration: 1465119599
login: 41076XXXXXXX
type: existing
#
Now, we have received the password encoded in BASE64. The password is specified
in the field as pw: w3cp6Vb7UAUlKG6/xhx/1K4hA=. We need to include this
password in our yowsup.config configuration file.
Sending the first WhatsApp message
Finally, we have everything ready to be used. The first thing that we can try to do is
send a message. Now, for all the time required for those tests, we can use the new
yousup account. From there, we can run the following:
# $HOME/yowsup-master/yowsup-cli demos -c ./yowsup.config -s 4176XXXXX
"Test message form cli"
WARNING:yowsup.stacks.yowstack:Implicit declaration of parallel layers in
a tuple is deprecated, pass a YowParallelLayer instead
INFO:yowsup.demos.sendclient.layer:Message sent
Yowsdown
[ 343 ]
Integrating Zabbix
We can now send another message and test whether the messages are getting
delivered. Then, we can run the following from yowsup:
# $HOME/yowsup-master/yowsup-cli demos -c ./yowsup.config -s 4176XXXXX
"Test message form cli. 2nd test"
WARNING:yowsup.stacks.yowstack:Implicit declaration of parallel layers in
a tuple is deprecated, pass a YowParallelLayer instead
INFO:yowsup.demos.sendclient.layer:Message sent
Now, we can see the result on our phone or directly online using WhatsApp web.
The result is the following:
Now, let's see what the options used are. First of all, we've used the demo client.
Securing the yowsup setup
Before proceeding any further, it makes sense to restrict access to yowsup to Zabbix
and the relative Zabbix server account.
To do that, we need to create a user ad hoc, for example, yowsup. Then from root, we
can run the following command:
# useradd yowsup
[ 344 ]
Chapter 10
Create the relative password that executes the following command from root:
# passwd yowsup
Changing password for user yowsup.
New password:
Retype new password:
passwd: all authentication tokens updated successfully.
Now it is time to edit the sudoers and allow the account using your Zabbix server to
execute the required command. Then, we need to run the following from root:
#visudo -f /etc/sudoers.d/Zabbix
We need to add the following content:
zabbix ALL=(ALL) NOPASSWD: /usr/bin/sudo -l
zabbix ALL=(ALL) NOPASSWD: /home/yowsup/yowsup-master/yowsup-cli *
Now, we can test whether the account with which Zabbix will be able to run all
the required commands can become our Zabbix account. Then, type the following
command:
$ sudo -l
The output must contain the following section:
User zabbix may run the following commands on this host:
(ALL) NOPASSWD: /usr/bin/sudo –l
(ALL) NOPASSWD: /home/yowsup/yowsup-master/yowsup-cli *
Now, the last thing to do is transfer all the files and data to our new yowsup account
by running the following command as root:
# cp -r -a yowsup-master /home/yowsup/
# chown –R yowsup:yowsup /home/yowsup/*
Yowsup stores all the history at $HOME/.yowsup/ just in case
you are relocating a preexistent setup. This is something you
need to consider.
Test whether everything works as expected by running the following command from
the Zabbix account:
$ sudo -u yowsup
/home/yowsup/yowsup-master/yowsup-cli
Available commands:
[ 345 ]
Integrating Zabbix
===================
demos, version, registration
Now, if you don't get the same output, it is better to check your configuration. Now,
as a final test, we can send a message from the Zabbix account, and then, from
Zabbix, you can run:
$ sudo -u yowsup /home/yowsup/yowsup-master/yowsup-cli demos -c /home/
yowsup/yowsup-master/yowsup.config -s 4176XXXXXX "Test message form
zabbix 1st test"
WARNING:yowsup.stacks.yowstack:Implicit declaration of parallel layers in
a tuple is deprecated, pass a YowParallelLayer instead
INFO:yowsup.demos.sendclient.layer:Message sent
Yowsdown
To confirm that everything works as expected, you should see the message arrive at
your terminal or WhatsApp web, as shown in the following screenshot:
Here, you see that the message has been sent by me as I have saved the number that I
use to send messages from Zabbix under my name.
[ 346 ]
Chapter 10
Creating our first Zabbix alert group
Now that we've secured and locked down our setup by taking care to grant Zabbix
the required privilege to send messages, but to avoid reading the configuration
password file, it is time to think about a real scenario of usage. Now, you've tasted
the basic functionality of this software, but in a real scenario, we need to consider
that the messages need to be delivered to a team or a group of people that might
change from time to time following the nightshift plan, the weekly support shift
plan, and so on. To solve this problem, we can simply create a WhatsApp group.
Luckily, the software provides us with the functionality to create a group and add/
remove people from a group, among many other functions.
Here, we will see how we can create a group called zabbix_alert in this example.
From the yowsup account, we can then run the following command:
# cd yowsup-master && ./yowsup-cli demos -c yowsup.config
--yowsup
This command starts the Yowsup command-line client. It is actually an interactive
shell that allows us to send extended commands to WhatsApp. The following is the
welcome message:
Yowsup Cli client
==================
Type /help for available commands
Now, if we type /help, we can have an idea of the power of this shell; let's do it:
[offline]:/help
---------------------------------------------/profile
setPicture
[path]
Set profile picture
/profile
setStatus
[text]
Set status text
/account
delete
/group
info
[group_jid]
Get group info
/group
picture
[group_jid] [path]
Set group picture
/group
invite
comma separated list
[group_jid] [jids]
Invite to group. Jids are a
/group
leave
[group_jid]
Leave a group you belong to
/group
setSubject
[group_jid] [subject] Change group subject
Delete your account
/group
demote
[group_jid] [jids]
are a comma separated list
Remove admin of a group. Jids
/group
promote
[group_jid] [jids]
Jids are a comma separated list
Promote admin of a group.
[ 347 ]
Integrating Zabbix
/group
kick
comma separated list
[group_jid] [jids]
Kick from group. Jids are a
/help
Print this message
/seq
Send init seq
/contacts sync
[contacts]
Sync contacts, contacts
should be comma separated phone numbers, with no spaces
/keys
set
Send prekeys
/keys
get
[jids]
Get shared keys
/image
send
[number] [path]
Send and image
/presence
available
Set presence as available
/presence subscribe
presence updates
[contact]
Subscribe to contact's
/presence unsubscribe [contact]
presence updates
Unsubscribe from contact's
/presence
name
Set presence name
/presence
unavailable
[name]
Set presence as unavailable
/ping
Ping server
/L
Quick login
/state
paused
[jid]
Send paused state
/state
typing
[jid]
Send typing state
/contact
contact
picture [jid]
Get profile picture for
/contact
for contact
picturePreview [jid]
Get profile picture preview
/contact
lastseen
Get lastseen for contact
[jid]
/groups
create [subject] [jids]
Create a new group with the
specified subject and participants. Jids are a comma separated list. Use
'-' to keep group without participants but you.
/groups
to
list
List all groups you belong
/disconnect
Disconnect
/login
[username] [b64password]
Login to WhatsApp
/ib
clean
Send clean dirty
[dirtyType]
/message
broadcast [numbers] [content]
should comma separated phone numbers
Broadcast message. numbers
/message
Send message to a friend
send [number] [content]
---------------------------------------------[offline]:
[ 348 ]
Chapter 10
As you can quickly spot, this is a very complete client as it allows us to operate
against all the possible options that the messaging service provides us.
Now, before being able to create a group, we need to log in. Note that the shell
provides you your status. In this case, we are still [offline]. We can use the quick
login as we've specified in our configuration file after the –c option. Then, we can
simply run this command:
[offline]:/L
Auth: Logged in!
[connected]:
Now, the status is changed to [connected], and we can finally send commands.
Now we will create the group with group create, followed by group name and a
comma separated list of phone numbers we would like to add; in this example, it is
only one number, but you can add all the numbers you wish to add here in a commaseparated list:
[connected]:/groups create zabbix_alert 4176XXXXXX
The following is the output:
[connected]:INFO:yowsup.layers.protocol_groups.layer:Group create success
Iq:
ID: 1
Type: result
from: g.us
Notification: Notification
From: [email protected]
Type: w:gp2
Participant: [email protected]
Creator: 39340XXXXXXX @s.whatsapp.net
Create type: new
Creation timestamp: 1436940409
Subject: zabbix_alert
Subject owner: [email protected]
Subject timestamp: 1436940409
Participants: {[email protected]': 'admin', '4176XXXXXXX@s.
whatsapp.net': None}
[connected]:
[ 349 ]
Integrating Zabbix
The result of this command is shown in the following screenshot:
Here, the group JID and the group identifier are:
From: [email protected]
The JID is composed of the phone number that creates the group, followed by a
unique identifier. Now we are ready to send the first message to this group using a
command line. We can run the following command:
# ./yowsup-cli demos -c ./yowsup.config -s [email protected]
"Test message to zabbix_alert group"
[ 350 ]
Chapter 10
The result is shown in the following screenshot:
Now, as the final step, it make sense to have more than one group administrator
as it is safer to have someone human that can manage the emergency by adding a
newcomer who is not included in the automated process, and so on.
To add one more group administrator, we need to log in and access the interactive
shell with:
# ./yowsup-cli demos -c ./yowsup.config --yowsup
Yowsup Cli client
==================
Type /help for available commands
[offline]:/L
Auth: Logged in!
[connected]:
[ 351 ]
Integrating Zabbix
Now, we can run our command, which will be a group command. Then promote
the group JID and the list of numbers that we want promote to admin. Here is just
one number:
[connected]:/group promote [email protected] 4176XXXXXX
[connected]:INFO:yowsup.layers.protocol_groups.layer:Group promote
participants success
[connected]:
The result is shown in the following screenshot:
Now, I can personally add and remove contacts from this group.
[ 352 ]
Chapter 10
Integrating yowsup with Zabbix
Now we are finally ready to integrate Zabbix with our WhatsApp gateway. First of
all, we need to create the appropriate script to use the command line by using the
proper sudo command. The script needs to be placed at the AlertScript location
that we can retrieve from here:
grep AlertScript /etc/zabbix/zabbix_server.conf
### Option: AlertScriptsPath
# AlertScriptsPath=${datadir}/zabbix/alertscripts
AlertScriptsPath=/usr/lib/zabbix/alertscripts
Then, we can create our script in the /usr/lib/zabbix/alertscripts directory.
We can create a script called whatsapp.sh with the following content:
$ cat /usr/lib/zabbix/alertscripts/whatsapp.sh
#!/bin/bash
BASEDIR=/home/yowsup/yowsup-master
sudo -u yowsup $BASEDIR/yowsup-cli demos -c $BASEDIR/yowsup.config -s $1
"$2 $3"
Now it's time to create a new notification method that will use our brand-new script.
To create a new media type, you need to navigate to Administration | Media type |
Create media type and fill in the form, as shown in the following screenshot:
[ 353 ]
Integrating Zabbix
Now, we need to create the action that will use our new media type. Let's then go
on to Configuration | Actions, select Trigger in the drop-down menu, and click on
Create action, as shown in the following screenshot:
Then, we need to define in the Operations tab to whom we would like to send
this message. Here, we've decided to send the message to the entire Zabbix
administrators group, as shown in the following screenshot:
[ 354 ]
Chapter 10
Now, we need to populate all the media fields of all the accounts that would like to
receive alerts and that are part of this example of the Zabbix administrators group.
[ 355 ]
Integrating Zabbix
Then, we need to go to Administration | Users, select the user, and then add media
as whatsapp. Then, we need to write the phone number without + or 00 in front of
the country code, as shown in the following screenshot:
Here, of course, we can select which severity can be sent out using this media.
Now, we can act in two different ways—either send the messages to all the accounts
listed in a group in the media section, or use the WhatsApp group. Then, in our case,
we can define just a group with one account or even only an account that uses the
group [email protected] (that we created a few pages ago) as media.
We can debug and see the flow of messages sent to our media by looking at the
actions and monitoring them after navigating to Administration | Audit and
selecting Action log. There, we can see all the actions that are triggered. In the
following screenshot, you see an event, which I've caused, to test whether everything
works as expected. In the next screenshot, you can see the event caused by a
temporary iptables rule that has been properly tracked:
[ 356 ]
Chapter 10
I've also slightly changed our whatsapp.sh script in order to properly track how
it is called:
$ cat /usr/lib/zabbix/alertscripts/whatsapp.sh
#!/bin/bash
BASEDIR=/home/yowsup/yowsup-master
echo "sudo -u yowsup $BASEDIR/yowsup-cli demos -c $BASEDIR/yowsup.
config -s $1 \"$2 $3\"" >> /var/log/whatsapp.log
sudo -u yowsup $BASEDIR/yowsup-cli demos -c $BASEDIR/yowsup.config -s
$1 "$2 $3"
As you can see in the highlighted line, I've added a sort of log. Now, let's see how
our script has been called:
$ tail -n 12 /var/log/whatsapp.log
sudo -u yowsup /home/yowsup/yowsup-master/yowsup-cli demos -c /home/
yowsup/yowsup-master/yowsup.config -s 4176XXXXXXX "OK: More than 100
items having missing data for more than 10 minutes Trigger: More than 100
items having missing data for more than 10 minutes
Trigger status: OK
Trigger severity: Warning
Trigger URL:
[ 357 ]
Integrating Zabbix
Item values:
1. Zabbix queue over 10m (Zabbix server:zabbix[queue,10m]): 0
2. *UNKNOWN* (*UNKNOWN*:*UNKNOWN*): *UNKNOWN*
3. *UNKNOWN* (*UNKNOWN*:*UNKNOWN*): *UNKNOWN*
Original event ID: 1060"
As you can see in the following screenshot, the command has been called properly,
and even if the message is written in multiple lines, it has been delivered properly.
Now, for our end-to-end test, we can close our check with the message received:
This integration can be really useful, especially nowadays that people have
smartphones always connected to the network. Here, there are some things to take
into account. First of all, we need to decide whether we want to send an alarm to a
specific group, or people individually. If we want to alarm the group, we need to use
the group JID and then 39340XXXXXXX-1436940409.
The same message has also been delivered to the Zabbix_alert group as, within the
Zabbix administrator group we previously configured, the WhatsApp group JID is
the default WhatsApp media for Admin (Zabbix administrator).
[ 358 ]
Chapter 10
The following screenshot displays the result:
Now, we can move on and see how to integrate Zabbix with RT.
An overview of Request Tracker
Quoting from the Best Practical website:
"RT is a battle-tested issue tracking system which thousands of organizations use
for bug tracking, help desk ticketing, customer service, workflow processes, change
management, network operations, youth counseling and even more. Organizations
around the world have been running smoothly thanks to RT for over 10 years."
In other words, it's a powerful, yet simple, open source package to display the
Zabbix integration. This is not to say that it is the only issue tracking system
that you can use with Zabbix; once the principles behind the following sample
implementation are clear, you will be able to integrate any product with your
monitoring system.
[ 359 ]
Integrating Zabbix
Request Tracker (RT) is a web application written in Perl that relies on a web server
to expose its frontend and on a relational database to keep all its data on. The main
means of interaction with the system is through the web interface, but it also features
a powerful e-mail-parsing utility that can categorize an e-mail message, turn it into a
full-fledged ticket, and keep track of the subsequent mail exchange between the user
and the support staff. Closer to our interests, it also features a simple, yet effective,
REST API that we'll rely on in order to create and keep track of the existing tickets
from Zabbix. On the other hand, a powerful scripting engine that can execute custom
chunks of code called scripts not only allows RT to automate its internal workings
and create custom workflows, but also allows it to communicate with external
systems using any available protocol.
The following diagram shows the basic application architecture. All the data is kept
in a database, while the main application logic can interact with the outside world
either through the web server or via e-mail and custom scripts.
Request Tracker
Database
Main Application Logic
Script
email
Webserver
Frontend
Client - email
REST API
Operator browser
Client - browser
[ 360 ]
External systems
Chapter 10
This is not the place to cover an in-depth installation and configuration of RT, so
we will assume that you already have a working RT server with at least a few users
and groups already set up. If you need to install RT from scratch, the procedure is
quite simple and well documented; just follow the instructions detailed at http://
www.bestpractical.com/docs/rt/4.2/README.html. Refer to the Request Tracker
website link provided earlier for further information.
Setting up RT to better integrate with
Zabbix
The two basic elements of RT are tickets and queues. The function of a ticket is
to keep track of the evolution of an issue. The basic workflow of the tracks' said
evolution can be summarized in the following points:
• A ticket is created with the first description of the problem
• An operator takes ownership of the ticket and starts working on it
• The evolution of the problem is recorded in the ticket's history
• After the problem's resolution, the ticket is closed and archived
All of the ticket's metadata, from its creation date to the amount of time it took to
close it, from the user who created it to the operator that worked on it, and so on, is
recorded and grouped with all the other tickets' metadata in order to build statistics
and calculate service-level agreements.
A queue, on the other hand, is a specific collection of tickets and a way to file new
tickets under different categories. You can define different queues based on the
different organization departments, different products you are providing support
for, or any other criteria that can make it easier to organize tickets.
Let's see what we can do to configure RT queues and tickets so that we can transfer
all the information we need to and from Zabbix, while keeping any existing
functionality as a generic issue tracker as is.
Creating a custom queue for Zabbix
A nice feature of queues is that from the fields that need to be filled out to the details
of the workflow, you can customize every aspect of a ticket that belongs to a specific
queue. The first step is, therefore, to create a specific queue for all tickets created
from a Zabbix event action. This will allow us to define specific characteristics for the
corresponding Zabbix tickets.
[ 361 ]
Integrating Zabbix
Creating a queue is quite simple. Just go to Admin | Queues | Create and fill in the
form. For our purposes, you don't need to specify more than a name for the queue
and an optional description, as shown in the following screenshot:
After the queue is created, you will be able to configure it further by going to Admin
| Queues | Select and choosing the Zabbix queue. You should grant the user and
staff rights to a user group or, at the very least, to some specific users so that your IT
staff can work on the tickets created by Zabbix. You will also want to create custom
fields, as we will see in a couple of paragraphs.
First, let's move on to look at what parts of a ticket are most interesting from an
integrator's point of view.
Customizing tickets – the links section
Keeping in mind our goal to integrate Zabbix actions and events with RT, the Links
section of a ticket is of particular interest to us. As the name suggests, you can define
links to other tickets as dependencies or to other systems as further referrals. You can
insert useful links during ticket creation or while editing it. The following screenshot
shows this:
[ 362 ]
Chapter 10
As you probably already imagined, we'll rely on the Refers to: link field to link back
to the Zabbix event that created the ticket. As we will see in the following pages,
the event's acknowledge field will, in turn, show a link to the corresponding ticket
so that you can move easily from one platform to the other in order to keep track of
what's happening.
Customizing tickets – ticket priority
Another interesting field in the Basics section of a ticket is the ticket's priority. It's
an integer value that can be from 0 to 100, and it's quite useful to sort tickets
depending on their severity level. There is no official mapping of RT priority and a
few other descriptive severity levels, such as those used by the Zabbix triggers. This
means that if you want to preserve information about trigger severity in the ticket,
you have two choices:
• Ignore the ticket's priority and create a custom field that shows the trigger
severity as a label
• Map the trigger severity values to the ticket's priority values as a convention,
and refer to the mapping while creating tickets
[ 363 ]
Integrating Zabbix
The only advantage of the first option is that the single ticket will be easily readable,
and you will immediately know about the severity of the corresponding trigger. On
the other hand, the second option will allow you to sort your tickets by priority and
act first on the more important or pressing issues with a more streamlined workflow.
While creating a ticket from Zabbix, our suggestion is, therefore, to set ticket
priorities based on the following mapping:
Trigger severity label
Trigger severity value
Ticket priority value
Not classified
0
0
Information
1
20
Warning
2
40
Average
3
60
High
4
80
Disaster
5
100
There is nothing to configure either on Zabbix's or on RT's side. This mapping will
use the full range of priority values so that your Zabbix tickets will be correctly
sorted not only in their specific queue, but also anywhere in RT.
Customizing tickets – the custom fields
As we have seen in Chapter 6, Managing Alerts, a Zabbix action can access a great
number of macros and, thus, expose a lot of information about the event that
generated it. While it makes perfect sense to just format this information in a
readable manner while sending e-mails, with the availability of custom fields for RT
tickets, it makes less sense to limit all of the event details just to the ticket description.
In fact, one great advantage of custom fields is that they are searchable and filterable
just as any other native ticket field. This means that if you put the host related to a
ticket event in a custom field, you'll be able to search all tickets belonging to the said
host for reporting purposes, assign a host's specific tickets to a particular user, and so
on. So, let's go ahead and create a couple of custom fields for the tickets in the Zabbix
queue that will contain information, which we'll find useful later on. Go to Admin |
Custom Fields | Create and create a Hosts custom field, as shown in the following
screenshot:
[ 364 ]
Chapter 10
Make sure that you select Enter multiple values as the field type. This will allow
us to specify more than a single host for those complex triggers that reference items
from different hosts.
Speaking of triggers and items, you can follow the same procedure to create other
custom fields for the trigger name, item names, or keys. After you are done with
this, you will need to assign these fields to the tickets in the Zabbix queue. Select the
Zabbix queue by navigating to Admin | Queues | Select, and for the Tickets form,
go to Custom fields | Tickets. Select the fields that you wish to assign to your tickets:
[ 365 ]
Integrating Zabbix
After you are done, you will see the following fields in every ticket of the
Zabbix queue:
Depending on your needs, you can create as many custom fields as you want for the
trigger and event acknowledge history, host's IP interfaces, custom macros, and so
on. You will be able to search for any of them, and for the three shown earlier, you
can do so by selecting the Zabbix queue in the search page of the RT frontend. At the
bottom of the search form, you can see the newly created fields just as expected:
[ 366 ]
Chapter 10
Connecting to the Request Tracker API
RT exposes a REST-type API that relies directly on the HTTP protocol to handle
requests and responses. This means that the API is easily tested and explored using
tools such as wget and netcat. Let's do that to get a feel of how it works before
introducing the Python library that we'll use for the rest of the chapter.
The base URL for the RT API is located at ../REST/1.0/ after the base URL of
Request Tracker itself. This means that if your base URL is http://your.domain.
com/rt, the API will be accessible at http://your.domain.com/rt/REST/1.0/.
If you try to connect to it, you should get a message asking for credentials (some
response headers are removed to improve readability):
$ ncat example.com 80
GET /rt/REST/1.0/ HTTP/1.1
Host: example.com
[ 367 ]
Integrating Zabbix
HTTP/1.1 200 OK
[…]
Content-Type: text/plain; charset=utf-8
22
RT/4.2.0 401 Credentials required
The API doesn't have a special authentication mechanism separated from the rest
of the application, so the best way to authenticate is to get a session cookie from the
main login form and use it for each API request. To get the cookie, let's use wget:
$ wget --keep-session-cookies --save-cookies cookies.txt --post-data
'user=root&pass=password' http://example.com/rt/
The command that will save the session cookie in the cookies.txt file is as follows:
$ cat cookies.txt
# HTTP cookie file.
# Generated by Wget on 2015-07-10 10:16:58.
# Edit at your own risk.
localhost FALSE /rt FALSE 0 RT_SID_example.com.80
2bb04e679236e58b406b1e554a47af43
Now that we have a valid session cookie, we can issue requests through the API.
Here is the GET request for the general queue:
$ ncat localhost 80
GET /rt/REST/1.0/queue/1 HTTP/1.1
Host: localhost
Cookie: RT_SID_example.com.80=2bb04e679236e58b406b1e554a47af43
HTTP/1.1 200 OK
[...]
Content-Type: text/plain; charset=utf-8
RT/4.2.0 200 Ok
id: queue/1
Name: General
Description: The default queue
[ 368 ]
Chapter 10
CorrespondAddress:
CommentAddress:
InitialPriority: 0
FinalPriority: 0
DefaultDueIn: 0
As you can see, the API is quite easy to interact with without any special encoding
or decoding. For our purposes, however, it is even easier to use a library that will
spare us the burden of parsing each HTTP request. Rtkit is a Python 2.x library that
makes it even easier to connect to the API from within a Python program, for which
it allows us to send requests and get responses using native Python data structures.
The installation is very simple using pip:
$ pip install python-rtkit
Here, we're supposing that you have already installed pip. If not, please install it
with this command here:
$ yum install -y python-pip
Once installed, the library will be available upon importing various Rtkit modules.
Let's see the same preceding interaction (authenticating and requesting the general
queue) from within a Python 2.x session:
$ python2
Python 2.7.5 (default, Sep
6 2013, 09:55:21)
[GCC 4.8.1 20130725 (prerelease)] on linux2
Type "help", "copyright", "credits" or "license" for more information.
>>> from rtkit.resource import RTResource
>>> from rtkit.authenticators import CookieAuthenticator
>>> from rtkit.errors import RTResourceError
>>>
>>> res = RTResource('http://localhost/rt/REST/1.0/', 'root', 'password',
CookieAuthenticator)
>>>
>>> response = res.get(path='queue/1')
>>> type(response)
<class 'rtkit.resource.RTResponse'>
>>> type(response.parsed)
<type 'list'>
>>> response.parsed
[ 369 ]
Integrating Zabbix
[[('id', 'queue/1'), ('Name', 'General'), ('Description', 'The
default queue'), ('CorrespondAddress', ''), ('CommentAddress', ''),
('InitialPriority', '0'), ('FinalPriority', '0'), ('DefaultDueIn', '0')]]
As you can see, a response is parsed into a list of tuples with all the attributes of an
RT object.
Now that we have a custom queue and custom fields for Zabbix tickets, we are
able to interact with the API through the Python code, and the setting up process on
RT's side is complete. We are ready to actually integrate the Zabbix actions and the
RT tickets.
Setting up Zabbix to integrate with
Request Tracker
Our goal is to define a Zabbix action step that, when executed, will:
• Create a ticket with all the relevant event information
• Link the ticket back to the Zabbix event that generated it
• Acknowledge the event with a link to the ticket just created
While the first point can be covered with a simple e-mail action to RT, we need
custom code to take care of the other two. The best way to do this is to define a new
media type in Zabbix as a custom alert script. The script will do the following:
• Take the action message
• Parse it to extract relevant information
• Create a ticket with all custom fields and link the referrals filled out
• Get back the ticket ID
• Write a link to the created ticket in the event's acknowledgment field
[ 370 ]
Chapter 10
Before actually writing the script, let's create the media type and link it to a user (you
can assign the media type to any user you want; the custom rt_tickets user has
been used here, as shown in the following screenshot):
While linking the media type to the user, use the RT base URL in the Send to
field, so you won't need to define it statically in the script. This is shown in the
following screenshot:
[ 371 ]
Integrating Zabbix
Once saved, you'll see all relevant information at a glance in the Media tab, as shown
in the following screenshot. Just after the URL address, you'll find the notification
periods for the media and, after that, a six-letter code that shows the active severity
levels. If you disabled any of them, the corresponding letter would be in gray:
Now, let's create an action step that will send a message to our rt_tickets user
through the custom media type. Needless to say, the rt_tickets user won't receive
any actual message as the alert script will actually create an RT ticket, but all of this
is completely transparent from the point of view of a Zabbix action. You can put any
information you want in the message body, but, at the very least, you should specify
the trigger name in the subject and the event ID, severity, hosts, and items in the
body so that the script will parse them and fill them in the appropriate ticket fields.
This is shown in the following screenshot:
[ 372 ]
Chapter 10
We are now ready to actually write the script and use it to create tickets from Zabbix.
Creating RT tickets from the Zabbix
events
Zabbix will search for custom alert scripts in the directory specified by
AlertScriptsPath in the zabbix_server.conf file. In the case of a default install,
this would be ${datadir}/zabbix/alertscripts, and in Red Hat, it is set to
/usr/lib/zabbix/alertscripts/.
[ 373 ]
Integrating Zabbix
This is where we will put our script called rt_mkticket.py. The Zabbix action
that we configured earlier will call this script with the following three arguments
in this order:
• Recipient
• Subject
• Message
As we have seen, the content of the subject and the message is defined in the action
operation and depends on the specifics of the event triggering action. The recipient
is defined in the media type configuration of the user receiving the message, and it is
usually an e-mail address. In our case, it will be the base URL of our Request Tracker
installation.
So, let's start the script by importing the relevant libraries and parsing the
arguments:
#!/usr/bin/python2
from pyzabbix import ZabbixAPI
from rtkit.resource import RTResource
from rtkit.authenticators import CookieAuthenticator
from rtkit.errors import RTResourceError
import sys
import re
lines = re.findall(r'^(?!(Host:|Event:|Item:|Trigger severity:))
(.*)$', message, re.MULTILINE)
desc = '\n'.join([y for (x, y) in lines])
rt_url = sys.argv[1]
rt_api = rt_url + 'REST/1.0/'
trigger_name = sys.argv[2]
message= sys.argv[3]
Now, we need to extract at least the event URL, trigger severity, list of host names,
and list of item names from the message. To do this, we will use the powerful regular
expression functions of Python:
event_id = re.findall(r'^Event: (.+)$', message, re.MULTILINE)[0]
severity = re.findall(r'^Trigger severity: (.+)$', message,
re.MULTILINE)[0]
hosts = re.findall(r'^Host: (.+)$', message, re.MULTILINE)
items = re.findall(r'^Item: (.+)$', message, re.MULTILINE)
lines = re.findall(r'^(?!(Host:|Event:|Item:|Trigger severity:))
(.*)$', message, re.MULTILINE)
desc = '\n'.join([y for (x, y) in lines])
[ 374 ]
Chapter 10
While the event ID has to be unique, a trigger can reference more than one item and,
thus, more than one host. The preceding code will match any line beginning with
Host: to build a list of hosts. In the preceding action message, we just put one Host:
{HOST.NAME} line for readability purposes, but your actual template can contain
more than one (just remember to use {HOST.NAME1}, {HOST.NAME2}, {HOST.NAME3},
and so on, or you'll end up with the same host value repeatedly). Of course, the same
goes for item names. The rest of the message is then extracted with the opposite of
the regexps used before and joined back in a single multiline string.
Now, the macro we used for trigger severity is {TRIGGER.SEVERITY}. This means
that it will be substituted by a string description and not a numerical value. So, let's
define a simple dictionary with severity labels and RT ticket priority values mapped,
as explained earlier in the chapter:
priorities = {
'Not classified': 0,
'Information': 20,
'Warning': 40,
'Average': 60,
'High': 80,
'Disaster': 100 }
We also need to know in advance the name of the queue we are creating the ticket in
or, better yet, its ID number:
queue_id = 3
Now that we have everything we need, we can proceed to build the request to create
a new ticket and then send it over to Request Tracker:
ticket_content = {
'content': {
'Queue': queue_id,
'Subject': trigger_name,
'Text': desc,
'Priority': priorities[severity],
'CF.{Hosts}': ','.join(hosts),
'CF.{Items}': ','.join(items),
'CF.{Trigger}': trigger_name
}
}
links = {
'content': {
'RefersTo': event_url
}
}
[ 375 ]
Integrating Zabbix
First, we create two dictionaries, one for the main ticket content and the second for
the links section, which must be edited separately.
Then, we get to the main part of the script: first, we log in to the RT API (make sure
to use your actual username and password credentials!), create a new ticket, get the
ticket ID, and input the link to the Zabbix event page:
rt = RTResource(rt_api, 'root', 'password', CookieAuthenticator)
ticket = rt.post(path='ticket/new', payload=ticket_content,)
(label,ticket_id) = ticket.parsed[0][0]
refers = rt.post(path=ticket_id + '/links', payload=links,)
We are almost done. All that is left to do is acknowledge the Zabbix event with a link
back to the ticket we just created:
event_id = re.findall(r'eventid=(\d+)', event_url)[0]
ticket_url = rt_url + 'Ticket/Display.html?id=' + ticket_id.split('/')
[1]
print(ticket_url)
zh = ZabbixAPI('http://localhost/zabbix')
zh.login(user='Admin', password='zabbix')
ack_message = 'Ticket created.\n' + ticket_url
zh.event.acknowledge(eventids=event_id, message=ack_message)
This preceding code is fairly straightforward. After extracting the eventid value
and creating the URL for the ticket, we connect to the Zabbix API and edit the
acknowledge field of the event, effectively closing the circle.
Now that the script is complete, remember to give ownership to the zabbix user and
set the executable bit on it:
$ chown zabbix rt_mkticket.py
$ chmod +x rt_mkticket.py
The next time the action condition that you defined in your system returns true and
the action operation is carried out, the script will be executed with the parameters
we've seen before. A ticket will be created with a link back to the event, and the
event itself will be acknowledged with a link to the ticket.
Here is an example event. The link in the acknowledgement field corresponds to the
URL of the ticket:
[ 376 ]
Chapter 10
Here is the corresponding ticket. The Refers to: field contains a clickable link to the
event shown earlier, while the Custom Fields section reports the host, item, and
trigger information, just as expected:
[ 377 ]
Integrating Zabbix
The script, in much the same way as those explained in Chapter 9, Extending Zabbix, is
little more than a proof of concept, with as much focus on the readability and
ease of explanation as on pure functionality. Make sure that you add as many
condition checks and error-reporting functions as possible if you want to use it in a
production environment.
Summary
We have finally reached the end of our journey to mastering the Zabbix monitoring
system. In the course of the book, you learned how to plan and implement the
general monitoring architecture; how to create flexible and effective items, triggers,
and actions; and how to best visualize your data. You also learned how to implement
custom agents by understanding the Zabbix protocol and how to write the code
to manipulate every aspect of Zabbix through its API. In this chapter, we barely
scratched the surface of what's possible once you start taking advantage of what
you now know about Zabbix to integrate it better with your IT infrastructure. Many
more integration possibilities exist, including getting and updating users and groups
through an identity management system, getting inventory information through an
asset management system, feeding inventory information to a CMDB database, and
much more. Following the steps necessary to integrate Zabbix with a trouble ticket
management system and integrate the Zabbix monitoring solution with external and
different media, you learned how to prepare two systems such that they can share
and exchange data and knowledge of how to use each system's API in a coordinated
manner in order to get the systems to talk to each other. During our walkthrough, we
also covered and analyzed all the critical security aspects in order to make you aware
of the risk that a monitoring system can introduce and how you can mitigate them
with a proper setup. At this point in the book, you're now able to implement and set
up a segregated and secured monitoring system.
Our hope is that with the skills you just learned, you will be able to bring out the
full potential of the Zabbix monitoring system and make it a central asset of your IT
infrastructure. In doing so, your time and effort will be repaid many times over.
[ 378 ]
Index
A
action
{EVENT.DATE} macro 236
{EVENT.TIME} macro 236
{INVENTORY.SERIALNO.A} macro 236
about 234
conditions, defining 236-239
defining 235, 236
friends macro 236
operations, selecting 239
URL 236
action operations, selecting
about 239
messages and media 241-243
remote commands 243
steps and escalations 239-241
active agent auto-registration
about 262
configuring 262
real case scenario 263, 264
ad hoc graphs
analyzing 183-185
hacking 185-187
agent protocol
about 294-296
cases 296
aggregated items
about 174
building 175, 176
features 174
architecture, Zabbix
database, installing 16-22
database server 4
database, sizing 29
distributed installation 5
for large environment 5
one server and many proxies 5
server 4
server, setting up 9-11
single server installation 5
web interface 39
web server 4
Auto-login flag 217
C
calculated items
about 174
building 176, 177
features 174
capacity planning
about 46
baseline, defining 48, 49
data, monitoring 46-48
load testing 49, 50
observer effect 46
trends, forecasting 51
check_ora_sendtrap
wrapper script, writing 287, 288
Corosync
about 86
configuring 87, 88
cURL option
URL 171
curve fitting process 51
custom graphs
analyzing 187-192
graph properties combinations,
reviewing 193-195
[ 379 ]
D
data
sending, zabbix_sender utility used 285
visualizing, through maps 195-199
database
considerations 27, 28
drivers, installing 125
installing 16-26
monitoring 124
monitor items, creating 132, 133
ODBC 124, 125
sizing 29-31
Database Management
Systems (DBMS) 124
data flow
about 66, 120-122
monitoring, with proxies 67, 68
overview 123, 124
Zabbix trapper items 122, 123
Data Source Name (DSN) 124
date
visualizing, through slide show 214
DBforBIX
URL 306
discovery rules
about 264, 265
CPUs and CPU cores 265
filesystem types 265
for templates 267-272
items 265, 266
network interfaces 265
return values 265, 266
SNMP OIDs 265
Distributed Replicated Block
Device (DRBD)
configuration, enabling 106
creating, on LVM partition 100, 101
filesystem, creating 104, 105
integrating, with Pacemaker 105
networking consideration 113-115
online verification, enabling 112, 113
optimizations 110
performance 110
primary device, defining 103
resources, enabling 101-103
setting on LVM, prerequisites 99, 100
synchronization 111, 112
used, for replicating filesystem 84, 85
downtimes
scheduled or planned downtimes 80
unscheduled or unexpected downtimes 80
E
entities
adding, to templates 246-248
environment size 2, 3
Estimated Time to Repair (ETR) 111
external checks
about 274
considerations 281
example 275-278
script 278-280
script, location 274, 275
script writing, rules 280
URL 277
F
filesystem
creating, on DRBD 104, 105
replicating, DRBD used 84
G
get protocol 289, 290
graphs
ad hoc graphs, analyzing 183-185
custom graphs, analyzing 187-191
simple graphs, analyzing 181-183
Graphviz
about 327, 328
URL 333
H
high availability (HA)
about 80
considerations 82, 83
failover, automating with resource
manager 83
implementing, for database 95-97
implementing, on web server 85, 86
[ 380 ]
switchover, automating with resource
manager 83
Zabbix Server, configuring 94, 95
hosts
discovering 258-262
templates, linking 256
housekeeping
considerations 32-38
disabling 39
HTTPD
configuring 90-93
HTTPD HA
configuring 86
I
installation
from packages 7
prerequisites 8
URL 7
Zabbix 6, 7
Zabbix, ways 7
Intelligent Platform Management
Interface (IPMI)
about 158
account, configuring 160, 161
installing 158, 159
items, configuring 162-164
monitoring 158
URL 158
iODBC 124
items
gathering 118, 119
IT service
about 218
configuring 219-221
levels 81, 82
status calculation algorithm, options 219
J
JMX
configuring 140, 142
considerations 142, 143
issues 143
Java gateway, installing 137-140
keys 142
monitoring 135
security aspects 136, 137
JQZabbix
URL 316
K
kernel
URL 270
L
Logical Unit Number (LUN) 83
Logical Volume (LV) 98
Logical Volume Manager (LVM) 98
low-level discovery protocol 297-301
LVM
about 99
configuring 107
DRBD, creating on partition 100, 101
DRBD, setting 99, 100
LVM2 98
M
macros
{HOST.CONN} 248
{HOST.DNS} 248
{HOST.HOST} 248
{HOST.IP} 248
{HOST.NAME} 248
about 201
user defined macros 253, 254
using 248-253
working with 208-210
Management Information Base (MIB) 144
maps
about 180
automated way generation, issues 331
creating 199-201
creating, from dot files 331-337
data, visualizing through 195-199
elements, adding 204-206
elements, selecting 206, 207
macros, working with 208-210
menu 204
Maximum Transmission Unit (MTU) 113
MBean 142
[ 381 ]
Mean Time To Recovery (MTTR) 82
MySQL ODBC drivers 126, 127
O
observer effect 46
ODBC
about 124, 125
database drivers, installing 125
database monitor items, creating 132, 133
iODBC 124
MySQL ODBC drivers 126, 127
Oracle ODBC drivers 129, 130
PostgreSQL ODBC drivers 127, 128
reference link 127
SQL query, considerations 134, 135
unixODBC 124
unixODBC, configuration files 130, 131
Zabbix, compiling 131, 132
OID 144
Oracle ODBC drivers
about 129
installing 129, 130
URL 129
P
Pacemaker
about 84, 89, 90
Apache/HTTPD, configuring 90-93
cluster, configuration 109, 110
configuring 108
DRBD configuration, enabling 106
DRBD, integrating with 105
LVM configuration 106, 107
network configuration 108
PostgreSQL, configuring 107
stickiness 90
URL 84
Performance Monitor facility 146
perl trap handler 151-154
Physical Volume (PV) 98
planned downtime. See scheduled
downtime
Point-In-Time Recovery (PITR) 97
PostgreSQL
clustering 97
configuring 107
PostgreSQL 9.2
installing 16
PostgreSQL ODBC drivers
about 127
installing 128
protocols
about 289
agent development, considerations 305, 306
agent protocol 294-296
get protocol 289, 290
low-level discovery protocol 297-301
sender protocol 290, 291
sender protocol, implementing
in Java 301-303
sender protocol, implementing
in Python 303, 304
proxy
about 54, 55
data flow, monitoring with 67, 68
deploying 56, 57
monitoring 69, 70
proxy, deploying
different Zabbix proxy database 64, 65
RPMs used 59-64
runtime proxy commands 58, 59
Pyzabbix
URL 313
Q
Quorum
about 89
no-Quorum policy 89
R
Recovery Time Objective (RTO) 111
remote commands 244
Request Tracker (RT)
about 359-361
API, connecting to 367-370
Best Practical, URL 340
custom queue, creating for Zabbix 361, 362
setting up, to integrate with Zabbix 361
URL 340
Zabbix, setting up for integration 370-373
RPMs
used, for deploying Zabbix proxy 59-64
[ 382 ]
RT, tickets
creating, from Zabbix 373-378
custom fields 364-366
links section 362, 363
ticket priority 363, 364
S
scheduled downtime 80
screens
creating 210
visualizing through 210
screens, elements
Action log 211
Clock 211
Data overview 211
dynamic elements 212-214
Graph 211
History of events 211
Host group issues 211
Host issues 211
Hosts info 211
Map 211
Plain text 211
Screen 211
Server info 211
Simple graph 211
Simple graph prototype 211
System status 211
Triggers info 211
Triggers overview 211
URL 211
scripts 360
Secure Shell (SSH) 73-75
security
about 71
network isolation 73
tunnels 73
VPN 76
without network configuration 72
sender protocol
about 290-292
clock properties, using in JSON items 293
undocumented feature 292, 293
server
agent, setting up 11
configuring 14, 15
configuring, for high availability 94, 95
package, creating 11, 12
package, installing 11, 12
packages, installing from 13
setting up 9-11
service level agreement (SLA) 81
session riding 202
Shoot The Other Node In The
Head (STONITH)
about 88
issues 88, 89
Siege
URL 49
Simple Network Management Protocol
(SNMP) 273
Simple Network Monitoring
Protocol. See SNMP
slides
on big display 215
on big display, considerations 216
slide show
automated 216, 217
date, visualizing through 214
Snapshot Logical Volume (SLV) 99
SNMP
about 143
monitoring 143-146
queries 146-148
snmptrapd process 149, 150
SNMP traps
about 149
perl trap handler 151-154
snmptrapd process 149, 150
snmpwalk tool
using 147
SourceForge
URL 288
SQL query
considerations 134, 135
SSH
key authentication, configuring 156-158
monitoring 155, 156
stickiness 90
sysUpTime 144
[ 383 ]
T
V
templates
combining 257, 258
creating 246
entities, adding 246, 247
exporting 254, 255
importing 254, 255
linking, to hosts 256
nesting 256, 257
trigger dependencies
managing 233, 234
trigger dependency graph
creating 329-331
trigger expressions
about 224
absolute values and percentages,
selecting between 228, 229
date function 227
functions, selecting 225
items, selecting 225
operations, as correlations 229-232
seconds and number of measurements,
selecting between 226
severity 228
time function 227
wiki, URL 225
tunnels
about 73
Secure Shell (SSH) 73-75
stunnel 75, 76
Values per second (VPS) 64
VIP (Virtual IP) 83
Volume Group (VG) 98
VPN 76
U
unexpected downtime
(unscheduled downtime) 80
unixODBC
about 124
configuration files 130, 131
URL 125
uptime 81
user parameter
about 281
considerations 284, 285
flexibility 282, 283
W
web interface
frontend configuration 40-45
installing 39
web page
authenticating 166-171
logging out 171-173
monitoring 164, 165
web server
high availability, implementing 85
WhatsApp
about 340
first WhatsApp message, sending 343, 344
first Zabbix alert group, creating 347-352
messages, sending 341, 342
wrapper script
writing, for check_ora_sendtrap 287, 288
Y
Yowsup
about 340
client, registering 342, 343
integrating, with Zabbix 353-359
requisites 340, 341
setup, securing 344-346
Z
Zabbix
action 234
agents 5
architecture, for large environment 4
big display, challenges 215
center slides, controlling 215
communicating with 301
compiling, with ODBC 131, 132
data, visualizing through maps 195-199
date, visualizing through slide show 214
external checks 274
[ 384 ]
features 3
forum, URL 277
graphs 181
host 258-262
installing 6, 7
IT services 218
items, data flow 120-122
Java gateway, installing 137-140
Java gateway, URL 140
monitoring data flow 66
performance tuning 46
protocols 289
proxy 5, 54, 55
screens, visualizing through 210
server 5
setting up, to integrate with RT 370-373
templates 246
trapper items 122, 123
trigger expressions 224
Zabbix API
about 308, 309
authenticating through 310-313
data, exporting 324
documentation, URL 309
exploring, with JQuery 316-319
first steps 309, 310
graphs, creating from data 327
Graphviz 327-329
hosts, redistributing to proxy 320, 321
JSON request 308, 309
operations, performing 319
PyZabbix library, using 313-316
tabular data, extracting 324-326
trigger dependency graph, creating 329-331
URL 308
users, adding 321-323
users, updating 321-323
version 1.8 308
zabbix_sender utility
dedicated script server, cons 288, 289
dedicated script server, pros 288, 289
new script 286, 287
testing 285
used, for sending data 285
[ 385 ]
Thank you for buying
Mastering Zabbix
Second Edition
About Packt Publishing
Packt, pronounced 'packed', published its first book, Mastering phpMyAdmin for Effective
MySQL Management, in April 2004, and subsequently continued to specialize in publishing
highly focused books on specific technologies and solutions.
Our books and publications share the experiences of your fellow IT professionals in adapting
and customizing today's systems, applications, and frameworks. Our solution-based books
give you the knowledge and power to customize the software and technologies you're using
to get the job done. Packt books are more specific and less general than the IT books you have
seen in the past. Our unique business model allows us to bring you more focused information,
giving you more of what you need to know, and less of what you don't.
Packt is a modern yet unique publishing company that focuses on producing quality,
cutting-edge books for communities of developers, administrators, and newbies alike.
For more information, please visit our website at www.packtpub.com.
About Packt Open Source
In 2010, Packt launched two new brands, Packt Open Source and Packt Enterprise, in order
to continue its focus on specialization. This book is part of the Packt Open Source brand,
home to books published on software built around open source licenses, and offering
information to anybody from advanced developers to budding web designers. The Open
Source brand also runs Packt's Open Source Royalty Scheme, by which Packt gives a royalty
to each open source project about whose software a book is sold.
Writing for Packt
We welcome all inquiries from people who are interested in authoring. Book proposals should
be sent to [email protected]. If your book idea is still at an early stage and you would
like to discuss it first before writing a formal book proposal, then please contact us; one of our
commissioning editors will get in touch with you.
We're not just looking for published authors; if you have strong technical skills but no writing
experience, our experienced editors can help you develop a writing career, or simply get some
additional reward for your expertise.
Zabbix Cookbook
ISBN: 978-1-78439-758-6
Paperback: 260 pages
Over 70 hands-on recipes to get your infrastructure
up and running with Zabbix
1.
Set up and configure your own Zabbix server
by using packages or from source.
2.
Automate your Zabbix infrastructure in order
to maintain your Zabbix setup.
3.
Create your own items and use them to monitor
your Zabbix infrastructure with the help of this
practical, step-by-step guide.
Zabbix Network Monitoring
Essentials
ISBN: 978-1-78439-976-4
Paperback: 178 pages
Your one-stop solution to efficient network
monitoring with Zabbix
1.
Effectively monitor a number of network devices
based on network security and segments.
2.
Adapt your monitoring solution to an array
of evolving network scenarios using Zabbix
discovery features.
3.
A fast-paced guide to Zabbix network
monitoring with a strategic focus on the
collection and organization of data.
Please check www.PacktPub.com for information on our titles
Zabbix Performance Tuning
ISBN: 978-1-78398-764-1
Paperback: 152 pages
Tune and optimize Zabbix to maximize performance
1.
Get up to speed with the ins and outs of
Zabbix's performance issues and their causes.
2.
Identify the root cause of underperformance
affecting implementation, and turn it around
to your benefit.
3.
A comprehensive guide, taking an engaging and
conversational approach to making administrator
and end user work easy by eliminating all
Zabbix-related performance problems.
Mastering Zabbix
ISBN: 978-1-78328-349-1
Paperback: 358 pages
Monitor your large IT environment efficiently
with Zabbix
1.
Create the perfect monitoring configuration
based on your specific needs.
2.
Extract reports and visualizations from
your data.
3.
Integrate monitoring data with other systems
in your environment.
4.
Learn the advanced techniques of Zabbix
to monitor networks and performances in
large environments.
Please check www.PacktPub.com for information on our titles


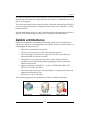
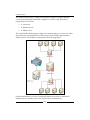


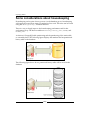


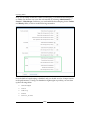


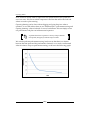


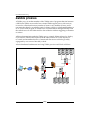


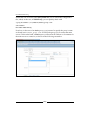
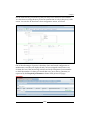

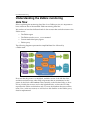


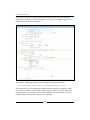
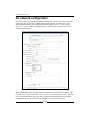


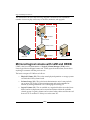
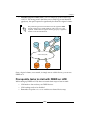


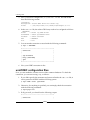
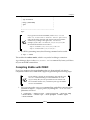

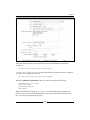


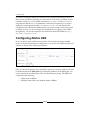
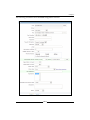

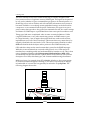


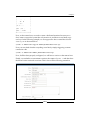


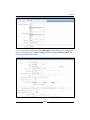

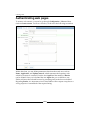


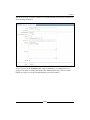


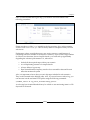


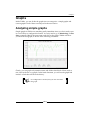
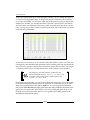

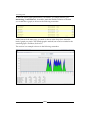


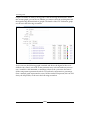

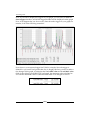
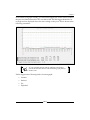
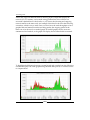


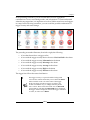
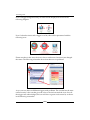


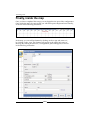


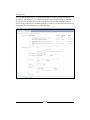


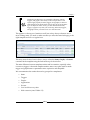
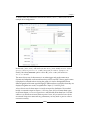


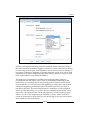
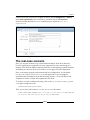
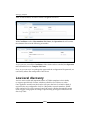


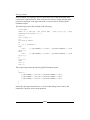
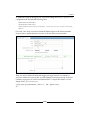


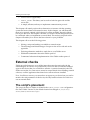


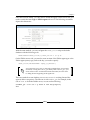


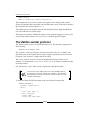


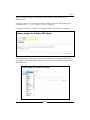


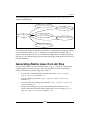


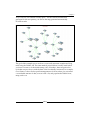


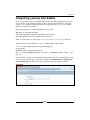
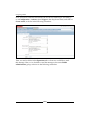

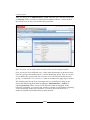


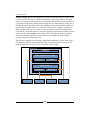


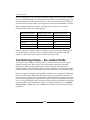
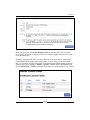
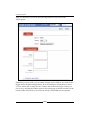
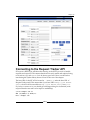


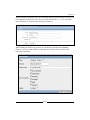

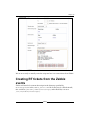


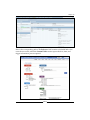


![1 Manual structure [Zabbix]](http://vs1.manualzilla.com/store/data/005957850_1-702bebeaffa08ff074416c0b3ac2050f-150x150.png)


![1 Getting Zabbix [Zabbix]](http://vs1.manualzilla.com/store/data/005748780_1-c6fae7d52ae49b905c6dc80adee0ad61-150x150.png)


![14. Distributed monitoring [Zabbix]](http://vs1.manualzilla.com/store/data/005830336_2-51982406f79fcf7c554e6482a06becfc-150x150.png)


![13. Discovery [Zabbix]](http://vs1.manualzilla.com/store/data/005964234_1-ff5a66c4f34dfcd582e5cd37b27ba780-150x150.png)