1
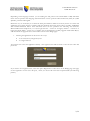
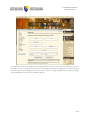
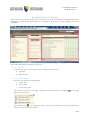
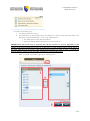
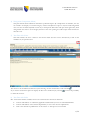
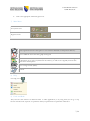
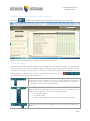
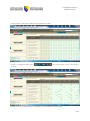
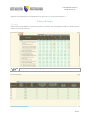
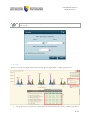
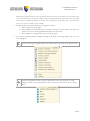
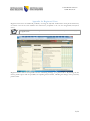
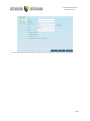
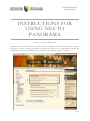
PANORAMA NECTO USER MANUAL INSTRUCTIONS FOR USING NECTO PANORAMA Access to Necto Panorama Dynamic part (Panorama Necto) of the portal of the Central Bank of Bosnia and Herzegovina is accessed through the so-called Bridge page which is located on the web site of the Central Bank of Bosnia and Herzegovina under the link „Panorama Necto“ which can be located under the link „Statistics“: 1/14 PANORAMA NECTO USER MANUAL Depending on the langauge in which you are reading the web portal of the Central Bank of BH, Panorama Necto wil be opened in that language. Panorama Necto can be opened localized in Bosnian, Serb (in Cyrillic alphabet), Croatian and English. Before the use, we would ask you to check the basic preconditions which are necessary for the use of this web application, those being having a computer with the minimum processing power above 2.2 GHz, 2 GB Rama with installed Windows XP or later. Panorama Necto can be opened in the following web browsers: Microsoft® Internet Explorer 8, 9 or 10, Google Chrome – version 27 or higher, FireFox – version 14 or higher and Apple Safari – version 5.1.7 or higher. It is recommended to regularly upgrade Adobe Flash Player, and the link for the upgrade can be found at the bottom of the Bridge page. 1. Entering the application can be done in two ways: As an anonymous (unregistered) user As a registered user Anonymous user enters the application directly. The registered user will be asked to enter its user name and password. If you wish to be a registered user, select the option Registration of New User on the Bridge page. The page for the registration of new users will open, where you need to fill in the basic required details (the following picture): 2/14 PANORAMA NECTO USER MANUAL The difference between the registered and unregistered (anonymous) user is that the registered user has a possibility to save in his/her private directory the modified workboards the appearance of which has been adjusted to his/her needs. Registered users also receive notices on changes (supplements) of data on the page at the mail addresses entered in the registration process. 3/14 PANORAMA NECTO USER MANUAL Panorama Necto User Interface Once you have accessed the dynamic part of the web portal of the Central Bank of BH, Panorama Necto application, the initial Workboard will open, in the language in which you have been reading the web site of the CBBH: The workboard includes the following components: 1) List of Reports On the left side, there is a list of all the reports divided into directories by: Languages Statistics areas 2) Area for Data Display In this area, the following can be displayed: a. Only a table b. Only a graph c. A table and a graph The selection is carried out by making a desired selection by clicking the icon Display right corner of this area: in the upper By selecting the icon in the upper right corner of this area, the data can be saved in several different formats, as shown in the picture below: 4/14 PANORAMA NECTO USER MANUAL 3) Navigation Component (Drop Down Menu) It is used in the following way: a. For opening the menu, select 1) b. In the left menu (2-All members) select the members you wish to show and move them to the right menu (3-Selected Members), in one of the following ways: i. By double click on each desired member or ii. Select the desired member and move it by cursor under 4) IMPORTANT: The initial setup is frequently All (All the members are shown). Regardless of the number of the selected members in menu 3), if All is there as well, all the members will be shown in the table. Therefore, do not forget, when selecting the members you wish to show, to exclude the member All from menu 3). The procedure is identical to that described above. c. When you finish, select OK. Or give up by selecting Cancel: 5/14 PANORAMA NECTO USER MANUAL 4) Navigation Component (Menu) This part includes all the indicators included in a particular report. By a simple click on checkbox, the user can exclude the display of a certain category of data and adjust the report to his/her needs. Registered users can save the tables adjusted in such way in their private directories and open them again later, while unregistered users have to do it all again, because at the next opening, the table setups will be returned to the basic ones. 5) Text Box with Notes This area includes the notes related to the relevant table. Text box can be increased by a click on the marked icon, the picture below: The return to the workboard is achieved by the selecting the icon for decrease of this window If you wish to obtain more space for display od data on the workboard, by selecting to delete this text box. . you have the possibility 6) Text Box with Links Box with useful elements includes a link to the useful relevant documents and links: Contact mail address of webmaster (application administrator) in case of technical difficulties Contact mail address of the statistics department, in case of the need for explanations. Link to the calendar of publications on the old site– it will open in a new window 6/14 PANORAMA NECTO USER MANUAL Link to the appropriate methodological notes. 7) Main Menu Anonymous users Registered users Only registered users have the option to save custom workboards in their private directory. Save as PDF file. Saves the chart, graph and legend. Save as Excel file. Saves the table only. The numbers are presented in the format which appears in Panorama. If you select any field with the number, you will see the originally entered value with all the decimal places. Save in image format (PNG). Refresh. 8) Help For help, choose : 9) Undo and Redo They have the same function as identical orders in office applications, so by using them you can go a step back or forward in the sequence of operations which you performed on a particular workboard. 7/14 PANORAMA NECTO USER MANUAL 10) Hide and Show the Left Menu with the List of Reports By selecting you obtain the possibility of increasing space for reading data, as in the picture: For the return to the initial view, it is sufficient to click again the same icon. 11) One-click Insight This functionality makes possible a simple and fast insight into entire data in the table, by comparing the growth or decline of the values in the table compared to the previous (for example, previous quarter or month) or parallel (for example the same quarter or month in the year before) period. By clicking this icon, the following display is opened (notice a red dot on the icon, showing that it is active) One-Click insight includes the following elements: In this place we have a choice if we want to compare periods in ways that are smaller (<), less than or equal to (<=), greater (>) or greater than or equal to (> =) compared to the previous or parallel period. Here we choose the percentage for which we want to have an insight into. The number in percentage can be set to one of the following ways: By using the slider, Up/down arrows, Or by simply typing the amount into the previously provided field. Here we choose if we want to compare the value with the previous period (i.e., quarters) 8/14 PANORAMA NECTO USER MANUAL All the amounts within those defined will be marked in the table: Further , if we apply the filter option the table: , these values will be the only ones shown in For the return to the initial survey, it is sufficient to turn off this icon (click it again). 9/14 PANORAMA NECTO USER MANUAL Important: This functionality has been implemented in the reports where the set date format allowed for it. Tables and Graphs 1) Tables Each user has the possibility to replace the positions of X and Y axes, and adjust the width of columns and the number of text lines in the cell. It gives the possibility of repalcing the positions of X and Y axis. 10/14 PANORAMA NECTO USER MANUAL It gives the possibility of adjusting the width of columns and rows and maximual number of text lines in a cell. 2) Graphs The bases of work with graphs will be described through the display Table + Graph, picture below: 1. The graph shows a selected area of table. We select the desired area by ourselves, similarly as in Excel. 11/14 PANORAMA NECTO USER MANUAL 2. 3. Important: The graph will show the values only from the same hierarchy level. In a particular case, in the picture above we see Groups of Products: if we open the second level with sub-groups of products, we will be able to show in the graph either Groups or Sub-groups of Products, but not both. The same applies for the time dimension, it is possible to show either years or quarters or months, but nor combined. By clicking any item from the Graph in the Legend, we obtain : a. Values of that item in the graph b. The possibility of moving that item to another Y axis (this is mostly used in case when the value of one or more items significantly deviate(s) from the others) c. The possibility of showing that item as a line in the graph If we choose the display Table + Graph or Graph, in the menu in the upper right corner, two new icons will appear Selection of the type of graphic display, the offered options are shown in the picture below: Selection of templates for charts, options offered are shown in the figure above, while templates related to the color palette that will be used in the creation of the chart is shown below: 12/14 PANORAMA NECTO USER MANUAL Appendix for Registered Users Registered users have the additional possibility of saving the adjusted workboards in their private directories, for which one icon has been added in the main menu (compared to the one for unregistered/anonymous users): Only registered users have the option to save custom workboards in their private directory, 2) in the figure below. Registered users will on scom profile have the welcoming message, 1) in picture above. By clicking his/her name,a profile opens with the possibility for updating his/her details, including the change of the password, picture below. 13/14 PANORAMA NECTO USER MANUAL For exiting the Profile and returning to the workboard, it is necesary to confirm or cancel the changes. 14/14