1
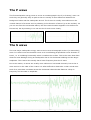
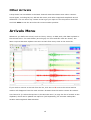
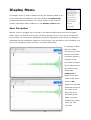
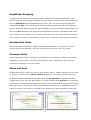
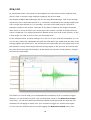
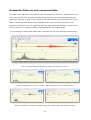
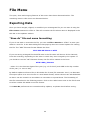
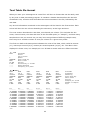
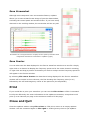
eqWave 3
SEISMIC WAVEFORM ANALYSIS
www.esands.com
8 River Street Richmond VIC 3121 Australia | T + 61 3 8420 8999 | F + 61 3 8420 8900 | [email protected]
Table of Contents
History ............................................................................................. 1!
The Kelunji Seismic Recorder .............................................................................. 1!
The SUDS data format ......................................................................................... 1!
Installing eqWave ............................................................................ 2!
Java Runtime Environment .................................................................................. 2!
Application Installer............................................................................................ 2!
eqWave Window ................................................................................................ 2!
What’s New in eqWave 3 .................................................................. 3!
What’s New in eqWave 3.2 .................................................................................. 3!
File Handling .................................................................................... 4!
Opening and Closing Files ................................................................................... 4!
Browsing Files..................................................................................................... 4!
File Filter .......................................................................................................... 4!
Merging Files....................................................................................................... 5!
Channels Menu ................................................................................. 6!
Merged Files ........................................................................................................ 6!
Maximise and Minimise Channels ........................................................................ 6!
Channel Properties .............................................................................................. 7!
Screen Elements ............................................................................... 8!
Controls Menu .................................................................................. 9!
Zooming ............................................................................................................ 10!
Point-zoom - Timeline ....................................................................................... 10!
Swipe-zoom - Timeline ..................................................................................... 10!
Amplitude ....................................................................................................... 10!
Revert ............................................................................................................ 10!
Scrolling the Timeline ....................................................................................... 10!
Using the “Sync” feature ................................................................................... 11!
Picking Arrivals .............................................................................. 11!
The P wave ....................................................................................................... 12!
The S wave........................................................................................................ 12!
Expected arrival times ...................................................................................... 13!
Estimating Magnitude ....................................................................................... 14!
Other Arrivals ................................................................................................... 15!
Arrivals Menu ................................................................................. 15!
Display Menu .................................................................................. 16!
Zero Correction ............................................................................................... 16!
Amplitude Grouping ......................................................................................... 17!
Acceleration Units ............................................................................................ 17!
Pressure Units ................................................................................................. 17!
Show and Sort ................................................................................................. 17!
STA/LTA ......................................................................................................... 18!
Edit Menu ....................................................................................... 19!
Clip visible to new window ................................................................................. 19!
Filter settings and controls ................................................................................ 19!
Filtering .......................................................................................... 20!
Preset and Custom filters .................................................................................. 20!
Setting and Clearing filters ................................................................................ 20!
Automatic filters on unit-converted data .............................................................. 21!
File Menu ........................................................................................ 22!
Exporting Data .................................................................................................. 22!
“Save As” file and name formatting .................................................................... 22!
Text Table file format ....................................................................................... 23!
Save Screenshot .............................................................................................. 24!
Save Fourier.................................................................................................... 24!
Print .................................................................................................................. 24!
Close and Quit ................................................................................................... 24!
History
The Kelunji Seismic Recorder
The Seismology Research Centre (SRC) was established in 1976 and incorporated into
Environmental Systems & Services (ES&S) in 2002. In the 1980s the SRC began developing
digital seismic recorders: the Alpha, the Beta, the Kelunji Classic, the Kelunji D-series, the
Kelunji Echo, and the current 6th generation instruments: the Kelunji EchoPro/Fusion twins.
Above: the Kelunji EchoPro range of seismic recorders
The SUDS data format
When the Kelunji D-series was introduced in the mid 1990s the SRC decided to adopt a
global standard data format for our seismic recorders. The SUDS (Seismic Unified Data
System) was originally created at the U.S. Geological Survey and adopted for use in the
IASPEI Seismological Software Library, where it became known as PC-SUDS. It is a very
flexible format which contains many fields for information relating to the raw data, which
has enabled our eqWave software to provide very useful information to Kelunji users.
For more information on SUDS, visit www.banfill.net/suds.html
1
Installing eqWave
Java Runtime Environment
eqWave is a Java application, which means that the Java Runtime Environment needs to be
running on your Windows, Mac or Linux computer. You can install Java for free by web
browsing to www.java.com and following the download prompts.
Application Installer
The installation procedure differs for each computing platform. The Windows version is
supplied as a self-installing package, the Mac version is a zipped OS X application file, and
the Linux version is simply the Java Archive (.jar) file.
eqWave Window
When eqWave starts up, you will be presented with the window below, which shows the
basic waveform controls at top left and the filter controls at top right. The main area is
where the waveforms will appear, and below this is a pull-up drawer that reveals the
frequency spectrum display window. Previous versions of eqWave had a pull-out drawer on
the right of the screen to show Arrival times. This has moved to the new Arrivals menu.
2
What’s New in eqWave 3
eqWave 3 has changed significantly since version 2, although its basics remain familiar and
easy to use. The main changes include:
•
Displaying colour-coded waveforms according to their units
•
The ability to convert between ground motion units at the click of a button
•
Display Rotational sensor units
•
A new implementation of the signal filtering interface
•
New keyboard shortcuts
•
Moving the Arrivals pull-out window to a menu item
•
Simplified user interface with new icons
•
Simplification of the frequency display window
•
Text table output in zero-offset corrected ground motion units
•
Prompts user to save before closing if Arrivals or Channel Properties modified
What’s New in eqWave 3.2
In this update we have added some features and fixed some bugs, including:
•
Interaction with eqFocus - displays expected arrival times when location updated
•
Timeline always visible
•
Click selection to zoom
•
Merge contents of a folder, up to 24-hours of data
•
Reads gains Kelunji EchoPro files correctly
•
Reads KA1 & KA2 (Kelunji Classic) format files correctly
•
Fixed displacement, velocity & acceleration unit conversion amplitudes
The vector sum feature and the ability to save in miniSEED format was removed from
eqWave 3. These may return in a future update once technical issues have been resolved.
For further information on this and other software products, email [email protected]
3
File Handling
Opening and Closing Files
You can drag a PC-SUDS file from your desktop file browser onto the eqWave window and
the file will open. eqWave will open files from a Kelunji that are stored normally (.dmx file
extension) or in Gzip compressed format (.dmx.gz file extension). There is no need to
expand the Gzip file using a 3rd-party application before using it in eqWave.
Alternatively you can use the File->Open menu item (CTRL-O) to browse your computer
file system for your file. To close the file and go back to an empty eqWave window use the
system window close button, File->Close menu item, or CTRL-W.
When you have a file open, you can open another file by dragging it onto the eqWave
window or using the Open command again, but this will open the file in a new eqWave
window. If you don’t want to open a new eqWave window, use the File->Close & Open
menu item (CTRL-E) instead of the Open command.
Browsing Files
Once you have opened a file, you can quickly scan through other waveform files in the same
directory using the File->Next (CTRL-N) and File->Back (CTRL-B) menu commands.
These waveforms will open in the same eqWave window, replacing the previous file.
File Filter
The File Filter field in the Basic Controls area is linked to the file browsing tool. If any
characters have been typed into this field, when you use the Next or Back commands, only
files that contain those characters in the filename will be opened. For example, if you have
a folder full of triggered data from dozens of different stations but you are only interested in
viewing files that have the site code ECHOP in the name, by typing ECHOP in the File Filter
field and using the NEXT command, the next file that has ECHOP in the filename will open.
As files created by Kelunji recorders are named in a standard format that includes the date,
time and station code (e.g. YYYY-MM-DD_HHMM_SS_<code>.dmx in the EchoPro) you
could potentially filter your file browsing by a certain month, day or hour.
4
Merging Files
eqWave can merge up to 24 hours of data from many stations into a single file. Kelunji
seismic recorders storing continuous data do so in one-minute data files, so it is possible
that an earthquake recording will straddle two or more files. To make analysis easier you
can merge these files together on screen and then save the merged file to your computer.
The quickest way to merge files is to have all of the files you want to merge in a single
folder, and drag the folder into the eqWave window. All waveform files in this folder (and
sub-folders) will be merged and displayed in a new eqWave window.
Alternatively drag a waveform file onto eqWave,
and then use the File->Merge command, which
will take you to the folder containing the file you
just opened. In this file browser window, select
all of the files you wish to merge using your
multi-select file system shortcuts (usually Shift-,
Control-, or Option-clicking) and proceed using
the Open button.
As long as all of the files are within a 24-hour time period, they will be merged onto a
common time line, grouped by site code in alphabetical order.
5
Channels Menu
Merged Files
When you are displaying a merged file, the site codes are listed
in lower section of the channels menu. By selecting a site from
this menu, you can view just this site in the eqWave window.
If you wish to return to viewing all sites, use the Channels->All
menu command.
If you wish to view only the vertical channels to quickly pick
arrivals from all of your sites, use the Channels->Vertical menu command. This will show
all vertical channels for each site, typically channels 3, 6, 9 and/or 12.
Maximise and Minimise Channels
To view a channel full screen, use the small “+” icon at the top of the Y-axis bar for that
channel, and then the “–” icon to go back. When all channels are shown, use the “–” icon to
hide that channel from view. To restore any hidden channels, use the Channels menu to
show All or Vertical channels, or the channels of a specific site.
6
Channel Properties
Once you click on a channel it will be highlighted in yellow to show that channel-specific
display items relate to this channel (e.g. the frequency spectrum display or channel
information display). When you select Channels->Properties a window will pop up
displaying extra information about this channel and the site.
This information includes the system response information that is used to calculate the
ground motion units from the raw data, some instrument state-of-health (SOH) information
such as battery voltage, and site information such as the latitude and longitude of the site.
If you need to modify the system response (e.g. if you have a specific sensitivity for that
sensor channel) you can modify the displayed fields and click OK to save these channel
settings.
The editable fields have been populated by the Kelunji recorder, and changing these will
change the raw data, so it is advisable to only fill them in if data is missing.
7
Screen Elements
Once you have opened a waveform file, the data will be plotted in the main eqWave window
showing the full time line of available data. The basic elements of the display will be
described briefly below and expanded upon in later sections of the manual.
If a channel is recognised as having units in velocity, the trace will be drawn in green. If a
channel is defined as acceleration, the trace will be drawn in red, and displacement in
black. A key is shown at the left end of the waveform, marked as D, V, and A with a blue
mark drawn next to the original units of the channel recording. Clicking on the D, V or A
buttons will covert the waveform to these units. Other recognised units are pressure
(magenta) and rotation (orange), and any unrecognised units are displayed in dark grey.
The DVA boxes will disappear for these latter units as they cannot be transformed.
You will notice a yellow trace overlaid on your ground motion recording. This is the
simulated STA/LTA ratio, which shows you how a recorder’s STA/LTA trigger algorithm
would see this data. The settings of this simulated STA/LTA ratio can be customised.
On the right-hand end of each channel are the filter control boxes. The
icon will filter the
icon will filter the waveform using the
waveform using the Preset filter settings. The
Custom filter settings which can be typed in at the top right of the screen. When a filter has
been applied to a channel, the pass band appears next to the filter buttons. The
icon will
clear the filter from the channel.
There is a bar at the bottom of the screen which can be dragged up to reveal the Fourier
transform window, which shows the frequency spectrum of the current channel selection.
8
Controls Menu
The control icons in the top left of the window are used to view the recordings in detail, to
add arrival information to the waveforms, and to help process files.
Zoom in and
Zoom in and out
Scroll time
Revert
Open Next/Prev file
out of timeline
amplitude scale
left and right
zoom
when name includes…
Arrival
Set P
Set other types of
Set selection
Time
trait
or S
Arrivals
peak amplitude
correction
and frequency
time
Most of the buttons within eqWave have a corresponding keyboard shortcut, which are
shown in the Controls menu. Commonly used shortcut keys are shown below.
Clear filter
from all channels
Filter all channels using
Custom filter settings
Add a P Arrival
for the site at
the time marker
Clip displayed
data to a new
window & file
Filter all channels using
Preset filter settings
Add an S Arrival
for the site at
the time marker
Copy Arrivals
to clipboard
(to paste
into eqFocus)
Blue text indicates
Control key command
Display full timeline
and amplitude
Zoom in to 50% of timeline
(or zoom selection)
Zoom out to 200%
(centred on click/selection)
Set peak amplitude
and frequency
of selection
Open next file in the
folder (File Filter text
must be in filename)
Open previous file in
the folder (File Filter
text must be in filename)
9
Zooms to 50%
of displayed amplitude
Moves timeline forward
by 25% of displayed width
Zooms to 200%
of displayed amplitude
Moves timeline back
by 25% of displayed width
Zooming
All zoom commands are applied to all channels at the same time.
Point-zoom - Timeline
Clicking and dragging your cursor over the waveform will show a red vertical marker bar.
Move to the area you want to zoom into and release the cursor-click to leave a light grey
marker line. Click the
or use the Page-Up shortcut key to zoom in to the marker time by
a factor of 2. Use the
or use the Page-Down key to zoom out by a factor of 2, centred on
the marker location.
Swipe-zoom - Timeline
Instead of left-clicking and dragging a marker line, you can right-click and drag to highlight
an area of interest. After releasing the click this area is left highlighted, if you place your
cursor over the highlighted section and left-click (or use the zoom-in command) you will
zoom in to the highlighted area. Using the zoom-out command on a highlighted area will
zoom out by a factor of 2 centred on the selection area.
Amplitude
By default eqWave will set the amplitude scale for each channel separately to the peak
displayed. If you wish to manually scale the amplitude, you can do so using the
and
icons or the Up and Down arrow keys. Each tap of the icon or key will zoom the amplitude
up or down by a factor of 2.
Revert
To return to the original waveform display (reverting to the entire time line and the full
amplitude scale) use the
icon or the Home shortcut key.
Scrolling the Timeline
The timeline can be scrolled horizontally using the
and
icons or the Left and Right
arrow keys. With each tap of the icon or key the timeline will step back or forward by 25%
of the displayed zoom level.
10
Using the “Sync” feature
Older instruments did not use GPS and relied on internal clocks for timing. Clock errors can
be compensated for by time-shifting data using the “sync” feature. Values from 0 to 30
seconds shift the data back in time, and a sync of 30 to 60 seconds will shift data forward.
Picking Arrivals
The main function of eqWave is to pick earthquake wave arrival times on the recordings to
allow the determination of the location and magnitude of the earthquake using eqFocus. The
intricacies of recognising and picking wave arrivals will not be discussed here, but we will
cover the basics of picking P and S waves, and estimating magnitudes.
To mark an arrival time, click and drag the cursor to the point of interest and release, then
click on the P icon or hit the “p” key. Similarly an S can be marked using the icon or “s” key.
11
The P wave
The first earthquake energy wave to arrive at a seismograph is the P (or Primary) wave. As
such they are generally easy to pick as there is usually a clear difference between the
background noise and the earthquake arrival. The P wave is usually most obvious on the
vertical channel of a sensor as it is pulsating in the direction of travel (up to the surface). As
you can see from the screenshot above, the first vertical marker appears to be before the
first arrival, but by zooming in we can see the P much more clearly.
The S wave
The next major earthquake energy wave to arrive at a seismograph is the S (or Secondary)
wave. It is also known as the Shear wave as it is oscillating perpendicular to its direction of
travel, i.e. it is shaking horizontally when it reaches the surface. This is the wave that often
does the most damage during an earthquake due to this horizontal shaking and the larger
amplitude. The S wave also usually has a lower frequency than the P wave.
Due to its motion, S waves are usually more obvious on horizontal channels, but as the S
wave arrives in the coda of the P wave it is often difficult to determine a clear arrival time.
Look for a point that correlates across the horizontal channels that features a drop in
frequency and increase in amplitude.
12
Once you have picked a P time and an S
time, eqWave will display the “S minus P”
(or S-P) time in seconds. The time
difference between these arrivals equates
to the distance that the earthquake is from
this site. A rule of thumb to calculate the
distance is to multiply the number of S-P
seconds by 8 to estimate the distance in
kilometres, e.g. 13 sec S-P = 104km.
Expected arrival times
If you are using eqFocus (see right, sold
separately) to locate seismic events, the
expected P and S arrival times (and PG
and SG arrival times, if appropriate) for
the event are superimposed on the
waveforms in eqWave as light grey lines.
The expected arrival times are updated
as eqFocus completes its calculations.
This can help users to see arrival times
hidden in codas and background noise.
13
Estimating Magnitude
Once you have a distance (automatically calculated by eqWave based on the S-P) you can
estimate the magnitude of the event using the peak vertical velocity amplitude and the
dominant frequency around this peak. On a vertical velocity channel (either natural velocity
or transformed from acceleration) right-click and swipe the area of peak motion, which
usually occurs after the S arrival for a few seconds. Click the MAX control button or type
“m” and eqWave will assign an arrival storing the peak amplitude value and the dominant
frequency in the selection.
Note: when you highlight a section, the start, end and length of the selection are displayed on the timeline.
Use the Display->Estimate ML menu item to pop up a
window that will show the event distance and magnitude. This
is a very rough estimate based on a number of assumptions
and should not be considered a true representation of these
earthquake parameters.
Disclaimer:
eqWave uses hard-coded variables to calculate event distance which may
or may not fit with P and S wave travel velocities for your region. Similarly,
eqWave uses a generic magnitude calculation formula that very roughly
estimates local Richter (ML) earthquake magnitude, which may or may not
apply to ground motion attenuation factors in your region. For accurate
location and magnitude calculation you will need three sites to have
recorded the event, each with P, S and MAX arrivals picked. This data can
be pasted into eqFocus, which should be used with a localised earth model.
14
Other Arrivals
A drop-down list is available in the Basic Controls area that shows some other common
arrival types, including PN, PG, SN and SG waves, and other magnitude amplitude arrival
definitions. You can enter any custom arrival type you require in the drop-down text field
and click Other to set the arrival at the current marker position.
Arrivals Menu
Whenever you define an arrival, such as P time, S time, or MAX peak, this data is placed in
the Arrivals menu. For each Phase (arrival type) the Time and Site code are shown, the
latter required because eqWave can store arrivals from many sites in the same file.
If you wish to remove an Arrival from the list, click the red X next to the Arrival and its
marker will disappear from the main window. Be aware that this action cannot be undone.
Use Control-C (or select the top item in the Arrivals menu) to copy the list of arrivals to the
clipboard, which can be pasted into eqFocus (sold separately) for accurate earthquake
location and magnitude determination.
15
Display Menu
The Display menu is used to modify the way the waveform data or onscreen elements are displayed, and also contains the Estimate ML
(magnitude) feature discussed in an earlier section of this manual.
Version information about eqWave is in the Display->About item.
Zero Correction
When a sensor is plugged into a recorder it will almost always have some level of signal
offset, which can be due to the sensor not being perfectly level or the sensor components
having some sort of electronic adjustment required. Regardless of the cause, the display of
offset data can be handled by eqWave in various ways. The raw data is never modified, only
the way it is displayed. Each channel is corrected individually.
An example of data
with zero-offset
correction (top) and
without zero-offset
correction (bottom)
is shown at left.
The offset correction
can be based on the
zero-offset of the
visible data
(Displayed) or
based on the zerooffset of the entire
channel (All).
Please note that the
amplitude shown at
the Y-axis is the
peak raw value,
and without zerooffset correction
enabled the motion
units may lack
relevance.
16
Amplitude Grouping
To maximise the detail of the displayed data, eqWave will scale the amplitude of each
channel to fill the vertical space allowed for each channel, which means each channel will
have an Individual peak amplitude scale on the Y-axis. You can choose to group the
amplitudes by Site, which will scale all channels with the same site code to the largest
channel amplitude based on the raw data amplitude, not ground motion. Alternatively you
can group All channels to the single largest amplitude in the file, regardless of site code.
The exception to the scaling rule is channels that have been converted from their natural
units (usually velocity or acceleration) to other units – they will always scale individually.
Acceleration Units
When displaying acceleration, eqWave can display amplitude in g (gravity) or in m/s2
(metres per second squared). This user preference is stored in your user profile.
Pressure Units
When displaying pressure (usually a recording from a microphone), eqWave can display
amplitude in Pa (pascal) or as SPL (sound pressure level, measured in dB). This user
preference is stored in your user profile.
Show and Sort
As discussed earlier, when you pick a P time and an S time, eqWave displays the S-P time
on screen. You can turn the Show S minus P feature on and off by selecting this item.
By default eqWave will sort the displayed channels by Sitecode in alphabetical order
(image below, left). You can also choose to re-sort channels by P arrival time so that the
closest sites to the earthquake appear at the top of the main window (image below, right).
Sites that have no P time picked will appear below those that do, in alphabetical order. If
eqFocus is active, sites with no P picked will be sorted using the expected P arrival time.
17
STA/LTA
As mentioned earlier, the yellow line that appears on each channel is the STA/LTA ratio,
which is how a recorder using STA/LTA triggering will see the data.
STA stands for Short Term Average and LTA for Long Term Average. This is the average
signal level over a short time period (e.g. 2 seconds) compared to the average signal level
over a longer time period (e.g. 20 seconds). The ratio of the STA level to LTA level is
plotted in yellow on the screen. The scale of this plot is related to the trigger threshold
ratio, which is a level at which you would expect the seismic recorder to declare than an
event is underway. The trigger threshold is plotted at the zero-level of the channel, so the
Y-axis range is a ratio of zero to twice the threshold level.
In the example below, the STA setting is 2.0, the LTA is 20.0, and the threshold is 3.0. As
you can see, before the earthquake the STA and LTA values are similar and the ratio of the
average signals sits at around 1, but as soon as the earthquake hits, the signal level in the
STA window is many times larger than the average signal in the previous 20 seconds and
the ratio shoots through the threshold. At this point the recorder would declare a “trigger”
and store the data away.
This feature is used to help you to understand the sensitivity of your recorder’s trigger
settings. You can modify the STA, LTA, and threshold values in the STA/LTA->Setup
menu item. You can also define the frequency band of the signal that the STA and LTA
windows are averaging to better tune your recorder to trigger on certain event types.
You can turn the STA/LTA plot on and off toggling the STA/LTA->Show menu item.
18
Edit Menu
Clip visible to new window
You may wish to create a new seismogram file with a subset of the data in the currentlydisplayed eqWave data file. You may wish to remove channels or restrict the time period so
that you are only left with data relevant to your analysis requirements. The Clip function
(also accessible with the CTRL-L keyboard shortcut) will open a new window that contains
only the data that is visible in the vertically scrolling main window in eqWave.
This means that any channels that have been hidden using the “minus” button at the top of
the Y-axis will not be exported to the new file, and only the data from the current timeline
zoom level will be exported to the new file. The data will appear in the new window in it’s
original units, but filter settings will be carried across, although they can be cleared so that
the original raw data can be displayed.
Filter settings and controls
The other menu items under the Edit menu relate to editing and applying frequency filtering
to the waveform data. This is discussed in detail in the next section, Filtering.
19
Filtering
Signal filtering in eqWave has been improved to be more
user-friendly and more-easily controllable by channel.
eqWave can perform a band-pass filter on the displayed
data (to show data between two defined frequencies). It is
important to note that the raw data is never modified –
the data is only filtered for display purposes.
Preset and Custom filters
A user will typically be interested in a particular frequency band, so eqWave allows the
definition of a Preset band pass filter. To set the filter, go to Edit->Preset filter settings…
which will bring up a window defining the High Pass and Low Pass filter frequencies. Signals
with frequencies below the High Pass frequency will be removed, as will signal with
frequencies above the Low Pass frequency. Once defined, these values are displayed in the
light blue box in the top right corner of the eqWave control panel.
eqWave also allows the user to set a variable frequency band filter by typing values into the
dark blue Custom filter box, located below the light blue box. Type the High Pass frequency
(the lower value) into the left-hand box and the Low Pass (higher value) in the other box.
Setting and Clearing filters
To apply a filter to a channel, simply click on the light blue or dark blue tick at the top-right
corner of the channel display area, which will apply the Preset or Custom filter respectively.
Once a filter has been applied to a channel, the pass band is written in text to the left of the
light blue filter tick so that you are aware that the data displayed has been filtered.
To clear the filter and return to the original channel data, click on the red cross.
To apply the Preset filter to all channels in the eqWave window, you can use the menu item
Edit->Apply Preset Filter to all channels or the CTRL-G shortcut key. Similarly, to apply
the Custom filter to all use the Edit->Apply Custom Filter to all channels menu item or
the CTRL-H shortcut key. You can use Edit->Clear Filters on all channels menu item or
CTRL-J to reset all channels to their original unfiltered state.
20
Automatic filters on unit-converted data
You may notice that when you convert from Acceleration to Velocity or Displacement and
when you convert from Velocity to Displacement that the unit-converted data has been
filtered to drop 5% or 10% of the frequency band from either end of the spectrum. This is
done to make the data appear more readable as the unit conversion process (in this
direction) introduces very low frequency and very high frequency artefacts, which can be
seen in the Fourier transform display, demonstrated in the images below.
You can change or clear these filters after conversion to suit your analysis requirements.
Above: original unfiltered acceleration data and frequency spectrum
Above: acceleration converted to velocity, auto-filtered (left) and unfiltered (right)
Above: acceleration converted to displacement, auto-filtered (left) and unfiltered (right)
21
File Menu
The open, close and merging features of this menu have been discussed earlier. The
remaining items in this menu are discussed below.
Exporting Data
Once you have merged, clipped, or modified your seismogram file you can save it using the
File->Save command or CTRL-S. This will overwrite the file whose name is displayed in the
title bar or the eqWave window.
“Save As” file and name formatting
If you do not wish to overwrite the file, you can use File->Save As or CTRL-T to save your
data to a new file. In the Save dialog box that pops up there are control options for naming
the file. The “SRC” filename format follows the form:
YYYY-MM-DD hhmm ss SITE
If you are saving a Merged file the SITE code in the file name will be one of the channels
from the recording, depending on the order in which they were merged by the system. If
you decide to use the “GA” filename format, the file will be named in the form:
SITEYYDDD_hhmmss
…where YY is the last two digits of the year (e.g. 13 for 2013) and DDD is the day number
of the year (i.e. 001 to 366).
By default eqWave will save files in PC-SUDS 151 format (file extension .dmx). An alternate
file export option is to save the file in a text-based format, whose columns are tab-delimited
so that it can be viewed in a text table in a text editor or spread sheet. The formatting of
this file is described in the following section. Click on the radio button next to the file format
to select it either PC-SUDS or text file format.
Your Save As preferences are remembered by eqWave, so please check before saving.
22
Text Table file format
When you save your seismogram as a text file it will be in a format that can be easily read
by any text or data processing program. It contains a header that describes the Arrivals
contained in the, a section that describes the time series data in the file, followed by the
raw data.
Any arrival information contained in the seismogram will be listed in the first section. Each
arrival will have its own column detailing the site name, arrival type and time.
The next section describes the raw data, one channel per column. This includes the site
name, channel name, the date and time of the first data point (or “sample”), and how many
samples there are per second. As you may have merged data of differing sample rates,
there may be a variable number of rows per column for a given time period.
The final row before the data points indicates the units of the data, which could be metres
(m), metres per second (m/s), metres per second squared (m/s/s), etc. The data is then
displayed in these units, one sample per row. All data is saved with zero-offset correction.
ARRIVALS
ROYM
P
20090306
0955
54.400
0.100
---------
#sitename
#onset
#first motion
#phase
#year month day
#hour minute
#second
#uncertainty in seconds
#peak amplitude
#frequency at P phase
TIME SERIES
ROYM
ROYM
c01 A
c02 A
unnamed
unnamed
20090306
20090306
0955
0955
34.000
34.000
100
100
6100
6100
0.000
0.000
m/s
--------0.0000000
0.00000000
-0.0000000
-0.0000000
-0.0000000
0.00000001
-0.0000001
-0.0000000
-0.0000000
-0.0000000
0.00000001
…etc
m/s
-------0.00000006
-0.0000000
-0.0000000
0.00000006
-0.0000000
-0.0000000
-0.0000000
-0.0000000
-0.0000000
-0.0000000
-0.0000000
ROYM
c03 A
unnamed
20090306
0955
34.000
100
6100
0.000
ROYM
c04 B
unnamed
20090306
0955
34.000
100
6100
0.000
ROYM
c05 B
unnamed
20090306
0955
34.000
100
6100
0.000
ROYM
c06 B
unnamed
20090306
0955
34.000
100
6100
0.000
m/s
-------0.00000001
0.00000005
0.00000006
0.00000002
0.00000004
-0.0000000
0.00000001
-0.0000000
0.00000003
0.00000002
0.00000002
m/s/s
--------0.0006574
-0.0002623
0.00049667
-0.0001947
-0.0003767
-0.0005482
0.00014834
0.00001837
0.00007556
0.00019513
0.00042388
m/s/s
--------0.0007563
-0.0006263
-0.0002468
0.00039259
0.00039779
-0.0003976
0.00029381
0.00016904
0.00036140
0.00011705
-0.0004548
m/s/s
-------0.00000194
0.00035027
-0.0010950
-0.0002216
-0.0002216
0.00016311
-0.0000500
-0.0006219
-0.0001956
0.00012152
0.00029308
23
#sitename
#component
#authority
#year month day
#hour minute
#second
#samples per second
#number of samples
#sync
Save Screenshot
Although most computers have a screenshot feature, eqWave
allows you to save a PNG format image of just the data window,
excluding the control panel and window frame. If you have many
channels in the scrolling window, the screenshot will be very tall.
Screenshot of a merged file from a laptop screen (above) and the same
merged file saved as a screenshot in eqWave (right)
Save Fourier
You can also save the data displayed in the Fourier transform window to a text file. Simply
right-click on a channel to display the frequency spectrum for the entire channel recording,
or right-click and drag a portion of the data you wish to analyse and its frequency spectrum
will appear in the Fourier window.
By selecting File->Save Fourier the data that is being displayed in the Fourier transform
window will be output in three columns, the first showing the frequency point (in Hz)
followed by the real and imaginary values of the spectrum (the amplitude).
Print
If you would like to print your waveform you can use the File->Print or CTRL-P command.
It will print effectively the same information as the eqWave screenshot, except that it will
print up to 9 channels per page to the maximum scale to fill the page.
Close and Quit
Close the eqWave window using File->Close or CTRL-W to return to an empty eqWave
window. Use this command again or File->Quit or CTRL-Q at any time to quit eqWave.
24
eqFocus
Calculate earthquake
location & magnitude
from your EchoPro
seismic network
eqLogger
Display continuous
data in real time and
automatically store it
in a data archive
eqServer
Data acquisition, archiving, alerting & network management
• WEB BASED DATA MANAGEMENT SYSTEM
• DATA ARCHIVE & EARTHQUAKE DATABASE
• NETWORK HEALTH & MANAGEMENT TOOLS
• EARTHQUAKE ALARM FUNCTIONS
• DATA SHARING & NETWORK INTEGRATION
environmental systems & services | 8 River Street Richmond Victoria 3121 AUSTRALIA
T +61 3 8420 8999 | F +61 3 8420 8900 | [email protected] | www.esands.com