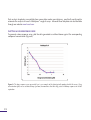
1
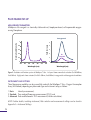
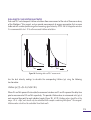
Data analysis templates are available from some plate reader manufacturers, specifically configured to
automate the analysis of Luxcel's MitoXpress® range of assays. Microsoft Excel templates are also available
through our website www.luxcel.com.
PLOTTING A DOSE RESPONSE CURVE
To generate a dose response curve, plot the data generated as outlined above against the corresponding
compound concentration (Figure 8).
Figure 8: The dose response curve presented here is an example of the data typically produced with this assay. Drug
concentration (µM) versus calculated slope (µs/hour) demonstrates that this drug causes inhibitory response on cellular
respiration.
P12