1
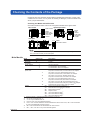
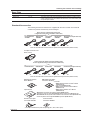
Operation
Guide
Yokogawa Electric Corporation
MW100
Data Acquisition Unit
IM MW100-02E
4th Edition
User Registration
Thank you for purchasing YOKOGAWA products.
We invite you to register your products in order to receive the most up to date product
information. To register, visit the following URL, or click the “Product Registration” button
in the opening screen of the Manual CD-ROM.
http://www.yokogawa.com/ns/reg/
PRS 105-02E
IM MW100-02E
Contents
Checking the Contents of the Package........................................................................................................................5
Introduction to Functions............................................................................................................................................10
Overview of the MW100 Data Acquisition Unit ........................................................................................................10
Overview of MW100 Viewer Software......................................................................................................................11
Address Setting Software.........................................................................................................................................11
Viewer.......................................................................................................................................................................12
Calibrator..................................................................................................................................................................12
Flow of Operations during Installation......................................................................................................................13
Connecting to a Network.............................................................................................................................................14
Connecting an Ethernet Cable to the Main Module..................................................................................................14
Checking the Communication Status........................................................................................................................14
Connection to the PC................................................................................................................................................14
Connecting the Main Module to a PC.........................................................................................................................15
Ethernet Connection.................................................................................................................................................15
Entering Settings on the MW100 Using a Browser...................................................................................................17
MW100 System Settings..........................................................................................................................................17
Measurement Groups and Measurement Module Settings......................................................................................18
Settings for Recording to CF Card............................................................................................................................19
Recording Channel Settings.....................................................................................................................................19
Measuring Interval and Range Settings (for the Universal Input Module)................................................................20
Alarm and Relay Settings.........................................................................................................................................21
Changing Monitor Screen Display Conditions..........................................................................................................22
Tag Settings..............................................................................................................................................................22
Setting Messages.....................................................................................................................................................22
Display Scale Settings..............................................................................................................................................23
Display Color Settings..............................................................................................................................................24
Display Group Settings.............................................................................................................................................24
Starting and Stopping Measurement and Recording ..............................................................................................25
Starting Measurement..............................................................................................................................................25
Starting Recording....................................................................................................................................................26
Stopping Recording..................................................................................................................................................26
Stopping Measurement.............................................................................................................................................26
Viewing Measured Data on the Monitor Screen and Starting/Stopping Recording...............................................27
Transferring Measured Data to the FTP Server........................................................................................................30
Viewing Measured Data on the Viewer Software.......................................................................................................31
Displaying Data.........................................................................................................................................................31
Changing the Display on the Waveform Display Window.........................................................................................32
Changing the Display Using the Toolbar...................................................................................................................32
Changing the Display Using the Menu.....................................................................................................................32
Changing the Display Using the Display Setup Window..........................................................................................33
Numerical Display.....................................................................................................................................................33
Reading Values Using the Cursor.............................................................................................................................34
Statistical Computation over an Area of Measured/Computed Data........................................................................34
Alarm/Mark List.........................................................................................................................................................35
Setting the Contents to Be Printed...........................................................................................................................36
Converting Data Formats..........................................................................................................................................36
IM MW100-02E
Thank you for purchasing the MW100 Data Acquisition Unit.
This manual provides an overview of the operating procedures of the MW100 Data
Acquisition Unit, and the basic operating procedures of the Viewer software. To ensure
correct use, please read this manual thoroughly before beginning operation.
The following manuals relating to the MW100 Data Acquisition Unit are provided in
addition to this one. Read them along with this manual. The MW100 User’s Manual
(IM MW100-01E), MW100 Viewer Software User’s Manual (IM MW180-01E), MW100
Communication Command Manual (IM MW100-17E), and this manual (IM MW100-02E)
are all available on the MW100 Manual CD-ROM.
Manual Title
MW100 Data Acquisition Unit
User’s Manual
Manual No.
IM MW100-01E
MW100 Communication
Command Manual
MW100 Connecting Ethernet and
Checking the Connection
Precautions on the Use of the
MX100/MW100
MX100 Data Acquisition Unit
Installation and Connection Guide
IM MW100-17E
MX100/MW100 Quick Start
Package Checking the Contents
of the Package
Control of pollution caused by
MX100/MW100 products
772075 AC Adapter
IM MX100-79E
MW100 Viewer Software User’s
Manual
IM MW180-01E
IM MW100-71E
IM MX100-71E
IM MX100-72E
Description
Explains the MW100 Data Acquisition Unit functions,
installation and wiring procedures, precautions, and
browser operations.
Describes the communication command of the
MW100 main module.
Explains the procedure to check the Ethernet
connection.
Summarizes the precautions regarding the use of the
MW100 Data Acquisition Unit.
Describes concisely the installation procedures and
wiring procedures of the MW100 Data Acquisition
Unit.
Explains the contents of the quick start package
(/SL1, /SL2, and /SL3 options).
IM MX100-91C
Describes control of pollution caused by the product.
IM 772075-01E
Describes the specifications of the AC adapter (power
supply suffix code “-2”).
Describes the functions and operations of the MW100
Viewer Software that comes standard with the MW100
main module.
Notes
• This manual describes style number S3 of the MW100 Data Acquisition Unit. It also describes release number
R3.03 of the MW100 Viewer Software.
• When configuring an MW100 system, the versions of the instruments used in the system indicated by the
hardware style number and software release number must meet the following conditions.
• The main module style number must be greater than or equal to the style numbers of any input/output
modules.
• The PC software release number must be greater than or equal to the style number of the main module.
Certain functions may become disabled on instruments or software that do not meet these conditions, or the
system may not be able to be built.
• Every effort has been made in the preparation of this manual to ensure the accuracy of its contents. However,
should you have any questions or find any errors, please contact your nearest YOKOGAWA representative,
dealer, or sales office.
• This user’s manual does not cover the handling and operating procedures of Windows.
• Copying or reproducing all or any part of the contents of this manual without YOKOGAWA’s permission is
strictly prohibited.
• The TCP/IP software and related documentation for this product was developed and created by Yokogawa
based on BSD Networking Software Release 1, licensed from the University of California.
Trademarks
• DAQMASTER is a registered trademarks of Yokogawa Electric Corporation.
• Microsoft and Windows are registered trademarks or trademarks of Microsoft Corporation in the United States
and/or other countries.
• Adobe and Acrobat are registered trademarks or trademarks of Adobe Systems Incorporated.
• Company and product names that appear in this manual are registered trademarks or trademarks of their
respective holders.
• The company and product names used in this manual are not accompanied by the registered trademark or
trademark symbols (® and ™).
Revisions
1st Edition:
2nd Edition:
3rd Edition:
June, 2005
October, 2006
October, 2007
4th Edition:
March, 2012
4th Edition: March 2012 (YK)
All Rights Reserved, Copyright © 2005 Yokogawa Electric Corporation
IM MW100-02E
Checking the Contents of the Package
Unpack the box and check the contents before operating the instrument. If some of the
contents are not correct, or if any items are missing or damaged, contact the dealer from
whom you purchased them.
Checking the Model and Suffix Code
Check the model and suffix code on the name plate indicated in the figure below.
Main module
MODEL
SUFFIX
MAC
NO.
MODEL
SUFFIX
MAC
NO.
S
S
Style number
Input/Output module
Model
Suffix code
MAC address
Instrument
number
MODEL
MODEL
STYLE
SUFFIX
NO.
STYLE
SUFFIX
NO.
Model
Style
number
Suffix code
Instrument
number
Base plate
MODEL
NO.
Model
Instrument number
Note
When contacting the dealer from which you purchased the instrument, please give them the
NO. (instrument number) on the name plate.
Main Module
Model
MW100
Displayed
Language
Supply voltage
Suffix Code
-E
Description
Main module
English*1
100 VAC-240 VAC
12 VDC-28VDC, with AC adapter*2
12 VDC-28VDC, without AC adapter*3
Power supply and
-D
AC power: 3-pin inlet, UL/CSA Standard power cord
power cord
DC power: Screw terminal, UL/CSA cable for AC adapter
-F
AC power: 3-pin inlet, VDE Standard power cord
DC power: Screw terminal, VDE cable for AC adapter
-R
AC power: 3-pin inlet, AS Standard power cord
DC power: Screw terminal, AS cable for AC adapter
-Q
AC power: 3-pin inlet, BS Standard power cord
DC power: Screw terminal, BS cable for AC adapter
-H
AC power: 3-pin inlet, GB (CCC) Standard power cord
DC power: Screw terminal, GB (CCC) cable for AC adapter
-W
Screw terminal, power supply cord not included*2, *3
Options
/C2
RS-232 communications interface*4, *5
/C3
RS-422A/485 communications interface*4, *5
/M1
Mathematical function*5, *6
/M3
Report function
/SL1 10ch Quick Start Package*7
/SL2 20ch Quick Start Package*7
/SL3 30ch Quick Start Package*7
*1 Displays Celsius or Fahrenheit, Daylight savig time can be set.
*2 “W” cannot be selected with “-2.”
*3 “-3” can only be selected with “W”
*4 “/C2” and “/C3” may not be selected together.
*5 “/C2” or “/C3” must be selected to use the Modbus/RTU slave function. Also, “/M1” must be selected
for use of the Modbus/RTU master function.
*6 “/M1” must be selected to use the Modbus/TCP client function.
*7 “/SL1”, “/SL2”, and “/SL3” may not be selected together.
IM MW100-02E
-1
-2
-3
Checking the Contents of the Package
Universal Input Module, DCV/TC/DI Input Module, and Four-Wire RTD Resistance
Input Module
Model
MX110
Input type
Suffix Code
Description
-UNV
-VTD
-V4R
For DCV/TC/DI/3-wire RTD input
For DCV/TC/DI input
For DCV/DI/4-wire RTD/4-wire resistance input
Number of channels and
-H04*1
4-CH, high-speed measurement (minimum measurement Interval: 10 ms)
measurement interval
-M06*1
6-CH, medium-speed measurement (minimum measurement interval: 100 ms)
-M10*1
10-CH, medium-speed measurement (minimum measurement interval: 100 ms)
-L30*1
30-CH, medium-speed measurement (minimum measurement interval: 500 ms)
Options
/NC*2 Without the plate with the clamp terminals
/H3*3 M3 screw terminals
*1 “-H04” or “-M10” must be selected if “-UNV” is selected. “-M06” must be selected if “-V4R” is selected. “-VTD” must be
selected if “-L30” is selected.
*2 The “/NC” option can be specified only when “-M10” is specified.
*3 The “/H3” option can be specified only when “-L30” is specified.
Strain Input Module
Model
MX112
Input type
Suffix Code
Description
-B12
-B35
-NDI
Internal bridge resistance: 120 Ω
Internal bridge resistance: 350 Ω
NDIS connector for connections to an external bridge head
4-CH, medium-speed measurement (minimum measurement and
measurement interval: 100 ms)
-M04
Number of channels and
measurement interval
Pulse Input Module
Model
MX114
Input type
Number of channels and
measurement interval
Options
Suffix Code
Description
-PLS
Non-voltage contact, 5-V logic, open collector input
10-CH, medium-speed measurement (minimum measurement interval: 100 ms)
-M10
/NC
Digital Input Module
Model
MX115
Input type
Suffix Code
Description
-D05
-D24
Non-voltage contact, 5-V logic, open collector input
24 V logic input
10-CH, high-speed measurement (minimum measurement and measurement
interval: 10 ms)
Without the plate with the clamp terminals
Number of channels and
measurement interval
Options
-H10
/NC
Analog Output Module
Model
MX120
Output type
Suffix Code
Description
-VAO
-PWM
Voltage/current output
Pulse width modulation output
8-CH, minimum output update interval: 100 ms
Number of channels and
output update interval
-M08
Digital Output Module
Model
MX125
Output type
Number of channels and
output update interval
Without the plate with the clamp terminals
Suffix Code
Description
-MKC
A contact output
10-CH, minimum output update interval: 100 ms
-M10
IM MW100-02E
Checking the Contents of the Package
Base Plate
Model
MX150
Base type
Suffix Code
Description
Includes two brackets for DIN rail mount
-1 to -6*
The value of the suffix code corresponds to the maximum number of input
output modules that can be installed. MX150-6 is for one main module, and
six input/output modules.
* One unit of the MX110-VTD-L30 requires three modules worth of space when installing.
Standard Accessories
The following standard accessories are supplied with the main module. Check that all
contents are present and that they are undamaged.
Power Cord (one of the following power cords
is supplied according to the instrument’s suffix codes)
UL/CSA Standard
A1074WD
VDE Standard
A1009WD
F
D
AS Standard
A1024WD
BS Standard
A1054WD
Q
R
GB Standard (complies with CCC)
A1064WD
H
Note: Not included when screw terminals are specified for the power section (Suffix code: W).
AC adapter and Power cord*1
Model: 772075
*1 Power Cord for AC adapter (one of the following power
cords is supplied according to the instrument’s suffix codes)
UL/CSA Standard
VDE Standard
F
D
AS Standard
BS Standard
R
Q
GB Standard (complies with CCC)
H
Note: Not included when screw terminals are specified for the power section (Suffix code: W).
MW100 Viewer Software
Model: MW180-1
Paper Manuals
MW100 Manual CD-ROM*2
Part number: B8724XA
*2 Includes:
• MW100 Data Acquisition Unit User’s Manual
(IM MW100-01E)
• This manual (IM MW100-02E)
• MW100 Communication Command Manual
(IM MW100-17E)
• MW100 Viewer Software User’s Manual
(IM MW180-01E)
• MW100 Data Acquisition Unit Operation Guide (IM MW100-02E)
• Precautions on the Use of the MX100/MW100 Data Acquisition Unit (IM MX100-71E)
• MX100/MW100 Data Acquisition Unit Installation and Connection Guide (IM MX100-72E)
• Control of pollution caused by MX100/MW100 products (IM MX100-91C)
Bracket for base plate*
Part number: B8724EF
Screw for bracket*
Part number: B9988DL
* Comes pre-installed for the quick start package (/SL1, /SL2, or /SL3 option).
IM MW100-02E
Checking the Contents of the Package
Optional Accessories (Sold Separately)
AC adapter
No. Name
Model
Basic Suffix
Code
Min. Q’ty Note
1
772075
-D
-F
-R
-Q
-H
1
1
1
1
1
No. Name
2
10-CH screw terminal
block (with RJC)
Model
772061
3
Connection cable between
the input module and
screw terminal block
Connection cable between
the input module and
screw terminal block
Plate with clamp terminals
(with RJC)
772062-050
Min. Q’ty Note
1
Dedicated to the MX110-UNV-M10/
MX114-PLS-M10/MX115-D05-H10/
MX115-D24-H10
1
Cable length: 50 cm*1
772062-100
1
Cable length: 100cm*1
772063
1
6
7
Clamp terminal
Clamp terminal
772064
772065
1
1
8
Connector cover
772066
1
9
10
Plate with clamp terminals
Plate with clamp terminals
(Built in bridge: 120 Ω)
Plate with clamp terminals
(Built in bridge: 350 Ω)
Plate with screw terminal
772067
772068
1
1
Dedicated to the MX110-UNV-M10/
MX114-PLS-M10/MX115-D05-H10/
MX115-D24-H10
Dedicated to the MX110-UNV-H04
Dedicated to the MX120-VAO-M08/
MX120-PWM-M08/MX125-MKC-M10
For empty slots with no module
installed
Dedicated to the MX110-V4R-M06
Dedicated to the MX112-B12-M04*2
772069
1
Dedicated to the MX112-B35-M04*2
772080
1
Dedicated to the MX110-UNV-M10/
MX114-PLS-M10/MX115-D05-H10/
MX115-D24-H10
Dedicated to the MX110-UNV-M10
AC adapter
Power supply
code
Cable for UL/CSA
Cable for VDE
Cable for AS
Cable for BS
Cable for GB (CCC)
Terminals
4
5
11
12
13
14
15
*1
*2
Plate with clamp terminal
772081
1
for current (Built-in shunt
resistor of 10 Ω)
Plate with clamp terminal
772082
1
Dedicated to the MX110-UNV-M10
for current (Built-in shunt
resistor of 100 Ω)
Plate with clamp terminal
772083
1
Dedicated to the MX110-UNV-M10
for current (Built-in shunt
resistor of 250 Ω)
For the 772062, only applies from MX110-UNV-M10 to screw terminal block (772061),
MX114-PLS-M10 to screw terminal block (772061), MX115-D05-H10 to screw terminal block
(772061), and MX115-D24-H10 to screw terminal block (772061).
772068 is only applicable to MX112-B35-M04. 772069 is only applicable to MX112-B12-M04.
IM MW100-02E
Checking the Contents of the Package
2
3, 4
5
6
7
8
9
10
11
Shunt resistor
No. Name
16 Shunt resistor
(for the clamp terminal)
17 Shunt resistor
(for the clamp terminal)
18 Shunt resistor
19 Shunt resistor
20 Shunt resistor
21 Shunt resistor
12
Min. Q’ty Note
1
Resistance: 250 Ω±0.1%
438921
1
Resistance: 100 Ω±0.1%
438922
415920
415921
415922
1
1
1
1
Resistance: 10 Ω±0.1%
Resistance: 250 Ω±0.1%
Resistance: 100 Ω±0.1%
Resistance: 10 Ω±0.1%
No. Name
Model
22 Adapter for CompactFlash 772090
card
23 CompactFlash card
772093
24 CompactFlash card
772094
25 CompactFlash card
772095
* Operating temperature range: -40 to 85°C
No. Name
1
GateMX/MW
Style Upgrade Kit (Sold Separately)
No. Name
1
Style upgrade kit for the
MW100
IM MW100-02E
14
Model
438920
Memory card
Software Application (Sold Separately)
13
15
Min. Q’ty Note
1
1
1
1
512 MB*
1 GB*
2 GB*
Model
WX1
Note
MX100/MW100 Gate software for connecting
to DAQLOGGER data acquisition software.
Model
772050-02
Note
Upgrades the MW100 to the latest style of
MW100.
Introduction to Functions
For details on individual functions, see one of the following user’s manuals located
on the enclosed CD-ROM: MW100 Data Acquisition Unit User’s Manual (IM MW10001E, MW100 Communication Command Manual (IM MW100-17E), or MW100 Viewer
Software User’s Manual (IM MW180-01E).
Overview of the MW100 Data Acquisition Unit
The MW100 Data Acquisition Unit consists of a main module equipped with an Ethernet
port, I/O modules for input and output of signals (these are the same as those for the
MX100 Data Acquisition Unit), and a base plate to which the first two items are mounted.
The main module comes with a HTTP server function, allowing users to easily enter
settings and monitor measured data from a PC using a browser. The MW100 can be
used for data acquisition on site as a standalone, enabling data acquisition on up to 360
channels using the Modbus TCP or RTU function.
The MW100 Data Acquisition Unit can be flexibly configured for a variety of measuring
environments.
One-to-one Connection with a PC
This is an example of a system for small scale logging, IP address settings, and other
capabilities.
PC
Using a browser:
• Easy setting entry
• Monitoring of measured
data
Using PC software:
• IP address setting
• Calibration
Hub
MW100 Data Acquisition Unit
MW100
Ethernet port
Input/Output module
Main module
Standalone Configuration
This is an example of configuration for an on-site standalone data acquisition system.
PC
MW100 Data Acquisition Unit
MW100
CF card
One-to-N Connection with a PC
Connections can be made via Ethernet or RS-422A/485. For connection examples, see
the MW100 Data Acquisition Unit User’s Manual (IM MW100-01E).
Connecting to Modbus Devices
You can connect to Modbus devices. For connection examples, see the MW100 Data
Acquisition Unit User’s Manual (IM MW100-01E).
10
IM MW100-02E
Introduction to Functions
Overview of MW100 Viewer Software
MW100 Viewer Software consists of the three software components described below.
Viewer
Data display,
data conversion,
statistical computation
over an area
Address Setting Software
FTP transfer
data
CF card
data
Calibrator
Hub 1
MW100 Data Acquisition Unit
Hub 1
MW100 Data Acquisition Unit
Ethernet port
FG SG RXB RXA TXB TXA
Input/Output module
L
FG SG RXB RXA TXB TXA
N
Ethernet port
Main module
Input/Output module
L
N
Main module
1 To change the factory default IP address set,
open a local (1:1) connection.
Address Setting Software
The address setting software allows you to enter initial communication settings on the
MW100 main unit. The software opens a local (1-to-1) connection with the MW100 main
unit, allowing changes to the factory default IP address, and it searches for and displays
other MW100s on the same segment. The software allows you to change settings such
as the MW100 host name, IP address, DNS server, domain name, and domain suffix,
and register a host name on the DNS server.
The Address Setting software can also be run directly from the CD-ROM without being
installed on the PC. Click a language selection button in the MW100 Viewer Software
CD-ROM address setting startup screen.
IM MW100-02E
11
Introduction to Functions
Viewer
You can load the measured/computed data that was saved in the past and carry out the
operations below. You can also display manual sample files and report files.
• Joining
When opening a divided data file, related files can be joined and displayed.
• Display waveforms and numerical values
• Display the alarm/mark list
• Change the display conditions (group assignments, scale, trip point, display color and
other parameters)
• Read data values using the cursor
• Perform statistical computation over an area
• Display and add marks
• Save or load display conditions
• Display the file information
• Convert data formats (ASCII, Excel, and Lotus)
• Print data (waveforms, numeric values, alarm/marker list, cursor values, statistics over
an area, and computed values)
• Use and save templates
Calibrator
This software is used to calibrate the MW100 input/output modules.
You can connect to the MW100, display the modules that can be calibrated, and carry
out calibration at each measurement range and output range.
12
IM MW100-02E
Introduction to Functions
Flow of Operations during Installation
The figure below shows the general flow of operation when the MX100 is installed
initially.
Operations on the MW100
Install the MW100
Wire the input/output
modules
Connect the
network cable
Connect the
power cable
Turn ON the
power switch
Operations on the PC
See the Installation
and Connection Guide*.
See the Installation
and Connection Guide*.
Page 14
See the Installation
and Connection Guide*.
See the Installation
and Connection Guide*.
* MX100/MW100 Data Acquisition Unit
Installation and Connection Guide
(IM MX100-72E)
This operation guide and the installation and
connection guide are introductory manuals.
They do not cover all functions and operating
procedures. They also do not cover the details
of the precautions and limitations of usage.
For a detailed explanation, see the following
electronic manuals contained in the manual
CD-ROM.
• For MW100 functions, installation, wiring,
and handling procedures:
MW100 Data Acquisition Unit User’s Manual
(IM MW100-01E)
• For functions and operating procedures of
the MW100 Viewer software:
MW100 Viewer Software User’s Manual
(Model MW180-01E)
Connecting the
MW100 to a PC
Changing settings on the
MW100 using a browser
Enter data acquisition
conditions
Change the display
conditions
Start measurement
Monitor measured data
Start recording
Data transfer
Stop recording
Stop measurement
Display recorded data
on the Viewer
IM MW100-02E
Page 15
Change the IP address
Connect with a fixed IP address
Login function
Page 17
Module recognition
Reconfiguration
Time settings
Page 18
Set the input mode,
measuring range,
measurement span, etc.
Page 22
Tag, display scale,
display color,
display groups,
and other settings
Page 25
Page 27
Display data being
measured in the
browser screen
Page 26
Page 30
Page 26
Page 26
Page 31
Display data saved on the CF
card in the Viewer, and execute
computation of statistics over
and area, data format
conversions, and other
processes.
13
Connecting to a Network
Connecting an Ethernet Cable to the Main Module
Connect the Ethernet cable to the Ethernet port on the main module. Use a UTP (category
5 or higher) or STP Ethernet cable.
Ethernet port
RJ-45 modular jack
Ethernet cable
Checking the Communication Status
You can check the status on the two LEDs at the upper-right and lower-right of the
Ethernet port.
ETHERNET
LINK LED
Illuminates in orange when the link between
the MW100 and the connected device is
established and communication is mutually
possible.
TX LED
Blinks in green when packet transmission is
being carried out normally.
Connection to the PC
Make the connection via a hub. For a one-to-one connection with a PC, make the
connection as shown in the figure below. In the same manner, you can connect multiple
MW100 Data Acquisition Units to a single PC.
PC
Hub
Ethernet cable
MW100 Data Acquisition Unit
MW100
Ethernet port
14
IM MW100-02E
Connecting the Main Module to a PC
Ethernet Connection
Setting the IP Address
Because the IP address is not set by factory default, set the IP address first.
1. After opening an Ethernet connection between the MW100 and PC, run the
MW100 Viewer Software CD-ROM or the IP address setting software installed on
the PC.
2. Click here.
The MW100 information is displayed.
3. Click here.
Information appears in the address
setting screen.
4. Click here.
Setting changes
are enabled.
Address Setting Screen
Note
If your OS is Windows XP, Windows Vista, or Windows 7 and the firewall is enabled, it may not
be recognized even if you click the Search button. To solve the problem, see appendix 1, in
the MW100 Viewer Software User’s Manual (this phenomenon may also occur with some third
party anti-virus programs).
IM MW100-02E
15
Connecting the Main Module to a PC
5. Make entries in the address setting screen.
The following is an example of editing such entries.
mw100user
Host name: Specify IP address: 192.168.1.100
Subnet mask:
255.255.255.0
Default gateway: 192.168.1.1
Specify a DNS server
Primary DNS server: 192.168.1.101
Secondary DNS server: 192.168.1.102
Specify a domain suffix
Primary domain suffix: daqmaster1.com
Secondary domain suffix: daqmaster2.com
In this example, the PC and the MW100 can communicate when, for example,
the PC has an IP address of 192.168.1.10 and a subnet mask of 255.255.255.0.
6. Click here.
The edited items are applied to the MW100.
Connecting with a Browser
7. Connect an Ethernet cable between the MW100 and PC, then start the browser.
8. Enter the IP address of the MW100 in the browser’s URL/Address box.
Ex. Specifying the IP address using the browser
The MW100 top screen appears. From the browser, you can change MW100 settings, or
acquire/record data.
16
IM MW100-02E
Entering Settings on the MW100 Using a Browser
MW100 System Settings
Display of Module Information and Reconfiguration
1. From the browser top screen, click System Setting > Module Information.
The module information screen is displayed.
2. If the Configured Module and Attached Module displays
are different, click here.
System reconfiguration is executed.
The Configured Module and Attached Module displays
become the same.
If the attached module does not appear, turn OFF the
power and check that the module is attached correctly.
Setting the Date and Time
3. After choosing System Setting in step 2, click Date and Time Setting.
The date/time setting screen appears.
4. Change the date and time setting.
The following is an example.
Date: October 25, 2007
Time: 10:25:00
Time zone: 9:00.
Enter the last two digits of the Western
calendar.
This differs depending on the country
and region.
For Japan, it is 9:00.
5. Click here.
The date and time settings are changed.
IM MW100-02E
17
Entering Settings on the MW100 Using a Browser
Checking Free Space on the CF Card and Initializing
6. After choosing System Setting in step 5, click System Information.
The amount of free space on the CF card is shown under Media Information.
7. To initialize the CF card, click here, then click the Initialize
button.
Measurement Groups and Measurement Module Settings
1. From the browser top screen, click System Setting > Measurement Setting.
The measurement operation setting screen in displayed.
2. Click to select the measuring interval.
3. Click to select measurement groups of the
measurement intervals above for the input
modules.
4. Click here, then select the integral time from
the list.
If an output module is connected, or if a module
is not connected, it is not displayed.
5. Click here.
The settings are changed.
Note
• The Interval Group that is assigned to the measurement group number is set as:
(interval is short) Interval group1 ≤ Interval group2 ≤ Interval group 3 (interval is long)
• The equivalent of three modules worth of settings are entered for the 30-CH Medium Speed
DCV/TC/DI Input Module.
• Select the same measurement group for the three measurement groups.
• Select the same integral time for the three A/D integral times.
18
IM MW100-02E
Entering Settings on the MW100 Using a Browser
Settings for Recording to CF Card
1. From the browser top screen, click System Setting > Recording Setting.
The recording operation setting screen in displayed.
2. Click here, then select the save start operation.
3. Click here to select the type of recording.
4. Click to select the recording interval.
Set an integer multiple of the
measurement interval.
6. Select a trigger length if data is to be
saved upon activation of the trigger.
Specify a pretrigger length as a
percentage of the data length.
5. Select the data length.
7. Click to select the time remaining for activating
the media alarm.
8. Click here.
The settings are changed.
Recording Channel Settings
1. From the browser top screen, click Channel Setting > Recording Channel Setting.
The recording channel setup screen appears.
2. Click here to select the recording
channel range.
For information on thinning recording and Manual
Sample, see the MW100 Data Acquisition Unit
User’s Manual (IM MW100-01E). Thinning recording
(section 3.4), Manual Sample (section 1.3)
3. Click here to select to record (On) or not
to record (Off).
4. Click here.
The settings are changed.
IM MW100-02E
19
Entering Settings on the MW100 Using a Browser
Measuring Interval and Range Settings (for the Universal Input Module)
1. From the browser top screen, click Channel Setting > AI/DI Channel Setting.
The input range setting screen appears.
2. Click the list, then select the channel range you wish to set.
3. Set the input type, measuring range, measurement span, scale, and other items.
The following is an example. For procedures for setting up an input module other than the
universal input module, see the MW100 Data Acquisition Unit User’s Manual (IM MW10001E), chapter 3.
4. Click here.
The range is changed.
20
IM MW100-02E
Entering Settings on the MW100 Using a Browser
Alarm and Relay Settings
1. From the browser top screen, click Channel Setting > Alarm Setting (AI/DI).
The alarm setting screen in displayed.
2. Select the channel range
you wish to set in the list.
3. Select the alarm type, then enter the alarm value and hysteresis.
For details on alarm setting items, see the MW100 Data Acquisition Unit User’s Manual (IM
MW100-01E), section 1.3.
4. Click here.
The alarm settings are changed.
5. After choosing Channel Setting in step 4, click DO Channel Setting.
The relay setting screen in displayed. For details, see the MW100 Data Acquisition Unit
User’s Manual (IM MW100-01E), sections 3.7 and 3.8.
6. Click the channel range for which you
wish to set relays.
7. Enter or select each item.
For details on relays, see the MW100
Data Acquisition Unit User’s Manual
(IM MW100-01E), section 1.12.
8. Click here.
The relay settings are changed.
IM MW100-02E
21
Changing Monitor Screen Display Conditions
Stop measurement, then change the display method.
After changing the display method, start measurement and display the monitor screen.
The screen is updated according to the new settings. For details on display settings, see
the MW100 Data Acquisition Unit User’s Manual (IM MW100-01E), section 3.15.
Tag Settings
1. From the browser top screen, choose Display Setting > Channel Tag Setting.
The tag setting screen in displayed.
2. Click here to select the setting range for the
tags you wish to set.
Tag name (Channel number)
3. Enter the tag name.
(If no name is entered,
the channel number is
displayed.)
4. Click here.
The tag name setting is changed.
5. After choosing Display Setting in step 4, click Other Settings.
6. Click here to select the
7. Click here.
Tag Name.
Setting Messages
1. From the browser top screen, choose Display Setting > Message Setting.
The message setting screen in displayed.
2. Enter a message.
3. Click here.
The message setting is changed.
Operation in the browser’s monitor screen
1. Select a message (Free, or 1 to 5).
2. If you select Free, enter characters (up to 15 alphanumerics).
3. Click here.
The selected message is displayed on the
monitor screen.
22
IM MW100-02E
Changing Monitor Screen Display Conditions
Display Scale Settings
1. From the browser top screen, choose Display Settings > Graph Scale Setting.
The scale setting screen in displayed.
2. Click to select the channel range
you wish to set.
3. Select each setting item, or specify
it. The graph display reference
position is applied to the numerical
and bar graph displays. Other
settings are applied to all types of
display screens.
4. Click here.
The display settings are changed.
Scale Setting Example
Linear
Log
(no. of scale divisions (no. of scale divisions:
can be selected)
fixed to Auto)
Graph display position setting
example
Scale division setting example
From the top, 1, 2, 3, or 4 divisions
Zone Setting Example
Lower: 0, Upper:100
Center
Lower:20, Upper:100
Lower:40, Upper:100
Lower:0, Upper:80
Normal
IM MW100-02E
Lower:0, Upper:60
23
Changing Monitor Screen Display Conditions
Display Color Settings
1. From the browser top screen, choose Display Setting > Channel Color Setting.
The color setting screen in displayed.
2. Click to select the channel range you wish to set
from the list.
3. Refer to the display colors below,
then specify a channel color.
The color changes to the one specified.
4. Click here.
The color settings are changed.
Display Group Settings
1. From the browser top screen, choose Display Setting > Display Group Setting.
The display group setting screen in displayed.
2. Click to select the display group range
you wish to set from the list.
3. Enter group names and channels to include.
4. Click here.
The group settings are changed.
You can specify a group name using up to fifteen
alphanumeric characters.
Up to twenty display channels can be registered to a
single group. Individual channel numbers are
delimited with periods ( . ), and ranges of channels
can be specified with hyphens.
The following is an example of a channel specification.
001.003.005 (001, and 003, and 005)
004-008 (004 through 008)
001.A001-A005 (001, and A001 through A005)
Click here. The set group names are displayed in the list. Select the group you wish to display.
The measured data of the channels specified for the group is displayed.
24
IM MW100-02E
Starting and Stopping Measurement and Recording
To start and stop measurement and recording, you can use the keys on the MW100 Main
Module, or use the browser.
• Using the Keys
Status indicators
Illuminate in the following situations
MEASURE
RECORD
SERIAL RD
ALARM
MATH
MEASURE
ALARM
RECORD
DATA ACQUISITION UNIT
MATH
SERIAL RD
ETHERNET
SW
100BASE - TX
10BASE - T
START
STOP
USER 1
USER 2
ON
1 2 3 4 5 6 7 8
POWER
100 - 240V AC
ON
Measuring
Recording (illuminates), recording stop processing (blinking)
Receiving serial communications data
Alarm activation or alarm hold
Computing (illuminates), computing stop processing (blinking)
OFF
7-segment LED
Displays the operational status of
the MW100.
Start/Stop keys
Start and stop measurement,
computation, and recording.
FG SG SDB SDA RDB RDA
SERIAL COMM
70VA MAX 50 / 60Hz
• Using a Browser
Start/stop measurement
Start/stop recording
Starting Measurement
1. Check whether the instrument is measuring or recording by looking at the MW100
main module’s status lamp, or the browser’s top screen.
2. Briefly press the MW100 main module’s START key, or select Start in the
Operation list under Measurement in the browser top screen’s Status table.
Measurement begins.
IM MW100-02E
25
Starting and Stopping Measurement and Recording
Starting Recording
1. Check whether the instrument is measuring by looking at the MW100 main
module’s status indicator, or in the browser’s top screen.
2. Press the MW100 main module’s START key for about two seconds, or select
Start in the Operation list under Recording in the browser top screen’s Status
table.
Measured data is saved to the CF card.
File menus are automatically generated using the date and serial number.
MDDIXXXX.MXD
M: Month file created (local time), 1 to 9, X (October), Y (November), Z (December)
DD: Date when file created (local time), 1 to 31
I: Files in measurement groups 1 to 3 are 1 to 3
Computed data file is M
Thinned values, T
XXXX: Sequence number 0000 to 9999
MXD: MW100 file extension (uppercase)
Stopping Recording
1. Check whether the instrument is measuring or recording by looking at the MW100
main module’s status indicator, or the browser’s top screen.
2. Press the MW100 main module’s STOP key for about two seconds, or select Stop
in the Operation list under Recording in the browser top screen’s Status table.
Recording stops.
Stopping Measurement
1. Check whether the instrument is measuring or stopping recording by looking at
the MW100 main module’s status indicator, or the browser’s top screen.
2. Briefly press the MW100 main module’s STOP key, or select Stop in the Operation
list under Measurement in the browser top screen’s Status table.
Measurement stops.
Note
This document does not cover MATH settings, or how to start and stop computation. Please
refer to the MW100 Data Acquisition Unit user’s manual (IM MW100-01E).
The process is described in the status transition diagram.
Setting
Measurement
MATH*
Press and hold
for 2 seconds.
Press and hold
for 2 seconds.
Recording
26
Press and hold
for 2 seconds.
* On models with the /M1
option, or when the 10-CH
Pulse Input Module is
installed
Press and hold
for 2 seconds.
IM MW100-02E
Viewing Measured Data on the Monitor Screen and
Starting/Stopping Recording
In the browser monitor screen, you can view data being measured in a trend, numerical,
meter, or bar graph display. You can also start and stop recording, pause the monitor
display, write messages, and perform other functions.
1. Check whether the instrument is measuring by looking at the MW100 main
module’s status indicator, or in the browser’s top screen.
2. From the browser top screen, click Single Screen or Dual Screen.
The Measured data screen appears.
Single Screen (Trend Display)
Computation start/stop button
Starts and stops computation (with the /M1 option,
or when the 10-CH Pulse Input Module is installed).
Recording Start/Stop button
Starts and stops data acquisition.
Pause button
Pauses monitor display updating.
Data acquisition does not stop.
Alarm ACK button
If set to hold alarms, alarms
are cleared upon alarm
clear wait.
(Includes relay action)
Output channel operation icons
(When output modules installed)
Area for displaying manual DO and
operation icons for arbitrary output.
Displays one channel’s worth.
Operational status
Illuminates during alarms,
recording, and computation.
Switch operation
icon
Switches the size
of the icon.
IM MW100-02E
27
Viewing Measured Data on the Monitor Screen and Starting/Stopping Recording
Dual Screen (Trend Display)
Use this when the monitor screen contains two screens. You can display two groups.
From the top screen, click Dual Screens.
The contents of the status bar are as follows:
MW100 serial number
MW100 firmware
version
Measurement group recording operation (1 to 3)/
thinning recording operation (T)/
report recording operation (R) status.
Recording: Yellow
Trigger wait state: Green
Stopped: Gray
Memory capacity of the CF card
Used space (%) displayed with a green bar.
When the CF card is not installed,
the Eject display appears.
MATH processing performance
(with the /M1 option or when the 10-CH Pulse Input Module is installed)
When MATH processing reaches 100%, data loss occurs.
Switching the Display Group and Monitor Display
3. To change the displayed group, select a group in the Select Display Group list in
the figure below.
To switch the monitor display, click the Select Monitor Display button in the figure
below.
The screen display switches.
Select a Monitor Display
Select the Display Group
Select the display group you
wish to display.
Select a monitor display type.
• Overview
• Meter
• Bar graph
• Digital
• Trend
Manual sample
Performs a manual sample
Data view
Displays alarm summaries, manual samples, or reports
in a separate window.
Select a background color
Switch background color between white and gray.
28
IM MW100-02E
Viewing Measured Data on the Monitor Screen and Starting/Stopping Recording
• Digital Display
Displays measured values as numerical values. When alarms are set, the alarm status
is displayed to the left of the numerical value.
Alarm status
Black
Alarm not
set up
Green
Illuminated: No alarm occurring
Blinking: Alarm hold clear wait
after alarm factor cleared
Red
Illuminated: Alarm occurring
(symbol in circle is alarm type: H/L/rH/rL/dH/dL/tH/tL)
Blinking: Alarm hold clear wait after alarm
factor occurrence
• Bar Graphs
Displays measured values in a bar graph. When alarms are set, the alarm status is
displayed to the left of the bar graph. For information on alarm statuses, see Digital
Display.
• Meters
Displays measured values in a meter. When alarms are set, the alarm status is
displayed to the left of the meter. For information on alarm statuses, see Digital
Display.
IM MW100-02E
29
Viewing Measured Data on the Monitor Screen and Starting/Stopping Recording
• Overview Display
Alarms (status and type) and measured values are displayed as numerical values
in the monitor display screen. Skipped channels are not displayed. If the size of the
window is reduced, only the alarms are displayed.
Starting Recording
4. Click the Record Start button in the screen display.
Saving of data to the CF card begins.
Click to start recording.
Stopping Recording
5. Click the Record Stop button in the screen display.
Click to stop recording.
Transferring Measured Data to the FTP Server
1. From the browser top screen, choose Communication Setting > FTP Client
Setting. The FTP client settings screen opens.
2. Set the items such as
the FTP server name.
3. Click here. The settings are changed.
4. Start the measurement and then start the recording. (For the procedure to start
the measurement and recording, see page 25 in this manual.)
When a file is created, the file is transferred to the folder on the specified FTP server.
30
IM MW100-02E
Viewing Measured Data on the Viewer Software
Displaying Data
You can view data files saved to the CF card and data files that have been transferred to
the PC from the FTP server using the Viewer.
1. Choose Programs > MW100 Viewer > MW100 Viewer to start the Viewer.
2. Click the
button on the toolbar or choose Open from the File menu.
The Open dialog box opens.
File information
3. Select the file you wish to load and click the Open button.
The waveform display window opens.
When Loading Divided Data Files on the MW100
Before the waveform display window is displayed, if a file that can be joined
exists, a dialog box opens with the message “Combining with related files?” To
join the data files, click Yes. To display only the specified file, click No.
Opens the waveform display window
Files are divided into the graphs and math channel graphs at the recording interval
specified on the browser even when in the same group.
IM MW100-02E
31
Viewing Measured Data on the Viewer Software
Changing the Display on the Waveform Display Window
Change the display settings according to the explanation in the figure below.
Switch the grid display
Alarm display ON/OFF
Switch the
Clip display ON/OFF
Switch the active waveform
display zone
Move the cursor to
Switch the display group
Zoom in or out
the point where the
alarm changed
of the time axis
Change the grid density
Zone display area
ON/OFF
Change the background
darkness
Turn ON/OFF the channel
Scale
Channel number and measurement unit
Changing the Display Using the Toolbar
Change the display settings according to the explanation in the figure below.
Show the General Display Settings window
Adding marks
Move cursor A to the left mark
Move cursor A to the right mark
Move cursor B to the left mark
Move cursor B to the right mark
Channel number display
Tag name display
Tag comment display
Show the window for displaying statistical computation over an area
Show the window for displaying cursor values
Alarm/Mark List
Show the numeric display window
Show the waveform display window
Switching between Absolute and Relative time
Changing the Display Using the Menu
You can display the Edit, View, and Window menus.
Show the computation result display window
Clear the Cursor
Search a mark
Add/delete a mark
Change the data file display
Switch between channel number, tag name,
and tag comment *1
Switch between absolute and relative time *2
Turn ON/OFF the toolbar
Turn ON/OFF the status bar
Arrange the display window
*1 MW100 data do not have tag comments associated with
(select cascade or tile)
them. If you select Tag comment, the Tag name is displayed.
Arrange window icons
*2 Displays also the Format item during numeric display.
Show the waveform display window
Show the numeric display window
Select how to arrange the display area from auto, horizontal, and vertical
Alarm/Mark detailed list display
Show the window for displaying cursor values
Show the computation result display window
Switch the display window
32
IM MW100-02E
Viewing Measured Data on the Viewer Software
Changing the Display Using the Display Setup Window
See the explanation in the figure below. Change the display settings and click OK.
Set the display for each display group.
Display ON/OFF
Switch to another display group
Group name
Turn ON/OFF the trip point display
Channel display color
Trip point value
Select the Y-axis
display format
Display zone position
Click to display the flag to
Maximum and minimum
select it for copying/pasting,
values of the scale
or click to hide the flag to
Select the Y-axis type (linear/logarithmic)
deselect it.
Turn Y-axis ON/OFF when displaying multi-axes zone
Select channels (displays the channel selection dialog box)
Numerical Display
While the waveform display window is displayed, click the
button on the toolbar or
select Window > Numerical Display to display a numerical value window as in the figure
below. If there are groups with differing monitor intervals, the screen is split.
Switch the display
group
Active channel (Y-axis displayed
on the waveform display)
Display per record interval
Channel display color
Horizontal scroll
IM MW100-02E
Mark
indication
Data number
Alarm
Date/Time
Value
33
Viewing Measured Data on the Viewer Software
Reading Values Using the Cursor
Group selection tab
Measurement point
Cursor A
Cursor B
2. Click the mouse where you wish to read the data in the waveform display window.
If you wish to read another point simultaneously, drag the cursor. Cursor A appears at the
position where you first clicked; Cursor B appears at the position where you released the
mouse button.
Time at Cursor B
3. From the Window menu,
choose Cursor value display.
The Cursor window opens
as shown in the figure on
the right.
Move Cursor A
Data number at Cursor A
Time at Cursor A
Data number at Cursor B
Time between Cursors A and B
Move
Difference in the data number
Cursor B between Cursors A and B
Alarm
Channel display color
Readout value of Cursor B – Readout value of Cursor A
indication
Channel number and
Readout value of Cursor B
Readout value of Cursor A
measurement unit
Statistical Computation over an Area of Measured/Computed Data
1. In the waveform display window, click the tab of the group on which you wish to
perform statistical computation over an area.
2. Click the start position of the computation area in the waveform display area.
A light-blue cursor appears in the waveform display area. If multiple waveform display areas
are displayed, the cursor is displayed at the time position each waveform display area.
3. Drag the cursor to the end position of the computation area
Another light-blue cursor appears at the position where the cursor was dragged.
Group selection tab
Cursor (the end of the statistical computation over an area)
Cursor (the start of the statistical computation over an area)
34
IM MW100-02E
Viewing Measured Data on the Viewer Software
4. From the Window menu, choose Statistics.
The Statistics window opens.
Data number at the start position
of the statistical computation
Maximum value – Minimum value
Channel display color over an area
Minimum value
RMS value
Scroll
the channel
Channel number and Data number at the end Maximum Value Average value
measurement unit
position of the statistical
computation over an area
Alarm/Mark List
Click the
button on the toolbar or choose Alarm/Marker List from the Window menu.
• Alarm List Display
Sorted according to the clicked item
Currently sorted to the item indicated by this mark
• Mark List Display
Sorted according to the clicked item
Currently sorted to the item indicated by this mark
Message mark added
in the browser display
screen
Mark added by
Viewer software
MW100 trigger marks
Names of groups with marks
If the groups have no names, all groups are marked
IM MW100-02E
35
Viewing Measured Data on the Viewer Software
Setting the Contents to Be Printed
1. From the File menu, choose Print Settings.
The Print Settings dialog box in the figure below opens.
2. Edit the print settings.
Select to print all or print only the range specified by cursors
Switch to settings for numeric values
Select the group to be printed
Select monochrome or color print
Select the groups when Selected
Groups is selected
Click to open the group selection
dialog box
Enter the comment to be printed
Converting Data Formats
The data formats below can be changed.
ASCII
Excel
Lotus
Text data with each data point separated by a comma. The extension is .txt.
Data that can be opened using Microsoft’s spreadsheet application Excel version 8.0
(Excel 97) or later. The extension is .xls.
Data that can be opened using IBM’s Lotus 1-2-3 spreadsheet application version 2.0 or
later. The extension is .wj2.
From the Convert menu, choose ASCII, Excel, or Lotus, then execute the conversion
in the dialog box that is displayed as shown in the figure below. There is a limit to the
number of data points that Excel and Lotus1-2-3 can handle. Before executing the
conversion, set the channels/groups to be converted, the conversion range, and the step
so that the number of data points is appropriate.
Enter the range of group numbers to be converted
Select whether to set the range
to be converted using groups
or channels
Select the range of channels to be
converted
Click to open the selection dialog box.
Select the record interval
Only the channels with the selected
record interval are converted.
Displays the time of the specified data
Enter the data range to be
converted
Can be specified using cursors
before opening this dialog box.
Step when saving data at certain intervals
Displays the save destination
and file name
36
When changing the save destination or file name
Click to open the save destination and file name
setup dialog box.
IM MW100-02E