1
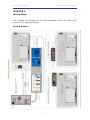
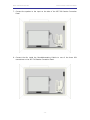
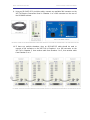
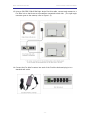
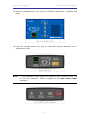
VIDEO FEAR CONDITIONING
“VIDEO FREEZE” SOFTWARE
AN AUTOMATED ANALYSIS OF
CONDITIONED IMMOBILITY
SOF-843 User’s Manual
DOC-019
Rev. 3.8
Copyright © 2011
All rights reserved.
MED Associates Inc.,
P.O. Box 319
St. Albans, Vermont 05478
www.med-associates.com
MED ASSOCIATES INC.
VIDEO FEAR CONDITIONING
- ii -
MED ASSOCIATES INC.
VIDEO FEAR CONDITIONING
TABLE OF CONTENTS
Chapter 1 .............................................................................................. 1
Introduction ...................................................................................................... 1
Independent Variables ..................................................................................... 2
Dependent Variables ........................................................................................ 2
Hardware Guide .............................................................................................. 2
Cable Guide ................................................................................................... 7
Chapter 2 ............................................................................................ 10
Wiring Guide ................................................................................................... 10
Quick Reference............................................................................................ 10
Step-by-Step Instructions ............................................................................... 11
Chapter 3 ............................................................................................ 20
Getting Started ................................................................................................ 20
Chapter 4 ............................................................................................ 22
Camera Calibration ........................................................................................... 22
Adjusting Camera Focus ................................................................................. 22
Calibration Procedure .................................................................................... 23
Chapter 5 ............................................................................................ 30
Protocol Setup ................................................................................................. 30
Defining the Stimulus Conditions ..................................................................... 30
Saving a Protocol .......................................................................................... 33
Modifying an Existing Protocol ........................................................................ 33
Chapter 6 ............................................................................................ 34
Starting an Experimental Session ....................................................................... 34
Experimental Setup ....................................................................................... 34
Threshold Values .......................................................................................... 35
Chapter 7 ............................................................................................ 36
Methods of Observation .................................................................................... 36
Linear Method .............................................................................................. 36
Discrete Method ............................................................................................ 37
Chapter 8 ............................................................................................ 39
Video Capturing System Calibration .................................................................... 39
- iii -
MED ASSOCIATES INC.
VIDEO FEAR CONDITIONING
Chapter 9 ............................................................................................ 40
Recording the Session ...................................................................................... 40
Chapter 10 .......................................................................................... 41
Data Analysis .................................................................................................. 41
Types of Data Files ........................................................................................ 41
Analyzing “*.raw” data in Video Freeze ............................................................ 42
Exporting Data to a Spreadsheet ..................................................................... 45
Chapter 11 .......................................................................................... 46
Component Analysis ......................................................................................... 46
Component Summary Report .......................................................................... 47
Batch Component Summary Report .................................................................. 50
Appendix A .......................................................................................... 52
Driver and Software Installation ......................................................................... 52
Appendix B .......................................................................................... 54
Door Hinge Adjustment ..................................................................................... 54
Appendix C .......................................................................................... 56
Camera Filter Care and Handling Instructions ....................................................... 56
Appendix D.......................................................................................... 57
Installing Contextual Inserts .............................................................................. 57
A-Frame Insert ............................................................................................. 57
Smooth Floor Insert ...................................................................................... 57
Curved Wall Insert ........................................................................................ 58
- iv -
MED ASSOCIATES INC.
VIDEO FEAR CONDITIONING
CHAPTER 1
Introduction
The Video Fear Conditioning System (VFC) and the Video Freeze Software
represent the latest technological advancements in behavioral research. This innovative
system allows the researcher to easily construct customized experimental protocols and
obtain a quantitative measurement of conditioned immobility, or “freezing.” The section
on “Protocol Setup” outlines the steps involved in designing the stimulus conditions for
the experiment, and the section titled “Starting an Experimental Session” describes the
options pertaining to dependent measures.
The VFC System is entirely automated and records video on a PC hard drive. Digital video
cameras are used to simultaneously capture data from up to four fear-conditioning
chambers (mice or rats). The Video Freeze run-time display provides information on
current CS-US durations and inter-trial intervals, as well as displaying the video input
while a session is being conducted (see the section on “Recording the Session” for more
details).
All data are stored to the hard drive, and can be analyzed using the Video Freeze DataAnalysis Utility (refer to the section on “Analyzing “*.raw” Data in Video Freeze”). Use
this data-analysis utility to simultaneously view the video and quantitative results. The
data-analysis user interface allows researchers to focus on specific intervals within any
given trial for detailed examination of the results.
Med Associates is dedicated to providing the scientific community with reliable and
innovative behavioral-testing tools. Please contact technical support at [email protected] with questions regarding the Video Fear Conditioning System. Med
Associates welcomes other comments or suggestions on how to improve this product.
Thank you for purchasing the Video Fear Conditioning System.
- 1 -
MED ASSOCIATES INC.
VIDEO FEAR CONDITIONING
Independent Variables
The Video Freeze Software allows researchers to define stimulus intensities and
durations, inter-trial intervals, inter-stimulus intervals, session durations, and number of
trials per session. These variables are defined when constructing a protocol (see
“Protocol Setup”).
Dependent Variables
Video Freeze Software is an important advancement in behavioral testing technology
because it provides a reliable, automated means of monitoring the effects of fear
conditioning in rodent species.
The consequence of fear conditioning in rodents is freezing (defined as no movement
other than breathing); therefore, freezing is the primary dependent variable. Freezing is
defined using two thresholds (see “Threshold Values”), and freezing is represented in the
data file in several different ways (see “Analyzing *.raw Data in Video Freeze”). For
instance, data can reflect the total time the subject spends motionless during the
session, the percent of time motionless, and the number of freezing episodes or
occurrences. Furthermore, the software also generates an average index of motion to
provide researchers with data on overall activity.
Hardware Guide
Figure 1.1 - ENV-022MD Sound-Attenuating Cubicle with Chamber, ENV414S Aversive
Stimulator, VFC-716 Connection Panel, NIR-100 Light Controller & NIR-100R Light Panel
- 2 -
MED ASSOCIATES INC.
VIDEO FEAR CONDITIONING
Figure 1.2 - ENV-008-FC Conditioning Chamber with VFC-716 Passive Connection Panel
Figure 1.3 - VFC-716 Passive Connection Panel Connections
Figure 1.4 - ENV-414S Stand-Alone Aversive Stimulator/Scrambler and ENV-005-QD Quick
Disconnect Harness (US Pat. No. 6412441 B1, Canadian Pat. No. 2,368,344, UK Pat. No.
1226750, Australian Patent 772111, France 1,226,750, Germany 602 05 143.6, Italy
1,226,750, The Netherlands 1,226,750, European Pat. No. 1226750, Other Foreign Patents
Pending)
- 3 -
MED ASSOCIATES INC.
VIDEO FEAR CONDITIONING
Figure 1.5 - Fire Wire Video Camera with CAB-FIRE-I-3M-6P-RA Cable
Figure 1.6 - Fire Wire Hub with Cables and Inverter
Figure 1.7 - SG-6080D Cabinet with DIG-700F PCI Interface and VFC-100 Output Modules
- 4 -
MED ASSOCIATES INC.
VIDEO FEAR CONDITIONING
Figure 1.8 - DIG-704PCI Interface Card (Back of Computer)
Figure 1.9 - NIR-100 Light Controller Front Panel
Figure 1.10 - NIR-100 Light Controller Back Panel
Figure 1.11 - NIR-100R Light Panel (Mounted on top of the Cubicle)
- 5 -
MED ASSOCIATES INC.
VIDEO FEAR CONDITIONING
Table 1.1 – Hardware Guide
Part Number
Description
Quantity
Location
VFC-022MD
Sound-Attenuating Cubicle (SAC)
One per system
---
ENV-008-FC
Conditioning Chamber
One per SAC
Inside the Cubicle
SG-6080D
Interface Cabinet with 28 VDC
One for every four Chambers
Outside the Cubicle
DIG-700F
PCI Interface
One per Interface Cabinet
SG-6080D Interface Cabinet
VFC-100
Auditory Stimulus Output Cards
One per Chamber
SG-6080D Interface Cabinet
DIG-704PCI
PCI Interface Card
One for every four Chambers
Computer
ENV-414S
Aversive Stimulator
One per Chamber
Outside the Cubicle
ENV-005-QD
Quick Disconnect Harness
One per Chamber
Back of Chamber
VFC-716
Passive Connection Panel
One per Chamber
Inside the Cubicle
ENV-227M
Stimulus Light with Diffuser
One per Chamber
Inside the Chamber
VFC-CAMERA-4.3MM
Video Camera with NIR Filter
One per Chamber
Left Cubicle Door
NIR-100
Light Controller
One per Chamber
Outside the Cubicle
NIR-100R
Light Panel
One per Chamber
On top of the Cubicle
FIN-ENV-025F
Fan
One per Chamber
Inside the Cubicle
HAR-CAMERA-MINIHUB
Repeater Fire Wire Hub with
Inverter
One for every two Cameras
Outside the Cubicle
- 6 -
MED ASSOCIATES INC.
VIDEO FEAR CONDITIONING
Cable Guide
Figure 1.12 – DIG-700C Ribbon Cable
Figure 1.13 - SG-210CP 2-Pin Molex Cable
Figure 1.14 - SG-210CB-25 Serial Port Cable
Figure 1.15 - SG-210G-10 DB-9 Cable
- 7 -
MED ASSOCIATES INC.
VIDEO FEAR CONDITIONING
Figure 1.16 - SG-216A-10 3-Pin Molex Cable
Figure 1.17 - VDO-CAB-15 Fire Wire Cable
Figure 1.18 - NIR-101 Light Control Input Cable
Figure 1.19 - NIR-102 Light Control Interface Cable
- 8 -
MED ASSOCIATES INC.
VIDEO FEAR CONDITIONING
Figure 1.20 - CAB-FIRE-I-3M-6P-RA Right Angle Fire Wire Cable
Table 1.2 - Cable Guide
Part Number
Description
DIG-700C
Ribbon Cable
SG-210CP-2
2-pin Molex
SG-210CB-25
25' Serial Port Cable
SG-219G-10
10' DB-9 Cable
SG-216A-10
3-pin Molex
CAB-FIRE-I-3M-6P-RA
Right Angle Fire Wire Cable
VDO-CAB-15
15' Fire Wire Cable
NIR-101
Light Control Input Cable
NIR-102
Light Control Interface Cable
- 9 -
MED ASSOCIATES INC.
VIDEO FEAR CONDITIONING
CHAPTER 2
Wiring Guide
Prior to making any connections, be sure that all equipment is turned off. Failure to do
so may result in equipment damage.
Quick Reference
- 10 -
MED ASSOCIATES INC.
VIDEO FEAR CONDITIONING
Step-by-Step Instructions
1. Using the DIG-700C Ribbon Cable, connect the DIG-700F PCI Interface located in the
SG-6080D cabinet, to the DIG-704PCI card located on the back of the computer.
2. Using an SG210-CP-2 2-pin Molex cable, connect the 28V port on the DIG-700F PCI
Interface located in the SG-6080D cabinet, to any available 28V port on the rear of
the SG-6080D cabinet.
- 11 -
MED ASSOCIATES INC.
VIDEO FEAR CONDITIONING
3. Using an SG-210-CB-25 25’ serial port cable, connect each VFC-100 stimulus output
card located in the SG-6080D cabinet to the corresponding VFC-716 Passive
Connection Panel. For example, if there are multiple chambers, the VFC-100 card
labeled “1” should be connected to the VFC-716 in Chamber 1, and so on.
NOTE :
All cables going in to the Sound-Attenuating Cubicle should be run through the
opening on the right side.
4. Using an SG-219G-10 DB-9 cable, connect the Grid Output connector on the back of
the ENV-414S Aversive Stimulator to the ENV-005-QD grid floor on the rear of the
ENV-008-FC Conditioning Chamber (inside the Sound-Attenuating Cubicle).
- 12 -
MED ASSOCIATES INC.
VIDEO FEAR CONDITIONING
5. Using an SG-216A-10 3-pin Molex cable, connect the MED Control connection on the
back of the ENV-414S Aversive Stimulator to the OUTPUT 2 connection on the VFC716 Passive Connection Panel.
6. Connect the ENV-227M Stimulus Light with Diffuser (on the left side of the
Conditioning Chamber) to the OUTPUT 1 connection on the VFC-716 Passive
Connection Panel.
- 13 -
MED ASSOCIATES INC.
VIDEO FEAR CONDITIONING
7. Connect the speaker to the input on the side of the VFC-716 Passive Connection
Panel.
8. Connect the fan inside the Sound-Attenuating Cubicle to one of the three 28V
connections on the VFC-716 Passive Connection Panel.
- 14 -
MED ASSOCIATES INC.
VIDEO FEAR CONDITIONING
9. Using an SG-210CP-25 2-pin Molex cable, connect any available 28V connector on the
VFC-716 Passive Connection Panel in Chamber 1 to a 28V connector on the rear of
the SG-6080D cabinet.
10. If there are multiple chambers, then an SG-210CP-25 cable should be used to
connect a 28V connector on the VFC-716 in Chamber 1 to a 28V connector on the
VFC-716 in Chamber 2, then another cable from Chamber 2 to 3, then another cable
from Chamber 3 to 4.
- 15 -
MED ASSOCIATES INC.
VIDEO FEAR CONDITIONING
11. Using the VDO-CAB-15 Fire Wire cable, connect one of the Fire Wire cards on the
back of the computer to one of the Fire Wire hubs.
12. Using the other VDO-CAB-15 Fire Wire cable, connect the second Fire Wire card on
the rear of the computer to the second Fire Wire hub.
- 16 -
MED ASSOCIATES INC.
VIDEO FEAR CONDITIONING
13. Using a CAB-FIRE-I-3M-6P-RA Right Angle Fire Wire cable, connect each camera to a
Fire Wire hub so that there are two cameras connected to each hub. (The right angle
connector goes to the camera, refer to Figure 1.5).
14. Connect the Fire Wire Inverters into each of the Fire Wire Hubs and plug in to a
standard wall outlet.
- 17 -
MED ASSOCIATES INC.
VIDEO FEAR CONDITIONING
15. Using a NIR-102 cable, connect the White Light Control Input on the rear of the
NIR-100 Light Controller to the OUTPUT 7 connector on the VFC-716.
16. Using another NIR-102 cable, connect the NIR Light Control Input on the rear of
the NIR-100 Light Controller to the OUTPUT 8 connector on the VFC-716.
17. Using the NIR-101 cable, connect the To Light Panel connector on the rear of the
NIR-100 Light Controller to the only connector on the NIR-100R Light Panel.
- 18 -
MED ASSOCIATES INC.
VIDEO FEAR CONDITIONING
18. Using the included power cord, plug the SG-6080D cabinet into a standard wall
outlet.
19. Using the included power cord, plug the ENV-414S Aversive Stimulator into a
standard wall outlet.
NOTE:
It is not necessary to apply power to the NIR-100 Light Controller via the +15
to +28 V DC connector. Power is supplied via the Light Control Input
connectors.
- 19 -
MED ASSOCIATES INC.
VIDEO FEAR CONDITIONING
CHAPTER 3
Getting Started
Once the hardware and drivers are correctly installed, the software needs to be
configured for each chamber.
Figure 3.1 - Video Fear File Menu
From the File menu, select Stimuli Definition. The following will appear:
Figure 3.2 - Stimulus Names
- 20 -
MED ASSOCIATES INC.
VIDEO FEAR CONDITIONING
The Stimulus Names screen (Figure 3.2) is shown with the default titles. The Name
column is the only column that may be changed, the Id and Type columns may not be
changed. To change the Name of a stimulus, click on the desired name and enter the
new name. When all the names are correct, select Ok.
Now select File | Camera Identities. The following screen will appear:
Figure 3.3 - Camera Setup
This feature may be used to both name the cameras and identify which camera is in
which chamber. The camera name can be changed by clicking on the current camera
name on the left side of the screen and entering a new name. The image on the right
side of the screen corresponds to the selected camera. When the camera names have
been updated, select Exit.
- 21 -
MED ASSOCIATES INC.
VIDEO FEAR CONDITIONING
CHAPTER 4
Camera Calibration
Adjusting Camera Focus
MED Associates adjusts the focus and aperture settings on the camera prior to shipping
Video Fear Conditioning systems. However, if focus adjustments are made, the camera
settings (Brightness, Gain, Shutter) will need to be adjusted using procedure below.
To adjust the camera focus, loosen the setscrew on the focus ring, shown in Figure 4.1.
Once proper image clarity is achieved, tighten the setscrew on the focus ring.
It is recommended that the lens aperture be locked in the maximal open position (using
the set screw on the aperture ring; Figure 4.1). Make sure that the white dot on the
aperture ring is lined up with the number 1.4 on the lens barrel (Figure 4.2). This is the
maximally open aperture position.
Figure 4.1 - Focus and Aperture Rings on Video Lens
Figure 4.2 - Aperture Setting
- 22 -
MED ASSOCIATES INC.
VIDEO FEAR CONDITIONING
Calibration Procedure
1. Ensure that the NIR light source is turned on in each box. It is important to note
that the cameras in the MED-VFC system detect only NIR light, and therefore there
will be no image on the screen if the NIR light source is off.
2. Select File | Chamber Configuration. The following screen will appear:
Figure 4.3 - Configuration Manager
3. The order that the Camera Ids are displayed in on the Configuration Manager
screen can be changed by left-clicking on the camera to move, then clicking on the
up or down arrow on the right side of the display (Figure 4.3). Camera Ids may be
removed from this list by highlighting them and selecting Delete. To add a new
configuration to the list, click Add. The screen shown in Figure 4.4 will appear,
proceed to step 4. To exit this screen, click Exit. To continue with camera
calibration, proceed to step 6.
Figure 4.4 - Adding a New Configuration
- 23 -
MED ASSOCIATES INC.
VIDEO FEAR CONDITIONING
4. Create a new configuration by entering the desired box name into the Box Name
field. Box refers to an individual experimental setup, and includes the Sound
Attenuating Cubicle (SAC), video camera, conditioning chamber, and all stimuli
associated with that chamber. The hardware settings, including camera settings and
stimulus addresses (port, offset, bit) must be set for each Box in the system.
5. Next, select a camera from the Camera pulldown menu. Then enter the VFC-100
Offset (see step 7 for details on the VFC-100 Offset). Once all of the desired
selections have been made, select Ok. The screen shown in Figure 4.3 will appear
again.
6. Select the camera to calibrate from the Configuration Manager screen (Figure 4.3)
by either double clicking on the Id of the desired camera, or by highlighting the
desired camera and clicking Edit. The screen shown in Figure 4.5 will appear.
Figure 4.5 - Configuration Setup
7. Choose a camera from the Camera pull-down menu and enter the offset in the VFC100 Offset field. The VFC-100 offset refers to the hardware address of the VFC-100
card. Determine which Box that each VFC-100 is connected to and refer to Table 4.1
to determine the appropriate offset numbers for the default configurations.
Enter
the VFC-100 offset, and click OK.
- 24 -
MED ASSOCIATES INC.
VIDEO FEAR CONDITIONING
Table 4.1 - Default Stimulus Configuration Settings
Box 1
Box 2
Box 3
Box 4
790
0
0
790
1
0
790
2
0
790
3
0
792
0
792
2
792
4
792
6
Stimulus Light
Bit
1
1
1
1
Aversive Stimulus
Bit
2
2
2
2
ANL-926 (sound)
Port
Offset
Bit
DIG-704 I/O
General
Port
Offset
Once all of the settings are correct, click on Calibrate Camera. The following screen
will appear:
Figure 4.6 - Calibrate Camera
8. Notice that initially the video image in the Video Display Window is totally black
(Figure 4.6). Move all of the green Camera Control sliders all the way to the left.
9. Begin adjusting the camera settings by moving the Brightness slider to the right.
As the Brightness slider is moved back and forth, a single narrow peak will move
back and forth in the Grayscale Histogram Display (Figure 4.7).
- 25 -
MED ASSOCIATES INC.
VIDEO FEAR CONDITIONING
Figure 4.7 - Narrow Peak on the Grayscale Histogram Display
10. Move the Shutter slider to the right. An image should start to form in the Video
Display Window, and the Grayscale Histogram should start to spread out. Continue
moving the Shutter slider to the right until the right-most edge of the histogram
curve is at the right-most edge of the Grayscale Histogram Display.
Figure 4.8 - Spreading the Grayscale Histogram to the Right by Increasing Shutter
- 26 -
MED ASSOCIATES INC.
VIDEO FEAR CONDITIONING
11. Now, decrease the brightness by moving the slider to the left, until the left-most
edge of the histogram curve is at the left edge of the Grayscale Histogram Display.
Notice that the entire Grayscale Histogram has moved leftward and there is a gap
between the right edge of the histogram and the right edge of the Grayscale
Histogram Display.
Figure 4.9 - Shifting the Grayscale Histogram to the Left by Decreasing Brightness
12. Now, increase the Gain slider, by moving it to the right, until the right edge of the
Grayscale Histogram is at the right edge of the Grayscale Histogram Display. Notice
that the Grayscale Histogram now contains “jagged bumps”.
Figure 4.10 - Spreading the Grayscale Histogram by Increasing Gain
- 27 -
MED ASSOCIATES INC.
VIDEO FEAR CONDITIONING
13. To eliminate these jagged bumps, decrease the Gain slightly. This will also result in
a gap at the right edge of the Grayscale Histogram Display.
Figure 4.11 - Smoothing the Histogram Curve by Decreasing Gain
14. Increase the Shutter control by moving the slider to the right. This will spread the
histogram out so that it’s right edge is at the right edge of the Grayscale Histogram
Display.
Figure 4.12 - Spreading the Histogram by Increasing Shutter
- 28 -
MED ASSOCIATES INC.
VIDEO FEAR CONDITIONING
The grayscale histogram should be fairly smooth with a clear peak near zero (black), and
several broad peaks in the mid and upper ranges (various shades of gray). Note that the
peak near zero (black) will be more or less apparent depending upon the view of the
camera. In the above example, the black handle on the grid floor is visible in the camera
view. This handle accounts for the presence of the black peak in the grayscale
histogram. If this handle is not in the camera view, the peak near zero will be less
obvious, and may even be totally absent. The key is to adjust the camera settings to
make maximal use of the camera’s dynamic range. This is accomplished by setting the
camera so that the right and left edges of the grayscale histogram are just reaching the
edges of the histogram graph.
NOTE:
It is important to note that the steps above are MEANT TO BE USED AS A
GUIDELINE and that fine-tuning may still be necessary. The Brightness, Gain
and Shutter may need adjusting based on the color of the animal. Fine-tune
the system with the animal in the chamber until a satisfactory motion index is
attained.
Figure 4.13 - Grayscale Histogram Characteristics of Properly Calibrated Camera
Now the Video Display window should contain a clear, bright image of the empty Fear
Conditioning Chamber. If the image is fuzzy the focus of the lens may need to be
adjusted. Refer to the next section for camera focusing instructions.
- 29 -
MED ASSOCIATES INC.
VIDEO FEAR CONDITIONING
CHAPTER 5
Protocol Setup
Customized experimental protocols can be efficiently designed and implemented using
the Protocol Setup utility of Video Freeze software. This utility creates a “*.pro” file that
is later executed when conducting an experimental session.
Select the Video Freeze icon on the computer desktop and select File| Protocol Setup.
Stimulus conditions and session duration are defined in Protocol Setup.
Defining the Stimulus Conditions
Select File | Protocol Setup, and the following screen will appear.
Figure 5.1 - Opening the Protocol Setup Window
- 30 -
MED ASSOCIATES INC.
VIDEO FEAR CONDITIONING
To define the stimulus conditions, click New. The Stimulus Definition screen will appear.
Set the Total Time, which is the total duration of the protocol, and select the Stimuli to
be used in the protocol by checking the corresponding boxes. Note that only the Stimuli
defined in Stimuli Definition (Chapter 3) appear on this list. When the desired stimuli
have been selected, click OK to continue. These selections may be changed later by
clicking Stimulus on the Protocol Setup screen.
Figure 5.2 - Stimulus Selection with User Defined Stimuli Names
Now to begin adding stimuli to the protocol, click Add and the Add Item screen will
appear. This function is used to define the stimulus durations and intensities, and
determines the onset and offset times for each stimulus. Use the pull-down menu to
select the desired stimulus, and then enter the Start Time in seconds and the Duration in
seconds. Click OK to add this item to the protocol. A representation of this item will
appear on the Protocol Setup screen. An example is shown below.
Figure 5.3 - Add Item
- 31 -
MED ASSOCIATES INC.
VIDEO FEAR CONDITIONING
Click Add again to add another stimulus to the protocol, or right-click on the stimulus
representation shown on the Protocol Setup screen and click Copy. Then, right-click
near the desired start time for the item and select Paste. A representation of the new
stimulus will appear.
Click on a stimulus representation (the red or green rectangle) to modify the properties
of the stimulus. Properties may be modified either by changing the values in the
“Function Detail” area of the screen, or by pressing and holding the “Ctrl” key while
simultaneously clicking and dragging the ends of the stimulus representation. Any
changes made to the properties using the mouse will be displayed in the “Function
Detail” area of the screen. In Figure 5.4, the first representation of Stimulus 1 has been
selected.
The “Function Detail” area of the screen is also where other Stimuli parameters are
defined, as shown in Figure 5.4. The Volume (dB), Frequency (Hz) and Rise Time (ms)
can be changed, as well as whether the audible stimulus is a Tone or Noise.
In the example shown in Figure 5.4, Stimulus 1 begins 10 seconds after the experiment
starts and turns off 30 seconds later. Stimulus 2 begins 30 seconds after the experiment
starts and the duration 10 seconds. All stimuli are independently defined.
Figure 5.4 - Editing Protocol Setup
- 32 -
MED ASSOCIATES INC.
VIDEO FEAR CONDITIONING
Saving a Protocol
Once all of the desired stimuli have been added to the protocol, select Save As to save
the protocol and all stimulus properties. Save the protocol to the desired directory, it
may be useful to create a folder titled “Video Freeze Protocols.” The program will
automatically save the file as a “*.pro” extension.
Figure 5.5 – Saving a *.pro File to a Specified Directory
Modifying an Existing Protocol
To modify an existing protocol, go to File | Protocol Setup, and then select Load and
choose the desired protocol.
Click on a stimulus representation to modify the properties of the stimulus. Properties
may be modified either by changing the values in the “Function Detail” area of the
screen, or by pressing and holding the “Ctrl” key while simultaneously clicking and
dragging the ends of the stimulus representation. Any changes made to the properties
using the mouse will be displayed in the “Function Detail” area of the screen. In Figure
5.4, the first representation of Stimulus 1 has been selected.
Click on a stimulus representation and click Delete to remove it from the protocol.
- 33 -
MED ASSOCIATES INC.
VIDEO FEAR CONDITIONING
CHAPTER 6
Starting an Experimental Session
From the main Video Freeze menu, choose Experiment | Start and the Experiment
Setup screen, shown below, will appear.
Figure 6.1 - Experiment Setup
Experimental Setup
The Experiment Setup screen includes the following fields/menus:
Experiment Id:
If Auto Experiment ID Generation is selected on the Options
menu (see Figure 7.2), a filename will automatically appear in the
Experiment window. This filename will include the date and time
of the experiment, and follows the form: “VFMMDDYY_HHMMSS”
This information can be altered to suit the particular experiment.
Figure 6.2 - Auto Experiment ID Generation
- 34 -
MED ASSOCIATES INC.
VIDEO FEAR CONDITIONING
Trial:
Enter trial/session information in the Trial field.
Protocol:
Next to the Protocol title, click the box labeled “…” to open the
protocol (*.pro) file saved earlier. (See Saving a Protocol).
Save Video:
Saves the video output as well as the quantified data.
NOTE:
Saving video substantially increases the amount of space required to save
experimental data. This is not a major limitation since the Video Freeze
computer has a large hard drive (200 GB) and a DVD burner.
Notes:
Enter any relevant information here, such as instructions on how
to complete the experiment.
Motion
Threshold:
Sample
Rate:
See Motion Threshold Section below.
The sample rate refers to the number of video frames scanned per
second. This value is fixed at 30 fps.
Method:
See Chapter 7.
Save:
Select Save to save the experimental configuration (*.exp) for
later use, and choose Load to use a previously saved experiment
file.
Ok:
To start the experiment.
Cancel:
To cancel and exit.
Threshold Values
The subject’s behavior is quantified as an index of motion . All movement within the
conditioning chamber is registered by the software as a change in video pixel
composition over time. Therefore, robust and fast movements will be recorded as a large
relative changes in video-pixel composition, and small, refined, and slow-movements will
be registered as somewhat smaller relative changes in pixel composition. The index of
motion has a range of 0 – 76,800 and during an experiment, movement is represented as
a graph (motion index vs. time) in a non-cumulative manner.
Motion Threshold
The Motion Threshold (au) refers to an arbitrary limit above which all behavior will
register as movement (i.e. not freezing) in the index of motion. When movement falls
below this threshold, this behavior (or lack of behavior) will be counted as freezing. A
Motion Threshold of 10-20 au is recommended.
NOTE: The Motion Threshold can be modified after the experiment is complete during
data analysis. The Method of Observation can also be changed in data analysis.
- 35 -
MED ASSOCIATES INC.
VIDEO FEAR CONDITIONING
CHAPTER 7
Methods of Observation
Linear Method
The dependent measures resulting from the linear method are:
1.
Percent Freeze: time immobile / total session time. The run-time window (see the
section on “Recording the Session”) of Video Freeze also provides:
Instantaneous Percent Freeze: time spent immobile / current session time
Cumulative Percent Freeze: time spent immobile / total session duration. This
percent freeze score will increase as the session progresses because time
immobile will increase relative to total session time. Cumulative Percent Freeze
will approach Instantaneous Percent Freeze as the session progresses.
2.
Freeze Episodes: number of freezing events, defined by Motion Threshold and
Minimum Freeze Duration
3.
Freeze Duration: total amount of time the subject spends immobile.
Minimum Freeze Duration (number of frames)
When a subject freezes during the session and the motion index falls below the Motion
Threshold, the Minimum Freeze Duration is the temporal criterion that defines
whether or not a Freeze Episode is recorded. Minimum Freeze Duration is an important
variable because it operationally defines a “freeze.” The subject might momentarily stop
moving, but this immobility may not actually represent a freeze. To prevent these
immobility events from being recognized as Freeze Episodes, set the Minimum Freeze
Duration to equal to or greater than “1”.
If the Sample Rate is 30 fps, and the Minimum Freeze Duration is set to 15 frames, then
the subject must freeze for ½ a second before the event is recorded by the software as a
freeze. If the Sample Rate is 3 fps and the Minimum Freeze Duration is 3 frames, then
the subject must remain immobile for an entire second to register as a freeze.
In Figure 7.1 each filled-in circle represents a video frame (30 fps). The subject is frozen
at 0.2 seconds (because movement is below the Motion Threshold), and remains frozen
until ~0.75 seconds. Using the linear method, the first Freeze Episode is recorded at 0.4
seconds because the Minimum Freeze Duration (6 frames) has expired. Movement is
recorded at 0.75 seconds, and the subject is immobile again at ~0.95 seconds. Once the
Minimum Freeze Duration has expired (at ~1.15 seconds), the second Freeze Episode is
recorded. Note that the Motion Threshold must be exceeded before a second Freeze
Episode can be recorded; therefore, when using the linear method, Freeze Episodes must
be separated by periods of movement.
- 36 -
MED ASSOCIATES INC.
VIDEO FEAR CONDITIONING
Figure 7.1 - Description of the Linear Method
Discrete Method
The discrete method is designed to mimic manual methods of monitoring freezing
behavior. The standard manual method of tracking freezing involves visually scanning
each fear-conditioning chamber at regular Observation Intervals (e.g. every 4
seconds), and observing behavior for a specified duration of time (Observation
Duration, e.g. 1 second). If the subject in the chamber is freezing for the entire
Observation Duration (1-second), a Freeze Count is recorded for that event. If the
subject is mobile during any portion of that observation period, then no Freeze Count is
tallied. Therefore, the number of “counts” recorded by the end of the experimental
session serves at the quantitative measure of freezing. Therefore, the discrete method
yields:
1. Freeze Count: number of freezing observations
2. Percent Freeze: number of freezing observations / total number of possible
observations
- 37 -
MED ASSOCIATES INC.
VIDEO FEAR CONDITIONING
Observation Interval & Duration (number of frames)
Observation Interval and Duration are used to determine whether a Freeze Count is
registered for a freezing event. In the Figure 7.2, the green squares represent
“observations.” A Freeze Count is recorded only when there is no motion during the
observation duration. In Figure 7.2 the highlighted green squares are Freeze Counts;
therefore four Freeze Counts are recorded for the session. Note that the frequency of
Freeze Counts is greater than the number of Freezing Episodes recorded using the linear
method. This is because several Freeze Counts can occur without a record of movement
using the discrete method.
Observation Interval and Duration must be set to greater than 1 fps, and the Observation
Duration must be less than the Observation Interval. The Observation Interval defines
the time period between the beginning of one observation and beginning of the next.
Therefore, with a Sample Rate of 30 fps, and an Observation Interval of 15, there will be
two observations per second.
Figure 7.2 - Description of the Discrete Method
Select Save to save this experimental configuration for later use.
- 38 -
MED ASSOCIATES INC.
VIDEO FEAR CONDITIONING
CHAPTER 8
Video Capturing System Calibration
PRIOR TO LOADING THE SUBJECTS INTO THE CHAMBERS, the video-capturing
system in each chamber must be calibrated. Click the Calibrate button on the main
screen, indicated with a yellow arrow in Figure 8.1. Ensure that the doors on all the
sound-attenuating cubicles and conditioning chambers are closed prior to calibrating.
Figure 8.1 - The Run Time Screen During Calibration
Select one of the four chambers that appear on the main run-time screen by clicking on
the data window (e.g. “Box: 1,” Figure 8.1) for the desired chamber. Adjust the slider on
the right side of the Motion Index graph to move the Motion Threshold (the red line) into
view, and then press Calibrate. Repeat with each chamber.
Ensure that all chambers have been appropriately calibrated by verifying that the green
motion-index line (the green line) is below the Motion Threshold (the red line). Once all
chambers have been calibrated, click the Lock box; doing so will enable the Record
button to be used to begin the experiment (see “Recording the Session”). Once the Lock
button has been selected, the Calibrate option will become unavailable.
- 39 -
MED ASSOCIATES INC.
VIDEO FEAR CONDITIONING
CHAPTER 9
Recording the Session
To begin an experiment, load all the animals into the chambers, close the doors, and
click the Record button. The Motion Index will record movement and the stimuli will be
presented in an automated fashion. The experiment is complete when the Motion Index
recorder reaches the end of the timeline. At the completion of the session, the video will
stop recording.
To view the video and motion-index data from one chamber, click on the data window of
the desired chamber (Chamber 1 in Figure 9.1). To view the video from all four chambers
simultaneously, click the “Cameras 1 vs. 4” tab button located underneath the video
display. A single click toggles between 1 and 4 chamber views.
Figure 9.1 - The Video Freeze Run Time Screen
NOTE: The video cameras are extremely sensitive to movement. Therefore, any vibration
in the laboratory environment may register as movement in the Motion Index.
- 40 -
MED ASSOCIATES INC.
VIDEO FEAR CONDITIONING
CHAPTER 10
Data Analysis
Types of Data Files
When an experiment is conducted, the Video Freeze Software simultaneously creates
three different types of data files. One is a video file (“*.wmv”) that can be viewed
using Window’s Media Player (see Figure 10.1). Another is a summary file (“*.txt”) that
can be exported to any spreadsheet program such as Excel ® (see the section on
Exporting Data to a Spreadsheet). The third type is a “*.raw” data file that can only be
viewed using Video Freeze. This “*.raw” file contains the motion-index data (see Figure
10.3). See the next section to learn how to use Video Freeze to re-analyze the “*.raw”
data file.
Figure 10.1 - Windows Media Player File (*wmv)
Figure 10.2 - Summary File (*.txt)
Date Printed
Run Time
Protocol
Experiment
Trial
Video Saved
Sample Rate (fps)
Motion Threshold (au)
Detection Method
Observation Interval
Observation Duration
Number of boxes
:
:
:
:
:
:
:
:
:
:
03/09/05 10:23:34
(null)
C:\Multiple CS-US trials session.pro
VF031505_101635
: 1
: Yes
30.000
20
Discrete
15 (frames) 00:00:00.500 (seconds)
10 (frames) 00:00:00.333 (seconds)
1
Box
: 1
Group
: Amygdala
Animal
: Animal 1
Total Time (s)
Avg Motion
==============
==============
120.000
90.254
Freeze Counts
==============
91
- 41 -
Percent Freeze
==============
34
MED ASSOCIATES INC.
VIDEO FEAR CONDITIONING
Analyzing “*.raw” data in Video Freeze
Select File | Open and locate the “*.raw” data file of interest. The Video Freeze Data
Analysis window provides the same information as the run-time window (video, motion
index, subject identifying information, freeze count, etc.).
Figure 10.3 - The “*.raw” Data Analysis Window
Use the stop/play/fast-forward/rewind tabs to play the video. If modifying the Method,
Motion Threshold or Minimum Freeze Duration, click on the Recalc button to calculate
Freezing Measures.
To focus on a specific period of time during the session, click on the blue timeline bar
located below the motion index record. Adjusting the blue bar by dragging the cursor
causes use the motion-index to expand. The collapsed timeline bar represents the
proportion of time (out of the total session time) represented in the immediately
available motion index display. Click Auto Scale to return to a view of the entire session.
- 42 -
MED ASSOCIATES INC.
VIDEO FEAR CONDITIONING
Figure 10.4 - Adjusting the Blue Timeline
Range Cursors
To obtain dependent measures from a specified interval of time within the session, use
the Range Cursors. Select the Range Cursors with a right click on the motion index
graph (see Figure 10.5), and then choose the Move Cursors | Move Cursors to
Center option. Adjust the positioning and length of the specified interval by moving the
vertical blue lines with a left-click of the mouse. Drag the blue lines to the desired
position in the Motion Index Graph, and then press Recalc. Adjusting the position of the
Range Cursors will alter the data listed under the “Cursors” display on the data analysis
screen.
Figure 10.5 - Selecting the Range Cursors
- 43 -
MED ASSOCIATES INC.
VIDEO FEAR CONDITIONING
The figure below displays the Range cursors. Note that the Freezing Measures reflect
only the data that exist between the two vertical lines on the Motion Index Graph.
Figure 10.6 - Positioning the Range Cursors
NOTE: If the range cursors are selected, only the data between the two cursors will be
represented in the data file for export to Excel (see the next section for
instructions on exporting).
- 44 -
MED ASSOCIATES INC.
VIDEO FEAR CONDITIONING
Exporting Data to a Spreadsheet
Export the “*.txt” data file to a desired location on the desktop computer by selecting
File | Export.
Figure 10.7 - Exporting a Data File
Once the file has been exported, then use Microsoft Excel to open a blank spreadsheet
and select Data | Get External Data | Import Text File. Choose the desired file, and
the import wizard will appear. Choose “tab-delimited” transfer.
Figure 10.8 - Importing a Data File Into Microsoft Excel
Click Next and progress through steps 1-3, and then Finish. When the import is
complete, the motion index data (in rows) appear as a function of time (in columns).
Time increases in Column A, and the corresponding data for each chamber appear in
each row (chambers 1-4, left to right).
- 45 -
MED ASSOCIATES INC.
VIDEO FEAR CONDITIONING
CHAPTER 11
Component Analysis
One may choose to compare PERCENT FREEZE across different events within a single
experimental session. For instance, if several conditioned-stimulus/unconditionedstimulus (CS-US) pairs are presented within a single session, then the amount of time the
subject spends motionless during each presentation of each CS may provide meaningful
information on the rate of conditioning.
Figure 11.1 - Data from Four CD-1 Mice During Fear Conditioning
The session was 30-min long with six presentations of a 30-s tone and 10-s aversive
stimulus (stimuli co-terminated). Two subjects received 0.45ma aversive stimulus, and
two received 0.27ma of aversive stimulus. Percent freeze during the first 20 seconds of
each CS presentation is illustrated above.
- 46 -
MED ASSOCIATES INC.
VIDEO FEAR CONDITIONING
Component Summary Report
To begin, open a *.raw data file, and select View | Component Setup.
The Start Time and Duration of each event, or component , are user-defined.
Therefore, one can compare percent freeze across any interval within a single
experimental session. The data in Figure 11.1 reflects percent freeze across several CSUS presentations within a session. One can also use the component analysis to compare
mean percent freezing during CS presentations and mean percent freeze when no
discrete stimuli are present.
To define each component, select Component | Add (see Figure 11.2). The
“Component” display should appear. Name each component, and enter the Start Time
(s) and the Duration (s). Percent freeze will be calculated for each component, and the
Start Time and Duration of the component determine the parameters for the calculation.
Figure 11.2 - Component Definition Display
Click Add | New to add a component or OK when all the desired components for the
analysis have been included. As new components are added to the analysis, each
component will appear in the “Report Component Definition” display.
The component analysis (“*.cmp”) is a file that can be saved independently of any
“*.raw” data file. Choose Component | Save, and select the directory and filename for
the component analysis, see below. This procedure has created a component analysis
that can be applied to any “*.raw” data file.
- 47 -
MED ASSOCIATES INC.
VIDEO FEAR CONDITIONING
Figure 11.3 - Saving a Component Analysis (*.cmp file)
To view a summary report of the component analysis, go to File | Reports |
Component Summary, then type in a file name to save the report as a “*.csv” file (see
Figure 11.4). The “*.csv” file is a tab-delimited data file that can be read by any wordprocessing or spreadsheet program.
Figure 11.4 - Generating and Saving a Component Summary Report (*.csv file)
Open Microsoft Excel ® to view the component summary report. Go to Data | Get
External Data | Import Text File, choose the *.csv file to view, and select “tabdelimited” transfer. Save the component summary report (see Table 11.1) as an Excel
Workbook (*.xls file).
- 48 -
MED ASSOCIATES INC.
VIDEO FEAR CONDITIONING
Table 11.1 - Component Analysis Results, *.csv file in Excel
Date:
Run Time:
Protocol:
Experiment:
Trial:
6/14/2008 11:46
1800 (seconds)
Identifiers
CS+CS1
Video Saved:
Yes
Sample Rate (fps):
30
Motion Threshold (au):
20
Detection Method:
Linear
Min Freeze Duration: 15 (frames) 00:00:05 (seconds)
Number of Boxes:
1
Method of
Observation and
Thresholds
Component Details
Component Name
CS1
CS2
CSminus1
CSminus2
CS3
CSminus3
Start Time
00:30.0
02:00.0
03:30.0
05:00.0
11:10.0
07:00.0
Duration (sec)
30
150
30
30
30
30
Start Frame
900
3600
6300
9000
20100
12600
Duration Frames
900
4500
900
900
900
900
From the
*.cmp
analysis
file
Dependent Variables
Component Freeze
Name
Cnt
Group
Time
Freeze
%Total
%
Time
Component
Freeze Time Freeze
Avg
Motion
Index
Min
Max
Motion Motion
Index Index
Box
Animal
1
Animal 1
2
CS+1
42
1.433
0.12
2.39
438.28
0
2471
1
Animal 1
2
CS+2
30
1.233
0.1
2.06
418.33
0
1998
1
Animal 1
2
CS-1
52
23.767
1.98
39.61
235.15
0
2417
1
Animal 1
2
CS-2
42
17.533
1.46
29.22
217.53
0
1986
- 49 -
MED ASSOCIATES INC.
VIDEO FEAR CONDITIONING
“*.csv” Dependent Variables
The “*.csv” file contains identifiers and component-analysis details, as well as four
dependent variables, listed below.
1. Freeze Count or Freeze Episodes: Number of freezing events, as defined by
either the linear or discrete method of observation (respectively), during the
component.
2. Time Freeze: Total number of seconds the subject spends motionless during the
component interval.
3. Percent Total Time Freeze: The amount of time the subjects spends motionless
during the session divided by the total amount of time for the session.
4. Percent Component Time Freeze: The amount of time the subject spends
motionless during the component divided by the total amount of time within that
component.
5. Average Motion Index: The average motion index during the component.
6. Minimum Motion Index: The minimum motion index during the component.
7. Maximum Motion Index: The maximum motion index during the component.
Batch Component Summary Report
To simultaneously apply a “*.cmp” file to multiple “*.raw” data files, go to File | Reports
| Batch Component Summary. This option will allows the user to view and save a “*.csv”
file that contains multiple experimental session data.
To generate a batch component summary report, click the first button marked “…” and
select a “*.cmp” file. Then name the batch report using the second “…” button. Select a
Method of Observation (Linear or Discrete) and define the threshold values. These
setting will be applied to all of the *.raw data included in the batch summary report, see
Table 11.1.
Figure 11.5 - Generating a Batch Summary Report Using Multiple "*.raw" Data Files
- 50 -
MED ASSOCIATES INC.
VIDEO FEAR CONDITIONING
Select OK, and then choose the “*.raw” file or files to which the “*.cmp” analysis will be
applied. To select multiple files at once, press the Ctrl key while using the left mouse
button.
Figure 11.6 - Select the "*.raw" File or Files
Upon selecting the “*.raw” data files, the batch component analysis will be saved to the
location specified for the output file. The batch component summary report will contain
all of the dependent variables included in the component summary. Table 11.2 includes
component data for two subjects (Rat #3 & 4, in chambers #1 & 2)
Table 11.2 - Batch Component Summary Report
Date :
6/14/2005 13:04
Motion Threshold (au): 20
Detection Method:
Linear
Min Freeze Duration (f):
1
Component Details
Component Name Start Time
CS1
00:30.0
CS2
02:00.0
CSminus1
03:30.0
CSminus2
05:00.0
CS3
11:10.0
CSminus3
07:00.0
Duration (s)
30
150
30
30
30
30
Experiment
VF030205
APPENDIX
VF030205
VF030205
VF030205
VF030205
VF030205
Box
3
3
3
3
3
3
Animal
1
1
1
1
1
1
Group
05-02-1
05-02-1
05-02-1
05-02-1
05-02-1
05-02-1
SD
SD
SD
SD
SD
SD
ComptName Frz Cnt TimeFrz %TmFrz
Rat
CS1
2
0.167
0.1
Rat
CS2
59
67.567 22.5
Rat
CS-1
6
27.667 9.2
Rat
CS-2
0
0
0
Rat
CS3
0
0
0
Rat
CS-3
0
0
0
%CompTmFrz
0.6
45
92.2
0
0
0
4
4
4
4
4
4
2
2
2
2
2
2
05-02-1
05-02-1
05-02-1
05-02-1
05-02-1
05-02-1
SD
SD
SD
SD
SD
SD
Rat
Rat
Rat
Rat
Rat
Rat
4.4
56.1
84.3
0
0
0
VF030205
VF030205
VF030205
VF030205
VF030205
VF030205
Trial
Rat
Rat
Rat
Rat
Rat
Rat
Rat
Rat
Rat
Rat
Rat
Rat
- 51 -
CS1
CS2
CS-1
CS-2
CS3
CS-3
9
62
9
0
0
0
1.333
84.2
25.3
0
0
0
0.4
28.1
8.4
0
0
0
MED ASSOCIATES INC.
VIDEO FEAR CONDITIONING
APPENDIX A
Driver and Software Installation
If the computer being used with the Video Fear Conditioning System was purchased as
part of the system from MED Associates, the driver and software installation was
completed at the factory. If the computer was not purchased from MED Associates,
follow the instructions to install the hardware drivers and software programs.
Before beginning the installation, phone, fax or e-mail Med Associates with the
registration information in order to receive the software installation password.
This password will be necessary during the installation process.
Insert the Video Freeze CD into the CD-ROM drive and the screen shown in Figure A.1
will appear. Click Install Video Freeze and the screen shown in Figure A.2 will appear.
Figure A.1 - Installation Screen
- 52 -
MED ASSOCIATES INC.
VIDEO FEAR CONDITIONING
Begin installing the drivers and software by clicking Install. Complete the steps to
install the drivers and software, entering the desired User Name and Company as well as
the password when prompted.
Successful installation of each item will be indicated by a green check mark, and a red X
will indicate an unsuccessful installation.
Once the drivers and software have
successfully been installed, the screen shown in Figure A.3 will appear.
Figure A.2 – Video Freeze Installation Checklist
Driver and software installation has been successfully completed. Click Finish to close
this screen.
Figure A.3 – Customer Information Screen
- 53 -
MED ASSOCIATES INC.
VIDEO FEAR CONDITIONING
APPENDIX B
Door Hinge Adjustment
The steps in this section should be followed to ensure that the Sound-Attenuating Cubicle
(SAC) doors are properly adjusted.
1. Close the left door and verify that it is properly sealed against the SAC. When the
door is properly sealed the gap between the door and the SAC is equal at both ends,
as shown in Figure B.1. If this gap is not even, proceed to Step 2.
Figure B.1 - Top View of SAC with Properly Sealed Door
2. Loosen the hinge-retaining screw, shown in Figure B.2, and slide the hinge until into
the proper position. Once the door is sealed correctly, tighten the hinge-retaining
screw. Repeat this step on the right door. It may take more than one attempt to
achieve an acceptable seal.
Figure B.2 - Hinge Retaining Screw
- 54 -
MED ASSOCIATES INC.
VIDEO FEAR CONDITIONING
3. Close the left, then the right doors. The vertical seam between the two doors should
be evenly spaced from top to bottom, as shown in Figure B.3. If they are not,
proceed to Step 4.
Figure B.3 - Front View of SAC with Even Vertical Door Gap
4. Adjust the door position using the Horizontal Adjustment Screw. Turn the screw
clockwise to move the door closer to the vertical center of the SAC, and
counterclockwise to move it further. For example, if vertical gap between the doors
is smaller at the top of the SAC than at the bottom, assess which door needs to be
adjusted. If it is determined that the top of the right side door is too close to the
center, then the Horizontal Adjustment Screw on the top hinge should be turned
counterclockwise.
Figure B.4 - Horizontal Adjustment Screw
- 55 -
MED ASSOCIATES INC.
VIDEO FEAR CONDITIONING
APPENDIX C
Camera Filter Care and Handling Instructions
Proper care and handling of the camera filter are crucial to the proper operation of the
system. Clean the filter gently only if necessary. Loose particles should be removed with
a bulb puffer or with a filtered, pressurized air cleaner. If necessary, gently wipe the
surface using anhydrous alcohol and lint-free lab towels. Use a new surface of the towel
with each wipe. Avoid touching or wiping the filter with bare fingers.
- 56 -
MED ASSOCIATES INC.
VIDEO FEAR CONDITIONING
APPENDIX D
Installing Contextual Inserts
A-Frame Insert
Begin installation of the A-Frame contextual insert by sliding the chamber forward inside
the SAC and opening the chamber door. Using the handle, pull the grid floor and waste
pan forward until they are nearly removed from the chamber. Insert the A-Frame
Contextual Insert so that there are two grid rods visible on either side when viewed from
above. Refer to Figure D.1.
Figure D.1 - A-Frame Contextual Insert Installed
Smooth Floor Insert
Install the smooth floor contextual insert by sliding the chamber forward inside the SAC
and opening the chamber door. Using the handle, pull the grid floor and waste pan
forward until they are nearly removed from the chamber. Place the smooth floor insert
over the grid floor. Refer to Figure D.2.
Figure D.2 - Smooth Floor Contextual Insert Installed
- 57 -
MED ASSOCIATES INC.
VIDEO FEAR CONDITIONING
Curved Wall Insert
Begin installation of the curved wall contextual insert by sliding the chamber forward
inside the SAC and opening the chamber door. Using the handle, pull the grid floor and
waste pan forward until they are completely removed from the chamber. Place the insert
inside of the chamber so that the ends are braced against the side wall supports of the
chamber. Refer to Figure D.3. Be sure to reinstall the grid floor and waste pan prior to
placing animals in the chamber.
Figure D.3 - Rounded Back Wall Contextual Insert Installed
- 58 -