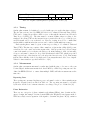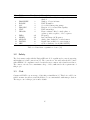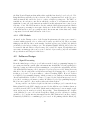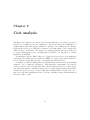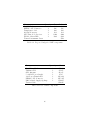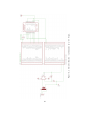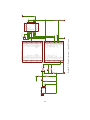
1
Design of an Inexpensive Residential Phasor Measurement Unit
Jeremy Murray Vick
ECE 499, Electrical Engineering Capstone
Department of Electrical and Computer Engineering
Union College
Schenectady, NY
Advisor: Professor Luke Dosiek
March 17, 2015
Abstract
Phasor measurement units, (PMUs) are widely used by power companied to measure the
state of transmission lines and the quality of transmitted power. The goal of this project is
to design a low cost PMU that takes measurements at the residential level of the power grid.
This device must be easy to manufacture and highly reliable. It will communicate results
back to a central database via the internet. Compliance with IEEE Standard C37.118.1 and
C37.118.2 is required. The widespread introduction of an inexpensive PMU will increase
the data resolution available in Wide Area Monitoring Systems (WAMS), providing control
room operators with a more accurate picture of the state of the power grid.
Contents
1 Introduction
1.1 Motivation . . . . . . . . . . . . . . . . . . . . . . . . . . . . . . . . . . . .
1.2 Objective . . . . . . . . . . . . . . . . . . . . . . . . . . . . . . . . . . . . .
6
6
7
2 Background
2.1 Synchrophasor Definition . . . . . . . . . . . . . . . . . . . . . . . . . . . .
2.2 Previous Work . . . . . . . . . . . . . . . . . . . . . . . . . . . . . . . . . .
8
8
8
3 Design Requirements
3.1 Performance . . . . . . . . . .
3.1.1 Step Down and Device
3.1.2 Analog Filtering . . .
3.1.3 Timing . . . . . . . .
3.1.4 Measurement . . . . .
3.1.5 Communication . . . .
3.2 Safety . . . . . . . . . . . . .
3.3 Cost . . . . . . . . . . . . . .
. . . .
Power
. . . .
. . . .
. . . .
. . . .
. . . .
. . . .
.
.
.
.
.
.
.
.
.
.
.
.
.
.
.
.
.
.
.
.
.
.
.
.
.
.
.
.
.
.
.
.
.
.
.
.
.
.
.
.
.
.
.
.
.
.
.
.
.
.
.
.
.
.
.
.
.
.
.
.
.
.
.
.
.
.
.
.
.
.
.
.
.
.
.
.
.
.
.
.
.
.
.
.
.
.
.
.
.
.
.
.
.
.
.
.
.
.
.
.
.
.
.
.
.
.
.
.
.
.
.
.
.
.
.
.
.
.
.
.
.
.
.
.
.
.
.
.
.
.
.
.
.
.
.
.
.
.
.
.
.
.
.
.
.
.
.
.
.
.
.
.
.
.
.
.
.
.
.
.
.
.
.
.
.
.
.
.
.
.
.
.
.
.
.
.
11
11
11
12
13
13
14
15
15
4 Design Alternatives
4.1 Component Selection . . . .
4.1.1 Computing Platform
4.1.2 GPS Module . . . .
4.2 Software Design . . . . . . .
4.2.1 Signal Processing . .
4.2.2 Signal Acquisition .
.
.
.
.
.
.
.
.
.
.
.
.
.
.
.
.
.
.
.
.
.
.
.
.
.
.
.
.
.
.
.
.
.
.
.
.
.
.
.
.
.
.
.
.
.
.
.
.
.
.
.
.
.
.
.
.
.
.
.
.
.
.
.
.
.
.
.
.
.
.
.
.
.
.
.
.
.
.
.
.
.
.
.
.
.
.
.
.
.
.
.
.
.
.
.
.
.
.
.
.
.
.
.
.
.
.
.
.
.
.
.
.
.
.
.
.
.
.
.
.
.
.
.
.
.
.
.
.
.
.
.
.
.
.
.
.
.
.
17
17
17
18
18
18
19
.
.
.
.
20
20
20
21
21
.
.
.
.
.
.
.
.
.
.
.
.
.
.
.
.
.
.
.
.
.
.
.
.
5 Preliminary Proposed Design
5.1 Hardware Design . . . . . . . . . . .
5.1.1 Voltage Step Down . . . . . .
5.1.2 Anti-Aliasing Filter . . . . .
5.1.3 Analog to Digital Conversion
1
.
.
.
.
.
.
.
.
.
.
.
.
.
.
.
.
.
.
.
.
.
.
.
.
.
.
.
.
.
.
.
.
.
.
.
.
.
.
.
.
.
.
.
.
.
.
.
.
.
.
.
.
.
.
.
.
.
.
.
.
.
.
.
.
.
.
.
.
.
.
.
.
.
.
.
.
.
.
.
.
.
.
.
.
.
.
.
.
.
.
.
.
.
.
.
.
.
.
.
.
.
.
.
.
.
.
.
.
.
.
.
.
.
.
.
.
.
.
.
.
.
.
.
.
.
.
.
.
.
.
.
.
.
.
.
.
.
.
.
.
.
.
.
.
.
.
.
.
.
.
.
.
.
.
.
.
.
.
.
.
.
.
.
.
.
.
.
.
.
.
.
.
.
.
.
.
.
.
.
.
.
.
.
.
.
.
.
.
.
.
.
.
.
.
.
.
.
.
.
22
23
23
23
23
6 Final Design
6.1 Hardware Design . . . . . . . . . . .
6.1.1 Voltage Step Down . . . . . .
6.1.2 Anti-Aliasing Filter . . . . .
6.1.3 Analog to Digital Conversion
6.1.4 GPS Timing . . . . . . . . .
6.2 Signal Processing . . . . . . . . . . .
6.2.1 Sampling Rate . . . . . . . .
6.2.2 Raw Data Processing . . . .
6.2.3 Synchrophasor Estimation . .
.
.
.
.
.
.
.
.
.
.
.
.
.
.
.
.
.
.
.
.
.
.
.
.
.
.
.
.
.
.
.
.
.
.
.
.
.
.
.
.
.
.
.
.
.
.
.
.
.
.
.
.
.
.
.
.
.
.
.
.
.
.
.
.
.
.
.
.
.
.
.
.
.
.
.
.
.
.
.
.
.
.
.
.
.
.
.
.
.
.
.
.
.
.
.
.
.
.
.
.
.
.
.
.
.
.
.
.
.
.
.
.
.
.
.
.
.
.
.
.
.
.
.
.
.
.
.
.
.
.
.
.
.
.
.
.
.
.
.
.
.
.
.
.
.
.
.
.
.
.
.
.
.
.
.
.
.
.
.
.
.
.
.
.
.
.
.
.
.
.
.
.
.
.
.
.
.
.
.
.
.
.
.
.
.
.
.
.
.
.
.
.
.
.
.
.
.
.
26
26
26
27
27
28
28
28
29
29
.
.
.
.
30
30
30
30
32
5.2
5.1.4
Signal
5.2.1
5.2.2
5.2.3
GPS Timing . . . . . . .
Processing . . . . . . . . .
Sampling Rate . . . . . .
Raw Data Processing . .
Synchrophasor Estimation
7 Results
7.1 Evaluation Plan . . . . .
7.1.1 Timing Accuracy
7.1.2 Measurement . .
7.1.3 Communication .
.
.
.
.
.
.
.
.
.
.
.
.
.
.
.
.
.
.
.
.
.
.
.
.
.
.
.
.
.
.
.
.
.
.
.
.
.
.
.
.
.
.
.
.
.
.
.
.
.
.
.
.
.
.
.
.
.
.
.
.
.
.
.
.
.
.
.
.
.
.
.
.
.
.
.
.
.
.
.
.
.
.
.
.
.
.
.
.
.
.
.
.
.
.
.
.
.
.
.
.
.
.
.
.
.
.
.
.
.
.
.
.
.
.
.
.
.
8 Production Schedule
33
9 Cost analysis
35
10 User Manual
10.1 Setup . . . . . . .
10.1.1 Calibration
10.2 Operation . . . . .
10.3 Maintenance . . .
37
37
37
38
38
.
.
.
.
.
.
.
.
.
.
.
.
.
.
.
.
.
.
.
.
.
.
.
.
.
.
.
.
.
.
.
.
.
.
.
.
.
.
.
.
.
.
.
.
.
.
.
.
.
.
.
.
.
.
.
.
.
.
.
.
.
.
.
.
.
.
.
.
.
.
.
.
.
.
.
.
.
.
.
.
.
.
.
.
.
.
.
.
.
.
.
.
.
.
.
.
.
.
.
.
.
.
.
.
.
.
.
.
.
.
.
.
.
.
.
.
.
.
.
.
.
.
.
.
.
.
.
.
11 Conclusion
40
A Preliminary Circuit Diagram
41
B Final Circuit Diagram
43
C Texas Instruments Header
45
D PRU Assembly Code
48
2
E Python Code
53
3
List of Figures
2.1
2.2
2.3
Phase calculation based on UTC reference . . . . . . . . . . . . . . . . . . .
Angle convention for synchrophasors . . . . . . . . . . . . . . . . . . . . . .
OpenPMU block diagram . . . . . . . . . . . . . . . . . . . . . . . . . . . .
9
9
10
3.1
3.2
3.3
rPMU block diagram . . . . . . . . . . . . . . . . . . . . . . . . . . . . . . .
Anti-aliasing filter frequency response . . . . . . . . . . . . . . . . . . . . .
Data frame transmission order . . . . . . . . . . . . . . . . . . . . . . . . .
12
12
14
5.1
5.2
5.3
5.4
DC Bias Circuit . . . . . . . . .
Anti-Aliasing Filter Circuit . . .
Analog Front End Block Diagram
ADC Sequencer Flowchart . . . .
.
.
.
.
21
22
23
24
6.1
ADC Block Diagram . . . . . . . . . . . . . . . . . . . . . . . . . . . . . . .
28
7.1
7.2
Phase vs. Time . . . . . . . . . . . . . . . . . . . . . . . . . . . . . . . . . .
Frequency vs. Time . . . . . . . . . . . . . . . . . . . . . . . . . . . . . . .
31
31
A.1 Preliminary Circuit Schematic . . . . . . . . . . . . . . . . . . . . . . . . . .
42
B.1 Final Circuit Schematic . . . . . . . . . . . . . . . . . . . . . . . . . . . . .
44
.
.
.
.
.
.
.
.
4
.
.
.
.
.
.
.
.
.
.
.
.
.
.
.
.
.
.
.
.
.
.
.
.
.
.
.
.
.
.
.
.
.
.
.
.
.
.
.
.
.
.
.
.
.
.
.
.
.
.
.
.
.
.
.
.
.
.
.
.
.
.
.
.
.
.
.
.
.
.
.
.
.
.
.
.
.
.
.
.
.
.
.
.
List of Tables
3.1
3.2
3.3
Required synchrophasor reporting rates . . . . . . . . . . . . . . . . . . . .
Data frame organization . . . . . . . . . . . . . . . . . . . . . . . . . . . . .
Summary of design requirements . . . . . . . . . . . . . . . . . . . . . . . .
13
15
16
5.1
Bill of Materials
. . . . . . . . . . . . . . . . . . . . . . . . . . . . . . . . .
25
8.1
Proposed weekly schedule for Fall 2014 . . . . . . . . . . . . . . . . . . . . .
34
9.1
9.2
Proposed budget for PMU components . . . . . . . . . . . . . . . . . . . . .
Cost of PMU components . . . . . . . . . . . . . . . . . . . . . . . . . . . .
36
36
10.1 Component and software versions used in this project. . . . . . . . . . . . .
39
5
Chapter 1
Introduction
1.1
Motivation
On August 14, 2003, North America suffered its largest blackout. Major 345 kV transmission lines dropped out of service, unbeknownst to operators, causing a cascading outage that
extended across the Midwest, Northeast, and into Canada [1]. An investigation launched
by the North American Electric Reliability Corporation (NERC) found that the blackout
could have been confined to a small region had operators known the status of overstressed
and failing lines [2].
Since this catastrophe, steps have been taken to improve real-time, networked monitoring of America’s electrical transmission and distribution network, in order to enable
system operators to predict and counteract or confine disturbances. Increased situational
awareness can also allow the dynamic calculation of maximum load ratings based on environmental conditions. Overall, improved monitoring allows utilities to provide power to
customers in a more efficient, more reliable, and safer way.
The installation of phasor measurement units (PMUs) provides a real time image of
operating conditions. Increasing the number of PMUs improves the resolution of data
available to control room operators. It also creates the possibility for implementation of
automatic control systems to correct disturbances or failures. However, these devices are
costly, approximately $43,400 per installation, and are hard to install [3]. They also require
dedicated communication networks to feed data back to centralized processors, known as
phasor data concentrators (PDCs).
PMUs can offer a new insight when installed at the distribution level of the power grid.
The prevalence of distributed generation, smaller power plants that supply communities
rather than regions, is increasing due to the fact that renewable power generation is better
suited for communities. This increase causes an increase in dynamic events at the distribution level, as wind turbines and solar farms increase and decrease their output in step with
the weather. Having PMUs measuring at the distribution level will give a more accurate
6
picture of how the increase in distributed generation affects the power grid on a day-to-day
and long term basis.
1.2
Objective
The goal of this project is to design a low cost PMU that takes measurements at the
residential level of the power grid. This device should be easy to manufacture and highly
reliable. It should communicate results back to a central database using the protocol
described in the IEEE Standard for Syncrophasor Data Transmission.
7
Chapter 2
Background
2.1
Synchrophasor Definition
Alternating Current (AC) is mathematically represented by a cosine wave,
x = A cos(2πfAC t + φ)
(2.1)
where fAC = 60Hz in North America. Using a technique proposed by Charles Proteus
Steinmetz in [4], AC can be represented as a simplified quantity called a phasor. When
representing a cosine as a phasor, it is assumed that the frequency of the signal remains
the same. Therefore, the variable quantities are magnitude and phase. For AC, magnitude
is commonly defined as the root mean square of voltage. Equation (2.1) becomes
A
X=√ φ
2
(2.2)
Establishing phase requires either a signal or time reference. Synchrophasors calculate
phase using an absolute time reference, commonly Coordinated Universal Time (UTC).
Figure 2.1 shows a cosine superimposed on a UTC time pulse. The synchrophasor is defined
to be 0◦ if the cosine has a maximum during the pulse and 90◦ if the cosine has a zero
crossing at the pulse. Values between 0◦ and 90◦ are calculated according to the selected
phasor estimation algorithm [5]. Previously, phasor measurement at generators and nodes
in the transmission network was impractical due to geographic separation between the
two. Implementation of synchrophasors allows for easy calculation of magnitude and phase
differences between nodes based off a shared standard time.
2.2
Previous Work
The concept of a synchrophasor was first introduced in the 1980s and has since generated
a large body of commercial and academic research. It is impossible to address all work
8
ONS ON POWER DELIVERY, VOL. 23, NO. 4, OCTOBER 2008
1805
xploring the IEEE Standard C37.118–2005
Synchrophasors for Power Systems
Figure 2.1: Phase calculation based on UTC reference. Source: [6]
in, D. Hamai, M. G. Adamiak, S. Anderson, M. Begovic, G. Benmouyal, G. Brunello, J. Burger,
B. Dickerson, V. Gharpure, B. Kennedy, D. Karlsson, A. G. Phadke, J. Salj, V. Skendzic, J. Sperr,
Y. Song, C. Huntley, B. Kasztenny, and E. Price
EEE Standard 1344–1995 [1] on measurement of
phasors of power system currents and voltages has
nd published as IEEE Standard C37.118–2005 [2].
been prepared by the IEEE Working Group who
revised version. The purpose of the paper is to
ower engineering community of the availability and
new standard, highlight some of the key differences
d and new versions, and introduce several applicawerful technology.
—Global positioning system (GPS) synchronized
measurement unit (PMU), power system measurephasor, wide-area measurements.
7.118-2005 SYNCHROPHASOR STANDARD
tion provides an overview of the new IEEE Stan7.118-2005, and summarizes its main points. The Fig. 1. Synchrophasor definition and angle convention.
approved in September 2005 and published
in
Figure
2.2: Angle convention for synchrophasors. Source: [7]
is available from IEEE in either PDF or printed
power system voltage or current to an absolute time reference.
This absolute reference is provided in the form of a common
timing signal by high-accuracy clocks synchronized to coordird covers synchronized phasor measurements nated universal time (UTC) such as the universally used global
ic power systems. It defines the measurement positioning system (GPS).
Using the synchronized clocks as a reference, a PMU crerovides a method of determining the precision
9
nts, and provides requirements for measurement ates the phasor representation (complex number) of a constant
under steady state conditions. It also defines data sinusoidal signal as shown in Fig. 1. The reporting instant, repn formats for real-time data transmission. The resented by a timetag, defines the reference for the phasor repoduces the concept of a phasor measurement unit resentation of the measured sinusoidal input. The relationship
vice making, communicating, and potentially between the reporting instant and the phasor representation is
synchronized measurements. Compliant PMUs such that the phase angle of the phasor is equal to the angular
rchangeable with each other by providing equiv- separation between the reporting time and the peak of the sinuments when supplied with identical steady-state soid. For example, in Fig. 1(a), the peak of the signal coincides
and communicating these measurements in a with the timetag yielding the angle measurement of 0 , while in
Fig. 1(b), the signal crosses zero at the timetag yielding a
way.
Figure 2.3: OpenPMU block diagram. Source: [10]
on synchrophasors and their applications in the scope of this project so emphasis will be
placed on development of inexpensive PMUs.
K. Kirihara, B. Pinte, and A. Yoon designed and tested a relatively low cost (approximately $1050) PMU as part of an undergraduate senior project described in [8]. Their
project utilized a National Instruments sbRIO for digital filtering and calculation of synchrophasors. Global Positioning System (GPS) was used to generate the time reference.
The project was able to successfully measure phasors, but utilized only the National Electrical Code residential voltage standards to test the PMU, ignoring IEEE C37.118.1. The
group also did not address the transmission of synchrophasors to a centralized server or
phasor data concentrator (PDC).
In Brian Miller’s Masters thesis [9], alternatives for conventional current transducers
are considered. Miller also examines the use of wireless networks for time synchronization
under the IEEE 1588 standard. Use of wireless networks is found to provide a viable
alternative to GPS synchronization, useful in areas where signal strength is diminished.
It would also provide a cost reduction due to the elimination of the GPS module. These
proposed changes were found to be viable improvements while remaining compliant with
the IEEE C37.118.1 standard.
In order to lessen the restrictions of proprietary hardware and algorithms on the
progress of PMU development, the OpenPMU [10] group was formed, dedicated to designing ”open source platform for synchrophasor applications and research.” The group
utilizes a standard data acquisition device (DAQ) from National Instruments and a GPS
receiver from Garmin as the basis for the OpenPMU. A PIC from Microchip synchronizes
the DAQ to the GPS timecode. The OpenPMU uses the Python scripting language running on Microsoft Windows. It is currently able to measure synchrophasors, but has yet
to achieve full compliance with IEEE C37.118.1.
10
Chapter 3
Design Requirements
3.1
Performance
A vast majority of the performance requirements for this project are drawn from the IEEE
Standard for Synchrophasor Measurements for Power Systems [11], its 2014 amendment
[12] and the IEEE Standard for Synchrophasor Data Transfer for Power Systems [13].
Two classes of performance are laid out in the standards: P, for fast response with no
explicit filtering and M, for analytic measurements sttausceptible to aliasing. Adherence
to these standards will ensure that the device is compatible with existing phasor data
concentrators (PDCs) and visualization software.
The device is broken down into seven different component parts as shown in Figure
3.1. The measurement source is a 120v residential outlet. A step down circuit lowers
the voltage of the measurement source into the range of the A/D converter. This circuit
will also provide DC power for the device itself. An analog anti-aliasing filter will be
used to limit the signal bandwidth before sampling. The signal passes through an A/D
converter that samples in synchronicity with the time source. The time source provides
an absolute time reference to the A/D converter and the Synchrophasor Estimator. The
Synchrophasor Estimator will calculate the magnitude of digital signal and run it through
a phase estimation algorithm (PEA). The resulting magnitude and phase estimation will
be given a time tag and sent to a PDC via the internet interface. The device must also
accept commands transmitted by the PDC.
3.1.1
Step Down and Device Power
Analog to Digital (A/D) converters are not typically capable of measuring signals at 120v,
meaning a voltage step down circuit must be designed to reduce the magnitude of the AC
signal to match the specified range of the A/D. The device may only have one connection to
the power source, meaning the step down circuit must also include a tap and rectification
circuit to provide power for the chosen processor. The supply circuit should have over11
OR
Time
Source
120v
Residential
Outlet
Step
Down
Anti-Aliasing
Filter
A/D Converter
Device
Power
Synchrophasor
Estimator
Internet
Interface
Data
Concentrator
Control
Commands
Phasor Data
Concentrator
Figure 3.1: rPMU block diagram.
Figure 3.2: Anti-aliasing filter frequency response. Source: [14]
voltage protection to prevent damage to the device and have an output voltage ripple that
meets the constraints of the chosen processor.
3.1.2
Analog Filtering
Since an A/D conversion is being performed, it necessary to have an analog low-pass filter
to reduce the bandwidth of the input signal and eliminate aliasing. The cutoff frequency for
the low-pass filter should be just above fs /2, the chosen sampling frequency. The desired
frequency response, defined in terms of the sampling frequency, is shown in Figure 3.2.
12
System Frequency
Reporting Rates (frames per second)
50 Hz
10 25
10
12
60 Hz
15 20
30
Table 3.1: Required synchrophasor reporting rates. Source: [13]
3.1.3
Timing
Synchrophasors must, by definition, be recorded with respect to an absolute time reference.
The absolute reference used by IEEE C37.118.1 is Coordinated Universal Time (UTC).
UTC can be obtained from either a GPS receiver or through the internet based Precision
Time Protocol (PTP) [15]. The time must be accurate within ±26µs according to the
standard. Receiving UTC via the internet is more practical for the scope of this project,
as GPS signals can be very weak indoors. However, testing is needed to confirm that
synchronization with internet time servers can be achieved with sufficient accuracy.
Each synchrophasor must be given a time tag according to Coordinated Universal
Time (UTC). The time tag consists of three numbers: a System On a Chip (SOC) count,
a fraction-of-second count, and a time status value. SOC is specified as a 4-byte binary
count of the number of seconds since the Unix epoch, 00:00 January 1, 1970. Occasionally,
a leap second must be inserted to keep SOC synchronized with UTC, which is specified
using a special case of the fraction-of-second as specified in section 4.3 of [11]. Time status
indicates the reliability of the clock, which can become unsynchronized due to loss of signal.
Values for time status are specified in Table 6 of [11].
3.1.4
Measurement
Synchrophasor measurements must be synchronized with the time code source so they can
be time-aligned with measurements from other PMUs by a PDC. Reporting rates are also
defined in IEEE C37.118.1 to ensure that multiple PMUs will take measurements at the
same rate.
Reporting Rate
The reporting rate, measured in phasors per second, must be a factor of the nominal system
frequency. Required rated are listed in Table 3.1. The reporting rate must be selectable
by the user via the device’s internet interface according to the protocol defined in [13].
Phase Estimation
There are two categories of phase estimation algorithms (PEAs): time domain and frequency domain. An example of a time domain PEA is the Weighted Least Squares method.
WLS uses a Taylor series expansion of the signal to determine the phase. In [16], variation
13
Figure 3.3: Data frame transmission order. Source: [13]
of the number of terms in the series is studied in an attempt to reduce error. The Interpolated Discrete Fourier Transform (IpDFT) is an example of a frequency domain algorithm.
The IpDFT is significantly faster than WLS, but does not perform as well when disturbances occur. A thorough comparison between WLS and IpDFT is carried out in [16]. The
selection of the PEA will provide the constraints for selection of a processor.
Total Vector Error
Total Vector Error (TVE) is a measurement of the difference between a perfect theoretical
phasor and the actual phasor measured by the PMU. The IEEE Std. C37.118.1 defines
TVE as:
s
(X̂r (n) − Xr (n))2 + (X̂i (n) − Xi (n))2
T V E(n) =
(3.1)
Xr (n)2 + Xi (n)2
Where X̂r (n) and X̂i (n) are the real and imaginary components, respectively, of the measured phasor and Xr (n) and Xi (n) are the components of the theoretical phasor. The
standard specified that TVE must be less than 1%. Sources of TVE include timing inaccuracy, off-nominal signal frequency, and low frequency oscillations.
3.1.5
Communication
Communication between the PMU and PDC will take place via the internet. Data packets
will be sent using Transmission Control Protocol (TCP). Data packets are subdivided into
frames, each containing a specific piece of data. The frames required for sending phasor
data, as defined in IEEE C37.118.2, to a PDC are listed in Table 3.2. The phasor itself
is transmitted in frame 7. The DIGITAL frame can be used to transmit extra device
status indicators not included in the STAT frame, relay statuses, breaker statuses or other
information. The generic order of frame transmission is shown in Figure 3.3, where DATA1,
DATA2, etc. are frames 7-11 from Table 3.2
14
No.
1
Field
SYNC
Size (bytes)
2
2
3
4
5
6
7
FRAMESIZE
IDCODE
SOC
FRACSEC
STAT
PHASOR
8
9
10
11
12
FREQ
DFREQ
ANALOG
DIGITAL
CHK
2
2
4
4
2
4
2/4
2/4
2+
2+
2
Description
Sync byte followed by frame type and version
number.
Number of bytes in frame.
PMU ID number.
Second Of Century time stamp.
Fraction of Second and Time Quality.
PMU status flags.
Phasor estimate. May be single phase or
3-phase positive, negative, or zero sequence.
Frequency.
Rate Of Change Of Frequency.
Analog data, available for extra features.
Digital data, available for extra features.
Cyclic redundancy check (CRC-CCITT)
Table 3.2: Data frame organization. Source: [13]
3.2
Safety
The device must comply with the National Electric Code regulations for connection spacing
and insulation for 120v connections [17]. The connection to the wall outlet should be made
with a NEMA 5-15 compliant connector as it is the most common outlet found in residences.
The connector is rated for a maximum voltage of 125v, sufficient for the requirements of
this project.
3.3
Cost
Commercial PMUs cost an average of $43,400 per installation [3]. This device will be installed en masse in residences and should have a cost commensurate with mass production.
The target cost for this project is under $1,000.
15
Section
Step down
Device power
Analog filtering
Timing
Phase estimation
Safety
Cost
Comments
Step down 120v measurement source to acceptable range
for A/D converter
Determined by the choice of processor
Low pass filter with fc just above fs /2
Either internet or GPS based
Either WLS or IpDFT
Must follow all wiring and spacing regulations for 120v
Target cost is under $1000
Table 3.3: Summary of design requirements
16
Chapter 4
Design Alternatives
4.1
4.1.1
Component Selection
Computing Platform
The computing platform is the core of the phasor measurement unit. It is responsible for
acquiring raw AC voltage waveform data from an Analog to Digital Converter (ADC) in
synchronicity with the GPS Pulse Per Second (PPS) time code, computing the magnitude
and phase of the signal, packaging the measured data into the IEEE C37.118.2 transmission
format and sending the resulting data packet over the internet to a PDC. Many options
were considered in the choice of the computing platform for this project, including the wellknown Raspberry PI, the Arduino, BeagleBone Black, and Intel Edison. The Raspberry
PI, while it is a relatively powerful platform with thorough documentation and an active
user base, was dismissed due to the lack of an onboard ADC. Choosing a platform with
an onboard ADC is important because it simplifies the circuitry and reduces the cost of
the device. An Arduino, while it has an onboard ADC, lacks the computing power of the
other SOC based alternatives, requires additional components to connect to the internet,
and does not have the ability to be reprogrammed remotely, an important consideration
when deploying a device in the homes of laymen residents.
Intel’s Edison platform was considered for its high computing power density (dual core
500 MHz processor), but rejected due to the scarcity of public documentation. Ultimately,
the BeagleBone Black was chosen as the computing platform. It has a 1 GHz processor, which outperforms the Raspberry PI’s 700 MHz, a built in ethernet port for internet
connection, and an onboard ADC with eight input channels. The Black also can run the
Debian or Ubuntu Linux distributions. Using these Linux distributions provides built in
support for remotely accessing the device and a large package database to pull from when
implementing components of the project. Of the most consequence in choosing this board
was the NEON and Programmable Realtime Unit (PRU) subsystems. The NEON subsystem provides hardware acceleration for floating point calculations and a implementation of
17
the Fast Fourier Transform that utilizes this capability has already been developed. Utilizing this library will allow for the reduction of the computational load on the processor,
which in turn should enable the device to achieve a higher reporting rate. The PRU, essentially an onboard microcontroller in which the execution of each instruction is fixe is
significant because all of the instructions available in this subsystem have a fixed execution time of 5ns. The PRU interfaces directly with the ADC subsystem and the Black’s
onboard memory, meaning it can acquire data from both the GPS and AC voltage inputs
to the ADC and store it for processing in a fixed, known amount of time that can be easily
compensated for in the final calibration of the device.
4.1.2
GPS Module
As stated in the Timing section of the Design Requirements, the time source must be
accurate within ±26µs in order to achieve the accuracy specified in [11]. There are many
timing-specific GPS modules on the market, but their average price is $450, [18] which is
prohibitive for the budget of this project. The Adafruit Ultimate GPS Module is offered at
a reasonable $40 and achieves ±9µs accuracy [19] on its PPS output. Though this is not
as accurate as timing-specific sources, some boast sub ±5µs accuracy, [20] it is well within
the specifications and budget for this device.
4.2
Software Design
4.2.1
Signal Processing
From the initial stages of the project, Python was the desired programming language for
processing raw data into synchrophasor measurements. Availability of Python packages for
signal processing and ethernet packet transmission, cross platform compatibility, and the
ease with which the language can be interpreted by a lay person were the driving factors in
this choice. By choosing such a widely known and supported language the code generated
in this project can be of greater utility to others researching PMUs. However, Python
is a high-level programming language which presents a few challenges when interacting
directly with hardware. Python code has to be parsed by the Python interpreter before it
is executed, exacting a performance penalty. In addition, low-level programming languages
like C are more suited to direct memory interaction than Python.
It was possible to use Python, despite its deficiencies, in this project because the heavy
lifting is handled by the PRU. Samples generated by the ADC are stored in shared memory
accessible from the CPU by the PRU, which ensures that latency between sample acquisition and storage in memory is a fixed, known value. Texas Instruments, the designer
of the AM335x processor onboard the BeagleBone Black, provides a library for sending
assembly code to and monitoring interrupts from the PRU written in C, another obstacle.
Fortunately, PyPRUSS, a community project focused on 3D printing with the Black [21],
18
incorporates a Python wrapper for the C library, enabling its functions to be called within
Python code.
4.2.2
Signal Acquisition
Acquisition of data with the BeagleBone Black’s onboard ADC can either be handled by the
CPU or by the PRU. The host CPU runs Debian, a variant of linux, which is not a realtime
operating system. Any processes interacting with the ADC are scheduled at the mercy of
the operating system, which is not a desirable characteristic in an application where precise
timing is of the utmost importance. Therefore, the PRU was used to communicate with the
ADC subsystem. The PRU is controlled with assembly code loaded by the CPU. Coding
in assembly presents a few challenges; operations involve direct manipulation of registers
and memory locations which is time consuming and potentially catastrophic as the PRU
has access to the memory and storage used by the operating system. Ultimately, the tight
timing constraints imposed by the design requirements necessitate the use of the PRU
despite the faults of coding in assembly.
19
Chapter 5
Preliminary Proposed Design
5.1
Hardware Design
5.1.1
Voltage Step Down
Connection to the wall will be made with a NEMA 5-15 compliant connector, the common
standard for residential outlets [17]. The ADC input range of the BeagleBone Black is 0
to 1.8v [22], but going directly to this range would require a transformer ratio of 66.7:1
or greater, something that is not commonly found in 120v transformer offerings. A 14:1
transformer was chosen instead because of its availability and price. This transformer
yields a 8.57v peak-to-peak output when connected to the 120v wall outlet. The voltage
is further reduced into the ADC range by attenuation in the low pass filtering circuit.
Input Protection
Although 120v is not as dangerous as the high voltage that commercial PMUs measure, it
is important that this device have safety features to protect both the low voltage electronics
and the end user. A 0.5A fast-acting fuse was placed between the hot wire of the plug
and the device as the power supply for chosen for the BeagleBone Black has a maximum
current draw of 0.3A. The digital (DGND), analog (GND ADC), and earth grounds as
well as the neutral wire are all tied together to ensure that there are no ground loops
that might affect measurement, but also to ensure that any shorts or loose wires will not
generate unexpected voltages throughout the circuit.
DC Bias
It is also necessary to add a DC bias to the AC signal in order to fall within the 0 to
1.8v range. This is accomplished by a simple DC bias circuit shown in Figure 5.1. The
resistor connected from the input terminal to ground is important because it ensures that
the input is at 0v before a connection is made, protecting the measurement source from any
20
100k
R1
VDD_ADC
R2
100k
OUTPUT
10k
R3
INPUT
Figure 5.1: Schematic of DC bias circuit.
unexpected charge on the capacitor. The DC bias voltage will be generated by a voltage
divider between VDD ADC and ADC GND with equal value resistors to ensure the mean
of AC signal falls exactly in the middle of the input range.
5.1.2
Anti-Aliasing Filter
PMUs typically sample at relatively low rates, 3kHz or less, as the nominal frequency of
the power grid is only 60Hz. It is essential to low pass filter the signal before it is sampled
as sampling at such a low rate means there is a much higher chance of aliasing. As gain
reduction is desired, a non-inverting active low-pass filter was chosen. The BeagleBone
Black is a single supply board necessitating a single supply operational amplifier be used
in the filter, specifically the LM358 which both met the specifications and was already
available in the lab. A DC coupled low-pass RC active filter design presented in the LM358
datasheet [23] was used as the basis for the design of this circuit. Resistor and capacitor
values, listed in the circuit schematic in Figure 5.2 were calculated using the equations
provided in the datasheet with a cutoff frequency of 100Hz, gain of 0.2 and quality factor
of 1 as the design parameters. Filters inherently generate a phase difference between the
input and output signals; it is important that this phase shift is measured and accounted
for in the final calibration of the device.
5.1.3
Analog to Digital Conversion
Sampling is handled by the touchscreen controller and analog-to-digital converter subsystem (TS ADC SS). The systems was designed to be used as a digitizer for touch screen
input, but can also operate as a regular ADC when set to general purpose mode. Analog
input can range from 0 to 1.8v and there are 8 channels available on the BeagleBone Black.
However, the 8 channel count is somewhat misleading as there is only one ADC. Channels
21
3
IC2A
1
OUTPUT
LM358N
C4
1uF
R1
2
100k
10k
R4
R2
10k
100k
R3
1uF
C3
INPUT
Figure 5.2: Schematic of anti-aliasing filter. Design adapted from the LM358 datasheet [23].
are multiplexed to the ADC, as shown in Figure 5.3, meaning that channel capture can
only happen sequentially. Multiplexing of channels is controlled by a finite state machine
with sixteen sequence steps. Each step corresponds to the acquisition and storage of data
from one channel as outlined in Figure ??. Two steps will be used to acquire both the
AC voltage waveform and the pulse per second signal from the GPS. The minimum delay
between sampling steps is 15 ADC clock cycles, a value that must be taken into account
in the calibration of the device.
5.1.4
GPS Timing
The Ultimate GPS module from Adafruit is largely self-contained, necessitating only a
few external connections to enable functionality of the chip. An onboard voltage regulator
enables the use of sources from 3.3 to 5v, both of which are available on the pinout of the
BeagleBone Black. 3.3v was chosen for the supply voltage simply because the 5v pin was
already connected to the low pass-filter circuit. Communication between the GPS module
and the Black is handled by the Universal Asynchronous Receiver Transmitter (UART).
National Marine Electronics Association (NMEA) sentences, a standard format for GPS
data, are received from the GPS via UART and used to assign UTC time tags to phase
measurements.
The PPS signal is acquired via the onboard ADC in conjunction with the AC voltage
waveform. This signal serves as the marker for the start of a Discrete Fourier Transform
(DFT) window. The output of VFix, which is pulled low when a strong signal is found,
is connected to a general purpose input output, indicating when the GPS is ready for
measurement to begin.
22
XPPSW
XNPSW
YPPSW
HHV (VDDA
Domain)
SEL_RFP<2:0>
SEL_INP<3:0>
VREFP
VREFN
4
VDDA
2
XPUL
XNUR
YPLL
YNLR
PENIRQ<1:0>
Pen & IRQ
Control
INTREF
(no internal
connection)
PENCTR<1:0>
2
AN0
AN1
AN2
AN3
AN4
AN5
AN6
AN7
AMUX
9:1
VDDA
XPUL
YPLL
(1)
VREFP
INTREF
AMUX
5:1
INT_VREFP
12
INP
ADCOUT<11:0>
EOC
CLK
PD
DIFF_CNTRL
START
ADC
INM
AMUX
9:1
VSSA
(1)
VREFN
VSSA_ADC
AMUX
4:1
AMUX
2:1
XNNSW
YPNSW
YNNSW
4
SEL_INM<3:0>
Blue pins are I/O pads
BIAS_SEL
VREF
M
Internal
Bias
(1)
WPNSW
VDDA_ADC
ADC_IBIAS
VSSA
XNUR
YNLR
(1)
VREFN
2
SEL_RFM<1:0>
REXT_BIAS
(no internal
connection)
Figure 5.3: Block diagram of ADC analog front end operation. Source: [22]
5.2
5.2.1
Signal Processing
Sampling Rate
The sampling rate of ADC acquisitions is controlled both by dividing the ADC clock and
by increasing the delay between measurement steps. Both methods will be implemented to
achieve sampling at an integer multiple of 60Hz, desired to ease the processing requirements
once sampled.
5.2.2
Raw Data Processing
Data from the ADC is stored as a 32 bit hex value. Both the four bit channel ID and the
twelve bit converted value are contained within these 32 bits. Two bitwise shift operations
are used to extract each component and then the values are converted to integers for further
processing.
5.2.3
Synchrophasor Estimation
Synchrophasor estimation will be handled by a basic DFT at the beginning of this project.
Other methods such as IpDFT and Weighted Least Squares are shown to provide higher
accuracy [24], but DFT will allow a proof of concept. The choice of Python as the programming language allows for easy substitution of the phase estimation algorithm.
Each second of raw data was divided into 30 windows and a DFT performed on each to
achieve the desired reporting rate of 30 phasors/second. Once the DFT for each window is
23
IDLE
(apply Idle Step Config)
Update Shadow
StepEnable Reg
StepEnable[N]=1?
No
•
•
•
•
No
Set N=0
Set pen down flag = 1
Set pen override mask = 1
Ignore Pen IRQs
Yes
Is any
SW?
No
*HW event?
Yes
Yes
No
Set preempt
flag =1;
Save N
If HW[N] and
StepEnable[N]
• If preempt flag =1, increment N,
else set N to first SW Stepconfig
• Reset Preempt flag
Incr N
No
If sw[N] and
StepEnable[N]
Yes
Yes
No
Preemption
enabled?
Apply StepConfig [N]
Yes
Increment N
Apply StepConfig [N]
Wait OpenDelay [N]
Wait OpenDelay [N]
Wait SampleDelay [N]
Wait SampleDelay [N]
ADC Conversion
AVG[N]?
ADC Conversion
Yes
(Reset StepEnable[n] if One-Shot[n])
AVG[N]?
Yes
Looped all enabled
HW steps?
No
(Reset StepEnable[n] if One-Shot[n])
No
Yes
Reset pen override mask
•
•
Looped all enabled
SW steps?
Yes
If TS Charge step is enabled, apply TS
Charge StepConfig and OpenDelay
(ignore any pen irq during this step)
If pen down flag = 1 and now pen is up,
then generate PEN_UP interrupt and
reset pen_down_flag
•
Generate END_OF_SEQUENCE int
If preempt flag is 1, restore N, elseset N
to first SW Stepconfig
* HW event can either be Pen-down or input HW event, but not both
Figure 5.4: Flowchart for ADC subsystem step sequencer. Source: [22]
24
completed, it is paired with its corresponding GPS time tag and transmitted via ethernet.
Component
BeagleBone Black
Ultimate GPS
GPS Antenna
5v 2A DC Power Supply
14:1 Power Transformer
LM358 Single Supply Op Amp
Source
Adafruit
Adafruit
Adafruit
Adafruit
DigiKey
DigiKey
Mfr. Part Num.
1876
746
960
276
HM510-ND
LM358NFS-ND
Table 5.1: Bill of Materials
25
Cost
$55.00
$39.95
$12.95
$7.95
$19.82
$0.49
Chapter 6
Final Design
6.1
Hardware Design
6.1.1
Voltage Step Down
Connection to the wall will be made with a NEMA 5-15 compliant connector, the common
standard for residential outlets [17]. The ADC input range of the BeagleBone Black is 0
to 1.8v [22], but going directly to this range would require a transformer ratio of 66.7:1
or greater, something that is not commonly found in 120v transformer offerings. A 14:1
transformer was chosen instead because of its availability and price. This transformer
yields a 8.57v peak-to-peak output when connected to the 120v wall outlet. The voltage
is further reduced into the ADC range by attenuation in the low pass filtering circuit.
Input Protection
Although 120v is not as dangerous as the high voltage that commercial PMUs measure, it
is important that this device have safety features to protect both the low voltage electronics
and the end user. A 0.5A fast-acting fuse was placed between the hot wire of the plug
and the device as the power supply for chosen for the BeagleBone Black has a maximum
current draw of 0.3A. The digital (DGND), analog (GND ADC), and earth grounds as
well as the neutral wire are all tied together to ensure that there are no ground loops
that might affect measurement, but also to ensure that any shorts or loose wires will not
generate unexpected voltages throughout the circuit.
DC Bias
It is also necessary to add a DC bias to the AC signal in order to fall within the 0 to
1.8v range. This is accomplished by a simple DC bias circuit shown in Figure 5.1. The
resistor connected from the input terminal to ground is important because it ensures that
the input is at 0v before a connection is made, protecting the measurement source from any
26
unexpected charge on the capacitor. The DC bias voltage will be generated by a voltage
divider between VDD ADC and ADC GND with equal value resistors to ensure the mean
of AC signal falls exactly in the middle of the input range.
6.1.2
Anti-Aliasing Filter
PMUs typically sample at relatively low rates, 3kHz or less, as the nominal frequency of
the power grid is only 60Hz. It is essential to low pass filter the signal before it is sampled
as sampling at such a low rate means there is a much higher chance of aliasing. As gain
reduction is desired, a non-inverting active low-pass filter was chosen. The BeagleBone
Black is a single supply board necessitating a single supply operational amplifier be used
in the filter, specifically the LM358 which both met the specifications and was already
available in the lab. A DC coupled low-pass RC active filter design presented in the LM358
datasheet [23] was used as the basis for the design of this circuit. Resistor and capacitor
values, listed in the circuit schematic in Figure 5.2 were calculated using the equations
provided in the datasheet with a cutoff frequency of 100Hz, gain of 0.2 and quality factor
of 1 as the design parameters. Filters inherently generate a phase difference between the
input and output signals; it is important that this phase shift is measured and accounted
for in the final calibration of the device.
6.1.3
Analog to Digital Conversion
Sampling is handled by the touchscreen controller and analog-to-digital converter subsystem (TS ADC SS). The systems was designed to be used as a digitizer for touch screen
input, but can also operate as a regular ADC when set to general purpose mode. Analog
input can range from 0 to 1.8v and there are 8 channels available on the BeagleBone Black.
However, the 8 channel count is somewhat misleading as there is only one ADC. Channels
are multiplexed to the ADC, as shown in Figure 5.3, meaning that channel capture can
only happen sequentially. Multiplexing of channels is controlled by a finite state machine
with sixteen sequence steps. Each step corresponds to the acquisition and storage of data
from one channel as outlined in Figure ??. Two steps will be used to acquire both the
AC voltage waveform and the pulse per second signal from the GPS. The minimum delay
between sampling steps is 15 ADC clock cycles, a value that must be taken into account
in the calibration of the device.
Values from the ADC are stored in a FIFO buffer as shown in Figure 6.1. Samples are
retrieved from this buffer by the PRU via the code shown in Appendix D. They are moved
into shared memory, accessible from the CPU via a two part linear buffer. When the first
segment of this buffer is full, an interrupt is generated, signaling the CPU to read the data
from memory and store it within a Python array.
27
L4Wakeup
Interconnect
MPU Subsystem,
PRU-ICSS,
WakeM3
DMA
SLV
L3Slow
Interconnect
TSC_ADC Subsystem
adc_clk
OCP2VBUS
Bridge
pd_wkup_adc_fclk
MMA
SLV
PRCM
OCP2VBUS
Bridge
CLK_M_OSC
M
S
SCR
S
M
FIFO1
64x16-bit
FIFO0
64x16-bit
AFE
TSC_ADC
Pads
ADC
AN[7:0]
S
gen_intr
IPG
Sequencer
FSM
Figure 6.1: Block diagram for ADC sample acquisition and storage. Source: [22]
6.1.4
GPS Timing
The Ultimate GPS module from Adafruit is largely self-contained, necessitating only a
few external connections to enable functionality of the chip. An onboard voltage regulator
enables the use of sources from 3.3 to 5v, both of which are available on the pinout of the
BeagleBone Black. 3.3v was chosen for the supply voltage simply because the 5v pin was
already connected to the low pass-filter circuit. Communication between the GPS module
and the Black is handled by the Universal Asynchronous Receiver Transmitter (UART).
National Marine Electronics Association (NMEA) sentences, a standard format for GPS
data, are received from the GPS via UART and used to assign UTC time tags to phase
measurements.
The PPS signal was acquired via the onboard ADC in conjunction with the AC voltage
waveform. The signal is a pulse width modulation signal with a frequency of 1Hz and
a magnitude of 3.3v. A simple voltage divider was used to divide this signal in half to
fit the 1.8v maximum on the ADC inputs. This signal serves as the marker for the start
of a Discrete Fourier Transform (DFT) window. The output of ”VFix”, which is pulled
low when a strong signal is found [19], is connected to a general purpose input output,
indicating when the GPS is ready for measurement to begin.
6.2
6.2.1
Signal Processing
Sampling Rate
The sampling rate of ADC acquisitions is controlled both by dividing the ADC clock and
by increasing the delay between measurement steps. Both methods will be implemented to
achieve sampling at an integer multiple of 60Hz, desired to ease the processing requirements
once sampled.
28
6.2.2
Raw Data Processing
Data from the ADC is stored as a 32 bit hex value. Both the four bit channel ID and the
twelve bit converted value are contained within these 32 bits. Two bitwise shift operations
are used to extract each component and then the values are converted to integers for further
processing.
6.2.3
Synchrophasor Estimation
Synchrophasor estimation will be handled by a basic DFT at the beginning of this project.
Other methods such as IpDFT and Weighted Least Squares are shown to provide higher
accuracy [24], but DFT will allow a proof of concept. The choice of Python as the programming language allows for easy substitution of the phase estimation algorithm.
Each second of raw data was divided into 30 windows and a DFT performed on each
to achieve the desired reporting rate of 30 phasors/second.
29
Chapter 7
Results
There currently exists an issue in the code with the way interrupts are generated by the
PRU and handled by the CPU when the two part buffer reaches its capacity. As such, only
one buffer’s worth of data can be captured and processed at a time. Repeatedly executing
the capture process allows the user to overcome this by repeatedly executing the capture
operation.
Figure 7.1 and 7.2 show the change in phase and frequency over one second of time for
the measured data.
7.1
Evaluation Plan
Though the device is not fully functional yet, the following evaluation plan has been devised
for the device once the coding issues have been resolved.
7.1.1
Timing Accuracy
Acquiring a highly accurate time source, such as an atomic clock, to test the accuracy of
the timing circuit is impractical, due to the cost of such devices. However an indirect test
can be performed to analyze the stability of the timing circuit. Measuring the period of
the pulse per second signal provided by the timing source over sixty minutes will give a
good indication of the short term stability of the time source and local oscillator.
7.1.2
Measurement
The reference conditions for each testing parameter, as specified in section 5.5.4 of IEEE
C37.118.1, are listed below. Each parameter should remain constant, unless it is currently
being tested.
• Voltage at nominal
30
Figure 7.1: Plot of phase vs. time for one second of measured data.
Figure 7.2: Plot of frequency vs. time for one second of measured data.
31
• Current at nominal
• Frequency at nominal
• Voltage, current, phase, and frequency constant
• All interfering signals < 0.2% of the nominal frequency (60Hz)
• Temperature 23◦ ± 3◦ C
• Humidity > 90%
Synchrophasor Estimation
Synchrophasor estimation should be tested by calculating the TVE as defined in (3.1) for
each testing condition listed in Table 3 of [11]. The TVE should remain below 1% in all
testing conditions. The signal generator and oscilloscope must have a testing uncertainty
ratio of 4, i.e. for desired TVE of 1%, the devices should be able to measure TVE within
±0.25%.
7.1.3
Communication
Confirmation of the proper communication protocol specified in IEEE C37.118.2 will be
verified using the PMU Connection Tester software package provided by the Grid Protection Alliance1 . If necessary, the Wireshark filter for IEEE C37.118 communication may be
used to examine the raw data frames2 .
1
2
The software can be found at http://pmuconnectiontester.codeplex.com
A more detailed summary of the filter can be found at http://www.wireshark.org/docs/dfref/s/synphasor.html
32
Chapter 8
Production Schedule
For the most part, time estimates proposed at the beginning of the project and reproduced
in 8.1 were accurate. The order of the weeks was shuffled around in order to prioritize the
selection of more important components over the design of voltage step down and filtering
circuits.
33
Week
1
2
3
4
5
6-7
8
9
10
Objective
Design voltage step down and device power circuit
Design anti-aliasing filter, select sampling frequency and A/D converter
Research on and selection of time code source
Design timing and synchronization circuit
Select phase estimation algorithm
Design synchrophasor estimator
Design internet interface
Construction and testing of voltage step down and device power circuit
Construction of anti-aliasing filter
Table 8.1: Proposed weekly schedule for Fall 2014
34
Chapter 9
Cost analysis
The final cost for this project came in well below the initial proposed budget, reproduced
in Table 9.1. A number of factors contributed to this, most notably the identification of
a sufficiently accurate GPS module available for 1/10 the cost of timing specific offerings.
Replacement of the proposed FPGA development board with a single-board computer also
enabled a large cost reduction. The change in computing platform was based on the need
for remote management access, something that would have been impossible to reliably
implement on an FPGA.
A transformer and the LM358 chip were obtained from previous projects within the
department. The transformer also included a NEMA 15-5 plug. Components obtained for
free are indicated in parentheses in the cost summary shown in Table 9.2.
Construction of this residential phasor measurement unit came in well below the $14,000
estimated cost of commercial offerings [3]. Achieving such a substantial cost reduction
is made possible by the fact that this device takes measurements at low voltage levels,
removing a large number of insulation and protection requirements for high voltage PMUs.
Commercial devices are more accurate than this residential PMU, but the low cost of
this device will enable installation in more locations, offsetting accuracy shortfalls with an
increased volume of data.
35
Component
Project Enclosure
NEMA 5-15P Connector
Transformer - 12:1
AC/DC Converter
GPS Time Code Receiver
FPGA - Altera DE2
Total Projected Cost
Quantity
1
1
1
1
1
1
Cost
$20
$16
$20
$21
$400
$269
Subtotal
$20
$16
$20
$21
$400
$269
$746
Table 9.1: Proposed budget for PMU components
Component
BeagleBone Black
Ultimate GPS
GPS Antenna
5v 2A DC Power Supply
14:1 Power Transformer
NEMA 5-15P Connector
LM358 Single Supply Op Amp
Total Cost
Quantity
1
1
1
1
1
1
1
Table 9.2: Cost of PMU components
36
Cost
$55.00
$39.95
$12.95
$7.95
$(19.82)
$(15.98)
$(0.49)
$142.16
Chapter 10
User Manual
10.1
Setup
Setup of the residential PMU is designed to be quick and simple. Device power and
measurement input are both drawn from the same connector, a NEMA 15-5 plug that
is compatible with residential outlets. The plug is simply inserted into the wall outlet
to provide power and the AC voltage to be measured. Transmission of measured data
and device management is handled via ethernet; the device must be connected to the
same network as the server receiving data. The GPS antenna is connected to the external
antenna connector mounted on the device and should be placed as close to a window or
outside wall as possible. It may be necessary to experiment with antenna positioning; the
LED labelled ”Fix” on the GPS module will cease flashing when a strong enough signal is
obtained to begin measurements.
10.1.1
Calibration
In the current iteration of the device, a 10kΩ potentiometer configured as a voltage divider
is connected between the secondary side of the transformer and the input of the low pass
filter. This allows the magnitude of the incoming signal to be adjusted manually to span
the entire 0 to 1.8v range of the ADC, thus maximizing measurement resolution. Once
the potentiometer is set, the magnitude and phase difference between the 120v wall outlet
and signal at the ADC input pin on the BeagleBone Black should be measured with an
oscilloscope or other suitable tool. These values need to be entered into the Calibration
section of the Python code, shown in Appendix E. Calibration should be performed on an
annual basis according to the standards set forth in IEEE C37.119.1 [25].
37
10.2
Operation
Once connected to power, the device will boot up and automatically begin to execute the
Python code. After a strong GPS signal is obtained, indicated when the Fix light on the
GPS is extinguished, the device will begin collecting and processing data. The incoming
data stream can be viewed using OpenPDC, an open source PDC provided by the Grid
Protection Alliance [26]. As of March 6, 2015 the software is now compatible with Mac OS
X and Linux operating systems in addition to Windows Server.
When powering down the device, either the command ”sudo shutdown -h now” should
be issued via a SSH login or the power button on the BeagleBone Black should be pressed.
These shutdown methods are mandated by the manufacturer in order to prevent damage
to the device or loss of data.
10.3
Maintenance
SSH access is enabled on the BeagleBone Black, allowing remote login to update or modify
code on the device. IP address configuration is currently handled by DHCP so any network
changes may alter the IP address. Though an inconvenience, this choice was a necessity as
the device may be connected to a variety of different networks with different address ranges.
Connecting a monitor and keyboard to the device and issuing the command ”ifconfig” from
the command line is the most reliable way to determine the IP address once the device is
installed.
The revisions of all hardware and software components used by the device are listed in
Table 10.1. Monthly software updates should be issued using the command ”sudo apt-get
update” to update package lists from the Debian repository and ”sudo apt-get upgrade”
to perform the update. Proper backup practices should be followed before these updates
to prevent data or functionality loss. It is not recommended to update the Linux kernel,
a process that requires the internal memory of the BeagleBone Black to be flashed with
a new image, without thorough testing as subsequent versions make major changes to the
way in which the PRU is initialized and accessed by the CPU.
38
Component
Hardware
BeagleBone Black
Ultimate GPS Module
Software
Linux Kernel
Debian
Python
AM335x Driver
PyPRUSS
Revision
C
3
3.8.13-bone47
7.8
2.7.3
Commit e4d44bd on GitHub
Commit 6feef2b on Bitbucket
Table 10.1: Component and software versions used in this project.
39
Chapter 11
Conclusion
The goal of this project is to design an inexpensive residential phasor measurement unit.
Designing an inexpensive PMU will allow the proliferation of real-time, networked monitoring devices across the grid. Doing so increases the resolution of data available to control
room operators and regional administrators. This will allow for the design of automatic
control systems that can react faster than control room operators to counteract and confine
disturbances on the grid.
The device will be entirely self contained, with the only external connections to the
internet and the residential wall outlet. There should be no interaction between the resident
of the house and the device, initial installation will be done by the power company. The
device will be designed in compliance with the IEEE Std. C37.118, in order to ensure
compatibility with existing phasor data concentrators and visualization software.
Having an inexpensive PMU on the market opens up many possibilities for future
development and supports some of the objectives of the smart grid. In particular, it will
support increased use of distributed generation. Distributed generation allows for the use
of small, sustainable sources to supplement or be the sole power source of small areas. This
capability is key to the spread of sustainable power.
40
Appendix A
Preliminary Circuit Diagram
41
42
Figure A.1: Circuit schematic of preliminary proposed design.
Appendix B
Final Circuit Diagram
43
J1
3
2
1
TR1
1
14:1
4
PRI
FUSE
0.5A
7
6
C2
R3
213598-2
SEC
VDD_ADC
2
3
C1
R1
LM358N
1
IC2A
GND
VDD_3V3EXP
VDD_5V
SYS_5V
PWR_BUT
UART4_RXD
UART4_TXD
GPIO1_16
I2C1_SCL
I2C2_SCL
UART2_TXD
GPIO1_17
GPIO3_21
GPIO3_19
SPI1_DO
SPI1_SCLK
AIN4
AIN6
AIN2
AIN0
CLKOUT2
GND
GND
BEAGLEBONE_OUTLINE
P9
GND
GPIO1_6
GPIO1_2
TIMER4
TIMER5
GPIO1_13
EHRPWM2B
GPIO1_15
GPIO0_27
EHRPWM2A
GPIO1_30
GPIO1_4
GPIO1_0
GPIO2_22
GPIO2_23
UART5_CTSN
UART4_RTSN
UART4_CTSN
UART5_TXD
GPIO2_12
GPIO2_10
GPIO2_8
GPIO2_6
GND
VDD_3V3EXP
VDD_5V
SYS_5V
SYS_RESETN
GPIO1_28
EHRPWM1A
EHRPWM1B
I2C1_SDA
I2C2_SDA
UART2_RXD
UART1_TXD
UART1_RXD
SPI1_CS0
SPI1_DI
VDD_ADC
GNDA_ADC
AIN5
AIN3
AIN1
GPIO0_7
GND
GND
GND
GPIO1_7
GPIO1_3
TIMER7
TIMER6
GPIO1_12
GPIO0_26
GPIO1_14
GPIO2_1
GPIO1_31
GPIO1_5
GPIO1_1
GPIO1_29
GPIO2_24
GPIO2_25
UART5_RTSN
UART3_RTSN
UART3_CTSN
UART5_RXD
GPIO2_13
GPIO2_11
GPIO2_9
GPIO2_7
Figure B.1: Circuit schematic of finally design.
R2
R5
R4
U$1 Beaglebone Black Rev. C
P8
VDD_ADC
U$2
Backup Battery
P$1
P$2
P$3
P$4
P$5
P$6
P$7
P$8
P$9
P$10
U1
NC
GND
NC
NC
NC
NC
RTCM
1PPS
GND
EX_ANT
3.0-4.3V
2.0-4.3V
VCC
NRESET
GND
VBACKUP
3D-FIX
NC
NC
GND
TX
RX
VCC:
VBACKUP:
FGPMMOPA6H GPS
MTK MT3339 Chipset
P$20
P$19
P$18
P$17
P$16
P$15
P$14
P$13
P$12
P$11
R7
R6
44
ANT1
Appendix C
Texas Instruments Header
N.B. Additions to the example header provided by Texas Instruments are marked with the
title “Addition.”
1
2
3
4
5
6
7
8
9
10
11
12
13
14
15
16
17
18
19
20
21
22
23
24
25
26
27
28
29
30
31
//
//
//
//
//
//
//
//
//
//
∗∗∗∗∗∗∗∗∗∗∗∗∗∗∗∗∗∗∗∗∗∗∗∗∗∗∗∗∗∗∗∗∗∗∗∗∗∗∗∗∗∗∗∗∗∗∗∗∗∗∗∗∗∗∗∗∗∗∗∗∗∗∗∗∗∗∗∗∗/
file :
PRU memAccess DDR PRUsharedRAM . hp
brief :
PRU memAccess DDR PRUsharedRAM assembly c o n s t a n t s .
(C) C o p y ri g h t 2 0 1 2 , Texas I n s t r u m e n t s , I n c
author
M. Watkins
∗∗∗∗∗∗∗∗∗∗∗∗∗∗∗∗∗∗∗∗∗∗∗∗∗∗∗∗∗∗∗∗∗∗∗∗∗∗∗∗∗∗∗∗∗∗∗∗∗∗∗∗∗∗∗∗∗∗∗∗∗∗∗∗∗∗∗∗∗/
#i f n d e f
#d e f i n e
PRU memAccess DDR PRUsharedRAM HP
PRU memAccess DDR PRUsharedRAM HP
// ∗ ∗ ∗ ∗∗∗∗∗ ∗∗∗∗∗ ∗∗∗∗∗ ∗∗∗∗∗ ∗∗∗∗∗ ∗∗∗∗∗ ∗∗∗∗∗ ∗
// ∗
G l o b a l Macro d e f i n i t i o n s
∗
// ∗ ∗ ∗ ∗∗∗∗∗ ∗∗∗∗∗ ∗∗∗∗∗ ∗∗∗∗∗ ∗∗∗∗∗ ∗∗∗∗∗ ∗∗∗∗∗ ∗
// R e f e r to t h i s mapping in t h e
#d e f i n e PRU0 PRU1 INTERRUPT
#d e f i n e PRU1 PRU0 INTERRUPT
#d e f i n e PRU0 ARM INTERRUPT
#d e f i n e PRU1 ARM INTERRUPT
#d e f i n e ARM PRU0 INTERRUPT
#d e f i n e ARM PRU1 INTERRUPT
#d e f i n e
#d e f i n e
#d e f i n e
#d e f i n e
f i l e − \ prussdrv \ include \ pruss intc mapping . h
17
18
19
20
21
22
CONST PRUCFG
C4
CONST PRUDRAM
C24
CONST PRUSHAREDRAM
C28
CONST DDR
C31
45
32
33
34
35
36
37
38
39
40
41
42
43
44
45
46
47
48
49
50
51
52
53
54
55
56
57
58
59
60
61
62
63
64
65
66
67
68
69
70
71
72
73
74
75
76
77
78
79
80
81
// ∗∗∗∗∗∗∗∗∗∗∗∗∗∗∗∗∗∗∗∗
// A d d i t i o n − J . Vick
// ∗∗∗∗∗∗∗∗∗∗∗∗∗∗∗∗∗∗∗∗
#d e f i n e PRUSHAREDRAM 0 x00010000 //12kB
#d e f i n e PRUDRAM1 0 x00000000
#d e f i n e PRUDRAM2 0 x00002000
#d e f i n e PRUDRAMSIZE 8192
#d e f i n e PRUSHAREDRAMSIZE 12288
// ∗∗∗∗∗∗∗∗∗∗∗∗∗∗
// End a d d i t i o n
// ∗∗∗∗∗∗∗∗∗∗∗∗∗∗
// Address f o r t h e Constant t a b l e Block Index R e g i s t e r (CTBIR)
#d e f i n e CTBIR
0 x22020
// Address f o r t h e Constant t a b l e Programmable P o i n t e r R e g i s t e r 0 (CTPPR 0)
#d e f i n e CTPPR 0
0 x22028
// Address f o r t h e Constant t a b l e Programmable P o i n t e r R e g i s t e r 1 (CTPPR 1)
#d e f i n e CTPPR 1
0 x2202C
. macro LD32
. mparam dst , s r c
LBBO
dst , s r c ,#0 x00 , 4
. endm
. macro LD16
. mparam dst , s r c
LBBO
dst , s r c ,#0 x00 , 2
. endm
. macro LD8
. mparam dst , s r c
LBBO
dst , s r c ,#0 x00 , 1
. endm
. macro ST32
. mparam s r c , d s t
SBBO
s r c , dst ,#0 x00 , 4
. endm
. macro ST16
. mparam s r c , d s t
SBBO
s r c , dst ,#0 x00 , 2
. endm
46
82
83
84
85
86
87
88
89
90
91
92
93
94
95
96
97
98
99
100
101
102
103
104
105
106
107
108
109
110
111
112
113
114
115
116
117
118
119
120
121
122
. macro ST8
. mparam s r c , d s t
SBBO
s r c , dst ,#0 x00 , 1
. endm
// ∗∗∗∗∗∗∗∗∗∗∗∗∗∗∗∗∗∗∗∗∗
// A d d i t i o n s − J . Vick
// ∗∗∗∗∗∗∗∗∗∗∗∗∗∗∗∗∗∗∗∗∗
// f i l l t h e e n t i r e DRAM with v a l (2−byte−v a l u e )
. macro FILLSHAREDRAM
. mparam v a l
MOV r3 ,PRUSHAREDRAMSIZE
FILLSHAREDRAMREPEAT2:
SUB r3 , r3 , 2
SBCO v a l ,CONST PRUSHAREDRAM, r3 , 2
QBNE FILLSHAREDRAMREPEAT2, r3 , 0
. endm
// ∗∗∗∗∗∗∗∗∗∗∗∗∗∗
// End a d d i t i o n
// ∗∗∗∗∗∗∗∗∗∗∗∗∗∗
// ∗ ∗ ∗ ∗∗∗∗∗ ∗∗∗∗∗ ∗∗∗∗∗ ∗∗∗∗∗ ∗∗∗∗∗ ∗∗∗∗∗ ∗∗∗∗∗ ∗
// ∗
Global Structure D e f i n i t i o n s
∗
// ∗ ∗ ∗ ∗∗∗∗∗ ∗∗∗∗∗ ∗∗∗∗∗ ∗∗∗∗∗ ∗∗∗∗∗ ∗∗∗∗∗ ∗∗∗∗∗ ∗
. s t r u c t Global
. u32 r e g P o i n t e r
. u32 r e g V a l
. ends
// ∗ ∗ ∗ ∗∗∗∗∗ ∗∗∗∗∗ ∗∗∗∗∗ ∗∗∗∗∗ ∗∗∗∗∗ ∗∗∗∗∗ ∗∗∗∗∗ ∗
// ∗
G l o b a l R e g i s t e r Assignments
∗
// ∗ ∗ ∗ ∗∗∗∗∗ ∗∗∗∗∗ ∗∗∗∗∗ ∗∗∗∗∗ ∗∗∗∗∗ ∗∗∗∗∗ ∗∗∗∗∗ ∗
. a s s i g n Global , r2 , ∗ , g l o b a l
#e n d i f // PRU memAccess DDR PRUsharedRAM
47
Appendix D
PRU Assembly Code
1
2
3
4
5
6
7
8
9
10
11
12
13
14
15
16
17
18
19
20
21
22
23
24
25
26
27
28
. o r i g i n 0 // o f f s e t of t h e s t a r t of t h e code in PRU memory
. e n t r y p o i n t START // program e n t r y p o i n t , used by debugger o n l y
#i n c l u d e ” ADCCollector . hp”
// REGISTER ADDRESS DEFINITIONS
#d e f i n e ADC CTRL
0x44E0D040
#d e f i n e SYSCONFIG
0x44E0D010
#d e f i n e ADCSTAT
0x44E0D044
#d e f i n e ADC CLKDIV
0x44E0D04C
#d e f i n e IRQENABLE SET
0x44E0D02C
#d e f i n e IRQENABLE CLR
0x44E0D030
#d e f i n e IRQSTATUS
0x44E0D028
#d e f i n e FIFO0COUNT
0x44E0D0E4
#d e f i n e FIFO0THRESHOLD 0x44E0D0E8
#d e f i n e
#d e f i n e
#d e f i n e
#d e f i n e
#d e f i n e
STEPENABLE
STEPCONFIG1
STEPDELAY1
STEPCONFIG2
STEPDELAY2
0x44E0D054
0x44E0D064
0x44E0D068
0x44E0D06C
0x44E0D070
// Data l o c a t i o n s
#d e f i n e FIFO0DATA 0x44E0D100
// V a r i a b l e d e f i n i t i o n s
#d e f i n e BUFF SIZE 0x0000FA0 // T o t a l b u f f s i z e : 4 kbyte ( Each b u f f e r has
2 kbyte : 500 p i e c e of data )
29 #d e f i n e HALF SIZE BUFF SIZE / 2
30 #d e f i n e FIFOTHRESHOLD 0 x00000031 // v a l u e −1
31 #d e f i n e FIFOTHRESHOLDNUM FIFOTHRESHOLD+1
32
33 // ########################
48
34
35
36
37
38
39
40
41
42
43
44
//
MACRO DEFINITIONS
// ########################
. macro FIFOWAIT
FIFO :
LBBO r3 , r13 , 0 , 4
QBBC FIFO , r 3 . t 2
. endm
. macro READADC
// I n i t i a l i z e b u f f e r s t a t u s ( 0 : empty , 1 : f i r s t b u f f e r i s ready , 2 :
s e c o n d b u f f e r i s ready )
45
MOV r2 , 0 x0
46
SBCO r2 , CONST PRUSHAREDRAM, 0 , 4
47
MOV r7 , HALF SIZE
48
49
MOV r12 , FIFO0DATA
50
MOV r10 , FIFO0COUNT
51
MOV r13 , IRQSTATUS
52
53
MOV r5 , 0 // Shared RAM a d d r e s s of ADC Sa vin g p o s i t i o n
54
MOV r6 , BUFF SIZE // Counting v a r i a b l e
55
QBA READ
56
57
INITV :
58
MOV r5 , 0 // Shared RAM a d d r e s s of ADC Sa vin g p o s i t i o n
59
MOV r6 , BUFF SIZE // Counting v a r i a b l e
60
//QBNE EMPTYFIFO, r14 , 0
61
QBA READ
62
63
READ:
64
MOV r3 , 0 x0000000F
65
SBBO r3 , r13 , 0 , 1
66
67
FIFOWAIT
68
69
MOV r14 , FIFOTHRESHOLDNUM
70
EMPTYFIFO:
71
LBBO r3 , r12 , 0 , 3
72
ADD r5 , r5 , 4
73
SBCO r3 , CONST PRUSHAREDRAM, r5 , 3
74
75
SUB r14 , r14 , 1
76
SUB r6 , r6 , 4
77
QBEQ CHBUFFSTATUS1, r6 , r 7 // I f f i r s t b u f f e r i s ready
78
QBEQ CHBUFFSTATUS2, r6 , 0 // I f s e c o n d b u f f e r i s ready
79
80
QBNE EMPTYFIFO, r14 , 0
81
82
QBA READ
49
83
84
85
86
87
88
89
90
91
92
93
94
95
96
97
98
99
100
101
102
103
104
105
106
107
108
109
110
111
112
113
114
115
116
117
118
119
120
121
122
123
124
125
126
127
128
129
130
131
132
// Change b u f f e r s t a t u s to 1
CHBUFFSTATUS1:
MOV r3 , 0 x00000001
SBCO r3 , CONST PRUSHAREDRAM, 0 , 4
//QBNE EMPTYFIFO, r14 , 0
MOV r 3 1 . b0 , PRU0 ARM INTERRUPT+16
QBA READ
// Change b u f f e r s t a t u s to 2
CHBUFFSTATUS2:
MOV r3 , 0 x00000002
SBCO r3 , CONST PRUSHAREDRAM, 0 , 4
MOV r 3 1 . b0 , PRU0 ARM INTERRUPT+16
QBA INITV
// Send e v e n t to h o s t program
END:
MOV r 3 1 . b0 , PRU0 ARM INTERRUPT+16
HALT
. endm
// ####################
//
I n i t i a l i z e ADC
// ####################
START:
// Enable OCP master p o r t
LBCO r0 , CONST PRUCFG, 4 , 4
CLR r0 , r0 , 4
SBCO r0 , CONST PRUCFG, 4 , 4
//C28 w i l l p o i n t to 0 x00012000 (PRU s h a r e d RAM)
MOV r0 , 0 x00000120
MOV r1 , CTPPR 0
ST32 r0 , r 1
//Reset SYSConfig R e g i s t e r to 0
MOV r2 , 0x44E0D010 // l o a d r e g i s t e r a d d r e s s
MOV r3 , 0 x00000000
SBBO r3 , r2 , 0 , 4
// set r e g i s t e r
// Wait f o r ADC to be i d l e
AdcIdle :
MOV r2 , 0x44E0D044 // l o a d r e g i s t e r a d d r e s s
QBBS AdcIdle , r2 , 5
//Write e n a b l e s t e p s , d i s a b l e ADC
MOV r2 , ADC CTRL
MOV r3 , 0 x00000004
SBBO r3 , r2 , 0 , 4
50
133
134
135
136
137
138
139
140
141
142
143
144
145
146
147
148
149
150
151
152
153
154
155
156
157
158
159
160
161
162
163
164
165
166
167
168
169
170
171
172
173
174
175
176
177
178
179
180
181
182
// Set ADC CLKDIV
MOV r2 , ADC CLKDIV
MOV r3 , 0 x0000031F // v a l u e −1 399 0x18F
SBBO r3 , r2 , 0 , 4
MOV r0 , 0
FILLSHAREDRAM r 0
CLEARFIFO :
MOV r2 , FIFO0DATA
LBBO r3 , r2 , 0 , 4
MOV r2 , FIFO0COUNT
LBBO r3 , r2 , 0 , 4
QBNE CLEARFIFO, r3 , 0
// C l e a r any r e s i d u a l i n t e r r u p t s
MOV r2 , IRQSTATUS
MOV r3 , 0 x000007FF
SBBO r3 , r2 , 0 , 4
// D i s a b l e a l l i n t e r r u p t s
MOV r2 , IRQENABLE CLR
MOV r3 , 0 x000007FF
SBBO r3 , r2 , 0 , 4
// Enable FIFO0 i n t e r r u p t in INTENABLE SET
MOV r2 , IRQENABLE SET
MOV r3 , 0 x00000004
SBBO r3 , r2 , 0 , 4
// Set FIFO0THRESHOLD
MOV r2 , FIFO0THRESHOLD
MOV r3 , FIFOTHRESHOLD // v a l u e −1
SBBO r3 , r2 , 0 , 4
//STEPCONFIG1
MOV r2 , STEPCONFIG1
MOV r3 , 0 x00000001 // c o n t i n u o u s mode
SBBO r3 , r2 , 0 , 4
//STEPDELAY1
MOV r2 , STEPDELAY1
MOV r3 , 0 x0000000E // v a l u e −1
SBBO r3 , r2 , 0 , 4
//STEPCONFIG2
MOV r2 , STEPCONFIG2
MOV r3 , 0 x00280001 // c o n t i n u o u s mode
SBBO r3 , r2 , 0 , 4
51
183
184
185
186
187
188
189
190
191
192
193
194
195
196
197
198
199
200
//STEPDELAY2
MOV r2 , STEPDELAY2
MOV r3 , 0 x0000000F // sample i s v a l u e −1 open i s not
SBBO r3 , r2 , 0 , 4
// Set ADC STEPENABLE
MOV r2 , STEPENABLE
MOV r3 , 0 x00000004
SBBO r3 , r2 , 0 , 4
//Write p r o t e c t s t e p s , e n a b l e ADC
MOV r2 , ADC CTRL
MOV r3 , 0 x00000003
SBBO r3 , r2 , 0 , 4
READADC
52
Appendix E
Python Code
1
2
3
4
5
6
7
8
9
10
11
12
13
14
15
16
17
18
19
20
21
22
23
24
25
26
27
28
29
30
31
32
33
34
import
import
import
import
import
p y p r u s s a s pru
mmap
numpy a s np
struct
time
## MEMORY LOCATIONS ##
PRU ICSS = 0 x4A300000
PRU ICSS LEN = 512∗1024
RAM0 START = 0 x00000000
RAM1 START = 0 x00002000
RAM2 START = 0 x00012000
TOTAL BUFFER LEN = 0x00000FA0
BUFFER LEN = TOTAL BUFFER LEN/2
BUFFER1 START = RAM2 START + 4
BUFFER2 START = BUFFER1 START + BUFFER LEN
## FUNCTION DEFINITIONS ##
def processRawADC ( v a l u e ) :
v a l u e = 0x00000FFF & v a l u e
value = int ( value )
value = ( value ∗1.8) /(2ˆ12)
return v a l u e
def channelID ( v a l u e ) :
v a l u e = 0 x000F0000 & v a l u e
v a l u e = v a l u e >> 16
return v a l u e
## PRU SETUP ##
pru . modprobe ( )
# e n a b l e u i o p r u s s module
53
35
36
37
38
39
40
41
42
43
44
45
46
47
48
49
50
51
52
53
54
55
56
57
58
59
60
61
62
63
64
65
66
67
68
69
70
71
72
73
74
75
76
77
78
79
80
81
82
pru . i n i t ( )
# i n i t i a l i z e PRU
pru . open ( 0 )
# open c o n n e c t i o n t o PRU 0
pru . p r u i n t c i n i t ( ) # c o n f i g u r e i n t e r r u p t h a n d l e r s
pru . e x e c p r o g r a m ( 0 , ” . / o n e s h o t . b i n ” ) # l o a d a s s e m b l y f i l e
counter = 0
f = open ( ” / dev /mem” , ” r+b” )
output = open ( ” . / r e s u l t s . t x t ” , ”w” )
while c o u n t e r < 1 0 :
s t a r t = time . time ( )
pru . w a i t f o r e v e n t ( 0 )
ddr mem = mmap.mmap( f . f i l e n o ( ) , PRU ICSS LEN , o f f s e t=PRU ICSS )
s h a r e d = s t r u c t . unpack ( ’L ’ , ddr mem [RAM2 START:RAM2 START+4])
print s h a r e d [ 0 ]
i f s h a r e d [ 0 ] == 1 :
print ” b u f f e r 1 ”
f o r i in range ( 0 , 5 0 0 ) :
f i f o = s t r u c t . unpack ( ’L ’ ,
ddr mem [ BUFFER2 START+( i ∗ 4 ) : BUFFER2 START+4+( i ∗ 4 ) ] ) [ 0 ]
v a l u e = processRawADC ( f i f o )
channelNum = channelID ( f i f o )
output . w r i t e ( s t r ( channelNum ) + ” , ” + s t r ( v a l u e ) +” \n” )
c o u n t e r += 1
pru . c l e a r e v e n t ( 0 )
e l i f s h a r e d [ 0 ] == 2 :
s h a r e d = s t r u c t . unpack ( ’L ’ , ddr mem [RAM2 START:RAM2 START+4])
print ” b u f f e r 2 ”
f o r i in range ( 0 , 5 0 0 ) :
f i f o = s t r u c t . unpack ( ’L ’ ,
ddr mem [ BUFFER2 START+( i ∗ 4 ) : BUFFER2 START+4+( i ∗ 4 ) ] ) [ 0 ]
v a l u e = processRawADC ( f i f o )
channelNum = channelID ( f i f o )
output . w r i t e ( s t r ( channelNum ) + ” , ” + s t r ( v a l u e ) +” \n” )
c o u n t e r +=1
pru . c l e a r e v e n t ( 0 )
end = time . time ( )
#p r i n t end−s t a r t
f . close ()
output . c l o s e ( )
pru . c l e a r e v e n t ( 0 )
pru . p r u d i s a b l e ( 0 )
pru . e x i t ( )
54
Bibliography
[1] E. Lipton, R. Perez-Pena, and M. Wald, “Overseers missed big picture as failures led
to blackout,” New York Times, September 2003.
[2] NERC, “NERC Final Blackout Reccommendations,” North American Energy Reliability Corporation, Tech. Rep., 2004.
[3] U.S. Department of Energy, “Synchrophasor technologies and their deployment in the
recovery act smart grid programs,” Online, August 2013.
[4] C. P. Steinmetz, “Complex quantities and their use in electrical engineering,” in Proceedings of the International Electrical Congress Held in the City of Chicago, August
21st to 25th, 1893. American Institute of Electrical Engineers, 1894, pp. 33–74.
[5] S. Das and T. Sidhu, “A simple synchrophasor estimation algorithm considering ieee
standard c37.118.1-2011 and protection requirements,” Instrumentation and Measurement, IEEE Transactions on, vol. 62, no. 10, pp. 2704–2715, Oct 2013.
[6] M. Adamiak, B. Kasztenny, and W. Premerlani, “Synchrophasors: definition, measurement, and application,” Proceedings of the 59th Annual Georgia Tech Protective
Relaying, Atlanta, GA, 2005.
[7] K. Martin, D. Hamai, M. Adamiak, S. Anderson, M. Begovic, G. Benmouyal,
G. Brunello, J. Burger, J. Y. Cai, B. Dickerson, V. Gharpure, B. Kennedy, D. Karlsson, A. Phadke, J. Salj, V. Skendzic, J. Sperr, Y. Song, C. Huntley, B. Kasztenny,
and E. Price, “Exploring the ieee standard c37.118-2005 synchrophasors for power
systems,” Power Delivery, IEEE Transactions on, vol. 23, no. 4, pp. 1805–1811, Oct
2008.
[8] K. Kirihara, B. Pinte, and A. Yoon, “Phasor measurement unit,” Online, February
2013.
[9] B. R. Miller, “Concept for next generation phasor measurement: A low-cost, selfcontained, and wireless design,” Master’s thesis, University of Tennessee, 2010.
55
[10] D. Laverty, D. J. Morrow, A. McKinley, and M. Cregan, “Openpmu: Open source
platform for synchrophasor applications and research,” in Power and Energy Society
General Meeting, 2011 IEEE, July 2011, pp. 1–6.
[11] “Ieee standard for synchrophasor measurements for power systems,” IEEE Std
C37.118.1-2011 (Revision of IEEE Std C37.118-2005), pp. 1–61, Dec 2011.
[12] “IEEE standard for synchrophasor measurements for power systems – amendment
1: Modification of selected performance requirements,” IEEE Std C37.118.1a-2014
(Amendment to IEEE Std C37.118.1-2011), pp. 1–25, April 2014.
[13] “IEEE standard for synchrophasor data transfer for power systems,” IEEE Std
C37.118.2-2011 (Revision of IEEE Std C37.118-2005), pp. 1–53, Dec 2011.
[14] B. C. Baker, “Anti-aliasing, analog filters for data acquisition systems,” Microchip
Technology Inc., Tech. Rep., 1999.
[15] “Ieee standard profile for use of ieee 1588 precision time protocol in power system
applications,” IEEE Std C37.238-2011, pp. 1–66, July 2011.
[16] D. Belega, D. Macii, and D. Petri, “Fast synchrophasor estimation by means of
frequency-domain and time-domain algorithms,” Instrumentation and Measurement,
IEEE Transactions on, vol. 63, no. 2, pp. 388–401, Feb 2014.
[17] National Fire Protection Association, National Electrical Code 2011, ser. International
electrical code series. National Fire Protection Association, 2010.
[18] WI125 Specifications, Connor Winfield, 1 2015.
[19] J. Delano, “FGPMMOPA6H gps standalone module data sheet,” Globaltop Technology Inc., Tech. Rep., 2012.
[20] 125 Series Wi125 GPS Receiver, Connor Winfield, 01 2015.
[21] E. Bakken, PyPRUSS, Hipster Circuits, March 2014.
[22] Texas Instruments, “Am335x sitara processors technical reference manual,” Online,
October 2011.
[23] LMx58-N Dual-Operational Amplifiers, Rev. i ed., Texas Instruments, January 2000.
[24] G. Barchi, D. Macii, and D. Petri, “Synchrophasor estimators accuracy: A comparative analysis,” Instrumentation and Measurement, IEEE Transactions on, vol. 62,
no. 5, pp. 963–973, May 2013.
[25] “Ieee standard for synchrophasors for power systems,” IEEE Std C37.118-2005 (Revision of IEEE Std 1344-1995), pp. 01 − −57, 2006.
56
[26] Grid Protection Alliance,
http://openpdc.codeplex.com
“Openpdc,”
57
March
2015.
[Online].
Available: