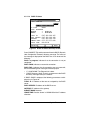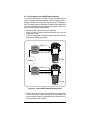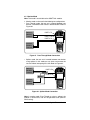
1
MAN-13690-US001 Rev D00
SUNRISE TELECOM
I N C O R P O R A T E D
Gigabit Ethernet Module
Part of the MTT and xDSL
Family of Products
User’s Manual
SSMOD-29M
Sunrise Telecom®... a step ahead
302 Enzo Drive San Jose, CA 95138
Tel: 1-408-363-8000 Fax: 1-408-363-8313
SSMTT-29 and SSMTT-29L
1
� WARNING
Using the supplied equipment in a manner not specified by
Sunrise Telecom may impair the protection provided by the
equipment.
•
•
•
LASER CAUTIONS!
This is a Class 1 Laser product. Avoid looking directly at
the transmitter source.
Use of controls and procedures other than those specified
in this manual may result in exposure to hazardous laser
radiation.
Unterminated optical connectors may emit laser radiation.
Do not view with optical instruments.
CAUTIONS!
• Do not remove or insert the module while the test set is
on. Inserting or removing a module with the power on
may damage the module.
• Do not remove or insert the software cartridge while
the test set is on. Otherwise, damage could occur to the
cartridge.
Copyright 2004
Sunrise Telecom Incorporated.
This device uses software either developed by Sunrise or licensed
by Sunrise from third parties. The software is confidential and
proprietary. The software is protected by copyright and contains
trade secrets of Sunrise or Sunrise’s licensors. The purchaser
of this device agrees that it has received a license solely to use
the software as embedded in the device, and the purchaser is
prohibited from copying, reverse engineering, decompiling, or
disassembling the software.
2
Gigabit Ethernet Module
Gigabit Ethernet Module
Table of Contents
1 Gigabit Ethernet Module ................................................... 5
1.1 Module Panel .................................................................... 5
1.2 Test Set LEDs ................................................................... 7
2 Menus ................................................................................. 8
2.1 Configuration .................................................................. 10
2.2 Loopback ........................................................................12
2.3 BERT/Throughput ........................................................... 17
2.3.1 BERT Configuration ..................................................... 17
2.3.2 Measurements ............................................................. 31
2.3.3 Quick Test ....................................................................40
2.4 Statistics (Monitor Mode) ................................................ 42
2.5 Advanced Features......................................................... 45
2.5.1 IP Features .................................................................. 45
2.5.1.1 IP Connection/Status ................................................ 46
2.5.1.1.1 IP Status ................................................................ 48
2.5.1.1.2 Static IP Status ...................................................... 48
2.5.1.1.3 DHCP IP Status ..................................................... 50
2.5.1.2 PING Test ................................................................. 52
2.5.1.3 Trace Route .............................................................. 54
2.5.1.4 Echo Response ........................................................ 56
2.5.1.5 Throughput Test/Setup.............................................. 57
2.5.1.5.1 Test Configuration .................................................. 57
2.5.1.5.2 Test Results ........................................................... 58
2.5.2 Roundtrip Delay ........................................................... 59
2.5.3 Bandwidth Sweep ........................................................ 62
2.5.4 RFC2544 ..................................................................... 66
2.5.4.1 Select Frame Format ................................................ 66
2.5.4.2 Select Frame Length ................................................ 67
2.5.4.3 Select Test Sequence ............................................... 68
2.5.4.4 Run Test.................................................................... 73
2.5.4.4.1 Throughput Measurement ..................................... 73
2.5.4.4.2 Latency Measurement ........................................... 75
2.6 Optical Power Measurement .......................................... 76
2.7 Measurements Setup ..................................................... 77
2.8 View/Print Results........................................................... 79
2.8.1 Saving a Test ............................................................... 80
2.8.2 Viewing a Stored Test .................................................. 81
2.8.3 Printing a Stored Test .................................................. 81
2.8.4 Deleting a Stored Test ................................................. 81
2.8.5 Locking and Unlocking a Stored Test .......................... 81
2.8.6 Renaming a Stored Test .............................................. 81
SSMTT-29 and SSMTT-29L
3
3 Applications ..................................................................... 82
3.1 Layer 1 Bit Error Rate Test (BERT) ................................. 82
3.2 Layer 2 Bit Error Rate Test (BERT) ................................. 84
3.3 IP Throughput Layer 3 BERT-Indirect Routing ................ 86
3.4 Loopback Mode .............................................................. 88
3.5 Monitor Mode.................................................................. 90
4 Reference ......................................................................... 92
4.1 Gigabit Ethernet Overview ............................................. 92
4.1.1 Gigabit Ethernet Interface............................................ 92
4.1.2 Gigabit Ethernet Frame Format ................................... 93
4.1.2.1 Frame Rate ............................................................... 94
4.2 Handling of Optical Fiber ................................................ 95
4.2.1 Fiber Optic Patch Cord Basics .................................... 95
4.2.2 Fiber Optic Connectors................................................ 96
4.2.3 Cleaning Optical Fiber ................................................. 97
4.2.4 Eye Safety ................................................................... 97
4.2.5 Summary ..................................................................... 97
Index ...................................................................................... 98
4
Gigabit Ethernet Module
1 Gigabit Ethernet Module
The Gigabit Ethernet module provides the necessary tools to
efficiently install, maintain, and troubleshoot Gigabit Ethernet
services. Typical deployment occurs over dark fiber or via a DWDM
optical ring comprising a MAN (Metropolitan Area Network).
The module is available in two versions. The full version (SSMTT29) has two ports (PORT 1 and PORT 2 as shown in Figure 1),
the light version (SSMTT-29L) only has PORT 1.
1.1 Module Panel
�������
�������
��������
��������
����
����
���
������
���
������
��������������������������������������������������������
Figure 1 SSMTT-29 Gig E Connector Panel
The Gigabit Ethernet module can use the following four types of
plug-in transceivers:
•
The SA580-850 dual duplex type LC, 850 nm transceiver:
SA580-850
��
��
•
SUNRISE TELECOM
The SA580-1310 dual duplex type LC, 1310 nm transceiver:
SA580-1310
��
��
•
850 nm
Class 1 Laser Product
SUNRISE TELECOM
1310 nm
Class 1 Laser Product
The SA580-1550 dual duplex type LC, 1550 nm transceiver:
SA580-1550
��
��
SSMTT-29 and SSMTT-29L
SUNRISE TELECOM
1550 nm
Class 1 Laser Product
5
•
The SSMTT-29-RJ 1000BaseT transceiver:
SSMTT-29-RJ
1000Base-T
SUNRISE TELECOM
CAUTION: Use of non Sunrise Telecom transceivers will void the
test set warranty.
To insert a transceiver:
1. Align the transceiver label side with the label side of module.
2. Insert the transceiver into PORT 1 or PORT 2 as desired.
There will be a click sound when the transceiver is properly
seated.
3. When ready for use, remove any protective caps on the interface end of the transceiver.
To remove a transceiver:
1. If you are removing an optical transceiver, install the protective
cap on the interface end of the transceiver.
2. Grip the outer edge of the transceiver and pull it away from
the module.
The recommended cables are shown in Table 1.
Sunrise P/N
Description
SA561
Standard 2 meter LCUPC to SCUPC duplex
multimode patch cord
SA562
Optional 2 meter LCUPC tp SCUPC duplex
single mode patch cord
Table 1 Cables
PORT 1
This port is used for Point-to-Point applications. As indicated in
Figure 1, it has transmit and receive capabilities. The two LEDs
to the left are associated with this port.
PORT 2
This port is for MONITOR mode only. As indicated in Figure 1, it has
transmit and receive capabilities. The two LEDs to the left are associated with this port. It is unavailable with the SSMTT-29L module.
LEDs
• LINK: This represents the status of the line. If the link is up, then
the LED is green. If the link is down, then the LED is off.
• ACT: This represents the activity on the line. It blinks green as
traffic is received by the port. It is off when there is no traffic.
6
Gigabit Ethernet Module
1.2 Test Set LEDs
��������������
�����������������
Figure 2 Test Set LED Panels
The following test set LEDs shown in Figure 2 are used:
MODULE (SSMTT) or xDSL (SSxDSL)
• Green: Test set is in module mode.
SIGNAL (SSMTT) or T1/E1 SIG (SSxDSL)
This LED indicates the status of PORT 1.
• Green: Laser light is being received on PORT 1.
• Red: Laser light is not detected on PORT 1.
FRAME
• Green: Synchronization is acquired on PORT 1.
• Red: Synchronization has not been acquired on PORT 1.
ERRORS
This LED is active whenever the test set is performing a BER, or
an IP Throughput test, or it is in monitor mode.
•
•
Red: Currently detecting a CRC or 8B/10B symbol error.
Blinking Red: Previously detected an error, but that error is no
longer present. Press HISTORY to clear.
PAT SYNC
This LED is active whenever the test set is performing a BER or
an IP Throughput test with a known test pattern.
• Green: Pattern synchronization is achieved.
• Red: Pattern synchronization has been lost.
• Blinking Red: Previously detected pattern loss, but this condition is no longer present. Press HISTORY to clear.
BIT ERR
This LED is active whenever the test set is performing a BER or
an IP Throughput test with a known test pattern.
• Red: Currently detecting bit errors.
• Blinking Red: Previously detected bit errors, but they are no
longer present. Press HISTORY to clear.
SSMTT-29 and SSMTT-29L
7
2 Menus
Press the MODULE key to access the GIG E main menu.
������
���
������������������
�������������
�������
�������������
������������������
�����������������������
���������������������������
�������
�������������
�����������������
���������������������������
�������������������������������
���������������������������
����������
�������
������������������
�������
���������������
������������������
����������
������������
����������
���������������
�������������
�������
����������
����������
��������
��������
�����������
��������������������
������������
���������������
��������
���������
������������
�����������
������������
�����������������
��������
���������������������
���������
������������������
��������
������������������
�������
�������������
������������
���������������������
������������
�����������������
�������
�������������������
������������
�����������
����������
�������������������
������������
���������������
����������
���������������
����������
��������������������
������������
��������
������������
�������
����������
������������������
������������������������
Figure 3 Menu Tree
8
Gigabit Ethernet Module
12:03:43
> P1: LINK UP
>
GIG E MAIN MENU
���������������������
Laser
<
<
CONFIGURATION
LOOPBACK
BERT/THROUGHPUT
ADVANCED FEATURES
OPTICAL POWER MEASUREMENT
MEASUREMENTS SETUP
VIEW/PRINT RESULTS
LAS.OFF
����������������������
�����������������������
�������������������
���������������������
�������������������
����������������������
12:03:43
> P1: LINK UP
>
GIG E MAIN MENU
Laser
<
<
CONFIGURATION
STATISTICS
VIEW/PRINT RESULTS
LAS.OFF
Figure 4 Gig E Main Menu Screens
The GIG E MAIN MENU screens, as shown in Figure 4, contain
an F-key to turn the laser on and off. Push LAS.OFF (F1) to turn
the laser off, push LAS.ON (F1) to turn the laser on. Note the
‘Laser’ banner at the top of the screen-when the laser is on it is
displayed, when off it is not displayed.
SSMTT-29 and SSMTT-29L
9
2.1 Configuration
12:03:43
> P1: LINK-UP
>
CONFIGURATION
OPERATION
START-UP
AUTO-NEGO.
PAUSE
ASYM PAUSE
P-TO-P
:
:
:
:
:
Laser
<
<
P-TO-P
QUICK TEST
ENABLE
ENABLE
ENABLE
MONITOR
Figure 5 Configuration Screen
This screen contains the following:
OPERATION
Options: P-TO-P (F1), MONITOR (F2)
•
•
P-TO-P: Use for Point-to-Point, BERT/Throughput, PING/IP
applications connecting through PORT-1.
MONITOR: Use for monitoring applications. PORT 1 and PORT2 are used. It is unavailable to the SSMTT-29L module.
START-UP
Options: CONFIG (F1), MENU (F2), QUICK (F3)
Determine the default screen or function at start up of the test set.
•
•
•
CONFIG: The CONFIGURATION screen is shown on start up.
MENU: The GIG E MAIN MENU screen is shown on start up.
QUICK: The test set, on start up, goes to the BERT/THROUGHPUT QUICK TEST results screen (see Section 2.3.3).
AUTO-NEGO.
Options: ENABLE (F1), DISABLE (F2), RESTART (F4)
If Auto-Negotiation is enabled, the following two parameters are
advertised to the link partner; PAUSE and ASYM PAUSE.
•
•
•
10
ENABLE: Press to enable auto-negotiation with the link partner.
DISABLE: Press to disable the auto-negotiation process.
RESTART: Press to restart the auto-negotiation process with
the link partner.
Gigabit Ethernet Module
PAUSE
Options: ENABLE (F1), DISABLE (F2), RESTART (F4)
•
•
•
ENABLE: This indicates that the local device intends to stop
upon reception of pause flow control packets.
DISABLE: If disabled, this indicates that the local device does not
intend to stop upon reception of pause flow control packets.
RESTART: Press to restart the auto-negotiation process with
the link partner.
ASYM PAUSE
Options: ENABLE (F1), DISABLE (F2), RESTART (F4)
•
•
•
ENABLE: This indicates independent enable/disable of the
pause flow control receive and transmit.
DISABLE:This indicates symmetric enable/disable of the pause
flow control receive and transmit.
RESTART: Press to restart the auto-negotiation process with
the link partner.
Note: Upon completion of the auto-negotiation information exchange, the arbitration process determines the highest common
mode and enables the appropriate functions.
Local Device
Link Partner
PAUSE
ASYM
PAUSE
PAUSE
ASYM
PAUSE
Local Resolution
Link Partner
Resolution
DIS
EN
-
-
Disable PAUSE
Transmit and Receive
Disable PAUSE
Transmit and Receive
DIS
EN
DIS
-
Disable PAUSE
Transmit and Receive
Disable PAUSE
Transmit and Receive
DIS
EN
EN
DIS
Disable PAUSE
Transmit and Receive
Disable PAUSE
Transmit and Receive
DIS
EN
EN
EN
Enable PAUSE Transmit,
Disable PAUSE Receive
Enable PAUSE Receive,
Disable PAUSE Transmit
EN
DIS
DIS
-
Disable PAUSE
Transmit and Receive
Disable PAUSE
Transmit and Receive
EN
DIS
EN
-
Enable PAUSE
Transmit and Receive
Enable PAUSE
Transmit and Receive
EN
EN
DIS
DIS
Disable PAUSE
Transmit and Receive
Disable PAUSE
Transmit and Receive
EN
EN
DIS
EN
Enable PAUSE Receive,
Disable PAUSE Transmit
Enable PAUSE Transmit,
Disable PAUSE Receive
EN
EN
EN
-
Enable PAUSE
Transmit and Receive
Enable PAUSE
Transmit and Receive
Table 2 Pause Priority Resolution
SSMTT-29 and SSMTT-29L
11
2.2 Loopback
This function enables the test set to automatically loopback
incoming traffic when it is in Point-to-Point mode. This feature is
particularly useful when running a:
•
•
•
•
Roundtrip Delay measuring as described in Section 2.5.2.
BER testing as described in Section 2.3.
Bandwidth Sweep testing as described in Section 2.5.3.
RFC2544 testing as described in Section 2.5.4.
Note: After selecting this function the test set will load it’s Loopback software. During this process the Ethernet link will be closed.
It will reopen at the end of the download.
The traffic loopback feature provides a manual mode or a controller/responder mode.
In manual mode, the test set will start looping incoming traffic as
soon as MANUAL (F1) is pressed.
Configured as a controller, the test set will be responsible for
sending loop up and loop down commands to a remote test set
configured as a responder.
Configured as a responder, the test set will scan incoming traffic
for a loop up command. As soon as loop up command is received,
the test set will switch to loopback mode and it will loop back all
incoming traffic on PORT 1. The incoming traffic will be looped
as follows:
•
•
•
If Layer 1 loop up code is received, the test set will retransmit
the incoming frames without modifying them.
If Layer 2 loop up code is received, the test set will retransmit
the incoming frames and swap the source and destination
MAC address fields.
If Layer 3 loop up code is received, the test set will retransmit
the incoming frames and swap the source and destination
MAC and IP address fields.
The responder will remain in loopback mode until it receives a
loop down frame.
Notes
• There is no standard looping code for Ethernet, the test set
uses Sunrise proprietary loop up and loop down frames.
• Layer 2 and Layer 3 loopback mechanism will loop all incoming
unicast traffic and discard multicast and broadcast traffic.
• Use caution when using loopback mode because some network equipment may not allow the loopback of some unicast
frames.
Figure 6 shows the various loopback configuration screens:
12
Gigabit Ethernet Module
11:50:45
> P1: LINK-UP
>
LOOPBACK
MODE:
Laser
<
<
MANUAL
11:50:45
> P1: LINK-UP
>
LOOPBACK
MODE:
Laser
<
<
RESPOND
FORMAT : LAYER 3
MANUAL RESPOND CONTROL
START
MANUAL RESPOND CONTROL
������������
START
�������������
11:50:45
> P1: LINK-UP
>
LOOPBACK
Laser
<
<
MODE: CONTROL
COMMAND: LOOP-UP
FORMAT : LAYER 3
MAC SRC: 00-00-00-00-00-00
MAC DST: 00-00-00-00-00-00
VLAN: ENABLED
P: 0
VID: 0
IP SRC : 0 .0 .0 .0
IP DST : 0 .0 .0 .0
MANUAL RESPOND CONTROL
START
�������������
Figure 6 Loopback Configuration Screens
All three possible configuration screens contain:
MODE
Options: MANUAL (F1), RESPOND (F2), CONTROL (F3)
Select the loopback operating mode.
•
•
•
MANUAL: If selected and you press START (F4) the test set
will immediately start looping the incoming traffic on PORT 1.
RESPOND: If selected, the test set will act as a responder
after pressing START (F4). At this point the screen will display
“WAITING...” as the test set waits for a loop up command
frame. Once a loop up frame is received, the screen displays
“LOOPBACK TEST IN PROGRESS DO NOT DISTURB”. The
test set will then loopback traffic as was previously described
in the paragraph starting with “Configured as a responder” in
this section. The test set will continue to loopback traffic until
a loop down frame is received, or the ESC key is pressed on
the test set.
CONTROL: If selected, the test set will act as a controller.
Once the MODE is set, the following items may be configured
as needed:
SSMTT-29 and SSMTT-29L
13
COMMAND (not in responder mode)
Options: LOOP-UP (F1), LOOP-DN (F2)
Select the type of frame to send after pressing START (F4).
•
•
LOOP-UP: Press to send a loop up command to a remote
responder (test set).
LOOP-DN: Press to send a loop down command to a remote
responder (test set).
FORMAT (not in responder mode)
Options: LAYER 1 (F1), LAYER 2 (F2), LAYER 3 (F3)
Select the format for the loop up and loop down frames.
If MODE is set to MANUAL, the FORMAT setting determines how
the test set will loop the incoming traffic back.
•
•
•
If Layer 1 is selected, the test set will retransmit the incoming
frames without modifying them.
If Layer 2 is selected, the test set will retransmit the incoming
frames and swap the source and destination MAC address
fields.
If Layer 2 is selected, the test set will retransmit the incoming
frames and swap the source and destination MAC and IP address fields.
If MODE is set to CONTROL, the FORMAT setting determines
the format of the loop up and loop down commands.
•
•
•
If Layer 1 is selected, the test set can transmit a Layer 1 loop
up or loop down command to a remote test set configured as
a responder. Upon receiving the Layer 1 loop up command,
the remote test set will retransmit the incoming frames without
modifying them.
If Layer 2 is selected, the test set can transmit a Layer 2 loop
up or loop down command to a remote test set configured as
a responder. Upon receiving the Layer 2 loop up command,
the remote test set will retransmit the incoming frames and
swap the source and destination MAC address fields.
If Layer 3 is selected, the test set can transmit a Layer 3 loop
up or loop down command to a remote test set configured as
a responder. Upon receiving the Layer 3 loop up command,
the remote test set will retransmit the incoming frames and
swap the source and destination MAC and IP address fields.
Note: Layer 3 loopback can only be used in a network where
the source and destination IP addresses are located in the
same network (direct routing). It will not function through a
gateway.
14
Gigabit Ethernet Module
MAC SRC
Enter the local MAC address (hardware address) of the test set.
This is displayed only if LAYER 2 or LAYER 3 is selected.
•
•
Use SHIFT and the numeric keypad to enter the addresses,
use the arrow (F2 and F3) key to navigate the line while the
SHIFT key is active.
You may also press DEFAULT (F1) and the test set will use
its unique default MAC address based on the serial number
of the chassis.
MAC DST
Enter the MAC address (hardware address) of the remote test
set (responder). This is displayed only if LAYER 2 or LAYER 3
is selected.
•
•
Use SHIFT and the numeric keypad to enter the addresses,
use the arrow (F2 and F3) key to navigate the line while the
SHIFT key is active.
You may also press DEFAULT (F1) and the test set will use
its unique default MAC address based on the serial number
of the chassis.
VLAN
DISABLED (F1), ENABLED (F2)
Selects if the loop up and down commands need to carry a VLAN
tag. This is displayed only if LAYER 2 or LAYER 3 is selected.
If enabled, enter the P (Priority) and VID (VLAN ID) parameters,
using SHIFT and the numeric keypad. For further information on
P and VID, refer to Section 2.3.1-# OF VLAN.
IP SRC
Enter the local IP address (network layer address) of the test set.
This is displayed only if LAYER 3 is selected.
•
Use SHIFT and the numeric keypad to enter the addresses,
use the arrow (F2 and F3) key to navigate the line while the
SHIFT key is active.
IP DST
Enter the IP address (network layer address) of the remote test set
(responder). This is displayed only if Layer 3 format is selected.
•
Use SHIFT and the numeric keypad to enter the addresses,
use the arrow (F2 and F3) key to navigate the line while the
SHIFT key is active.
SSMTT-29 and SSMTT-29L
15
In Controller Mode:
When ready, press START (F4) and the test set will be placed in
controller mode and it will send a loop up or loop down frame.
When the loop up command is transmitted, the test set will verify
that the remote test set (responder) is properly looped up. During
this time, the test set screen displays:
“LOOP-UP VERIFICATION PLEASE WAIT...”
If the BERT is successful, the test set screen displays:
“LOOP-UP SUCCESSFUL”
If not, the test set screen displays:
“LOOP-UP FAILED”
When a loop down command is transmitted, the test set will verify
that the remote test set (responder) is properly looped down. During this time, the test set screen displays:
“LOOP-DOWN VERIFICATION PLEASE WAIT...”
If the BERT is unsuccessful, the test set screen displays:
“LOOP-DOWN SUCCESSFUL”
If the BERT is successful, the test set screen displays:
“LOOP-DOWN FAILED”
16
Gigabit Ethernet Module
2.3 BERT/Throughput
The BERT/THROUGHPUT menu screen contains three items:
•
•
•
BERT CONFIGURATION
MEASUREMENTS
QUICK TEST
Each is covered in the following sections.
Notes
• BERT/THROUGHPUT is only available for the P-TO-P configuration.
• Additional configuration items are located in MEASUREMENTS
SETUP in the GIG E main menu. See Section 2.7.
2.3.1 BERT Configuration
11:50:45
> P1: LINK-UP
>
BERT CONFIGURATION
TEST
: LAYER 1
TEST PATTERN
: 2e31
FRAME LENGTH
: 64
TRAFFIC SHAPING : CONST
SEQUENCE #
: DISABLE
Laser
LAYER 1 LAYER 2 LAYER 3
����������������������������
<
<
11:50:45
> P1: LINK-UP
>
BERT CONFIGURATION
TEST
: LAYER 2
# OF MAC ADDRS : 1
# OF VLAN
: 0
TEST PATTERN
: 2e31
FRAME LENGTH
: 64
TRAFFIC SHAPING : CONST
SEQUENCE #
: DISABLE
Laser
<
<
LAYER 1 LAYER 2 LAYER 3
����������������������������
11:50:45
> P1: LINK-UP
>
BERT CONFIGURATION
TEST
: LAYER 3
# OF MAC ADDRS : 1
# OF VLAN
: 0
# OF IP ADDRS
: 1
TEST PATTERN
: 2e31
FRAME LENGTH
: 64
TRAFFIC SHAPING : CONST
SEQUENCE #
: DISABLE
Laser
<
<
LAYER 1 LAYER 1 LAYER 1
����������������������������
Figure 7 BERT Configuration Screens
TEST
Options: LAYER 1 (F1), LAYER 2 (F2), LAYER 3 (F3)
This setting defines the frame format used for the BERT. Refer to
Section 3 to determine the test adapted to your network. As seen
in Figure 7, the configuration screen presented depends on the
layer to be tested.
SSMTT-29 and SSMTT-29L
17
•
LAYER 1: If this is selected, the BERT will be performed at the
Layer 1 (physical layer) of the OSI reference model. The test
frame conforms to the format shown in Figure 8.
�����
�������
���
�������
������������������
Figure 8 Layer 1 Frame
•
LAYER 2: If this is selected, the BERT will be performed at the
Layer 2 (data link) of the OSI reference model. The test frame
conforms to the format shown in Figure 9.
���
������������
�������
�������
���� ��������
������ ���� �����
������� ���
������
������� ������� �������
�����
�������
���
�������
������������������
Figure 9 Layer 2 Frame
•
LAYER 3: If this is selected, the BERT will be performed at the
Layer 3 (network layer) of the OSI reference model. The test
frame conforms to the format shown in Figure 10.
���
���� ��������
��
������������ ������ ���� �����
������� ������� ��� ������ ������ ����� ���
������� ������� ������� ������� �������� ������� �������
������������������
Figure 10 Layer 3 Frame
Note: The Layer 3 BERT can only be performed if the local and
remote units IP addresses are located in the same subnet. If
indirect routing through a gateway is required, in case local and
remote units IP addresses are located in different subnets, use
the IP Throughput test (refer to Section 2.5.1.5).
18
Gigabit Ethernet Module
Layer 1 Configuration Screen
TEST PATTERN
Options: SELECT (F1), NORMAL (F3), INVERT (F4)
• SELECT: Displays a list of standard test patterns (for a description of the patterns, see below). They are 2e31, 2e23, 2e20,
2e15, 2e11, 2e9, 1111, 1010, 0000, USER, CJPAT, CRPAT,
and CSPAT.
- To select a pattern, use the keypad cursor keys to navigate to
the desired pattern and press ENTER. The selected pattern
is then displayed on the TEST PATTERN line shown in Figure
7-BERT Configuration Screens. For USER, see below.
• NORMAL: Transmits the selected test pattern as is.
• INVERT: Transmits the selected test pattern inverted. This is
indicated by INV to the right of the selected test pattern on
the TEST PATTERN line. This only works with the following
patterns: 2e31, 2e23, 2e20, and 2e15.
The following describes the available test patterns:
2e31: Industry-standard 231-1 pseudo random bit sequence. This
signal is formed from a 31-stage shift register and is not zeroconstrained. This pattern contains up to 30 zeros in a row.
2e23: Industry-standard 223-1 pseudo random bit sequence. This
signal is formed from a 23-stage shift register and is not zeroconstrained. This pattern contains up to 22 zeros in a row.
2e20: Industry-standard 220-1 pseudo random bit sequence. This
signal is formed from a 20-stage shift register and is not zeroconstrained. This pattern contains up to 19 zeros in a row.
2e15: Industry-standard 215-1 pseudo random bit sequence. This
signal is formed from a 15-stage shift register and is not zeroconstrained. This pattern contains up to 14 zeros in a row.
2e11: Industry-standard 211-1 pseudo random bit sequence. This
signal is formed from a 11-stage shift register and is not zeroconstrained. This pattern contains up to 10 zeros in a row.
2e9: Industry-standard 29-1 pseudo random bit sequence. This
signal is formed from a 9-stage shift register and is not zero-constrained. This pattern contains up to 8 zeros in a row.
1111: Industry-standard all 1s pattern.
1010: Industry-standard alternating ones and zeros pattern.
0000: Industry-standard all zeros pattern.
USER: If selected, enter the test pattern in hexadecimal format;
the length of the user-defined 2 byte test pattern.
• When USER is selected, press SELECT (F1) and the cursor will
jump down to the pattern line. Use SHIFT and the keypad to enter
a pattern. Press SHIFT again to use the keypad cursor keys to
correct any errors in your pattern. Press ESC when done.
SSMTT-29 and SSMTT-29L
19
CJPAT: Compliant Jitter Test Pattern is used for jitter measurements. It is intended to expose a receiver’s CDR (Clock and Data
Recovery circuit) to large instantaneous phase jumps. The pattern
alternates repeating low transition density patterns with repeating
high transition density patterns.
CRPAT: Compliant Random Test Pattern is intended to provide
broad spectral content and minimal peaking that can be used
for the measurement of jitter at either a component or system
level.
CSPAT: Compliant Supply Noise Pattern creates the worst case
power supply noise introduced by the transceiver. This noise is
caused by the switching output of the power supply.
Notes
• CJPAT, CRPAT and CSPAT are only available if Layer 1 test
is selected and require a fixed frame length of 1504, 1492, or
2048 bytes respectively.
• CONST traffic shaping at 100% is supported for the CJPAT,
CRPAT and CSPAT test patterns.
FRAME LENGTH
The range of frame length is from 64 to 1518 bytes with steps of
1 byte, or jumbo frames with a range of 1519 to 65535 bytes with
steps of 1 byte. The default value is 64.
•
To set, press SHIFT and use the numeric keys.
TRAFFIC SHAPING
Options: CONST (F1), RAMP (F2), BURST (F3), EDIT (F4)
•
•
•
•
20
CONST: Constant traffic means that the traffic is transmitted
at a constant rate (from 0% to 100% Bandwidth with steps of
0.01%) for the entire duration of the test.
RAMP: The traffic is transmitted at a variable rate from START
BANDWIDTH (between 0% and 100%) to STOP BANDWIDTH
(between 0% and 100%), with increments of STEP (between 1%
and 100%). The ramp is repeated for the duration of the test.
BURST: The traffic is transmitted at a variable rate. The traffic
will be transmitted at BANDWIDTH #1 rate (from 0% to 100%)
for DURATION #1 seconds, then at BANDWIDTH #2 rate (from
0% to 100%) for DURATION #2 seconds. This sequence is
repeated for the duration of the test.
EDIT: Press to access the parameters for CONST, RAMP, and
BURST as shown in Figures 11, 12, and 13.
Gigabit Ethernet Module
11:50:45
> P1: LINK-UP
>
TRAFFIC SHAPING
Laser
<
<
TRAFFIC SHAPING: CONST
IPG
: 96
ns
BANDWIDTH
: 68.94
%
CONST
RAMP
BURST
Figure 11 Constant Traffic Shaping Screen
IPG
Inter-packet gap indicates the delay between two consecutive
frames. IEEE 802.3 specifies a minimum setting of 96 ns. The
maximum setting varies with the selected frame length.
IPG is automatically linked to the bandwidth selection. The minimum IPG setting will result in 100% (1 Gbps) bandwidth utilization. The maximum IPG setting will result in 0.01% (100 Kbps)
bandwidth utilization.
BANDWIDTH
Options: 0 to 100% at 1000 Mbps in 0.01% (100 Kbps) increments.
Set the frame transmission speed.
•
Press SHIFT and use the numeric keypad to enter the addresses, use the arrow (F2 and F3) keys to navigate the line
while the SHIFT key is active.
Note: IPG and BANDWIDTH are interlinked. If BANDWIDTH is
set to the maximum value of 100%, IPG will be set at 96 ns.
When done, press SAVE (F4) to return to the previous configuration screen.
Note: In the following Traffic Shaping Screens to enter a number,
press SHIFT and use the numeric keys.
SSMTT-29 and SSMTT-29L
21
11:50:45
> P1: LINK-UP
>
TRAFFIC SHAPING
TRAFFIC SHAPING:
START BANDWIDTH:
STOP BANDWIDTH:
STEP
:
STEP DURATION :
CONST
RAMP
Laser
<
<
RAMP
0
%
100 %
10 %
10 s
BURST
Figure 12 Ramp Traffic Shaping Screen
The following appears in Figure 12 if RAMP is selected and EDIT
(F4) is pressed:
START BANDWIDTH
Options 0 to 100%, default is 0%
Refer to TRAFFIC SHAPING-RAMP for operation details.
STOP BANDWIDTH
Options 0 to 100%, default is 100%
Refer to TRAFFIC SHAPING-RAMP for operation details.
STEP
Options: 0 to 100%, default is 10%
Refer to TRAFFIC SHAPING-RAMP for operation details.
STEP DURATION
Options: 1 to 999 s (seconds), default is 10 seconds
Refer to TRAFFIC SHAPING-RAMP for operation details.
When done, press SAVE (F4) to return to the previous configuration screen.
22
Gigabit Ethernet Module
11:50:45
> P1: LINK-UP
>
TRAFFIC SHAPING
TRAFFIC SHAPING:
BANDWIDTH #1
:
DURATION #1
:
BANDWIDTH #2
:
DURATION #2
:
CONST
RAMP
Laser
<
<
BURST
90 %
10 s
0
%
10 s
BURST
Figure 13 Burst Traffic Shaping Screen
The following appears in Figure 13 if BURST is selected and
EDIT (F4) is pressed:
BANDWIDTH #1
Options: 0 to 100%, default is 100%
Refer to TRAFFIC SHAPING-BURST for operation details.
DURATION #1
Options: s (F1), ms (F2), default is 10 seconds
Refer to TRAFFIC SHAPING-BURST for operation details.
• s (second): Set the duration of the burst from 2 to 999 seconds.
• ms (millisecond): Set the duration of the burst from 3.00 to
999.99 milliseconds.
BANDWIDTH #2
Options: 0 to 100%, default is 0%
Refer to TRAFFIC SHAPING-BURST on how this works.
DURATION #2
Options: s (F1), ms (F2), default is 10 seconds
Refer to TRAFFIC SHAPING-BURST for operation details.
• s (second): Set the duration of the burst from 2 to 999 seconds.
• ms (millisecond): Set the duration of the burst from 3.00 to
999.99 milliseconds.
Note: If millisecond is selected, BANDWIDTH #1 will be 100%
and BANDWIDTH #2 will be 0%.
When done, press SAVE (F4) to return to the previous configuration screen.
SSMTT-29 and SSMTT-29L
23
The following item continues with Figure 7-Layer 1 Configuration:
SEQUENCE #
Options: ENABLE (F1), DISABLE (F2), default is DISABLE
If enabled, a sequence number will be inserted in the payload
of each frame. The sequence number will allow you to detect
the number of lost frames. This is a Sunrise proprietary feature,
hence frame loss count and out of sequence frames can only
be detected when the BERT is running between two SSMTT-29
modules with SEQUENCE # enabled on each side, or with one
module with a loop at the far end.
When finished with the configuration, press ENTER to start
testing. The STATUS screen shown in Figure 18 is displayed.
Alternatively press ESC after configuration for QUICK TEST (see
Section 2.3.3).
24
Gigabit Ethernet Module
Layer 2 Configuration Screen
This configuration screen is similar to the BERT CONFIGURATION
screen (Layer 1 Configuration). Referring to Figure 7-Layer 2 Configuration screen, you will notice that there are two additional items
to configure. They are # OF MAC ADDRS and # OF VLAN.
# OF MAC ADDRS
Options: 1 to 64, default is 1
The MAC address is the hardware address that uniquely identifies the source and destination of the Ethernet frame. # OF MAC
ADDRS selects the number of MAC address source and destination to be used for the test. Each MAC address source and
destination pair defines traffic flow. The module can generate up
to 64 traffic flows.
•
Use the SHIFT and numeric keys to enter a number.
Pressing EDIT (F1) displays the MAC address editing screen
shown in Figure 14. The number of lines in this editing screen
will vary according to the number of MAC addresses (1 to 64)
entered. If more than five #MAC ADDRS are entered, a scroll
bar is displayed, as shown in Figure 14. Use the keypad up/down
cursor keys to scroll.
Laser
11:50:45
> P1: LINK-UP
<
>
<
MAC ADDRESS
MODE: MANUAL
#MAC ADDRS:8
MAC SRC #1 :00-00-00-00-00-00
MAC DST #1 :00-00-00-00-00-00
MAC SRC #2 :00-00-00-00-00-00
MAC DST #2 :00-00-00-00-00-00
MAC SRC #3 :00-00-00-00-00-00
MAC DST #3 :00-00-00-00-00-00
MAC SRC #4 :00-00-00-00-00-00
MAC DST #4 :00-00-00-00-00-00
MAC SRC #5 :00-00-00-00-00-00
MAC DST #5 :00-00-00-00-00-00
MANUAL
INCR
DECR
SAVE
Figure 14 MAC Address Editing Screen
This screen contains the following:
MODE
Options: MANUAL (F1), INCR (F2), DECR (F3)
•
•
MANUAL: Manually enter each MAC address SRC (source)
and MAC DST (destination) pair.
INCR: Enter the start MAC address SRC and the start MAC ad-
SSMTT-29 and SSMTT-29L
25
•
dress DST. The remaining MAC addresses will be incremented.
Use this to automatically generate traffic flows with MAC addresses
incrementing by one starting from the START MAC address.
DECR: Enter the start MAC address SRC and the start MAC address DST. The remaining MAC addresses will be decremented.
Use this to automatically generate traffic flows with MAC addresses
decrementing by one starting from the START MAC address.
#MAC ADDRS
Options: 1 to 64, default is 1
You may also enter this parameter in this screen.
•
Use the SHIFT and numeric keys to enter a number.
MAC SRC (source) and MAC DST (destination)
Options: DEFAULT (F1), <- (F2), -> (F3), COPY (more, F1),
PASTE (more, F2)
•
•
Press SHIFT and use the numeric keypad to enter the addresses, use the arrow (F2 and F3) keys to navigate the line
while the SHIFT key is active. If you want, you may also copy
an entire line and paste it into another line.
DEFAULT: Replaces the MAC address with the unique default
MAC address of the test set, based on the serial number of
the chassis.
When done, press SAVE (F3 or F4) to validate the settings and
return to the Layer 2 BERT CONFIGURATION screen. The second
new item in this screen is:
# OF VLAN
Options: 0 to 64, default is 0
The number of VLAN selects the optional number of VLAN tags
(conforming to IEEE 802.1Q and IEEE 802.1P) that will be added
to the traffic flow(s).
If you enter 0, no VLAN tags will be added to the traffic flow(s)
and no VLAN tags will be added to the test frames.
You can enter a maximum number of VLAN equal to the number
of MAC addresses selected for the test. For example if the number
of MAC addresses used for the test is 20, then you can enter any
number of VLAN between 0 and 20.
If you enter 1, the same VLAN tag will be added to all of the test
frames.
If you enter 2, 50% of the traffic will be generated with VLAN #1
tag and the other 50% will have VLAN #2 tag.
If you enter 20, each test frame will be generated with a different
VLAN tag.
• Use the SHIFT and numeric keys to enter a number.
26
Gigabit Ethernet Module
You can edit the VLAN tags priority bits (IEEE 802.1P) and VLAN
IDs (IEEE 802.1Q) by pressing EDIT (F1). The editing screen is
shown in Figure 15. This screen is not available if #VLAN = 0.
The number of lines in this editing screen will vary according to
the number of VLAN (1 to 64) entered. If more than five #VLAN
are entered, a scroll bar is displayed, as shown in Figure 15. Use
the keypad up/down cursor keys to scroll.
11:50:45
> P1: LINK-UP
>
# VLAN :
VLAN #1 :
P:
VLAN #2 :
P:
VLAN #3 :
P:
VLAN #4 :
P:
VLAN #5 :
P:
COPY
Laser
<
<
VLAN
8
0
VID: 0
0
VID: 0
0
VID: 0
0
VID: 0
0 VID: 0
PASTE
SAVE
Figure 15 VLAN Editing Screen
���
�������
�
������
�
�����
���
�������
�����������������������������������������������
���������������������������������������������������
��������������������������������
������������������������������������
Figure 16 VLAN Tag
The VLAN editing screen contains the following:
# VLAN
Options: 1 to 64, default is 0.
You may also enter this parameter in this screen.
•
Use the SHIFT and numeric keys to enter a number.
VLAN #1, 2, 3 and so on
For each VLAN enter the Priority (P) from 0 to 7, and the VLAN
SSMTT-29 and SSMTT-29L
27
ID (VID) from 0 to 4095, using the SHIFT and numeric keys. You
also may use the COPY (F1) key to copy the VLAN P/VID numbers
and PASTE (F2) it into a different line.
Note: You may control the test duration in MEASUREMENTS
SETUP.
When done, press SAVE (F4) to validate the settings and return
to the BERT CONFIGURATION (Layer 2) screen.
The rest of the Layer 2 Configuration screen has been previously
described in Layer 1 Configuration Screen.
When finished with the configuration, press ENTER to start
testing. The STATUS screen shown in Figure 18 is displayed.
Alternatively press ESC after configuration for QUICK TEST (see
Section 2.3.3).
28
Gigabit Ethernet Module
Layer 3 Configuration Screen
This configuration screen is similar to the BERT CONFIGURATION screen (Layer 2). Referring to Figure 7-Layer 3 Configuration screen, you will notice that there is one additional item to
configure. It is:
# OF IP ADDRS
Options: 1 to 64
The IP address is the network layer address that identifies the
source and destination of the test frames. This selects the number
of the IP address source and destination pairs to use.
The #OF IP ADDRS is fixed at the same value as the # OF MAC
ADDRS. Each specific IP address pair will be associated with a
specific MAC address pair.
•
Use the SHIFT and numeric keys to enter a number.
Pressing EDIT (F1) displays the IP ADDRESS editing screen shown
in Figure 17. The number of lines in this editing screen will vary according to the number of #IP ADDRS (1 to 64) entered. If more than
five #IP ADDRS are entered, a scroll bar is displayed, as shown in
Figure 17. Use the keypad up/down cursor keys to scroll.
11:50:45
> P1: LINK-UP
>
IP ADDRESS
MODE: MANUAL
IP SRC #1 : 0 .0 .0
IP DST #1 : 0 .0 .0
IP SRC #2 : 0 .0 .0
IP DST #2 : 0 .0 .0
IP SRC #3 : 0 .0 .0
IP DST #3 : 0 .0 .0
IP SRC #4 : 0 .0 .0
IP DST #4 : 0 .0 .0
IP SRC #5 : 0 .0 .0
IP DST #5 : 0 .0 .0
MANUAL
INCR
Laser
<
<
.0
.0
.0
.0
.0
.0
.0
.0
.0
.0
DECR
SAVE
Figure 17 IP Address Editing Screen
The editing screen contains the following:
MODE
Options: MANUAL (F1), INCR (F2), DECR (F3)
•
MANUAL: Manually enter each IP address SRC (source) and
IP DST (destination) pair.
SSMTT-29 and SSMTT-29L
29
•
•
INCR: Use this to automatically generate traffic flows with IP
addresses incrementing by one starting from the START IP
address. Enter the start IP address SRC and the start IP address DST. The remaining IP addresses will be incremented.
DECR: Use this to automatically generate traffic flows with IP
addresses decrementing by one starting from the START IP
address. Enter the start IP address SRC and the start IP address
DST. The remaining IP addresses will be decremented.
IP SRC (source) and IP DST (destination)
Options: COPY (F1), <- (F2), -> (F3), PASTE (F4)
To manually enter an IP SRC or IP DST, press SHIFT and use
the numeric keys. Use the <-, -> keys to navigate the line when
the SHIFT key is active. You may also copy a line and paste it
into another line.
When done, press SAVE (F4) to validate the settings and return
to the BERT CONFIGURATION (Layer 3) screen.
The rest of the Layer 3 configuration screen has been previously
described in Layer 1 Configuration Screen and Layer 2 Configuration Screen.
When finished with the configuration, press ENTER to start
testing. The STATUS screen shown in Figure 18 is displayed.
Alternatively press ESC after configuration for QUICK TEST (see
Section 2.3.3).
30
Gigabit Ethernet Module
2.3.2 Measurements
There can be up to eight* screens in BERT/THROUGHPUT MEASUREMENTS. They are shown in Figures 18 through 25.
*Note: The Optical Power Measurement screen is only displayed
if a plug-in optical transceiver is used that supports this feature.
Some early models of transceiver do not support this feature.
To display the screens, use the keypad up/down cursor keys, the
scroll bar at the right of the screen indicates the screen.
Each screen displays the following:
•
•
Time of day
P1: Port 1 LINK UP or LINK DOWN
- LINK UP indicates that the synchronization and auto-negotiation processes have been successfully completed.
If auto-negotiation is disabled (see Section 2.1) then it indicates
that the synchronization process is successfully completed.
-
•
•
•
LINK DOWN indicates that the synchronization and auto-negotiation processes were not successfully completed. In this
case the test set is not ready to transmit and receive data.
ET: Elapsed Time of the test
ST: Start Time of the test
RT: Remaining Time of the test, or CONTINU for continuous
Each screen has common F-keys:
STOP (F1): Press to manually stop the test. If pressed the following F-keys appear:
START (F1): Restarts the test and resets ET and RT.
STORE (F2): Allows storing of all measurement screens. Refer
to Section 2.8 for further information.
PRINT (F3): Allows printing of all measurement screens to the
serial port of the test set. Refer to Section 2.8 and your test
set’s user manual for further information.
TX ON/TX OFF (F3): Press to start the transmission of test frames
as configured in the BERT CONFIGURATION screens (see Section 2.3.1), press again to stop transmitting.
FL CTRL (F4): Sends a flow control pause frame for a duration
of 65535 x 5.12 ms for fast Ethernet (100BaseT) or 65535 x 51.2
ms for Ethernet (10BaseT), only in full-duplex mode. Note that
PAUSE is only available if auto-negotiation is enabled (refer to
Section 2.1) and if the link partner indicates capability to stop
transmitting upon receiving a pause flow control frame.
From the BERT/THROUGHPUT menu, select MEASUREMENTS
and the test begins with the first screen shown in Figure 18.
SSMTT-29 and SSMTT-29L
31
10:50:10
> P1: LINK-UP
>
ST: 10:48:55
STATUS
Laser
<
ET:000:01:15
RT:CONTINU
TEST: LAYER 1-64Bytes-BURST
LINE 1:
NO ERRORS
TX RATE:689.40Mbps UTIL:68.94%
RX RATE:689.40Mbps UTIL:68.94%
TX OFF FL CTRL
STOP
Figure 18 BERT Results, Status Screen
This screen reports the following:
TEST: Type of test configured in the BERT CONFIGURATION
screen.
LINE 1: Displays a summary of the status of the test. It can be:
• “NO ERRORS”: Test is successful.
• “SIGNAL LOSS”: No signal detected on Port 1, the LOS and
LOSS counters are incrementing.
• “SYNC LOSS”: No synchronization on Port 1, the LOSYNC
and LOSYS counters are incrementing.
• “PAT LOSS”: No pattern synchronization has been acquired
or there has been pattern synchronization, but it is now lost.
- Pattern synchronization is acquired when in any pseudo
random bit sequence (2e31, 2e23, etc) 56 bits are checked
and there are no bit errors. If a fixed pattern (1111, 1010, etc)
is used, then 256 bits have been checked with no bit errors.
- Loss of pattern is detected when the BER is greater than
or equal to 0.2 over a 1 second period.
• “ERROR DET”: Bit, CRC, or Symbol errors are currently being
detected or have been previously detected.
• “NO RX DATA”: Test set is not receiving Ethernet frames.
• Note that the error condition on the STATUS screen can be
acknowledged and cleared by pressing HISTORY.
TX RATE: Transmit data rate in kbps or Mbps.
TX RATE UTIL: Transmitted percentage bandwidth utilization, as
set in the BERT CONFIGURATION screen.
RX RATE: Received data rate in kbps or Mbps.
RX RATE UTIL: Received percentage bandwidth utilization.
32
Gigabit Ethernet Module
Press the keypad down cursor key to display the next result screen
shown in Figure 19.
Laser
10:50:10
> P1: LINK-UP
<
>
ET:000:01:15
ST: 10:48:55
RT:CONTINU
SUMMARY
BIT
: 0
CRC
: 0
SYMBOL: 0
RATE : 0.00E-00
RATE : 0.00E-00
RATE : 0.00E-00
PATL : 0
LOS
: 0
LOSYNC: 0
PATLS: 0
LOSS : 0
LOSyS: 0
STOP
TX OFF
FL CTRL
Figure 19 BERT Results, Summary Screen
This screen reports the following:
BIT: Count of BIT errors since the start of the test.
BIT RATE: Average bit error rate since the start of the test.
CRC: Count of CRC (frame check sequence) errors since the
beginning of the test.
CRC RATE: Average CRC (frame check sequence) error rate
since the start of the test.
SYMBOL: Count of 8B/10B SYMBOL errors since the start of
the test.
SYMBOL RATE: Average 8B/10B SYMBOL error rate since the
start of the test.
PATL: Count of pattern loss occurrences since the start of the
test.
PATLS: Count of pattern loss seconds since the start of the
test.
LOS: Count of loss of signal occurrences since the start of the
test.
LOSS: Count of loss of signal seconds since the start of the
test.
LOSYNC: Count of lost synchronization occurrences since the
start of the test.
LOSyS: Count of lost synchronization seconds since the start
of the test.
SSMTT-29 and SSMTT-29L
33
Press the keypad down cursor key to display the next result screen
shown in Figure 20.
10:50:10
> P1: LINK-UP
>
ST: 10:48:55
COUNTER
OOS
: 0
LOS
: 0
LOSYNC: 0
STOP
Laser
ALARM
<
ET:000:01:15
RT:CONTINU
DURATION
OOSS : 0
Min : 0
Max : 0
Avg : 0
ms
ms
ms
ms
LOSS : 0
LOSyS: 0
ms
ms
TX OFF
FL CTRL
Figure 20 BERT Results, Alarm Screen
This screen reports the following alarm information under the
COUNTER banner:
OOS: Out Of Service event counter. This occurs when the device
cannot send or receive data. It happens in the following cases;
Loss of Signal, Loss of Synchronization, and Link Down.
LOS: Loss of Signal event counter.
LOSYNC: Loss of Synchronization counter.
This screen reports the following under the DURATION banner:
OOSS: Out Of Service Seconds counts the total number of
milliseconds of OOS since the start of the test. The minimum,
maximum, and average OOSS are also reported.
LOSS: Loss of signal seconds counts the total number of milliseconds of LOSS since the start of the test.
LOSyS: Lost synchronization seconds counts the total number
of milliseconds of LOSyS since the start of the test.
Press the keypad down cursor key to display the next result screen
shown in Figure 21.
34
Gigabit Ethernet Module
Laser
10:50:10
> P1: LINK-UP
<
>
ET:000:01:15
ST: 10:48:55
RT:CONTINU
FRAME STATISTICS
TX
RX
#FRAMES:
58949
58949
FPS
:
8120
8120
Min:
1893
1722
Max:
8948
8948
Avg:
6550
6550
#RUNTS
:
0
#MULTICAST: 921
#FLOW CONTROL:
STOP
#OVERSIZED:
#BROADCAST:
0
TX OFF
0
0
FL CTRL
Figure 21 BERT Results, Frame Screen
This screen displays transmit (TX) and receive (RX) frame statistics. If the # TX or RX FRAMES counter exceeds 9 digits, the display format will change to x.xxxxEyy, where x.xxxx is the coefficient
and yy is the power of 10. The screen reports the following:
#FRAMES: Number of received/transmitted frames.
FPS: Transmitted (TX) and received (RX) frames per second.
Min: Minimum transmitted (TX) and received (RX) frames per
second since the beginning of the test.
Max: Maximum transmitted (TX) and received (RX) frames
per second since the beginning of the test.
Avg: Average transmitted (TX) and received (RX) frames per
second over the duration of the test.
In the following measurements, if the counters exceed 4 digits,
the display format will change to x.xEy, where x.x is the coefficient
and y is the power of 10.
# RUNTS: Number of undersized/fragments frames received.
#OVERSIZED: Number of oversized frames received. A frame is considered oversized when it is a jumbo frame (1519 bytes or more).
#MULTICAST: Number of multicast frames received. A multicast
frame is a frame that is intended for multiple devices on the network. A multicast MAC address always starts with a 01 (hex) prefix.
This displays N/A if the test is configured for Layer 1.
#BROADCAST: Number of broadcast frames received. A broadcast frame is a frame that is intended for all of the devices on the
network, the destination MAC address is set to ‘FF-FF-FF-FF-FFFF’. This displays N/A if the test is configured for Layer 1.
#FLOW CONTROL: Number of flow control frames received.
SSMTT-29 and SSMTT-29L
35
Press the keypad down cursor key to display the next result screen
shown in Figure 22.
Laser
10:50:10
> P1: LINK-UP
<
>
ET:000:01:15
ST: 10:48:55
RT:CONTINU
FRAME STATISTICS
#FRAMES RX
: 476024
#UNICAST RX
: 478586
#NON TEST FR RX : 0
#LOST FRAMES:
145
LOST FPS
:
0
%LOST FRAMES:
<1%
#OUT OF SEQ FRAMES:
0
OUT OF SEQ FPS
:
0
%OUT OF SEQ FRAMES: 0%
TX OFF
STOP
FL CTRL
Figure 22 BERT Results, Frame Screen 2
The second FRAME STATISTICS screen reports the following:
#FRAMES RX: Total number of frames received since the beginning of the test.
#UNICAST RX: Total number of unicast frames received since
the beginning of the test. A unicast frame is a frame destined to
a single device. This is the opposite of a broadcast frame. This
displays N/A if the test is configured for Layer 1.
#NON TEST FR RX: Number of non test frames received indicates the number of unicast frames received whose source and
destination MAC addresses don’t match the test settings (see
Section 2.3.1-# MAC ADDRS).
#LOST FRAMES: Number of Lost Frames in the incoming traffic. This measurement is only available if the optional sequence
number is enabled in the BERT configuration screen (on the local
and remote test sets).
LOST FPS: Number of Lost Frames Per Second.
Note: Lost frames can only be detected if at least 8 consecutive
frames with a sequence number are received.
%LOST FRAMES: Percentage of Lost Frames compared to the
total number of frames.
#OUT OF SEQ FRAMES: Number of frames that are received out
of sequence. This measurement is only available if the optional
sequence number is enabled in the BERT configuration screen
(on the local and remote test sets).
36
Gigabit Ethernet Module
OUT OF SEQ FPS: Number of Out of Sequence Frames Per
Second.
%OUT OF SEQ FRAMES: Percentage of out of sequence compared to the number of received frames.
Press the keypad down cursor key to display the next result screen
shown in Figure 23.
Laser
10:50:10
> P1: LINK-UP
<
>
ET:000:01:15
ST: 10:48:55
RT:CONTINU
BANDWIDTH STATISTICS
TX
RX
TOTAL RATE: 30 Mbps
30 Mbps
Min:
0 kbps
0 kbps
Max: 100 Mbps 100 Mbps
Avg: 89 Mbps
90 Mbps
%BROADCAST:
0 %
%MULTICAST:
4 %
%FLOW CTRL:
0 %
%UNICAST :
96 %
STOP
TX OFF
FL CTRL
Figure 23 BERT Results, Bandwidth Statistics Screen
This screen reports the received and transmitted rates for:
TOTAL RATE: The current, Minimum, Maximum, and Average
bandwidth utilization since the beginning of the test.
%BROADCAST: This is the percentage of received broadcast
traffic to the total number of received frames. This is displayed
as “N/A” if the test set is configured for Layer 1.
%MULTICAST: This is the percentage of received multicast traffic
to the total number of received frames.
%FLOW CTRL: This is the percentage of received flow control
traffic to the total number of received frames.
%UNICAST: This is the percentage of received unicast traffic to
the total number of received frames. This is displayed as “N/A” if
the test set is configured for Layer 1.
SSMTT-29 and SSMTT-29L
37
Press the keypad down cursor key to display the next result screen
shown in Figure 24 (if enabled in MEASUREMENTS SETUP-see
Section 2.7).
10:50:10
> P1: LINK-UP
>
ST: 10:48:55
2004-06-25
10:48:55
10:49:10 L1
10:49:45 L1
10:50:00 L1
10:50:01 L1
10:50:02
STOP
Laser
EVENTS
<
ET:000:01:15
RT:CONTINU
P-001
TEST STARTED
CRC ERROR
BIT ERROR
BIT ERROR
SIGNAL LOSS
CRC ERROR
NEXT PG
TX OFF FL CTRL
Figure 24 BERT Results, Events Screen
This screen reports the following:
•
•
•
•
Test Date
Test Start Time
Test End Time
Any of the following events with an event time:
SYNC LOSS, END SYNC LOSS, SIGNAL LOSS, END SIGNAL
LOSS, PAT LOSS, END OF PAT LOSS, BIT ERROR, CRC
ERROR, FLOW CONTROL, SYMBOL ERROR.
If there is more than one page of events, NEXT PG (F2) and a
page indicator appear. Press F2 to scroll through the available
pages. Use the page indicator to tell you what page you are looking at. In Figure 24 the page indicator shows ‘P-001’, indicating
page 1.
38
Gigabit Ethernet Module
Press the keypad down cursor key to display the last result screen
shown in Figure 25.
Laser
10:50:10
> P1: LINK-UP
<
>
ET:000:01:15
ST: 10:48:55
RT:CONTINU
OPTICAL POWER MEASUREMENT
WAVELENGTH: 1310 nm
TX POWER
: -5.6
dBm
RX POWER
SATURAT
: -5.6
dBm
8.3 -3.0
STOP
LOS
-27.0
TX OFF FL CTRL
Figure 25 BERT Results, Optical Power Screen
This screen is described in Section 2.6.
Note: This screen is displayed only if the plug-in optical transceiver
supports this feature. Some early models of transceiver do not
support this feature.
SSMTT-29 and SSMTT-29L
39
2.3.3 Quick Test
Quick Test allows for a simple pass/fail, preconfigured BERT/
Throughput test. Once configured, connect the test set to the
circuit, turn on the test set and the test results are presented.
Figure 26 shows a sample results screen.
To set up the test set to perform a Quick Test on start-up, follow
the instructions given in Section 2.1-Configuration and select
QUICK TEST on the START-UP line.
To select the BER test configuration follow the instructions given
in Section 2.3-BERT/Throughput.
10:50:10
> P1: LINK-UP
ST: 10:48:55
STATUS
Laser
PATT: 2e31<
ET:000:01:15
NO ERRORS-OK
RESULTS
BIT
: 0
RATE : 0.00E-00
CRC
: 0
RATE : 0.00E-00
SYMBOL : 0
RATE : 0.00E-00
LOST FRM: 0
LOS
: 0
LOSS : 0
LOSYNC : 0
LOSyS: 0
TX RATE :689.40Mbps UTIL:68.94%
RX RATE :689.40Mbps UTIL:68.94%
LAS.OFF PATTERN
PRINT
STOP
Figure 26 Quick Test Results Screen
The STATUS line on the screen can report the following:
• NO ERRORS: Test is successful.
• SIGNAL LOSS: No signal detected on PORT 1, the LOS and
LOSS counters are incrementing.
• SYNC LOSS: No synchronization on PORT 1, the LOSYNC
and LOSYS counters are incrementing.
• PAT LOSS: No pattern synchronization has been acquired or
there has been pattern synchronization, but it is now lost.
- Pattern synchronization is acquired when in any pseudo
random bit sequence (2e31, 2e23, etc) 56 bits are checked
and there are no bit errors. If a fixed pattern (1111, 1010, etc)
is used, then 256 bits have been checked with no bit errors.
- Loss of pattern is detected when the BER is greater than
or equal to 0.2 over a 1 second period.
• ERROR DET: Bit, CRC, or Symbol errors are currently being
detected or have been previously detected.
• NO RX DATA: Test set is not receiving Ethernet frames.
Note: Error conditions on the Status screen can be acknowledged and cleared by pressing HISTORY.
40
Gigabit Ethernet Module
The RESULTS area of the screen reports the following:
BIT: Count of BIT errors since the start of the test.
BIT RATE: Average bit error rate since the start of the test.
CRC: Count of CRC errors since the beginning of the test.
CRC RATE: Average CRC error rate since the start of the test.
SYMBOL: Count of 8B/10B SYMBOL errors since the start of
the test.
SYMBOL RATE: Average SYMBOL error rate since the start of
the test.
LOST FRM: Indicates the number of Lost Frames in the incoming traffic. This measurement is only available if the optional
sequence number is enabled in BERT CONFIGURATION (local
and remote).
Note: Lost frames can only be detected if at least 8 consecutive
frames with a sequence number are received.
LOS: Count of pattern loss seconds since the start of the test.
LOSS: Count of loss of signal seconds since the start of the test.
LOSYNC: Count of lost synchronization occurrences since the
start of the test.
LOSyS: Count of lost synchronization seconds since the start
of the test.
TX RATE: Transmit data rate in Mbps.
TX RATE UTIL: Transmitted percentage bandwidth utilization, as
set in the BERT CONFIGURATION screen.
RX RATE: Receive data rate in Mbps.
RX RATE UTIL: Received percentage bandwidth utilization.
The Quick Test results screen contains four F-keys:
LAS.OFF/LAS.ON (F1): Toggles the laser on/off as indicated by
the ‘Laser’ indicator at the top of the screen. No indicator indicates
that the laser is off.
PATTERN (F2): Allows for the selection of a transmitted test pattern. The selected pattern is indicated at the ‘PATT’ line under the
time of day line at the top of the screen. The available patterns are:
2e31, 2e23, 2e20, 2e15, 2e11, 2e9, 1111, 1010, 0000, CJPAT,
CRPAT and CSPAT (see Section 2.3.1-TEST PATTERN). To select,
press PATTERN until the desired pattern is displayed.
STOP/START (F3): Allows for restarting of the preconfigured test.
Press after changing the transmitted test pattern.
PRINT (F4): Allows printing of the Quick Test results screen. Refer
to your test set user’s manual for more information.
SSMTT-29 and SSMTT-29L
41
2.4 Statistics (Monitor Mode)
This function is not available to the SSMTT-29L version of this
module and when the 1000BaseT transceiver is used. It only
available when OPERATION is set for MONITOR. This mode is
set in GIG E MAIN MENU > CONFIGURATION. Refer to Section
2.1 for setup details.
There are three statistics screens available. They are shown in
Figures 27 through 29. To display the screens, use the keypad
up/down cursor keys; the scroll bar at the right of the screen
indicates the screen.
Each screen displays the following:
• Time of day
• P1: Port 1 LINK UP or LINK DOWN
• P2: Port 2 LINK UP or LINK DOWN
Each screen has common F-keys:
STOP (F3): Press to manually stop the test. If pressed the following F-keys appear:
PRINT (F1): Allows printing of all three screens to the serial
port of the test set. Refer to Section 2.8 and your test set’s
user manual for further information.
STORE (F2): Allows storing of all three screens. Refer to Section 2.8 for further information.
START (F3): Restarts the monitoring and resets ET and the
counters.
The following measurement screens are available:
10:50:10
> P1: LINK-UP
> P2: LINK-UP
ST: 10:48:55
Laser
STATUS
<
<
ET:000:01:15
LINE 1:
NO ERRORS
LINE 2:
NO ERRORS
STOP
Figure 27 Measurement Monitoring, Status Screen
The first screen reports the following:
42
Gigabit Ethernet Module
ST: Start Time of the measurement.
ET: Elapsed Time of the measurement.
LINE 1: Displays the status of PORT 1. This can display NO ERRORS, SIGNAL LOSS, SYNC LOSS, or ERROR DET.
LINE 2: Displays the status of PORT 2. This can display NO ERRORS, SIGNAL LOSS, SYNC LOSS, or ERROR DET.
Press the keypad down cursor key to display the second screen
shown in Figure 28.
10:50:10
> P1: LINK-UP
> P2: LINK-UP
STATISTICS
PORT 1
SIGNAL AS :
100
SIGNAL OFF:
0
SYNCH AS :
100
SYNCH OFF :
0
CRC ERRORS:
0
UTIL:
RX :
Fps :
#RX :
10%
100 Mbps
148,808
8,924,754
Laser
<
<
PORT 2
100
0
100
0
0
10%
100 Mbps
148,808
8,926,754
STOP
Figure 28 Measurement Monitoring, Statistics Screen
The second screen reports the following information for PORT
1 and PORT 2:
SIGNAL AS: Count of signal available seconds since the start of
the measurement.
SIGNAL OFF: Count of signal off seconds since the start of the
measurement.
SYNCH AS: Count of synchronization available seconds since
the start of the measurement.
SYNCH OFF: Count of synchronization off seconds since the
start of the measurement.
CRC ERRORS: Count of CRC errors since the start of the measurement.
UTIL: Percentage of bandwidth utilization.
RX: Received rate in kbps or Mbps.
Fps: Number of received frames per second.
#RX: Number of frames received since the start of the measurement.
SSMTT-29 and SSMTT-29L
43
Press the keypad down cursor key to display the next screen
shown in Figure 29.
10:50:10
> P1: LINK-UP
> P2: LINK-UP
ST: 10:48:55
2004-03-07
10:48:55
10:49:10
10:49:45
10:50:00
10:50:01
10:50:02
10:50:30
10:50:30
Laser
EVENTS
<
<
ET:000:01:15
P-001
TEST STARTED
L1 SYNC LOSS
L1 SIGNAL LOSS
L1 SYNC LOSS
L2 SYNC LOSS
L2 SIGNAL LOSS
L1 END SIGNAL LOSS
L2 END SIGNAL LOSS
PAGE-UP PAGE-DN
STOP
Figure 29 Measurement Monitoring, Events Screen
This screen reports the following information:
•
•
•
•
Test Date
Test Start Time
Test End Time
Any of the following events with an event time:
SYNC LOSS, END SYNC LOSS, SIGNAL LOSS, CRC ERROR
If there is more than one page of events, the PAGE-UP (F1) and
PAGE-DN (F2) keys, and a page indicator appear. Use the F-keys
to scroll through the available pages. Use the page indicator to tell
you what page you are looking at. In Figure 29 the page indicator
shows ‘P-001’, indicating page 1.
44
Gigabit Ethernet Module
2.5 Advanced Features
This menu screen contains the following selections:
•
•
•
•
IP FEATURES
ROUNDTRIP DELAY
BANDWIDTH SWEEP
RFC2544
2.5.1 IP Features
IP features provides advanced IP connectivity analysis, expert
PING testing with statistics, trace route, echo response, and IP
Throughput testing. The menu contains:
•
•
•
•
•
IP CONNECTION/STATUS
PING TEST
TRACE ROUTE
ECHO RESPONSE
THROUGHPUT TEST/SETUP
Note: For IP Features, the SSMTT-29 module uses it’s default
unique MAC address based on the serial number of the test set
chassis.
SSMTT-29 and SSMTT-29L
45
2.5.1.1 IP Connection/Status
After turning up the link, select IP FEATURES > IP CONNECTION/
STATUS from the GIG E main menu. This contains configuration
items for the IP connection. Enter the proper protocol used by the
circuit, as well as the necessary IP addresses. Figure 30 shows
the two types of IP screens.
11:50:45
> P1: LINK-UP
>
IP CONNECTION/STATUS
Laser
<
<
IP TYPE
:STATIC
LOCAL IP
:000.000.000.000
GATEWAY
:000.000.000.000
SUBNET
:000.000.000.000
DNS SERVER :0 .0 .0 .0
VLAN: DISABLED
ARP
STATIC
11:50:45
> P1: LINK-UP
>
IP CONNECTION/STATUS
Laser
<
<
IP TYPE
:DHCP
VLAN: DISABLED
DHCP
:-
:DHCP
CONNECT
���������������������������
STATIC
DHCP
CONNECT
�������������������������
Figure 30 IP Connection/Status Screens
Common F-keys and Procedures
The number entry fields in the IP CONNECTION/STATUS screen
have common F-keys. They are:
<- (F2): Moves the insertion point one place to the left.
-> (F3): Moves the insertion point one place to the right.
CONNECT/DISC (F4): Use this key to start or stop the procedure
at any time. Once CONNECT is pressed, the connection will stay
‘UP’ if successful or ‘DOWN’ if unsuccessful. In either case you
must press DISC to change any configuration items.
Note: To enter numbers, press SHIFT and use the numeric keys.
Depending on the entry field, the <-, and -> cursor movement
keys may be available, use them to move within the field when
the SHIFT key is active.
The following describes the configuration fields for setting up IP
CONNECTION/STATUS.
46
Gigabit Ethernet Module
IP TYPE
Options: STATIC (F1), DHCP (F2)
•
•
Static IP management means that the IP address is fixed to the
terminal. This address must be known for successful testing.
Enter it in the LOCAL IP field.
DHCP: Dynamic Host Configuration Protocol provides a way
for computers to obtain protocol configuration parameters
(like the local IP address) dynamically from the network. In
this case, the IP address is not fixed to the terminal; instead
the terminal requests an address from the DHCP server in the
network. When DHCP is selected for IP ADDRESS, the test
set sends a DHCP request to the server; the server responds
and provides an IP address. Note that upon selecting DHCP,
the LOCAL IP setting disappears; the IP address will dynamically be assigned from the network.
LOCAL IP (not in DHCP)
This specifies the IP address of the circuit to be tested.
GATEWAY (not in DHCP)
This specifies the gateway address. A gateway is a device that
connects dissimilar networks and passes information between
them. In TCP/IP, the default gateway address is the address where
the Internet Protocol sends packets destined for remote networks,
unless a different route is configured. If a gateway is not used in
your network, press NONE (F1).
SUBNET (not in DHCP)
This specifies the subnet mask.
DNS SERVER (not in DHCP)
This specifies the Domain Name System Servers address.
VLAN
Options: ENABLE (F1), DISABLE (F2)
Selects if the loop up and down commands need to carry a VLAN
tag. This is displayed only if LAYER 2 or LAYER 3 is selected.
If enabled, enter the P (Priority) and VID (VLAN ID) parameters
using SHIFT and the numeric keypad. For further information on
P and VID, refer to Section 2.3.1-# OF VLAN.
SSMTT-29 and SSMTT-29L
47
2.5.1.1.1 IP Status
Once the IP CONNECTION/STATUS screen is configured, press
CONNECT (F4). The cursor disappears in the parameter fields and
an “IP UP” indicator will appear near the top of the screen, if the
connection is successful. If unsuccessful an “IP DOWN” indicator
will appear. Refer to the following two sections.
Note: To change parameters, press DISC (F4) and the cursor
will reappear.
2.5.1.1.2 Static IP Status
Laser
12:03:43
> P1: LINK-UP
<
>
IP-UP<
IP CONNECTION/STATUS
IP TYPE
:STATIC
LOCAL IP
:10 .0 .0 .2
GATEWAY
:10 .0 .0 .1
SUBNET
:255.255.255.0
DNS SERVER :0 .0 .0 .0
VLAN: DISABLED
ARP
DETAILS
: PASS
DISC
Figure 31 ARP IP Connection/Status Screen
After pressing CONNECT (F4), the test set will send an ARP
(Address Resolution Protocol) request to the gateway. The status
of the request is displayed on the ARP line. It can be one of the
following:
ARP: in progress; indicates that the connection is not yet
completed.
ARP: PASS; indicates a successful connection, the gateway has
replied to the ARP request, and “IP UP” is displayed.
ARP: FAIL; indicates that the connection was not successful, the
gateway has not responded to the ARP request and “IP DOWN”
is displayed. If this occurs one of the following error messages
will be displayed:
•
•
48
“P1 LINK DOWN”: The Ethernet link is down.
“WRONG CONFIGURATION”: The reason could be wrong
local or gateway IP addresses.
Gigabit Ethernet Module
If “ARP: PASS” is displayed, the following parameters are displayed, as in Figure 31.
LOCAL IP: IP address entered in the LOCAL IP field by the user
before the CONNECT F-key was pressed.
GATEWAY: IP address of the gateway.
SUBNET: IP address of the subnet mask.
DNS SERVER: IP address of the DNS server.
Press DETAILS (F4) to display the screen shown in Figure 32. This
screen provides the protocol decode of the messages exchanged
between the test set (SUNSET) and the GATEWAY.
12:03:43
> P1: LINK-UP
>
ST:12:00:00
PAGE:1
SUNSET
ARP req
<----
Laser
<
IP-UP<
ET:000:03:43
GATEWAY
---->
ARP reply
PAGE-UP PAGE-DN SUMMARY
Figure 32 ARP IP Status Details Screen
The following items are displayed in Figure 32:
ST: Indicates when the CONNECT F-key was pressed.
ET: Elapsed time since the CONNECT F-key was pressed.
PAGE: Indicates page number of the displayed screen.
There are three F-keys available:
PAGE-UP (F1) and PAGE-DN (F2): Displays any additional
screens available.
SUMMARY: Returns to the ARP IP Connection/Status screen.
SSMTT-29 and SSMTT-29L
49
2.5.1.1.3 DHCP IP Status
Laser
12:03:43
> P1: LINK-UP
<
>
IP-UP<
IP CONNECTION/STATUS
IP TYPE
:DHCP
VLAN: DISABLED
ARP
: PASS
LOCAL IP
DHCP SERVER
GATEWAY
SUBNET MASK
LEASE TIME
:207.181.199.105
:207.181.199.100
:207.181.199.178
:255.255.255.000
:00:60:00
DETAILS
DISC
Figure 33 DHCP IP Status Summary Screen
Press CONNECT (F4) and the test set will send a DHCP (Dynamic
Host Configuration Protocol) discovery message. The status of
the message is displayed on the DHCP line. It can be one of the
following:
DHCP: in progress; indicates that the connection is not yet
completed.
DHCP: PASS; indicates a successful connection.
DHCP: FAIL; indicates that the connection was not successful;
one of the following error messages will be displayed:
•
•
“P1 LINK DOWN”: The Ethernet link is down.
“DHCP Discovery failed”: There is no response to the DHCP
discovery message sent by the module.
If “DHCP: PASS” is displayed, the following parameters are displayed, as in Figure 33:
LOCAL IP: IP address of the test set assigned by the DHCP
server.
DHCP SERVER: IP address of the DHCP server.
GATEWAY: IP address of the gateway.
SUBNET MASK: Netmask.
LEASE TIME: Duration shown in HH:MM:SS of the IP address
allocation.
50
Gigabit Ethernet Module
Press DETAILS (F4) to display the screen shown in Figure 34. This
screen provides the protocol decode of the messages exchanged
between the test set (SUNSET) and the DHCP SERVER.
12:03:43
> P1: LINK-UP
>
ST:12:00:00
PAGE:1
SUNSET
DHCP disc
<---DHCP req
<---ARP req
<----
Laser
<
IP-UP<
ET:000:03:43
DHCP SERVER
---->
DHCP offer
---->
DHCP ack
---->
ARP reply
PAGE-UP PAGE-DN SUMMARY
Figure 34 DHCP IP Status Detail Screen
The following items are displayed in Figure 34:
ST: Indicates when the CONNECT F-key was pressed.
ET: Elapsed time since the CONNECT F-key was pressed.
PAGE: Indicates page number of the displayed screen.
There are three F-keys available:
PAGE-UP (F1) and PAGE-DN (F2): Displays any additional
screens available.
SUMMARY: Returns to the DHCP IP Connection/Status
screen.
SSMTT-29 and SSMTT-29L
51
2.5.1.2 PING Test
Laser
12:03:43
> P1: LINK-UP
PPP UP<
>
IP-UP<
ST:12:00:00
ET:000:03:43
LOCAL IP:207.181.199.106
PING TEST
DESTINATION IP:207.181.199.178
PING LEN:64
#PINGS:10
PING/SEC:1
PING
: -
Sent
:0
Recv’d :0
Unreach:0
Missing:0
CONTIN
Round Trip (ms)
Crnt
: 0
Avg
: 0
Max/Min: 0/0
<-
->
START
Figure 35 PING Test Screen
Before running a PING test, make sure that you have pressed
CONNECT (F4) in the IP CONNECTION/STATUS screen and
that “IP UP” is displayed.
The screen is the same for all the encapsulation types. Press
START (F4) after configuration to commence testing. Press STOP
(F4) to halt testing. The following items appear in Figure 35:
ST: Indicates when START (F4) was pressed.
ET: Elapsed time since START (F4) was pressed.
LOCAL IP: Displays the LOCAL IP entered in the CONFIGURATION screen, if static IP TYPE has been selected. It displays the
dynamically assigned address if DHCP has been selected in the
CONFIGURATION screen.
DESTINATION IP: Enter the Destination IP address before pressing
START (F4). Refer to Section 2.5.1.1, if you need help entering the
address. If you want to use the gateway press GATEWAY (F1).
#PINGS: Select the number of PINGS to send. The range is 1 to
999999 or continuous. The default value is 10. Refer to Section
2.5.1.1, if you need help entering a number.
PING LEN: Select the PING length to send. The range is 64–1518
bytes; the default is 64. Refer to Section 2.5.1.1, if you need help
entering the length.
PING/SEC: Defines the number of PINGs to send per second
from 1 to 10; the default is 1. Refer to Section 2.5.1.1, if you need
help entering the number.
52
Gigabit Ethernet Module
Press START (F4) and observe the following on the PING line:
PING: –; Indicates the test hasn’t been started.
PING: IN PROGRESS; Indicates the test is not yet completed.
PING: PASS; Indicates at least one echo response has been
received.
PING: FAIL; Indicates that an echo response has not been
received.
PING: ARP FAIL: Indicates that the destination IP address or
Gateway have not responded to the ARP (Address Resolution
Protocol) request.
The bottom part of the screen displays the statistics of the PING
test:
Sent: Indicates the number of PINGs sent to the network.
Recv’d: Indicates the number of correct echo responses received.
Unreach: Indicates the number of echo responses with an unreach flag.
Missing: Indicates the number of echo responses missing.
Round Trip: Indicates the measure of the round trip delay in milli
seconds. This is broken down into the following three measurements:
Crnt: Indicates the current PING round trip delay.
Avg: Indicates the average of all round trip delay.
Max/Min: Indicates both the maximum and minimum values
of round trip delay.
SSMTT-29 and SSMTT-29L
53
2.5.1.3 Trace Route
Before running TRACE ROUTE, make sure that you have pressed
CONNECT (F4) in the IP CONNECTION/STATUS screen and
that “IP UP” is displayed.
Trace Route sends PING messages to a destination address and
traces these messages across the routers through which they
travel. The screen is shown in Figure 36 and it is the same for all
encapsulation types.
Laser
12:03:43
> P1: LINK-UP
<
>
IP-UP<
ST:12:00:00
ET:000:03:43
LOCAL IP:38.168.47.121
TRACE ROUTE
DESTINATION IP:209.130.76.142
PAGE:1
Hop Type msec
Host Address
1
TTL
98
129.250.2.209
2
TTL
124
129.250.2.246
3
TTL
97
129.250.5.253
4
TTL
115
129.250.4.14
5
TTL
162
129.250.28.52
6
TTL
143
129.250.4.52
START
GATEWAY
<->
Figure 36 Trace Results Screen
Press START (F3) to run the trace after entering a destination
IP address. Press STOP (F3) to stop the trace. Pressing START
restarts the trace and resets ET to zero. Scroll through the results
with PAGE-UP/PAGE-DN. PAGE # indicates the page number of
the currently displayed screen.
The following items are displayed:
ST: Indicates when START was pressed.
ET: Elapsed time since START was pressed.
LOCAL IP: Displays the LOCAL IP entered in the CONFIGURATION screen, if static IP TYPE has been selected. It displays the
dynamically assigned address if DHCP has been selected in the
CONFIGURATION screen. If this address has not yet been assigned, “UNASSIGNED” will be displayed.
DESTINATION IP: Enter the Destination IP address before pressing START (F3). Refer to Section 2.5.1.1 if you need help entering the address. If you wish to use the gateway address, press
GATEWAY (F1). Once the test is running, this parameter can’t be
changed unless STOP (F3) is pressed.
54
Gigabit Ethernet Module
Hop: Displays up to 32 router hops.
Type: Describes the type of hop. It can be the following types:
•
•
•
ECHO: This means that the destination IP has responded.
MISS: This means that a router or destination IP has not responded.
TTL: This means that the ‘Time To Live’ field of the PING
message has been decremented, and successfully passed a
router.
msec: Duration of a hop.
Host Address: This is the responding router’s IP address.
SSMTT-29 and SSMTT-29L
55
2.5.1.4 Echo Response
The Echo Response test runs in background mode when the IP
connection is up. It updates results continuously. However, the
screen is displayed only when ECHO RESPONSE is selected from
GIG E main menu > IP FEATURES. PAGE-UP (F1) and PAGE-DN
(F2) allow scrolling through the available screens.
Note: Make sure that you have pressed CONNECT (F4) in the IP
CONNECTION/STATUS screen and that “IP UP” is displayed.
Laser
12:03:43
> P1: LINK-UP
<
>
IP-UP<
ST:12:00:00
ET:000:03:43
LOCAL IP:38.168.47.121
ECHO RESPONSE
# OF ECHOED IPS: 1
PAGE:1
TIME
PING FROM
TOTAL
12:02:43
206.181.199.105
10
PAGE-UP PAGE-DN
Figure 37 Echo Response Screen
The following items are displayed:
ST: Indicates when CONNECT (F4) was pressed in the IP CONNECTION/STATUS screen.
ET: Elapsed time since CONNECT (F4) was pressed in the IP
CONNECTION/STATUS screen.
LOCAL IP: If static IP TYPE is selected, then this is entered in
the IP CONNECTION/STATUS screen. If DHCP is selected, then
the address is assigned dynamically by the network.
# OF ECHOED IPS: Indicates the number of different IP addresses
which sent PINGs to the test set.
PAGE: Indicates the currently displayed page number.
TIME: This is the timestamp of the first PING received from the
associated IP address.
PING FROM: This is the IP address that sent the PING.
TOTAL: Indicates total number of PINGs received from the associated IP address.
56
Gigabit Ethernet Module
2.5.1.5 Throughput Test/Setup
The IP Throughput test allows running a Layer 3 BERT. Use it when
the route is through a gateway and the source and destination IP
addresses are not located in the same subnet.
This menu contains two items:
•
•
TEST CONFIGURATION
TEST RESULTS
Notes
• Make sure that you have pressed CONNECT (F4) in the IP CONNECTION/STATUS screen and that “IP UP” is displayed.
• The test set will not respond to ARP requests or PINGs when it
is in IP THROUGHPUT TEST. For this reason, we recommend
that you first PING your intended destination IP address as
explained in Section 2.5.1.2 before proceeding with this test.
2.5.1.5.1 Test Configuration
12:03:43
> P1: LINK-UP
>
Laser
<
IP-UP<
IP THROUGHPUT TEST CONFIGURATION
TRAFFIC TYPE :
IP
TEST PATTERN :
FRAME LENGTH :
BANDWIDTH
:
SEQUENCE #
:
DESTINATION IP:
2e31
64
98.99%
ENABLE
0 .0 .0
SELECT
NORMAL
.0
INVERT
Figure 38 IP Throughput Test Configuration Screen
Configure the following:
TRAFFIC TYPE
Options: Fixed at IP (Layer 3)
TEST PATTERN
Options: 2e31, 2e23, 2e20, 2e15, 2e11, 2e9, 1111, 1010, 0000,
or USER
Use the procedure in Section 2.3.1-TEST PATTERN to make
your selection.
SSMTT-29 and SSMTT-29L
57
FRAME LENGTH
Options: 64 to 1518, default is 64 bytes
Enter a Frame Length by pressing SHIFT and using the numeric
keys along with <- (F2) and -> (F3). Refer to Section 2.5.1.1, if
you need help entering a number.
BANDWIDTH
Options: 0 to 100% in 0.01% steps
Set the frame transmission speed. Refer to Section 2.5.1.1 if you
need help entering a percentage.
SEQUENCE #
Options: ENABLE (F1), DISABLE (F2), default is DISABLE
If enabled, a sequence number will be inserted in the payload
of each frame. The sequence number will allow you to detect
the number of lost frames. This is a Sunrise proprietary feature
and a frame loss count can only be detected when the BERT is
running between two SSMTT-29 modules with SEQUENCE #
enabled on each side.
DESTINATION IP
Enter the destination IP address. Refer to Section 2.5.1.1 if you
need help entering a number.
Note: You may control the test duration in MEASUREMENTS
SETUP.
When ready press ENTER and the STATUS screen is displayed.
2.5.1.5.2 Test Results
These screens can be accessed by the main menu or by pressing
START in the configuration screen. There are 6 screens of results.
They are: STATUS, SUMMARY, ALARM, FRAME, BANDWIDTH,
and EVENTS. For a description of each of these results screens,
refer to Section 2.3.2.
Note: If at the start of testing the test set displays; “DESTINATION
IP NOT RESPONDING”. Then the test set is indicating that the
destination IP or Gateway did not respond to the ARP request.
58
Gigabit Ethernet Module
2.5.2 Roundtrip Delay
This measurement is performed only if there is a loop or another
test set in loopback at the far end. To configure the test set for
loopback, see Section 2.2.
Prior to starting the measurement, the test set will verify the loop
at the far end. If a loopback is not detected, the test is aborted.
For the roundtrip delay measurement you can choose to send
Layer 1, 2, or 3 frames. For further information on frame layers,
refer to Section 2.3.1. The frame rate is 1 per second.
When the frames are received back through the loop, the test set
will compare the time stamp with its local clock and display the
roundtrip delay.
Figure 39 shows the three configuration screens.
12:03:43
> P1: LINK-UP
>
ROUNDTRIP DELAY
Laser
<
<
FRAME LENGHT: 64
# OF FRAMES : 1
FORMAT : LAYER 1
12:03:43
> P1: LINK-UP
>
ROUNDTRIP DELAY
Laser
<
<
FRAME LENGHT: 1518
# OF FRAMES : 1
FORMAT : LAYER 2
MAC SRC: 00-D0-DD-06-05-81
MAC DST: 00-00-00-00-00-00
VLAN: ENABLED
P: 0
VID: 0
LAYER 1 LAYER 2 LAYER 3
START
����������������������������
LAYER 1 LAYER 2 LAYER 3
START
����������������������������
12:03:43
> P1: LINK-UP
>
ROUNDTRIP DELAY
FRAME LENGHT: 1518
# OF FRAMES : 1
FORMAT : LAYER 3
MAC SRC: 00-D0-DD-06-05-81
MAC DST: 00-00-00-00-00-00
VLAN: ENABLED
P: 0
VID: 0
IP SRC : 0 .0 .0 .0
IP DST : 0 .0 .0 .0
LAYER 1 LAYER 1 LAYER 1
Laser
<
<
START
����������������������������
Figure 39 Roundtrip Delay Configuration Screens
Note: To enter numbers, press SHIFT and use the numeric keys.
Depending on the entry field, the <-, and -> cursor movement
keys may be available, use them to move within the field when
the SHIFT key is active.
Configure the following:
SSMTT-29 and SSMTT-29L
59
FRAME LENGTH
Options: 64 to 1518 bytes or jumbo frame (up to 2032 bytes)
Enter the desired test Frame Length.
# OF FRAMES
Options: 1 to 999 or CONTINU (F1)
Enter the desired # of Frames.
FORMAT
Options: LAYER 1 (F1), LAYER 2 (F2), LAYER 3 (F3)
Select the test frame format. For further information on frame
layers, refer to Section 2.3.1.
MAC SRC and MAC DST
Enter the MAC address source (local hardware address) and
the destination MAC address (remote device hardware address).
These parameters are displayed only if FORMAT LAYER 2 or 3
is selected.
VLAN
DISABLED (F1), ENABLED (F2)
Select if the test frames need to carry VLAN tags. This parameter
is displayed only if FORMAT LAYER 2 or 3 is selected.
If enabled, enter the P (Priority) and VID (VLAN ID) parameters.
For further information on P and VID, refer to Section 2.3.1-# OF
VLAN.
IP SRC and IP DST
Select the IP address source (local network layer address) and
the destination IP address (network layer address of the remote
device). This parameter is displayed only for if FORMAT LAYER
3 is selected.
When ready, press START (F4) and the test set verifies that the
circuit is in a looped state by running a BERT. This is indicated on
screen by “LOOPBACK VERIFICATION PLEASE WAIT...”.
If the loop verification fails, the test set indicates this by displaying
“NO LOOPBACK DETECTED TEST ABORTED”. If this occurs,
press ESC and verify your circuit.
After a positive loop verification the screen shown in Figure 40
is displayed.
60
Gigabit Ethernet Module
12:03:43
> P1: LINK-UP
>
ROUNDTRIP DELAY
ROUNDTRIP DELAY:
Min:
Max:
Avg:
0.00716
0.00716
0.00716
0.00716
Laser
<
<
ms
ms
ms
ms
# LOST FR: 0
# TX
FR: 1
Figure 40 Roundtrip Delay Results Screen
The following is reported:
ROUNDTRIP DELAY: The top line indicates the current delay, the
next lines indicate the Minimum, Maximum, and Average delay.
The average is for the current length of the test.
# LOST FR: This indicates the number of lost frames during the
period of the test.
#TX FR: This indicates the number of transmitted frames during
the test.
When done, press ESC.
SSMTT-29 and SSMTT-29L
61
2.5.3 Bandwidth Sweep
This test generates a ramping traffic flow until lost or flow control
pause frames are detected. At this point the test stops.
This test can be performed only if there is a loop or another test
set in loopback at the far end. To configure a test set for loopback,
see Section 2.2.
To perform this test, select from the GIG E main menu, ADVANCED
FEATURES > BANDWIDTH SWEEP. The following screens can
be displayed, depending on the FORMAT setting.
Laser
12:03:43
> P1: LINK-UP
<
>
<
BANDWIDTH SWEEP
FRAME LENGTH: 64
BANDWIDTH START:1 % STOP:100%
STEP:1 %
STEP DURATION:2 s
PAUSE FRAME DETECTION:ENABLED
LOSS FRAME DETECTION :ENABLED
FORMAT : LAYER 1
LAYER 1 LAYER 2 LAYER 3
START
Laser
12:03:43
> P1: LINK-UP
<
>
<
BANDWIDTH SWEEP
FRAME LENGTH: 64
BANDWIDTH START:1 % STOP:100%
STEP:1 %
STEP DURATION:2 s
PAUSE FRAME DETECTION:ENABLED
LOSS FRAME DETECTION :ENABLED
FORMAT : LAYER 2
MAC SRC: 00-D0-DD-06-05-81
MAC DST: 00-00-00-00-00-00
VLAN: ENABLED P:0
VID:0
LAYER 1 LAYER 2 LAYER 3
START
Laser
12:03:43
> P1: LINK-UP
<
>
<
BANDWIDTH SWEEP
FRAME LENGTH: 64
BANDWIDTH START:1 % STOP:100%
STEP:1 %
STEP DURATION:2 s
PAUSE FRAME DETECTION:ENABLED
LOSS FRAME DETECTION :ENABLED
FORMAT : LAYER 3
MAC SRC: 00-D0-DD-06-05-81
MAC DST: 00-00-00-00-00-00
VLAN: ENABLED P:0
VID:0
IP SRC : 0 .0 .0 .0
IP DST : 0 .0 .0 .0
LAYER 1 LAYER 2 LAYER 3
START
Figure 41 Bandwidth Sweep Configuration Screens
Note: To enter numbers, press SHIFT and use the numeric keys.
Depending on the entry field, the <-, and -> cursor movement
keys may be available, use them to move within the field when
the SHIFT key is active.
Configure the following:
FRAME LENGTH
Options: 64 to 1518 bytes or jumbo frame (up to 12,000 bytes),
default is 64 bytes.
Enter the desired Frame Length.
62
Gigabit Ethernet Module
BANDWIDTH START
Options: 1 to 100%, default is 1%.
Select at what percentage bandwidth utilization the test starts at.
BANDWIDTH STOP
Options: 1 to 100%, default is 100%
Select at what percentage bandwidth utilization the test ends at.
STEP
Options: 1 to 99%, default is 1%.
Select how much bandwidth increases per step.
STEP DURATION
Options: 2 to 99 seconds, default is 2 seconds.
Select the duration of the step in seconds.
PAUSE FRAME DETECTION
Options: ENABLE (F1), DISABLE (F2), default is enabled.
If enabled, the bandwidth sweep will stop when a pause frame is
detected, otherwise if disabled, the sweep will continue.
LOSS FRAME DETECTION
Options: ENABLE (F1), DISABLE (F2), default is enabled.
If enabled, the bandwidth sweep will stop when a lost frame is
detected, otherwise if disabled, the sweep will continue.
FORMAT
Options: LAYER 1 (F1), LAYER 2 (F2), LAYER 3 (F3)
Select the test frame format. For further information on frame
layers, refer to Section 2.3.1.
MAC SRC and MAC DST
Enter the MAC address source (local hardware address) and the destination MAC address (remote device hardware address). These parameters are displayed only if FORMAT LAYER 2 or 3 is selected.
VLAN
DISABLED (F1), ENABLED (F2)
Select if the test frames need to carry VLAN tags. This parameter
is displayed only if FORMAT LAYER 2 or 3 is selected.
If enabled, enter the P (Priority) and VID (VLAN ID) parameters. For
further information on P and VID, refer to Section 2.3.1-# OF VLAN.
IP SRC and IP DST
Select the IP address source (local network layer address) and
the destination IP address (network layer address of the remote
device). These parameters are displayed only for if FORMAT
LAYER 3 is selected.
SSMTT-29 and SSMTT-29L
63
When ready, press START (F4) and the test set verifies that the
circuit is in a looped state. This is indicated on screen by “LOOPBACK VERIFICATION PLEASE WAIT...”.
If the loop verification fails, the test set indicates this by displaying
“NO LOOPBACK DETECTED TEST ABORTED”. If this occurs,
press ESC and verify your circuit.
After a positive loop verification, a screen is displayed showing the
progress of the test, a Layer 1 example is shown in Figure 42.
Laser
12:03:43
> P1: LINK-UP
<
>
<
BANDWIDTH SWEEP
ST:22:07:22
ET:000:01:35
FORMAT-LAYER 1 FRAME LENGTH-64
TEST BANDWIDTH FROM- 1 % TO-100%
STEP-1 %/2 s
TEST RUNNING
1%
26%
100%
Laser
12:03:43
> P1: LINK-UP
<
>
<
BANDWIDTH SWEEP
ST:22:07:22
ET:000:01:35
FORMAT-LAYER 1 FRAME LENGTH-64
TEST BANDWIDTH FROM- 1 % TO-100%
STEP-1 %/2 s
TEST COMPLETED
1%
100%
TX RATE: 260 Mbps UTIL:
RX RATE: 260 Mbps UTIL:
#FLOW CONTROL:0
#LOST FRAMES :0
TX RATE: 1000 Mbps UTIL: 100%
RX RATE: 1000 Mbps UTIL: 100%
#FLOW CONTROL:0
#LOST FRAMES :0
26%
26%
STOP
������������
PRINT
STORE
START
��������������
Figure 42 Sample Bandwidth Sweep Screens
During the test, you may press STOP (F4) at any time to stop the
test. Once pressed, STOP is replaced by START. Press START
to restart the test and reset the ET counter to 0.
The following information is displayed in all Layer screens:
ST: Start Time of the test.
ET: Elapsed Time since START was pressed.
FORMAT: The Layer selected in the configuration screen.
FRAME LENGTH: The Frame Length selected in the configuration screen.
TEST BANDWIDTH FROM x% TO x%: The Bandwidth Start and
Stop settings selected in the configuration screen.
STEP-x %/x s: The Step percentage over the step duration in
seconds selected in the configuration screen.
TEST RUNNING/TEST COMPLETED: Indicates the status of the
test along with the progress bar.
TX RATE: Transmit Rate in Mbps.
TX UTIL: Percentage of Transmit Utilization.
RX RATE: Receive Rate in Mbps.
RX UTIL: Percentage of Receive Utilization.
64
Gigabit Ethernet Module
#FLOW CONTROL: If a Flow Control frame is received, the test
stops. If Pause Frame Detection has been disabled in the configuration screen, then this will not be shown.
#LOST FRAMES: If a Lost frame occurs, the test stops. If Loss
Frame Detection has been disabled in the configuration screen,
then this will not be shown.
After the test is completed, the following F-keys are available:
PRINT (F2): Press to send the results to the serial port for printing, refer to Section 2.8.
STORE (F3): Press to store your results, refer to Section 2.8.
START (F4): Press to restart the test, along with resetting the
ET counter.
SSMTT-29 and SSMTT-29L
65
2.5.4 RFC2544
This menu contains the following:
•
•
•
•
•
SELECT FRAME FORMAT
SELECT FRAME LENGTH*
SELECT TEST SEQUENCE*
RUN TEST
VIEW/PRINT RESULTS, see your test set user manual.
Note*: These are shortcuts to their respective configuration
screens.
2.5.4.1 Select Frame Format
12:03:43
> P1: LINK-UP
>
RFC2544 FRAME FORMAT
TEST
Laser
<
<
12:03:43
> P1: LINK-UP
>
RFC2544 FRAME FORMAT
Laser
<
<
TEST
: LAYER 2
MAC SRC: 00-00-00-00-00-00
MAC DST: 00-00-00-00-00-00
VLAN: ENABLED
P: 0
VID: 0
: LAYER 1
LAYER 1 LAYER 2 LAYER 3
NEXT
LAYER 1 LAYER 2 LAYER 3
12:03:43
> P1: LINK-UP
>
RFC2544 FRAME FORMAT
NEXT
Laser
<
<
TEST
: LAYER 3
MAC SRC: 00-00-00-00-00-00
MAC DST: 00-00-00-00-00-00
VLAN: ENABLED
P: 0
VID: 0
IP SRC : 0 .0 .0 .0
IP DST : 0 .0 .0 .0
LAYER 1 LAYER 2 LAYER 3
NEXT
Figure 43 RFC2544 Frame Format Screen
Notes
• Use the SHIFT and numeric keys to enter a number.
• A highlighted YES or NO indicates the state of the selection.
Configure the following:
TEST
Options: LAYER 1 (F1), LAYER 2 (F2), LAYER 3 (F3)
Select the test frame format. For further information on frame
layers, refer to Section 2.3.1.
66
Gigabit Ethernet Module
MAC SRC and MAC DST
Enter the MAC address source (local hardware address) and
the destination MAC address (remote device hardware address).
These parameters are displayed only if TEST LAYER 2 or 3 is
selected.
VLAN
DISABLED (F1), ENABLED (F2)
Select if the test frames need to carry VLAN tags. This parameter
is displayed only if TEST LAYER 2 or 3 is selected.
If enabled, enter the P (Priority) and VID (VLAN ID) parameters. For
further information on P and VID, refer to Section 2.3.1-# OF VLAN.
IP SRC and IP DST
Select the IP address source (local network layer address) and
the destination IP address (network layer address of the remote
device). This parameter is displayed only if TEST LAYER 3 is
selected.
When done, press NEXT (F4).
2.5.4.2 Select Frame Length
12:03:43
> P1: LINK-UP
>
RFC2544 FRAME LENGTH
64
128
256
512
1024
1280
1518
:
:
:
:
:
:
:
YES
YES
YES
YES
YES
YES
YES
YES
-
Laser
<
<
NO
NO
NO
NO
NO
NO
NO
NO
NEXT
Figure 44 RFC2544 Frame Length Selection Screen
Select the Ethernet frame length using the up/down cursor key and
YES (F2) or NO (F3), the default is for all to be selected-YES.
If a frame length is selected (YES), the RFC2544 test sequence will
be executed for this frame length. If a frame length is not selected
(NO), the RFC2544 test sequence will skip this frame length.
When done, press NEXT (F4).
SSMTT-29 and SSMTT-29L
67
2.5.4.3 Select Test Sequence
12:03:43
> P1: LINK-UP
>
RFC2544 TEST SEQUENCE
Laser
THROUGHPUT MEASUREMENT:
LATENCY MEASUREMENT
:
FRAME LOSS RATE
:
BURSTABILITY
:
USER THRESHOLD
:
-
YES
NO
YES
YES
YES
YES
YES
<
<
NO
NO
NO
NO
NO
EDIT
Figure 45 RFC2544 Test Sequence Selection Screen
In this screen select a test sequence and choose whether or not
to run it by pressing YES (F2) or NO (F3) or press EDIT (F4) to
configure the selected test. The first measurement is:
THROUGHPUT MEASUREMENT: This measurement is designed
to determine the maximum frame rate that does not have any lost
frames. Press EDIT (F3) to adjust the test parameters shown in
the following figure:
12:03:43
Laser
12:03:43
> P1: LINK-UP
<
<
>
THROUGHPUT TEST CONFIGURATION
START BANDWIDTH:100.0 %
RESOLUTION
:1.0 %
DURATION
:10 s
NEXT
Figure 46 Throughput Test Configuration Screen
START BANDWIDTH
Options: 1.0 through 100%
Indicates the starting point for the binary search algorithm.
68
Gigabit Ethernet Module
RESOLUTION
Options: 1.00 or 0.1%
Indicates the resolution of the Throughput Bandwidth in the binary
search algorithm.
DURATION
Options: 1 to 999 seconds
Indicates the duration of each step of the binary search algorithm.
When finished, press NEXT (F4) to adjust the next measurement,
or press ESC to select the next measurement.
The next measurement shown in Figure 45 is:
LATENCY MEASUREMENT: Latency measures the time it takes
for the test frame to pass through the device under test. The latency of each frame is measured. Press EDIT (F3) to adjust the
test parameters shown in the following figure:
12:03:43
Laser
12:03:43
> P1: LINK-UP
<
<
>
LATENCY TEST CONFIGURATION
BANDWIDTH : THROUGHPUT
DURATION : 60 s
THRUPUT CUSTOM
NEXT
Figure 47 Latency Test Configuration Screen
BANDWIDTH
Options: THRUPUT (F1), CUSTOM (F2)
Determine the bandwidth the latency test will be done
•
•
THRUPUT: Indicates that the latency test will be done at the
Throughput bandwidth as determined during the Throughput test.
CUSTOM: Enter the bandwidth between 100 and 0.1% at
which the test will be performed.
DURATION
Options: 1 through 999 seconds, default is 60 s
Adjust the length of the test.
SSMTT-29 and SSMTT-29L
69
When finished, press NEXT (F4) to adjust the next measurement,
or press ESC to select the next measurement.
The next measurement shown in Figure 45 is:
FRAME LOSS RATE: The frame loss rate test generates a graph
that shows the frame loss rate as a function of the frame rate. The
test begins at the starting rate (usually 100%), sends a number of
frames, and then calculates the frame loss rate as a percentage
based on the following equation: [(Input count – output count ) x
100]/(Input count). For Example: If 10000 frames were sent, but
only 9800 were received, the frame loss rate would be: [(10000
- 9800) x 100]/(10000)=2.00%. After calculating the frame loss at
a given throughput rate, the throughput is reduced by the specified
step size (no greater than 10%) and repeated.
To adjust the parameters for this test, you must press NEXT (F4)
in the Latency Test Configuration screen shown in Figure 47. The
parameters are shown in the following figure:
Note: This test will be available in a later software release.
12:03:43
> P1: LINK-UP
>
FRAME LOSS RATE
Laser
<
<
CONFIGURATION
START BANDWIDTH: 100.0 %
STEP SIZE
: 1 %
DURATION
: 10 s
NEXT
Figure 48 Frame Loss Rate Configuration Screen
START BANDWIDTH
Options: 1.0 through 100%
Determine the starting point for the test.
STEP SIZE
Options: 1 to 20% , default is 10.00%
Determine the step for the next bandwidth to be tested. After
testing at a frame rate, the test will reduce the frame rate by the
specified step size. Smaller step sizes will greatly increase the
overall duration of the test while increasing the resolution.
70
Gigabit Ethernet Module
DURATION
Options: 1 to 999 seconds
Determine the step duration.
When finished, press NEXT (F4) to adjust the next measurement,
or press ESC to select the next measurement.
The next measurement shown in Figure 45 is:
BURSTABILITY: The back-to-back frames, or burstability is designed to determine the maximum number of frames that can be
sent at 100% bandwidth, with minimum inter-frame gap, before
a frame is lost.
To adjust the parameters for this test, you must press NEXT (F4)
in the Latency Test Configuration screen shown in Figure 48. The
parameters are shown in the following figure:
Note: This test will be available in a later software release.
12:03:43
12:03:43
> P1: LINK-UP
>
BURSTABILITY
Laser
<
<
START LENGTH: 2 s
RESOLUTION : 0001.00 ms
ITERATION
: 10
s
ms
NEXT
Figure 49 Burstability Test Configuration Screen
START LENGTH
Options: s (F1) = 1 to 60 seconds, ms (F2) 1.00 to 999.99 milliseconds
Enter the length of the first burst of frames in seconds or milliseconds.
RESOLUTION
Options: 1s to 0.01ms
After the initial test, if at least one frame is lost, the test will start
again with a binary search algorithm until the burst length is found
with the resolution specified with this setting.
SSMTT-29 and SSMTT-29L
71
ITERATION
Options: 1 to 999
Define the number of times that each step is repeated.
When finished, press NEXT (F4) to adjust the next measurement,
or press ESC to select the next measurement.
The next measurement configuration shown in Figure 45 is:
USER THRESHOLD: For each frame length you can adjust the
Throughput threshold and the Latency threshold. Use the keypad
cursor keys to select the field to edit.
Throughput threshold can be adjusted between 1 and 100%. If
the result of the throughput test is below the throughput threshold
then the test will fail, if the result of the throughput test is above or
equal to the throughput threshold then the test will pass.
Latency threshold can be adjusted between 99 s and 0.00001 ms.
If the result of the throughput test is below or equal to the latency
threshold then the test will pass, if the result of the throughput test
is above the latency threshold then the test will fail.
The adjustment screen is shown in the following figure:
12:03:43
> P1: LINK-UP
>
USER THRESHOLD
LENGTH
64
128
256
512
1024
1280
1518
THROUGHPUT
100.00%
100.00%
100.00%
100.00%
100.00%
100.00%
100.00%
Laser
<
<
LATENCY
0.10000
0.10000
0.10000
0.10000
0.10000
0.10000
0.10000
ms
ms
ms
ms
ms
ms
ms
NEXT
Figure 50 User Threshold Adjustment Screen
When finished, press NEXT (F4) to return to the RFC2544 Test
Sequence Selection Screen shown in Figure 45.
72
Gigabit Ethernet Module
2.5.4.4 Run Test
When ready to start testing, press ESC to return to the RFC2544
menu screen and select RUN TEST, press ENTER and testing begins
with an on-screen message, “RFC2544 TEST IN PROGRESS!”.
This measurement is performed only if there is a loop, a loopback
plug, or another test set in loopback at the far end. To configure
a test set for loopback, see Section 2.2.
Prior to starting the measurement, the test set will verify the loop
at the far end. If a loopback is not detected, the test is aborted.
At any time during the test you may press ESC, MENU or MODULE to stop the test. A message is displayed asking if you would
like to stop the test, press YES (F1) to stop the test, press NO
(F2) to continue with the test.
If you stop the test, the test set will give you the option of storing
the test results, press YES (F1) to store it, press NO (F2) to not
store the results.
Once testing is completed, the test set indicates this with an onscreen message.
The following tests can produce results if selected in the previous
configuration screens:
•
•
•
•
THROUGHPUT MEASUREMENT
LATENCY MEASUREMENT
FRAME LOSS RATE*
BURSTABILITY*
Note*: These tests will be available in a later software release.
2.5.4.4.1 Throughput Measurement
There are three screens available, Log, Table, and Graph. The
log provides a PASS/FAIL STATUS of each frame length and it’s
RATE. The table provides the frame length’s THROUGHPUT and
STATUS (PASS/FAIL, depending on the USER THRESHOLD
screen settings). The graph gives you a bar graph of the frame
length in a percentage. The three screens contain the following
common F-keys:
TABLE (F1): Displays the table view.
GRAPH (F1 or F2): Displays the graph view.
LOG (F2): Displays the log view.
STORE (F3): Stores the test results, refer to the appropriate
chapter in your test set’s user manual for details. Note that these
stored results are only accessible from the RFC2544 sub-menu
or from the MENU key > FILE Icon. They are not accessible from
the module’s VIEW/PRINT menu described in Section 2.8.
SSMTT-29 and SSMTT-29L
73
START/STOP (F4): Press to restart, press again to stop testing.
The screens are shown in the following figure:
12:03:43
12:03:43
> P1: LINK-UP
>
THROUGHPUT TEST LOG
LENGTH
64
128
256
512
1024
1280
1518
RATE
100.00%
100.00%
50.00%
50.00%
100.00%
100.00%
100.00%
TABLE
GRAPH
Laser
<
<
LENGTH
64
128
256
256
512
512
1024
1280
STATUS
PASS
PASS
FAIL
PASS
PASS
PASS
PASS
STORE
12:03:43
12:03:43
> P1: LINK-UP
>
THROUGHPUT TEST TABLE
START
GRAPH
12:03:43
12:03:43
> P1: LINK-UP
>
THROUGHPUT GRAPH
100%
THROUGHPUT
100.00%
100.00%
100.00%
50.00%
100.00%
50.00%
100.00%
100.00%
LOG
Laser
<
<
STATUS
PASS
PASS
FAIL
PASS
FAIL
PASS
PASS
PASS
STORE
START
Laser
<
<
75%
50%
25%
0%
64
LENGTH=128
TABLE
256
1024
1518
THROUGHPUT=100.00%
LOG
STORE
START
Figure 51 Throughput Measurement Screens
In the THROUGHPUT GRAPH screen shown at the top right of
Figure 51, use the keypad up/down cursor keys to see all of the
data.
In the THROUGHPUT GRAPH screen shown at the bottom of
Figure 51, the cursor is indicated by the triple vertical line. In this
example it’s located at the LENGTH = 128 with a THROUGHPUT
= 100.00%. Move the cursor to show details of other LENGTHs
using the keypad left/right cursor keys.
When done viewing press ESC.
74
Gigabit Ethernet Module
2.5.4.4.2 Latency Measurement
This test presents results in a table format. It’s shown in the following figure:
12:03:43
> P1: LINK-UP
>
LATENCY TABLE
LENGTH
64
128
256
512
1024
1280
1518
RATE
100.00%
100.00%
100.00%
100.00%
100.00%
100.00%
100.00%
Laser
<
<
LATENCY
0.00444ms
0.00065ms
0.02095ms
0.02095ms
0.02095ms
0.02095ms
0.02079ms
STATUS
PASS
PASS
PASS
PASS
PASS
PASS
PASS
STORE
START
Figure 52 Latency Table Screen
The table reports the RATE at which the Latency test was done. It
is reported as a percentage, the LATENCY in milli-seconds (ms)
and a PASS/FAIL STATUS as determined by the settings in the
USER THRESHOLD screen shown in Figure 50.
The screen contains the following F-keys:
STORE (F3): Stores the test results, refer to the appropriate
chapter in your test set’s user manual for details. Note that these
stored results are only accessible from the RFC2544 sub-menu
or from the MENU key > FILE Icon. They are not accessible from
the module’s VIEW/PRINT menu described in Section 2.8 of this
insert.
START/STOP (F4): Press to restart, press again to stop testing.
When done viewing press ESC.
SSMTT-29 and SSMTT-29L
75
2.6 Optical Power Measurement
Note: This screen is displayed only if the plug-in optical transceiver
supports this feature. Some early models of transceiver do not
support this feature.
10:50:10
> P1: LINK-UP
>
Laser
<
ET:000:01:15
OPTICAL POWER MEASUREMENT
WAVELENGTH: 1310 nm
TX POWER
: -5.6
dBm
RX POWER
SATURAT
: -5.6
dBm
8.3
LOS
-3.0
-27.0
Figure 53 Optical Power Measurement Screen
This screen displays the following:
WAVELENGTH: 850 nm, 1310 nm, 1550 nm
TX POWER: Transmitted power value in dBm or HIGH POWER
ALARM/LOW POWER ALARM.
RX POWER: Received power value in dBm.
The bar graph also shows the RX power level on a scale based
on receiver sensitivity. Saturation will be displayed if the received
optical power is above the maximum receiver sensitivity. LOS
(Loss of Signal) will be displayed if the received optical power is
below the minimum receiver sensitivity.
76
Gigabit Ethernet Module
2.7 Measurements Setup
This screen lets you set basic parameters for BERT/Throughput
and IP Throughput measurements. Refer to Figure 54.
12:03:43
> P1: LINK-UP
>
MEASUREMENT SETUP
EVENTS RECORD
ERROR INJECTION
COUNT
TEST DURATION
ENABLE
:
:
:
:
Laser
<
<
ENABLE
BIT
1
CONTINU
DISABLE
Figure 54 Measurements Setup Screen
The following items appear in this screen:
EVENTS RECORD
Options: ENABLE (F1), DISABLE (F2)
•
•
ENABLE (default setting): The events screen will be displayed
or stored/printed in the BERT measurements screen as well
as on the IP features/IP throughput results.
DISABLE: The events screen will not be displayed or stored/
printed in the BERT measurements screen or on the IP features/IP throughput results.
ERROR INJECTION
Options: BIT (F1), CRC (F2), CRC+SYM (F3), BIT RAT (MORE,
F1), CRC RAT (MORE, F2)
Select the type of error to inject during a BER test, when ERR
INJ is pressed.
Notes
• CRC error injection refers to FCS (Frame Check Sequence)
error injection.
• CRC+SYM (Symbol) results in 8B/10B symbol error injection.
SSMTT-29 and SSMTT-29L
77
COUNT/RATE
Options: 1 to 999
Select the number of errors to inject during a BER test, when
ERR INJ is pressed.
•
Use the SHIFT and numeric keys to enter a number.
TEST DURATION
Options: CONTINU (F1), TIMED (F4)
Select continuous or timed testing. If TIMED is selected, you can
set the test duration from 000:01 through 999:59. The three digits
to the left of the semicolon are hours, to the right are minutes.
•
78
To set, press SHIFT and use the numeric keys. Use the <- (F2)
and -> (F3) keys to move the insertion point while the SHIFT
key is active.
Gigabit Ethernet Module
2.8 View/Print Results
You may store up to 20 different results to view or print at a later
time. To store results, use the procedure in Section 2.8.1.
Note: This VIEW/PRINT RESULTS menu is different from the
VIEW/PRINT RESULTS menu found in ADVANCED FEATURES
> RFC2544, for more information, see Section 2.5.4
12:03:43
STORED RESULTS
1.
2.
3.
4.
5.
6.
7.
8.
9.
10.
TEST 01
TEST 01
EDIT
VIEW
PRINT
UN/LOCK
CLEAR
more
more
Figure 55 Stored Results Screen
The following F-keys are available.
EDIT (F1): Displays a character entry screen, shown in Figure
56, which allows naming or renaming a stored test, see Sections
2.8.1 and 2.8.6.
VIEW (F1 or F2): Allows viewing of a selected file, see Section
2.8.2.
CLEAR (F2 or F3): Allows deleting an unlocked file, see Section
2.8.4.
PRINT (F3 or more, F1): Allows printing of a selected file, see
Section 2.8.3.
UN/LOCK (F4 or more, F2): Allows locking and unlocking a file,
see Section 2.8.5.
SSMTT-29 and SSMTT-29L
79
2.8.1 Saving a Test
1. From any screen with a STORE F-key, press it and refer to
Figure 55, except in ADVANCED FEATURES > RFC2544. Use
the keypad up/down cursor keys to select an empty line.
3. Press EDIT (F1) to display a character selection screen like
the one shown in Figure 56.
12:03:43
STORED RESULTS
FILENAME: TEST 0
A
K
U
e
o
y
6
B
L
V
f
p
z
7
C
M
W
g
q
8
D
N
X
h
r
/
9
E
O
Y
i
s
0
*
F
P
Z
j
t
1
#
G
Q
a
k
u
2
@
H
R
b
l
v
3
-
I
S
c
m
w
4
J
T
d
n
x
5
INSERT
DELETE
STOP
SAVE
INSERT
DELETE
INPUT
SAVE
Figure 56 Character Selection Screen
4. Press INPUT (F3). Note that the ‘A’ character is highlighted
and the INPUT F-key has changed to STOP.
5. Use the keypad cursor keys to select the desired character.
6. Press ENTER to place the desired character in the label.
Continue this process until the FILENAME label is complete.
You may enter up to 15 characters. If you make a mistake in
the entry:
A. Press STOP (F3).
B. Move the FILENAME cursor to the incorrect character.
C. Press DELETE (F2) to delete the character or, press INSERT (F1) to insert a character.
D. Press INPUT (F3) to select a character. Press ENTER to
insert the new character to the left of the cursor.
7. Press SAVE (F4) to escape the character entry screen and
return to the STORED RESULTS list screen shown in Figure
55.
80
Gigabit Ethernet Module
2.8.2 Viewing a Stored Test
1. From the module main menu, select VIEW/PRINT RESULTS
or press any STORE F-key and refer to Figure 55.
2. Select the desired file with the keypad up/down cursor keys.
3. Press VIEW (F1 or F2) and the stored result will appear.
4. Use the keypad up/down cursor keys to scroll through the
available screens.
5. When finished, press ESC to return to the STORED RESULTS
list screen.
2.8.3 Printing a Stored Test
1. Connect a SunSet printer to the serial port of the test set.
• For other types of printers or for more information, refer to the
Storing and Printing chapter in the test set user’s manual.
2. From the module main menu, select VIEW/PRINT RESULTS
or press any STORE F-key (see Figure 55).
3. Select the desired file with the keypad up/down cursor keys.
4. Press PRINT (F3 or more, F1) and the file will begin printing.
5. When finished, press ESC to return to the STORED RESULTS
list screen.
2.8.4 Deleting a Stored Test
1. From the module main menu, select VIEW/PRINT RESULTS
or press any STORE F-key (see Figure 55).
2. Select the desired file with the keypad up/down cursor keys.
3. Press CLEAR (F2 or F3) and the file is deleted if unlocked.
2.8.5 Locking and Unlocking a Stored Test
1. From the module main menu, select VIEW/PRINT RESULTS
or press any STORE F-key (see Figure 55).
2. Select the desired file with the keypad up/down cursor keys.
3. Press UN/LOCK (F4 or more, F2) and the file is locked or
unlocked as indicated to the right of the file name. Refer to
the lock icon shown in Figure 55.
2.8.6 Renaming a Stored Test
1. From the module’s main menu, select VIEW TEST RESULT.
2. Select the desired file with the keypad up/down cursor keys.
• Press UN/LOCK (more, F2) if the file is locked as indicated by
the lock icon as in Figure 55.
3. Press EDIT (F1) and a character screen like the one shown
in Figure 56 is displayed.
4. Follow the procedure in Section 2.8.1 from step 4.
SSMTT-29 and SSMTT-29L
81
3 Applications
3.1 Layer 1 Bit Error Rate Test (BERT)
In a Layer 1 environment as illustrated in Figure 57 you can run
a layer 1 BERT between two test sets, or between a test set and
a far end loop. Use this procedure.
1. Connect PORT 1 to the circuit as in Figure 57.
• If you are using an 850 nm optical transceiver, then use the
SA561 patch cord.
• If you are using either a 1310 or 1550 nm optical transceiver
then use the SA562 patch cord.
���������
�������
��������
���������
�������
��������
��
����
Figure 57 Layer 1 BER Testing Setup
82
Gigabit Ethernet Module
2. Turn on the test set. The module automatically negotiates with
the link partner device to bring the link up. Refer to the top line
of the screen for information on the status of Port 1 or to the
LED on the module.
3. From the GIG E main menu, select CONFIGURATION and
configure as follows:
OPERATION: P-TO-P
START-UP: QUICK, MENU, or CONFIG
• For one button testing, select QUICK. After test set boot up, the
BER test will start and the results screen will be displayed.
• For expert use, select CONFIG (the test set will boot up on
the BER test configuration screen).
• For other applications, select MENU (the test set will boot up
on the module main menu screen).
AUTO-NEGO: ENABLE (recommended setting)
PAUSE: ENABLE (recommended setting)
ASM PAUSE: ENABLE (recommended setting)
4. Press ESC and from the GIG E main menu, select BERT/
THROUGHPUT > BERT CONFIGURATION and configure
the BER test as follows:
TEST: LAYER 1
TEST PATTERN: Select the test pattern for the BER test.
FRAME LENGTH: Select the appropriate frame length.
TRAFFIC SHAPING: Select the type of traffic shaping and
press EDIT (F4) to select the peculiar parameters of the traffic
shaping. Press SAVE (F4) when done.
SEQUENCE #: As required.
Note: Refer to Section 2.3.1 for details on these settings.
5. Press ESC and from the BERT/THROUGHPUT menu, select
MEASUREMENTS or QUICK TEST. Press ENTER to start the
BERT.
Note: Refer to Sections 2.3.2 and 2.3.3 for interpretation of
the results.
6. Instead of configuring each test set individually, you may
configure test set 1 for loopback mode and configure test
set 2 for the BERT using steps 4 and 5. For loopback mode
configuration, refer to Section 3.4.
SSMTT-29 and SSMTT-29L
83
3.2 Layer 2 Bit Error Rate Test (BERT)
In a Layer 2 environment, as shown in Figure 58, you can run
a BERT between two test sets. Layer 2 devices (switches) keep
track of MAC address information in order to forward traffic to the
appropriate port, therefore each test set has to be configured with
valid source and destination MAC address.
1. Connect PORT 1 to the circuit as in Figure 58.
• If you are using an 850 nm optical transceiver, then use the
SA561 patch cord.
• If you are using either a 1310 or 1550 nm optical transceiver
then use the SA562 patch cord.
���������
�������
������
��������
���������
����������
���������
�������
������
��������
���������
����������
Figure 58 Layer 2 BERT Setup
2. Turn on each test set. Each test set automatically negotiates
with the link partner device to bring the link up. Refer to the
top line of each screen for information on the status of Port 1
or to the LED on each module.
84
Gigabit Ethernet Module
3. From the GIG E main menu select CONFIGURATION and
configure each test set as follows:
OPERATION: P-TO-P
START-UP: QUICK, MENU, or CONFIG
• For one button testing, select QUICK. After test set boot up, the
BER test will start and the results screen will be displayed.
• For expert use, select CONFIG (the test set will boot up on
the BER test configuration screen).
• For other applications, select MENU (the test set will boot up
on the module main menu screen).
AUTO-NEGO: ENABLE (recommended setting)
PAUSE: ENABLE (recommended setting)
ASM PAUSE: ENABLE (recommended setting)
4. Press ESC and from the GIG E main menu, select BERT/
THROUGHPUT > BERT CONFIGURATION and configure
the BER test for each test set as follows:
TEST: LAYER 2
# OF MAC ADDRS: Select the number of MAC addresses to
be used for the test (up to 64) and press EDIT (F1) to enter
the MAC address values. MAC addresses should follow this
rule:
• MAC address source of test set 1 equals the MAC address
destination of test 2.
• MAC address source of test set 2 equals the MAC address
destination of test set 1.
# OF VLAN: Enter a number only if VLAN tagging is required
on your network, otherwise keep this value at zero.
TEST PATTERN: Select the test pattern for the BER test.
FRAME LENGTH: Select the appropriate frame length.
TRAFFIC SHAPING: Select the type of traffic shaping and
press EDIT (F4) to select the peculiar parameters of the traffic
shaping. Press SAVE (F4) when done.
SEQUENCE #: As required
5. Press ESC and from the BERT/THROUGHPUT menu, select
MEASUREMENTS or QUICK TEST. Press ENTER to start the
BERT.
Note: Refer to Sections 2.3.2 and 2.3.3 for interpretation of
the results.
6. Instead of configuring each test set individually, you may
configure test set 1 for loopback mode and configure test
set 2 for the BERT using steps 4 and 5. For loopback mode
configuration, refer to Section 3.4.
SSMTT-29 and SSMTT-29L
85
3.3 IP Throughput Layer 3 BERT-Indirect Routing
In a Layer 3 environment, as shown in Figure 59 where the test
sets are located in different networks, indirect routing through a
gateway must be used. In this case, you will run an IP Throughput
test. This configuration is referred to as indirect routing because
test set 1 cannot transmit traffic directly to test set 2, traffic in this
case is being routed by the gateway(s).
1. Connect PORT 1 to the circuit as in Figure 59.
• If you are using an 850 nm optical transceiver, then use the
SA561 patch cord.
• If you are using either a 1310 or 1550 nm optical transceiver
then use the SA562 patch cord.
���������
�������
������
��������
���������
��������
�
�������
�������
������
��������
���������
���������
��������
�
Figure 59 Layer 3 BERT-Indirect Routing Setup
2. Turn on each test set. Each test set automatically negotiates
with the link partner device to bring the link up. Refer to the
top line of each screen for information on the status of Port 1
or to the LED on each module.
86
Gigabit Ethernet Module
3. From the GIG E main menu, select CONFIGURATION and
configure each test set as follows:
OPERATION: P-TO-P
START-UP: QUICK, MENU, or CONFIG
• For one button testing, select QUICK. After test set boot
up, the BER test will start and the results screen will be
displayed.
• For expert use, select CONFIG (the test set will boot up
on the BER test configuration screen).
• For other applications, select MENU (the test set will boot
up on the module main menu screen).
AUTO-NEGO: ENABLE (recommended setting)
PAUSE: ENABLE (recommended setting)
ASTM PAUSE: ENABLE (recommended setting)
4. Press ESC and from the GIG E main menu, select ADVANCED
FEATURES > IP FEATURES > IP CONNECTION/STATUS
and select either DHCP or STATIC, as described in Section
2.5.1.1. When ready, press CONNECT (F4).
5. When the connection is successful (IP UP), press ESC and
select from the IP FEATURES menu, PING TEST. At the DESTINATION IP line, enter the IP address of the remote test set
(Test Set 2) in order to verify end-to-end connectivity.
6. If “PING: PASS” is displayed, press ESC and from the IP FEATURES menu select THROUGHPUT TEST/SETUP > TEST
CONFIGURATION and enter the test parameters.
• If “PING: PASS” is not displayed, check the entered IP address.
7. When ready, press ENTER to start the test and view the
results. Refer to Sections 2.3.2 and 2.3.2 for interpretation of
the results.
SSMTT-29 and SSMTT-29L
87
3.4 Loopback Mode
The loopback feature is particularly useful when running a dual
ended test, it allows controlling the tests (BERT/Throughput,
Roundtrip delay, and Bandwidth sweep measurements) from one
test set (test set 2), while having the remote test set (test set 1)
looping back the test frames.
����������������������������������������
������������������
���������
���������
�������
���������
���������
��������������������������������������������
Figure 60 Loopback Mode
There are two possible configurations for the loopback feature:
•
Manual Mode
In this mode the test set will loopback all incoming frames as
soon as this mode is selected.
•
Controller/Responder Mode
In this mode, a test set setup as a controller will send a loop
up command to a test set setup as a responder. The responder
will then start looping all incoming frames. The responder will
continue doing this until a loop down frame is received from
the controller.
88
Gigabit Ethernet Module
Note: There is no standard looping code for Ethernet, the test
set uses Sunrise proprietary loop up and loop down frames.
Hence this setup requires Sunrise equipment at both ends of
the circuit.
In manual or controller/responder mode, the test set will adapt the
loopback mechanism to your network configuration as follows:
•
•
If your network configuration is similar to the one depicted in
Figure 57, the loopback should be configured for Layer 1. In
this configuration the looped test set will retransmit the incoming frames with out modifying them.
If your network configuration is similar to the one depicted in
Figure 58, the loopback should be configured for Layer 2. In
this configuration the looped test set will retransmit the incoming frames and swap the source and destination MAC address
fields.
Notes:
• Layer 2 and Layer 3 loopback mechanism will loop all incoming
unicast traffic and discard multicast and broadcast traffic.
• Use caution when using loopback mode because some network equipment may not allow the loopback of some unicast
frames.
SSMTT-29 and SSMTT-29L
89
3.5 Monitor Mode
Note: This mode is unavailable to the SSMTT-29L module.
1. Monitor mode can be used in the following two configurations:
• Pass Through mode, the test set is inserted between two
devices, and monitors the frames in both directions. Refer to
Figure 61.
��������
�������
��������
���������
���������
���������
���������
��������
�������
��������
Figure 61 Pass Through Mode Connection
•
Splitter mode, the test set is inserted between two devices
using splitters. In this mode you can insert and remove the
test set without interrupting the traffic. Refer to Figure 62.
��������
�������
��������
���������
��������
��������
���������
��������
�������
��������
Figure 62 Splitter Mode Connection
Note: In monitor mode (Pass Through or using a splitter), the
module is nonintrusive, and will not generate traffic (BER or
PING testing).
90
Gigabit Ethernet Module
2. Turn on the test set, press MODULE and from the GIG E main
menu select CONFIGURATION and configure as follows:
OPERATION: MONITOR
3. Press ESC to return to GIG E main menu and make sure that
the link is up on Ports 1 and 2. Refer to the top line of the LCD
screen for information on the status of Ports 1 and 2 or to the
LEDs on the module.
4. From the GIG E main menu, select STATISTICS to view the
statistics on the traffic. Refer to Section 2.4 for interpretation
of the results.
SSMTT-29 and SSMTT-29L
91
4 Reference
4.1 Gigabit Ethernet Overview
Ethernet is a major networking protocol. Of all current networking
protocols, Ethernet provides the greatest cost performance relative
to Token Ring, Fiber Distributed Data Interface (FDDI), and ATM for
desktop connectivity. Gigabit Ethernet provides 1 Gigabit bandwidth
for campus networks with the simplicity of Ethernet at lower cost
than other technologies of comparable speed. It offers a natural
up-grade path for current Ethernet (10/100Base-T) installations.
In order to accelerate speeds from 100 Mbps Fast Ethernet up to
1 Gbps, some changes have been made to the Ethernet physical
interface (see Figure 63). Gigabit Ethernet looks identical to Ethernet from the data link layer up. The challenges involved in accelerating to 1 Gbps have been resolved by merging two technologies
together: IEEE 802.3 Ethernet and ANSI X3T11 Fiber Channel.
�������������������
��������������
������������������
�������������������������
����������������������������
��������������
��������������������
������������������������
������������������������
��������������������
��������������
��������������������
�����������������������
���������
�����������������
�������������������������
Figure 63 Gigabit Ethernet Overview
4.1.1 Gigabit Ethernet Interface
A Gigabit Interface Converter (GBIC) allows configuring each
gigabit port on a port-by-port basis for short-wave (1000 Base-SX)
850 nm, long-wave (1000 Base-LX) 1310 nm, long-haul (1000
Base-LH) 1550 nm.
1000Base-SX (short-wave laser) is supported over multimode
fiber and 1000 Base-LX (long-wave laser) is used on singlemode fiber, because this fiber is optimized for long-wave laser
transmission.
92
Gigabit Ethernet Module
4.1.2 Gigabit Ethernet Frame Format
Gigabit Ethernet uses the standard Ethernet frame format. This
maintains compatibility with the installed base of Ethernet and
Fast Ethernet products, requiring no frame translation.
�
��
��
��
��
��
��
�
�
�
���������������
������������������������
�������������������
������������
�����
����
�
�
�������
�������
��������
��������
��������������
��������
Figure 64 Gigabit Ethernet Frame Format
The following describes the items shown in Figure 64:
Preamble Field + SFD (Start Frame Delimiter): 8 bytes are used
for synchronization. Preamble field is a 7 octets field used to begin
a frame transmission, the SFD field is a 1 byte sequence that follows the preamble and indicates the start of a frame.
The next two fields, Destination MAC Address and Source MAC
Address, share a similar definition. The difference between the
two is that the:
•
•
Destination MAC Address is the Ethernet address of the destination host,
Source MAC Address is the Ethernet address of the source
host.
They both contain 6 bytes and each frame contains two address
fields, the destination address field and the source address field. The
destination address field specifies the device for which the frame is
intended. A destination address of all 1 bits (FF-FF-FF-FF-FF-FF)
refers to all stations on the LAN and is called a ‘broadcast address’.
The source address field specifies the station from which the frame
originated. On a network, the MAC (Media Access Control) address
or Ethernet address is the hardware address of a network device. It
is uniquely assigned by the IEEE (Institute of Electrical and Electronics Engineers). The first three bytes contain a manufacture code, the
last three bytes contain a unique station ID. Manufacturer IDs are
globally assigned (administered) by the IEEE. The MAC address
is a data link layer address, not to be confused with the network
layer address (protocol address: e.g. IP address).
Type/Length: If the value of this 2 byte field is less than or
equal to 1500, then the Length/Type field indicates the number
SSMTT-29 and SSMTT-29L
93
of bytes in the subsequent MAC Data field. If the value of this
field is greater than or equal to 1536, then the Length/Type field
indicates the nature of the MAC client protocol (protocol type e.g.
IP, ARP, RARP, etc).
Data: This (46-1500 byte) field contains the data transferred from
the source station to the destination station or stations.
CRC (Cyclic Redundancy Check): This 4 byte error checking
field checks the integrity of the bits in the frame to make sure that
the frame has arrived intact. The 4-octet cyclic redundancy check
value is computed as a function of the contents of the source address, destination address, length, and data fields.
4.1.2.1 Frame Rate
The Frame Rate (FR) is the number of Frames per second (Fps).
FR is determined by the following formula:
����
��������
�����������������������������
���������������������������������
����
�
�������������
�
� �������������
��������������������
bps: The bits per second rate is the transmit clock frequency. The
maximum clock frequency of 1,000,000,000 bps corresponds to
100 % Bandwidth.
FL: Frame Length from 64 Bytes to 1518 Bytes.
IPG: Inter Packet Gap is the time delay between successive
frames. Ethernet devices must allow a minimum idle period between transmission of frames known as the IPG. It provides a
brief recovery time between frames to allow devices to prepare
for reception of the next frame. The minimum interframe gap is 96
bit times, which is 96 nanoseconds for 1 Gigabit Ethernet.
Preamble: This 56 bit field begins a frame transmission.
SFD: Start of Frame Delimiter (8 bits) is the sequence, 10101011,
that immediately follows the preamble and indicates the start of
a frame.
94
Gigabit Ethernet Module
4.2 Handling of Optical Fiber
Proper handling of optical fiber cables, connectors, and equipment
is important in obtaining accurate measurements and preventing potential transmission problems. This section reviews proper
handling procedures for optical fiber.
������������
����������������
������������
������
����������������
���
���
�������
Figure 65 Optical Connectors and Adapters
4.2.1 Fiber Optic Patch Cord Basics
Fiber optic patch cords come in two categories: Single-mode,
which are yellow and Multi-mode, which are orange. The terms
‘single-mode’ and ‘multi-mode’ describe physical transmission
mechanisms of the fiber and do not refer to the quality of the fiber.
Single-mode and multi-mode transmission equipment are not usually interconnected. Multi-mode is used for shorter transmission
distance and in general is less expensive than single-mode.
Considering the fact that an optical fiber is a strand of glass about
the same diameter as a human hair, fiber optic patch cords and
connectors are remarkably durable. However, careful handling will
ensure continued high performance and long life. Do not pull or
kink patch cords, as the glass strand in the middle might become
damaged or broken.
Even if the fiber is not permanently damaged, a sharp bend will
cause excessive signal loss. Fiber optic cables work by bending
the light signal as it travels. But, the light can only tolerate so much
bending. Keep patch cord bend radii no less than an inch. Use
specialized optical cable raceways and plenums whenever available. Never use tie wraps as you would with electrical cables.
SSMTT-29 and SSMTT-29L
95
4.2.2 Fiber Optic Connectors
����������������
����������������������
�����
����������������������
����������������
���������������
�����
Figure 66 Cross-Sectional View of Connectors
In the electrical world, female connectors are mated to male
connectors. In the optical world, the connection mechanism is
altogether different. Fiber optic connector systems are designed
to align two fiber ends so that the light signal will pass between
them; imagine trying to align two hairs end to end. Modern fiber
optic connector systems solve this nearly impossible task. There
are several types of optical connectors in use today. Figure 65
shows the two most popular, SC and FC. In this example, an SC to
FC bulkhead adapter is used to connect the two fibers together.
In Figure 66, a schematic of the connector cross section demonstrates the details of the connection mechanism. Ceramic ferrules
on the connector ends are kept in alignment by a sleeve in the
connector bulkhead adapter. The fiber itself is mounted in the
exact center of the ferrule. When the ferrules are aligned by the
sleeve, so are the fibers. Springs in the connector bodies provide
consistent pressure so that the two connector end faces are assured to be in contact with each other. Since all tolerances must
be kept extremely tight, it is amazing that the typical connector
signal loss is usually less than a couple tenths of a dB.
When using optical connectors, insert or remove the ferrule
straight into the sleeve. Try to minimize wiggling the connector as
this may loosen the tight fit between the ferrule and sleeve. For
SC connectors, orient the prominent key on the connector body
(Figure 65) with the slot in bulkhead adapter. Push the connector
until it clicks. To remove, pinch the connector body between your
thumb and finger, and gently pull straight out.
FC connectors require more care. Find the small key and orient it
with the equally small slot in the threaded section of the bulkhead
adapter. Even in Figure 65, this key is not very visible. Thread the
outer barrel only lightly finger tight. Never use pliers! Over tightening the barrel will not improve signal transmission and could
96
Gigabit Ethernet Module
cause permanent damage. To remove, unscrew the barrel, and
gently pull straight out.
Most problems with FC connectors are due to key misalignment.
This is difficult to detect since even when the key is misaligned, the
barrel can be threaded, which then hides the misaligned key. A hint
is when the barrel only catches the first one or two threads. Also, the
connector will not be completely seated in the bulkhead adapter.
4.2.3 Cleaning Optical Fiber
Fiber optic connectors must be kept clean to ensure long life and
to minimize transmission loss at the connection point. When not in
use, always replace dust covers and caps to prevent deposits and
films from airborne particles. A single dust particle caught between
two connectors will cause significant signal loss. Even worse, dust
particles can scratch the polished fiber end, resulting in permanent
damage. Do not touch the connector end or the ferrules, since
this will leave an oily deposit from your fingers. Likewise, do not
allow uncapped connectors to drop on the floor.
Should a fiber connector become dirty or exhibit high loss, carefully clean the entire ferrule and end face. Special lint-free pads
should be used with isopropyl alcohol. Even though not very accessible, the end face in a bulkhead adapter on test equipment can
be cleaned by using a special lint-free swab, again with isopropyl
alcohol. In extreme cases, a test unit may require more thorough
cleaning at the factory.
Cotton, paper, or solvents should never be used for cleaning since
they may leave behind particles or residues. Use a fiber optic
cleaning kit especially made for cleaning optical connectors, and
follow the directions. Some kits come with canned air to blow any
dust out of the bulkhead adapters. Be cautious, as canned air can
do more harm than good if not used properly. Again, follow the
directions that come with the kit.
4.2.4 Eye Safety
It is a good safety practice to never look directly into the end of a
fiber or bulkhead adapter. You may be working with equipment that
transmits at high power and are not eye-safe. For added safety, turn
the laser off when not in use. In any case, the wavelengths used in
telecommunications are not visible, so the presence of an optical
signal cannot be determined by looking into the fiber end.
4.2.5 Summary
Take care of your fiber. Always replace dust covers. Keep optical connectors clean and make a practice of not looking into fiber ends.
SSMTT-29 and SSMTT-29L
97
Index
A
Applications
IP Throughput Layer 3 BERT-Indirect Routing; 86
Layer 1 Bit Error Rate Test (BERT); 82
Layer 2 Bit Error Rate Test (BERT); 84
Loopback Mode; 88
Monitor Mode-Pass Through & Splitter; 90
ARP IP Connection/Status Screen; 48
ARP IP Status Details Screen; 49
B
Bandwidth Sweep Configuration Screens
BANDWIDTH START; 63
BANDWIDTH STOP; 63
FORMAT-LAYER 1, 2, & 3; 63
FRAME LENGTH; 62
IP SRC and IP DST; 63
LOSS FRAME DETECTION; 63
MAC SRC and MAC DST; 63
PAUSE FRAME DETECTION; 63
STEP; 63
STEP DURATION; 63
VLAN; 63
Bandwidth Sweep Screens
#FLOW CONTROL; 65
#LOST FRAMES; 65
ET; 64
FORMAT; 64
FRAME LENGTH; 64
RX RATE; 64
RX UTIL; 64
ST; 64
STEP-x %/x s; 64
TEST BANDWIDTH FROM x% TO x%; 64
TEST RUNNING/TEST COMPLETED; 64
TX RATE; 64
TX UTIL; 64
BERT Configuration Screens
#MAC ADDRS; 26
# OF IP ADDRS; 29
# OF MAC ADDRS; 25
# OF VLAN; 26
# VLAN; 27
FRAME LENGTH; 20
98
Gigabit Ethernet Module
BERT Configuration Screens continued
IP SRC and IP DST; 30
MAC SRC and MAC DST; 26
MODE-MANUAL, INCR, & DECR; 25, 29
SEQUENCE #; 24
TEST
LAYER 1, 2 & 3; 18
TEST PATTERN; 19
TRAFFIC SHAPING
BURST; 20
CONST; 20
RAMP; 20
VLAN #1, 2, 3 and so on; 28
BERT Results, Alarm Screen
LOS; 34
LOSS; 34
LOSYNC; 34
LOSyS; 34
OOS; 34
OOSS; 34
BERT Results, Bandwidth Statistics Screen
%BROADCAST; 37
%FLOW CTRL; 37
%MULTICAST; 37
%UNICAST; 37
TOTAL RATE; 37
BERT Results, Events Screen; 38
BERT Results, Frame Screen
#BROADCAST; 35
#FLOW CONTROL; 35
#FRAMES; 35
#MULTICAST; 35
#OVERSIZED; 35
# RUNTS; 35
FPS-Min, Max, & Avg; 35
BERT Results, Frame Screen 2
#FRAMES RX; 36
#LOST FRAMES; 36
#NON TEST FR RX; 36
#OUT OF SEQ FRAMES; 36
#UNICAST RX; 36
%LOST FRAMES; 36
%OUT OF SEQ FRAMES; 37
LOST FPS; 36
OUT OF SEQ FPS; 37
BERT Results, Optical Power Screen; 39
BERT Results, Status Screen
LINE 1; 32
SSMTT-29 and SSMTT-29L
99
BERT Results, Status Screen continued
RX RATE; 32
RX RATE UTIL; 32
TEST; 32
TX RATE; 32
TX RATE UTIL; 32
BERT Results, Summary Screen
BIT; 33
BIT RATE; 33
CRC; 33
CRC RATE; 33
LOS; 33
LOSS; 33
LOSYNC; 33
LOSyS; 33
PATL; 33
PATLS; 33
SYMBOL; 33
SYMBOL RATE; 33
Burstability Test Configuration Screen
ITERATION; 72
RESOLUTION; 71
START LENGTH; 71
Burst Traffic Shaping Screen
BANDWIDTH #1; 23
BANDWIDTH #2; 23
DURATION #1; 23
DURATION #2; 23
C
Cautions; 2
Configuration Screen
ASYM PAUSE; 11
AUTO-NEGO.; 10
OPERATION
MONITOR; 10
P-TO-P; 10
PAUSE; 11
START-UP
CONFIG; 10
MENU; 10
QUICK; 10
Constant Traffic Shaping Screen
BANDWIDTH; 21
IPG; 21
CRC; 94
100
Gigabit Ethernet Module
D
DHCP IP Status Detail Screen; 51
DHCP IP Status Summary Screen; 50
E
Echo Response Screen
# OF ECHOED IPS; 56
ET; 56
LOCAL IP; 56
PAGE; 56
PING FROM; 56
ST; 56
TIME; 56
TOTAL; 56
F
Figures
01 SSMTT-29 Gig E Connector Panel; 5
02 Test Set LED Panels; 7
03 Menu Tree; 8
04 Gig E Main Menu Screens; 9
05 Configuration Screen; 10
06 Loopback Configuration Screens; 13
07 BERT Configuration Screens; 17
08 Layer 1 Frame; 18
09 Layer 2 Frame; 18
10 Layer 3 Frame; 18
11 Constant Traffic Shaping Screen; 21
12 Ramp Traffic Shaping Screen; 22
13 Burst Traffic Shaping Screen; 23
14 MAC Address Editing Screen; 25
15 VLAN Editing Screen; 27
16 VLAN Tag; 27
17 IP Address Editing Screen; 29
18 BERT Results, Status Screen; 32
19 BERT Results, Summary Screen; 33
20 BERT Results, Alarm Screen; 34
21 BERT Results, Frame Screen; 35
22 BERT Results, Frame Screen 2; 36
23 BERT Results, Bandwidth Statistics Screen; 37
24 BERT Results, Events Screen; 38
25 BERT Results, Optical Power Screen; 39
26 Quick Test Results Screen; 40
27 Measurement Monitoring, Status Screen; 42
28 Measurement Monitoring, Statistics Screen; 43
29 Measurement Monitoring, Events Screen; 44
30 IP Connection/Status Screens; 46
SSMTT-29 and SSMTT-29L
101
Figures continued
31 ARP IP Connection/Status Screen; 48
32 ARP IP Status Details Screen; 49
33 DHCP IP Status Summary Screen; 50
34 DHCP IP Status Detail Screen; 51
35 PING Test Screen; 52
36 Trace Results Screen; 54
37 Echo Response Screen; 56
38 IP Throughput Test Configuration Screen; 57
39 Roundtrip Delay Configuration Screens; 59
40 Roundtrip Delay Results Screen; 61
41 Bandwidth Sweep Configuration Screens; 62
42 Sample Bandwidth Sweep Screens; 64
43 RFC2544 Frame Format Screen; 66
44 RFC2544 Frame Length Selection Screen; 67
45 RFC2544 Test Sequence Selection Screen; 68
46 Throughput Test Configuration Screen; 68
47 Latency Test Configuration Screen; 69
48 Frame Loss Rate Configuration Screen; 70
49 Burstability Test Configuration Screen; 71
50 User Threshold Adjustment Screen; 72
51 Throughput Measurement Screens; 74
52 Latency Table Screen; 75
53 Optical Power Measurement Screen; 76
54 Measurements Setup Screen; 77
55 Stored Results Screen; 79
56 Character Selection Screen; 80
57 Layer 1 BER Testing Setup; 82
58 Layer 2 BERT Setup; 84
59 Layer 3 BERT-Indirect Routing Setup; 86
60 Loopback Mode; 88
61 Pass Through Mode Connection; 90
62 Splitter Mode Connection; 90
63 Gigabit Ethernet Overview; 92
64 Gigabit Ethernet Frame Format; 93
65 Optical Connectors and Adapters; 95
66 Cross-Sectional View of Connectors; 96
Frame Loss Rate Configuration Screen
DURATION; 71
START BANDWIDTH; 70
STEP SIZE; 70
G
Gigabit Ethernet Overview
Frame Format; 93
Interface; 92
102
Gigabit Ethernet Module
I
IPG; 94
IP Connection/Status Screens
DNS SERVER; 47
GATEWAY; 47
IP TYPE
DHCP; 47
STATIC; 47
LOCAL IP; 47
SUBNET; 47
VLAN; 47
IP Throughput Test Configuration Screen
BANDWIDTH; 58
DESTINATION IP; 58
FRAME LENGTH; 58
SEQUENCE #; 58
TEST PATTERN; 57
TRAFFIC TYPE; 57
L
Laser On/Off; 9
Latency Table Screen; 75
Latency Test Configuration Screen
BANDWIDTH
CUSTOM; 69
THRUPUT; 69
DURATION; 69
Loopback Configuration Screens
COMMAND
LOOP-DN; 14
LOOP-UP; 14
FORMAT
LAYER 1, 2 & 3; 14
IP DST; 15
IP SRC; 15
MAC DST; 15
MAC SRC; 15
MODE
CONTROL; 13
MANUAL; 13
RESPOND; 13
VLAN; 15
M
Measurements Setup Screen
COUNT/RATE; 78
ERROR INJECTION; 77
SSMTT-29 and SSMTT-29L
103
Measurements Setup Screen continued
EVENTS RECORD; 77
TEST DURATION
CONTINU & TIMED; 78
Measurement Monitoring, Events Screen; 44
Measurement Monitoring, Statistics Screen
#RX; 43
CRC ERRORS; 43
Fps; 43
RX; 43
SIGNAL AS; 43
SIGNAL OFF; 43
SYNCH AS; 43
SYNCH OFF; 43
UTIL; 43
Measurement Monitoring, Status Screen
ET; 43
LINE 1; 43
LINE 2; 43
ST; 43
Menu Tree; 8
Module
LEDs; 6
PORT 1; 6
PORT 2; 6
O
Optical Fiber
Cleaning; 97
Connectors; 96
Eye Safety; 97
Handling; 95
Patch Cord Basics; 95
Optical Power Measurement Screen
RX POWER; 76
TX POWER; 76
WAVELENGTH; 76
P
PING Test Screen
#PINGS; 52
DESTINATION IP; 52
ET; 52
LOCAL IP; 52
Missing; 53
PING/SEC; 52
PING LEN; 52
Recv’d; 53
Round Trip-Crnt, Avg, & Max/Min; 53
104
Gigabit Ethernet Module
PING Test Screen continued
Sent; 53
ST; 52
Unreach; 53
Q
Quick Test Results Screen
BIT; 41
BIT RATE; 41
CRC; 41
CRC RATE; 41
LOS; 41
LOSS; 41
LOST FRM; 41
LOSYNC; 41
LOSyS; 41
RX RATE; 41
RX RATE UTIL; 41
STATUS; 40
SYMBOL; 41
SYMBOL RATE; 41
TX RATE; 41
TX RATE UTIL; 41
R
Ramp Traffic Shaping Screen
START BANDWIDTH; 22
STEP; 22
STEP DURATION; 22
STOP BANDWIDTH; 22
RFC2544 Frame Format Screen
IP SRC and IP DST; 67
MAC SRC and MAC DST; 67
TEST-LAYER 1, 2, & 3; 66
VLAN; 67
RFC2544 Frame Length Selection Screen; 67
RFC2544 Test Sequence Selection Screen; 68
Roundtrip Delay Configuration Screens
# OF FRAMES; 60
FORMAT; 60
FRAME LENGTH; 60
IP SRC and IP DST; 60
MAC SRC and MAC DST; 60
VLAN; 60
Roundtrip Delay Results Screen
#TX FR; 61
# LOST FR; 61
ROUNDTRIP DELAY; 61
SSMTT-29 and SSMTT-29L
105
S
SFD; 94
T
Tables
01 Cables; 6
02 Pause Priority Resolution; 11
Test Patterns
0000; 19
1010; 19
1111; 19
2e11; 19
2e15; 19
2e20; 19
2e23; 19
2e31; 19
2e9; 19
CJPAT; 20
CRPAT; 20
CSPAT; 20
INVERT; 19
NORMAL; 19
USER; 19
Test Set LEDs
BIT ERR; 7
ERRORS; 7
FRAME; 7
MODULE (SSMTT) or xDSL (SSxDSL); 7
PAT SYNC; 7
SIGNAL (SSMTT) or T1/E1 SIG (SSxDSL); 7
Throughput Measurement Screens; 74
Throughput Test Configuration Screen
DURATION; 69
RESOLUTION; 69
START BANDWIDTH; 68
Trace Results Screen
DESTINATION IP; 54
ET; 54
Hop; 55
Host Address; 55
LOCAL IP; 54
msec; 55
ST; 54
Type-ECHO, MISS, & TTL; 55
Transceivers; 5
Inserting/Removing; 6
106
Gigabit Ethernet Module
U
User Threshold Adjustment Screen; 72
V
View/Print Results
Deleting a Stored Test; 81
Locking and Unlocking a Stored Test; 81
Printing a Stored Test; 81
Renaming a Stored Test; 81
Saving a Test; 80
Viewing a Stored Test; 81
W
Warnings; 2
SSMTT-29 and SSMTT-29L
107