1
February 2015
Investigator® Argus Y-12 QS
Handbook
For multiplex amplification of 12 STR loci of
the Y chromosome
Sample & Assay Technologies
QIAGEN Sample and Assay Technologies
QIAGEN is the leading provider of innovative sample and assay technologies,
enabling the isolation and detection of contents of any biological sample. Our
advanced, high-quality products and services ensure success from sample to
result.
QIAGEN sets standards in:
Purification of DNA, RNA, and proteins
Nucleic acid and protein assays
microRNA research and RNAi
Automation of sample and assay technologies
Our mission is to enable you to achieve outstanding success and
breakthroughs. For more information, visit www.qiagen.com.
Contents
Kit Contents
4 Storage
4 Intended Use
4 Safety Information
5 Introduction
6 Equipment and Reagents to Be Supplied by User
10 Protocols
PCR Amplification
11 Electrophoresis Using the ABI PRISM 310 Genetic Analyzer
14 Electrophoresis Using the ABI PRISM 3100-Avant/3100
Genetic Analyzer
22 Electrophoresis Using the Applied Biosystems 3130/3130xl
Genetic Analyzer
30 Electrophoresis Using the Applied Biosystems 3500/3500xL
Genetic Analyzer
41 Analysis
53 Interpretation of Results
59 Troubleshooting Guide
61 References
64 Ordering Information
65 Investigator Argus Y-12 QS Handbook 02/2015
3
Kit Contents
Investigator Argus Y-12 QS Kit
Catalog no.
Number of 25 μl reactions
(100)
383615
100
Reaction Mix A
500 μl
Primer Mix Argus Y-12 QS
250 μl
Multi Taq2 DNA Polymerase
150 U
Control DNA 9948
200 μl
DNA size standard 550 (BTO)
50 μl
Allelic ladder Argus Y-12 QS
25 μl
Nuclease-free water
2 x 1.9 ml
Quick-Start Protocol
1
Storage
All components of the Investigator Argus Y-12 QS Kit should be stored at –20°C.
Avoid repeated thawing and freezing. Primer mix and allelic ladder must be
stored protected from the light. DNA samples and post-PCR reagents (allelic
ladder and DNA size standard) should be stored separately from the PCR
reagents. Under these conditions, the components are stable until the expiration
date indicated on the kit.
Intended Use
The Investigator Argus Y-12 QS Kit is intended for molecular biology
applications in forensic, human identity, and paternity testing. This product is
not intended for the diagnosis, prevention, or treatment of a disease.
All due care and attention should be exercised in the handling of the products.
We recommend all users of QIAGEN products to adhere to the NIH guidelines
that have been developed for recombinant DNA experiments, or to other
applicable guidelines.
4
Investigator Argus Y-12 QS Handbook 02/2015
Safety Information
When working with chemicals, always wear a suitable lab coat, disposable
gloves, and protective goggles. For more information, please consult the
appropriate safety data sheets (SDSs). These are available online in convenient
and compact PDF format at www.qiagen.com/safety where you can find, view,
and print the SDS for each QIAGEN kit and kit component.
Investigator Argus Y-12 QS Handbook 02/2015
5
Introduction
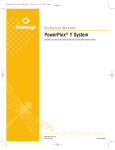
The Investigator Argus Y-12 QS Kit is a multiplex application for 12
Y-chromosomal short tandem repeat (STR) loci. The loci comply with the
minimal haplotype (MH) standard, as well as recommendations of the Scientific
Working Group on DNA Analysis Methods (SWGDAM), with DYS437 integrated
in addition into the multiplex system (Figure 1).
The primers are fluorescence-labeled with one of the following dyes:
6-FAM™: QS, DYS439, DYS437, DYS390, DYS385
BTG: DYS391, DYS389-I, DYS19, DYS389-II
BTY: DYS393, DYS438, DYS392
The Investigator Argus Y-12 QS Kit was developed specifically for fast and
reliable generation of male DNA profiles from mixtures of male and female
DNA (up to a ratio of 1:4000) so that separation of sperm from female cells or
differential lysis is not required.
As a special feature, the Investigator Argus Y-12 QS Kit contains an internal
PCR control (Quality Sensor “QS”), which provides helpful information about
the efficiency of the PCR and about the presence of PCR inhibitors.
Generation of DNA profiles using the Investigator Argus Y-12 QS Kit conforms
to the guidelines of the International Society for Forensic Genetics (1–3).
The optimal amount of DNA under standard conditions is 0.2–0.5 ng. Internal
validations demonstrated reliable results with <0.1 ng DNA.
The Investigator Argus Y-12 QS Kit was validated using the GeneAmp® PCR
System 9700 (in standard mode), ABI PRISM® 310, ABI PRISM 3100, and
Applied Biosystems® 3130 Genetic Analyzers.
Table 1 and Table 2 show the STR loci with their chromosomal mapping, repeat
motifs, and alleles. The most frequent alleles for European populations are
included in the allelic ladder. Allele ranges include all known alleles of YHRD
(www.yhrd.org as of 10/2009) and the current literature.
6
Investigator Argus Y-12 QS Handbook 02/2015
Yp11.32
Yp11.31
DYS393
2.8 Mb
DYS19
9.2 Mb
Yp11.2
Yp11.1
Yq11.1
Yq11.21
Yq11.221
Yq11.222
DYS391
DYS437, DYS439,
DYS389 -I, -II, DYS438
DYS390
DYS385
DYS392
21.5 Mb
Yq11.223
Yq11.23
Yq12
Figure 1. The ideogram of the Y-chromosome describes the physical location of the
STR loci that can be analyzed using the Investigator Argus Y-12 QS Kit. The positions of
the STR loci are shown in Mb (www.ncbi.nlm.nih.gov/genome/guide/human as of 10/2009).
Investigator Argus Y-12 QS Handbook 02/2015
7
Table 1. Locus-specific information of the Investigator Argus Y-12 QS Kit
8
Locus
GenBank®
Accession Repeat motif
of the reference allele
number
Ref.
allele
Allele
range
DYS19
AC017019 [TAGA]3 TAGG [TAGA]12
15
9–19
DYS385
AC022486 [GAAA]11
11
6–28
DYS389-I
AC004617 [TCTG]3[TCTA]9
12
8–17
DYS389-II
AC004617 [TCTG]5 [TCTA]12 [TCTG]3
[TCTA]9
29
23–35
DYS390
AC011289 [TCTG]8 [TCTA]11 [TCTG]1
[TCTA]4
24
12, 17–29
DYS391
AC011302 [TCTA]11
11
5–16
DYS392
AC011745 [TAT]13
13
4–20
DYS393
AC006152 [AGAT]12
12
7–18
DYS437
AC002992 [TCTA]10 [TCTG]2 [TCTA]4
16
4, 8–18
DYS438
AC002531 [TTTTC]10
10
7–18
DYS439
AC002992 [GATA]13
13
5–19
Investigator Argus Y-12 QS Handbook 02/2015
Table 2. Chromosomal mapping of Investigator Argus Y-12 QS Kit
Locus
Chromosomal mapping
DYS19
Yp11.2
DYS385
Yq11.222
DYS389-I
Yq11.21
DYS389-II
Yq11.21
DYS390
Yq11.221
DYS391
Yq11.21
DYS392
Yq11.222
DYS393
Yp11.31
DYS437
Yq11.21
DYS438
Yq11.21
DYS439
Yq11.21
Investigator Argus Y-12 QS Handbook 02/2015
9
Equipment and Reagents to Be Supplied by User
When working with chemicals, always wear a suitable lab coat, disposable
gloves, and protective goggles. For more information, consult the appropriate
material safety data sheets (MSDSs), available from the product supplier.
Hi-Di™ Formamide, 25 ml (Applied Biosystems, cat. no. 4311320)
Matrix Standards BT5 for single-capillary instruments, e.g., ABI PRISM 310
Genetic Analyzer (QIAGEN, cat. no. 386113)
Matrix Standards BT5 for multi-capillary instruments, e.g., ABI PRISM 3100
and Applied Biosystems 3130 or 3500™ Genetic Analyzers (QIAGEN, cat.
nos. 386123 or 386125)
Pipets and pipet tips
One of the following DNA analyzers:
ABI PRISM 310 Genetic Analyzer
ABI PRISM 3100-Avant™/3100 Genetic Analyzer
Applied Biosystems 3130/3130xl Genetic Analyzer
Applied Biosystems 3500/3500xL Genetic Analyzer
One of the following PCR thermal cyclers:
GeneAmp PCR System 9700
Bio-Rad PTC-200
Techne TC-512
Biometra T1
Eppendorf® Mastercycler® ep
PCR tubes or plates
Validity analysis software for human identification products
Investigator Human Identification PCR Kits require calibration with an allelic
ladder. Therefore, the software used must be compatible with human identification
(HID) products for forensic applications. We recommend GeneMapper® ID,
GeneMapper ID-X, or Genotyper® Software. The Investigator Template Files
facilitate data analysis and are compatible with the software mentioned above.
10
Investigator Argus Y-12 QS Handbook 02/2015
Protocol: PCR Amplification
This protocol is for PCR amplification of STR loci from forensic samples using
the Investigator Argus Y-12 QS Kit.
Important points before starting
Set up all reaction mixtures in an area separate from that used for DNA
isolation and PCR product analysis (post-PCR).
Use disposable tips containing hydrophobic filters to minimize crosscontamination.
Things to do before starting
Before opening the tubes with PCR components, vortex, and then centrifuge
briefly to collect contents at the bottom of the tubes.
Procedure
1. Thaw PCR components and template nucleic acid.
Mix thoroughly before use.
2. Prepare a master mix according to Table 3.
The master mix contains all of the components needed for PCR except the
template (sample) DNA and nuclease-free water.
Prepare a volume of master mix 10% greater than that required for the total
number of PCR assays to be performed. This should include positive and
negative control reactions.
3. Mix the master mix thoroughly, and dispense appropriate volumes
into PCR tubes or the wells of a PCR plate.
4. Add template DNA and nuclease-free water to the master mix, to
give a final sample volume of 25 μl.
5. Prepare positive and negative controls.
Positive control: Use 5 μl of the Control DNA.
Negative control: Use nuclease-free water instead of template DNA in the
reaction.
Investigator Argus Y-12 QS Handbook 02/2015
11
Table 3. Reaction setup
Component
Volume per reaction
Reaction Mix A*
5.0 μl
Primer Mix
2.5 μl
Multi Taq2 DNA Polymerase
0.6 μl
Nuclease-free water (added in step 4)
Variable
Template DNA (added in step 4)
Variable
Total volume
25 μl
* Contains dNTP mix, MgCl2, and bovine serum albumin (BSA).
6. Program the thermal cycler according to the manufacturer’s
instructions, using the conditions outlined in Table 4.
For stains containing small amounts of DNA (<100 pg/25 μl reaction), we
recommend using the cycling conditions outlined in Table 5.
Note: If using the GeneAmp PCR System 9700 with an Aluminum Block,
use “Std Mode”, or with a Silver 96-Well Block or Gold-plated Silver
96-Well Block, use “Max Mode”. Do not use “9600 Emulation Mode”.
Table 4. Standard cycling protocol, recommended for all DNA samples
Temperature
Time
Number of cycles
94°C*
4 min
–
94°C
30 s
63°C
120 s
72°C
75 s
94°C
30 s
61°C
120 s
72°C
75 s
68°C
60 min
–
10°C
–
5 cycles
25 cycles
* Hot-start to activate DNA polymerase.
12
Investigator Argus Y-12 QS Handbook 02/2015
Table 5. Optional cycling protocol, recommended for stains containing
small amounts (<100 pg) of DNA
Temperature
Time
Number of cycles
94°C*
4 min
–
94°C
30 s
63°C
120 s
72°C
75 s
94°C
30 s
61°C
120 s
72°C
75 s
68°C
60 min
–
10°C
–
5 cycles
27 cycles
* Hot-start to activate DNA polymerase.
7. After the cycling protocol is completed, store samples at –20°C
protected from the light, or proceed directly with running the
electrophoresis.
Investigator Argus Y-12 QS Handbook 02/2015
13
Protocol: Electrophoresis Using the ABI PRISM 310
Genetic Analyzer
For general instructions on instrument setup, matrix generation, and application
of the GeneScan® or GeneMapper ID Software, refer to the ABI PRISM 310
Genetic Analyzer User’s Manual. Electrophoresis using the GeneScan Software
is described below.
The virtual filter set G5 is used for combined application of the 5 fluorescent
labels 6-FAM, BTG, BTY, BTR, and BTO. This matrix standard is known as BT5.
The materials required for electrophoresis are given in Table 6.
Table 6. Materials required for electrophoresis
Material
Specifications
Capillary
47 cm/50 μm (green)
Polymer
POP-4™ for ABI PRISM 310 Genetic Analyzer
Buffer
10x Genetic Analyzer Buffer with EDTA
Matrix generation
Before conducting DNA fragment size analysis with the filter set G5, a matrix
with the 5 fluorescent labels 6-FAM, BTG, BTY, BTR, and BTO must be
generated (Table 7).
Table 7. The fluorescent labels of BT5
Color
Matrix standard
Blue (B)
6-FAM
Green (G)
BTG
Yellow (Y)
BTY
Red (R)
BTR
Orange (O)
BTO
14
Investigator Argus Y-12 QS Handbook 02/2015
1. Five electrophoresis runs should be conducted, one for each
fluorescent label, under the same conditions as for the samples and
allelic ladders of the Investigator Argus Y-12 QS Kit, in order to
generate suitable matrix files (Table 8).
Table 8. Matrix setup for single capillary instruments (ABI PRISM 310
Genetic Analyzer)
Matrix sample
Component
Volume
Matrix sample 1
Hi-Di Formamide
12.0 μl
Matrix standard 6-FAM
1.0 μl
Hi-Di Formamide
12.0 μl
Matrix standard BTG
1.0 μl
Hi-Di Formamide
12.0 μl
Matrix standard BTY
1.0 μl
Hi-Di Formamide
12.0 μl
Matrix standard BTR
1.0 μl
Hi-Di Formamide
12.0 μl
Matrix standard BTO
1.0 μl
Matrix sample 2
Matrix sample 3
Matrix sample 4
Matrix sample 5
2. Denature for 3 min at 95°C.
3. Snap freeze by placing the plate on ice for 3 min.
Alternatively, the thermal cycler set to 4°C may be used to cool the plate.
4. Load the samples on the tray.
5. Create a Sample Sheet and enter the sample designation. Table 9
shows the injection list for matrix generation.
Investigator Argus Y-12 QS Handbook 02/2015
15
Table 9. Injection list for matrix generation
Parameter
Settings
Module File
GS STR POP-4 (1 ml) G5
Matrix File
None
Size Standard
None*
Injection Time (s)
5
Injection Voltage (kV)
15
Run Voltage (kV)
15
Run Temperature (°C)
60
Run Time (min)
24
* Always prepare matrix standards without DNA Size Standard (BTO).
Analysis of the matrix samples
1.
2.
3.
4.
5.
6.
16
Run the GeneScan Software.
Select “New” from the File menu, and then select “Project”.
Open the folder of the current run and select “Add Sample Files”.
Select a matrix sample in the “Sample File” column.
Click “Sample” and then “Raw Data”.
Check the matrix samples for a flat baseline. As shown in the figure
(next page), there should be at least 5 peaks with peak heights of
1000–4000 RFU for each matrix sample.
Note: The optimal range is 2000–4000 RFU.
Investigator Argus Y-12 QS Handbook 02/2015
▼ 3200 data points (X)
5500▼
Electropherogram with raw data of the matrix standard 6-FAM.
7. Select an analysis range with a flat baseline and re-inject the matrix
sample, if necessary.
8. Record start and end value (data points) of the analysis range;
e.g., start value 3200, end value 5500.
9. Calculate the difference between the end and start values;
e.g., 5500–3200=2300 data points.
Generation of a matrix
1.
2.
3.
4.
Select “New” in the File menu, and then select “Matrix”.
Import the matrix samples for all dyes (B, G, Y, R, and O).
Enter a “Start At” value, e.g., 3200.
Under “Points”, enter the calculated difference between end and
start values, e.g., 2300.
5. Click “OK” to calculate the new matrix.
Matrix sample selection.
Investigator Argus Y-12 QS Handbook 02/2015
17
6. Select “Save as” in the File menu to save the new matrix in the
matrix folder.
New matrix BT5.
Checking the matrix
1. To check the new matrix with current samples, select “New” in the
File menu, and then select “Project”.
2. Open the folder of the respective run and select “Add Sample Files”.
3. Select the sample(s) in the Sample File column.
4. Click “Sample” and then “Install New Matrix” to open the matrix
folder and select the new matrix.
5. Re-analyze the samples.
Note: There should be no pull-up peaks between the dye panels (B, G, Y,
R, O) with the new matrix.
18
Investigator Argus Y-12 QS Handbook 02/2015
Sample preparation
1. Set up a mixture of formamide and DNA size standard according to
Table 10.
Table 10. Setup of formamide and DNA size standard mixture
Component
Volume per sample
Hi-Di Formamide
12.0 μl
DNA Size Standard 550 (BTO)
0.5 μl
2. Aliquot 12 μl of the mixture to a tube for each sample to be
analyzed.
3. Add 1 μl PCR product or allelic ladder (diluted, if necessary).
4. Denature for 3 min at 95°C.
5. Snap freeze by placing the plate on ice for 3 min.
Alternatively, the thermal cycler set to 4°C may be used to cool the plate.
6. Load the samples on the tray.
Investigator Argus Y-12 QS Handbook 02/2015
19
Setting up the GeneScan Software
Create a Sample Sheet and enter sample designation.
Table 11. Injection list for the ABI PRISM 310 Genetic Analyzer
Component
Settings
Module File
GS STR POP-4 (1 ml) G5
Matrix File
e.g., Matrix BT5
Size Standard
e.g., SST-BTO_60-500bp
Injection Time (s)
5*
Injection Voltage (kV)
15
Run Voltage (kV)
15
Run Temperature (°C)
60
Run Time (min)
26†
* Deviating from standard settings, the injection time may range between 1 and 10 s
depending on the type of sample. If samples with very high signal intensities are recorded, a
shorter injection time may be selected. For samples with low DNA content, an injection time
up to 10 s may be necessary.
†
The run time for Investigator Argus Y-12 QS was modified in order to be able to analyze
fragments with lengths of up to 400 bp.
20
Investigator Argus Y-12 QS Handbook 02/2015
Analysis parameters
Table 12 lists the recommended analysis parameters.
Table 12. Recommended analysis parameters for the ABI PRISM 310
Genetic Analyzer
Parameter
Settings
Analysis Range
Start: 2000
Stop: 10,000
Data Processing
Baseline: Checked
Multi-component: Checked
Smooth options: Light
Peak Detection
Peak Amplitude Thresholds
B:*
Y:*
G:* R:*
O:*
Min. Peak Half Width: 2 pts
Polynomial Degree: 3
Peak Window Size: 11 pts†
Size Call Range
Min: 60
Max: 550
Size Calling Method
Local Southern Method
Split Peak Correction
None
* The peak amplitude threshold (cutoff value) corresponds to the minimum peak height that will be
detected by the GeneScan or GeneMapper ID Software. Thresholds are usually 50–200 RFU and
should be determined individually by the laboratory. Recommendation: The minimal peak height
should be three-times as high as the background noise of the baseline.
†
Only the setting for Peak Window Size is different to defaults from Applied Biosystems for
HID analysis.
Note: For information on the use of the recommended Template Files (as
analysis parameters), refer to the appropriate Investigator Template Files User
Guide (Genotyper, GeneMapper ID, or GeneMapper ID-X).
Investigator Argus Y-12 QS Handbook 02/2015
21
Protocol: Electrophoresis Using the ABI PRISM 3100Avant/3100 Genetic Analyzer
For detailed instructions on instrument setup, spectral calibration, application of
the ABI PRISM 3100 Data Collection Software version 1.01 or 1.1 and the
GeneScan Software, refer to the ABI PRISM 3100-Avant/3100 Genetic Analyzer
User’s Manual.
The system with 4 capillaries is the ABI PRISM 3100-Avant Genetic Analyzer,
and the system with 16 capillaries is the ABI PRISM 3100 Genetic Analyzer.
The virtual filter set G5 is used for combined application of the 5 fluorescent
labels 6-FAM, BTG, BTY, BTR, and BTO. This matrix standard is known as BT5.
The materials required for electrophoresis are given in Table 13.
Table 13. Materials required for electrophoresis
Material
Specifications
Capillary
36 cm Capillary Array for ABI PRISM 3100-Avant/3100
Genetic Analyzer
Polymer
POP-4 Polymer for ABI PRISM 3100-Avant/3100
Genetic Analyzer
Buffer
10x Genetic Analyzer Buffer with EDTA
Spectral calibration/matrix generation
Proper spectral calibration is critical for evaluation of multicolor systems with the
ABI PRISM 3100-Avant/3100 Genetic Analyzer and should be done before
conducting fragment length analysis. The calibration procedure creates a matrix
which is used to correct the overlapping of fluorescence emission spectra of the
dyes.
Spectral calibration comprises the following steps:
Preparing the spectral calibration standards
Loading the standards to the 96-well reaction plate (one sample per
capillary)
Entering the plate composition
Performing a spectral calibration run and checking the matrix
22
Investigator Argus Y-12 QS Handbook 02/2015
Preparing the spectral calibration standards
Example for 4 capillaries (ABI PRISM 3100-Avant Genetic Analyzer)
1. Set up a mixture of formamide and Matrix Standard BT5 according to
Table 14.
Table 14. Setup of formamide and Matrix Standard BT5 mixture for
4 capillaries
Component
Volume
Hi-Di Formamide
60 μl
Matrix Standard BT5 multi cap.
5 μl
2. Load 12 μl of the mixture to 96-well plate; e.g., position A1–D1.
3. Denature for 3 min at 95°C.
4. Snap freeze by placing the plate on ice for 3 min.
Alternatively, the thermal cycler set to 4°C may be used to cool the plate.
Example for 16 capillaries (ABI PRISM 3100 Genetic Analyzer)
1. Set up a mixture of formamide and Matrix Standard BT5 according to
Table 15.
Table 15. Setup of formamide and Matrix Standard BT5 mixture for
16 capillaries
Component
Volume
Hi-Di Formamide
204 μl
Matrix Standard BT5 multi cap.
17 μl
2. Load 12 μl of the mixture to 96-well plate; e.g., position A1–H1 and
A2–H2.
3. Denature for 3 min at 95°C.
4. Snap freeze by placing the plate on ice for 3 min.
Alternatively, the thermal cycler set to 4°C may be used to cool the plate.
Investigator Argus Y-12 QS Handbook 02/2015
23
Performing a spectral calibration run
The parameter file for DyeSetG5 must be modified once to achieve successful
calibration with the Data Collection Software version 1.0.1 or 1.1.
Spectral parameter
1. To change settings in the parameter file, go to the following path:
D:\AppliedBio\Support Files\Data Collection
SupportFiles\CalibrationData\Spectral Calibration\ParamFiles
2. Select “MtxSTD{Genescan_SetG5} to open the PAR file.
3. Change “Condition Bounds Range” to [1.0, 20.0].
4. If the calibration was unsuccessful, also change Sensitivity to 0.1 and
Quality to 0.8.
5. Select “Save As” in the File menu and save the parameter file under
a new name; e.g., MtxStd{Genescan_SetG5_BT5}.par.
Note: Always use this parameter file for spectral calibration runs using
QIAGEN Matrix Standard BT5.
Plate Editor for spectral calibration
1.
2.
3.
4.
5.
6.
Place the 96-well plate on the autosampler tray.
Run the ABI PRISM 3100 Data Collection Software.
In Plate View, click “New” to open the Plate Editor dialog box.
Enter a name for the plate.
Select a Spectral Calibration.
Select “96-Well” as plate type, and click “Finish”.
Table 16. Plate Editor for spectral calibration
Parameter
Settings
Sample Name
Enter name for the matrix samples
Dye Set
G5
Spectral Run Module
Default (e.g., Spect36_POP4)
Spectral Parameters
MtxStd{GeneScan_SetG5_BT5}.par
(parameters created before)
7. Click the column header to select the entire column, and select “Fill
Down” from the Edit menu to apply the information to the selected
samples. Confirm by clicking “OK”.
24
Investigator Argus Y-12 QS Handbook 02/2015
8. Link the reaction plate on the autosampler tray with the created
plate ID and start the run.
9. Upon completion of the run, check in the Spectral Calibration Result
dialog box that all capillaries have successfully passed calibration
(label A).
If individual capillaries are labeled X, refer to the ABI PRISM 3100Avant/3100 Genetic Analyzer User’s Manual.
10. Click “OK” to confirm completion of the run.
Checking the matrix
1. Select “Display Spectral Calibration” from the Tools menu, then “Dye
Set” and “G5” to review the spectral calibration profile for each
capillary.
2. The quality value (Q value) must be greater than 0.95 and the
condition number (C value) must be between 1 and 20. Both values
must be within the pre-determined range.
3. Check for a flat baseline in the matrix samples. There should be five
peaks with heights of 1000–5000 RFU in each matrix sample.
Note: The optimal range is 2000–4000 RFU.
4. Check the new matrix with the current samples. There should be no
pull-up peaks between the dye panels (B, G, Y, R, and O) with the
new matrix.
5. If the calibration failed, follow instructions in the section “Spectral
parameter” on page 24.
6. If all capillaries have passed the calibration, the last calibration file
for Dye Set G5 must be activated manually. Click “Set Active Spectral
Calibration” under the Tools menu.
7. Rename the calibration file under Set Matrix Name (e.g., BT5_Date of
calibration).
Investigator Argus Y-12 QS Handbook 02/2015
25
Sample preparation
1. Set up a mixture of formamide and DNA size standard according to
Table 17.
Table 17. Setup of formamide and DNA size standard mixture
Component
Volume per sample
Hi-Di Formamide
12 μl
DNA Size Standard 550 (BTO)
0.5 μl
2. Aliquot 12 μl of the mixture to a tube for each sample to be
analyzed.
3. Add 1 μl PCR product or allelic ladder (diluted, if necessary).
4. Denature for 3 min at 95°C.
5. Snap freeze by placing the plate on ice for 3 min.
Alternatively, the thermal cycler set to 4°C may be used to cool the plate.
6. Load the samples on the tray.
Since injections take place simultaneously on all capillaries, 4 or 16 samples
must be pipetted onto the plate of multi-capillary analyzers. If fewer samples
are analyzed, the empty positions must be filled with 12 μl Hi-Di Formamide.
To ensure a reliable allelic assignment on multi-capillary analyzers, several
ladders should be run.
Room temperature may influence the performance of PCR products on multicapillary instruments, so that shoulder peaks or split peaks occur especially at
low temperatures. Ensure ambient conditions are kept as recommended by the
instrument manufacturer.
Setting up the GeneScan Software
1. Edit the default run module in Dye Set G5 once for the first run.
Select “Module Editor” to open the dialog box.
2. Select the appropriate Run Module as template from the GeneScan
table (see Table 18).
3. Modify the Injection Voltage to 3 kV and the Injection Time to 10 s.
4. Click “Save As” and enter the name of the new module (e.g.,
3kV_10s_400bp). Confirm by clicking “OK”.
5. Click “Close” to exit the Run Module Editor.
26
Investigator Argus Y-12 QS Handbook 02/2015
Table 18. Run Module 3kV_10s_400bp for the ABI PRISM 3100Avant/3100 Genetic Analyzer
Parameter
Setting
Run Temperature (°C)
Default
Cap Fill Volume
Default
Maximum Current (A)
Default
Current Tolerance (A)
Default
Run Current (A)
Default
Voltage Tolerance (kV)
Default
Pre-Run Voltage (kV)
Default
Pre-Run Time (s)
Default
Injection Voltage (kV)
3.0
Injection Time (s)
10*
Run Voltage (kV)
Default
Number of Steps
Default
Voltage Step Interval
Default
Data Delay Time (s)
Default
Run Time (min)
20†
* Deviating from the standard settings, the injection time may range between 1 and 20 s
depending on the type of sample. If samples with very high signal intensities are recorded, a
shorter injection time may be selected. For samples with low DNA content, an injection time
of up to 20 s may be necessary.
†
The run time for Investigator Argus Y-12 QS was modified in order to be able to analyze
fragments with lengths of up to 400 bp.
Starting the run
1.
2.
3.
4.
5.
6.
Place the prepared 96-well plate on the autosampler tray.
Run the ABI PRISM 3100 Data Collection Software.
In Plate View, click “New” to open the Plate Editor dialog box.
Enter a name for the plate (see Table 19).
Select “GeneScan” as the application type.
Select “96-Well” as plate type, and click “Finish”.
Investigator Argus Y-12 QS Handbook 02/2015
27
Table 19. Settings in Plate Editor
Parameter
Settings
Sample Name
Enter name for the matrix samples
Dyes
O
Color Info
Ladder or sample
Project Name
e.g., 3100_Project1
Dye Set
G5
Run Module
3kV_10s_400bp*
Analysis Module 1
DefaultAnalysis.gsp
* See Table 18, “Run Module 3kV_10s_400bp for the ABI PRSIM 3100-Avant/3100 Genetic
Analyzer”.
7. Complete the table in the Plate Editor and click “OK”.
8. Click the column header to highlight the entire column and select
“Fill Down” from the Edit menu to apply the information to the
selected samples.
9. Link the reaction plate on the autosampler tray to the created plate
ID and start the run.
10. Upon completion of the run, view the data as Color Data in the
Array View of the 3100 Data Collection Software or as Analyzed
Sample Files under D:/AppliedBio/3100/DataExtractor/ExtractRuns.
28
Investigator Argus Y-12 QS Handbook 02/2015
Analysis parameters
Table 20 lists the recommended analysis parameters.
Table 20. Recommended analysis parameters for the ABI PRISM 3100Avant/3100 Genetic Analyzer
Parameter
Settings
Analysis Range
Start: 2000
Stop: 10,000
Data Processing
Baseline: Checked
Multi-component: Checked
Smooth options: Light
Peak Detection
Peak Amplitude Thresholds
B:*
Y:*
G:* R:*
O:*
Min. Peak Half Width: 2 pts
Polynomial Degree: 3
Peak Window Size: 11 pts†
Size Call Range
Min: 60
Max: 550
Size Calling Method
Local Southern Method
Split Peak Correction
None
* The peak amplitude threshold (cutoff value) corresponds to the minimum peak height that will be
detected by the GeneScan or GeneMapper ID Software. Thresholds are usually 50–200 RFU and
should be determined individually by the laboratory. Recommendation: The minimal peak height
should be three-times higher than the background noise of the baseline.
†
Only the setting for Peak Window Size is different to defaults from Applied Biosystems for
HID analysis.
Note: For information on the use of the recommended Template Files (as
analysis parameters), refer to the appropriate Investigator Template Files User
Guide (Genotyper, GeneMapper ID, or GeneMapper ID-X).
Investigator Argus Y-12 QS Handbook 02/2015
29
Protocol: Electrophoresis Using the Applied
Biosystems 3130/3130xl Genetic Analyzer
For detailed instructions on instrument setup, spectral calibration, or application
of the ABI PRISM Data Collection Software version 3.0 and the GeneMapper ID
Software, refer to the Applied Biosystems 3130/3130xl Genetic Analyzers
Getting Started Guide.
The system with 4 capillaries is the Applied Biosystems 3130 Genetic Analyzer,
and the system with 16 capillaries is the Applied Biosystems 3130xl Genetic
Analyzer.
The virtual filter set Any5Dye is used for combined application of the 5
fluorescent labels 6-FAM, BTG, BTY, BTR, and BTO. This matrix standard is
known as BT5.
The materials required for electrophoresis are given in Table 21.
Table 21. Materials needed for electrophoresis
Material
Specifications
Capillary
36 cm Capillary Array for Applied Biosystems
3130/3130xl Genetic Analyzer
Polymer
POP-4 Polymer for Applied Biosystems 3130/3130xl
Genetic Analyzer
Buffer
10x Genetic Analyzer Buffer with EDTA
Spectral calibration/matrix generation
Before conducting DNA fragment size analysis, it is necessary to perform a
spectral calibration with the 5 fluorescent labels 6-FAM, BTG, BTY, BTR, and
BTO for each analyzer. The calibration procedure creates a matrix which is
used to correct the overlapping of fluorescence emission spectra of the dyes.
Spectral calibration is comprised of the following steps:
Preparing the spectral calibration standards
Loading the standards to the 96-well reaction plate (one sample per
capillary)
Creating the instrument protocol for spectral calibration (Protocol Manager)
Defining the plate composition in the plate editor (Plate Manager)
Performing a spectral calibration run and checking the matrix
30
Investigator Argus Y-12 QS Handbook 02/2015
Preparing the spectral calibration standards
Example for 4 capillaries (Applied Biosystems 3130 Genetic Analyzer)
1. Set up a mixture of formamide and Matrix Standard BT5 according to
Table 22.
Table 22. Setup of formamide and Matrix Standard BT5 mixture for
4 capillaries
Component
Hi-Di Formamide
Matrix Standard BT5 multi cap.
Volume
60 μl
5 μl
2. Load 12 μl of the mixture to 96-well plate, e.g., positions A1–D1.
3. Denature for 3 min at 95°C.
4. Snap freeze by placing the plate on ice for 3 min.
Alternatively, the thermal cycler set to 4°C may be used to cool the plate.
Example for 16 capillaries (Applied Biosystems 3130xl Genetic Analyzer)
1. Set up a mixture of formamide and Matrix Standard BT5 according to
Table 23.
Table 23. Setup of formamide and Matrix Standard BT5 mixture for
16 capillaries
Component
Volume
Hi-Di Formamide
204 μl
Matrix Standard BT5 multi cap.
17 μl
2. Load 12 μl of the mixture to 96-well plate, e.g., position A1–H1 and
A2–H2.
3. Denature for 3 min at 95°C.
4. Snap freeze by placing the plate on ice for 3 min.
Alternatively, the thermal cycler set to 4°C may be used to cool the plate.
Investigator Argus Y-12 QS Handbook 02/2015
31
Performing spectral calibration run
1. Place the 96-well plate on the autosampler tray.
2. In the Protocol Manager of the Data Collection Software, open the
Instrument Protocol window.
3. Click “New” to open the Protocol Editor dialog box.
4. Complete the dialog box with information from Table 24 and click
“OK”.
Table 24. Instrument protocol for spectral calibration
Protocol Editor
Settings
Name
User (e.g., Spectral36_POP4_BT5)
Type
SPECTRAL
Dye Set
Any5Dye
Polymer
User (e.g., POP4)*
Array Length
User (e.g., 36cm)*
Chemistry
Matrix Standard
Run Module
Default (e.g., Spect36_POP4_1)*
* Depends on the type of polymer and length of capillary used.
5. Click “New” in the Plate Manager of the Data Collection Software to
open the New Plate Dialog box.
6. Enter information from Table 25 and click “OK”. A new table in the
Plate Editor opens automatically (Table 26).
32
Investigator Argus Y-12 QS Handbook 02/2015
Table 25. Plate Editor for spectral calibration (I)
New plate dialog
Settings
Name
e.g., Spectral_BT5_date
Application
Spectral Calibration
Plate Type
96-well
Owner Name/
Operator Name
…
Investigator Argus Y-12 QS Handbook 02/2015
33
Table 26. Plate Editor for spectral calibration (II)
Parameter
Settings
Sample Name
Enter name for the matrix samples
Priority
e.g., 100
Instrument Protocol 1
Spectral36_POP4_BT5 (setting described before)
7. Click the column header to select the entire column, and select “Fill
Down” from the Edit menu to apply the information to the selected
samples. Confirm by clicking “OK”.
8. Link the reaction plate on the autosampler tray with the created
plate ID (position A or B) and start the run.
O
R
Y
G
B
Electropherogram of spectral calibration with matrix standard BT5 on an Applied
Biosystems 3130 Genetic Analyzer.
34
Investigator Argus Y-12 QS Handbook 02/2015
Checking the matrix
1. The quality value (Q value) of each capillary must be greater than
0.95 and the condition number range (C value) must be between 1
and 20.
2. Check for a flat baseline in the matrix samples. As shown in the
figure on the previous page, there should be 5 peaks with peak
heights of about 1000–5000 RFU in each matrix sample.
Note: The optimal range is 2000–4000 RFU.
3. Check the new matrix with the current samples. There should be no
pull-up peaks between the dye panels (B, G, Y, R, O) with the new
matrix.
4. If calibration failed, use the optimized values of the Matrix Standard
BT5 and repeat the calibration run.
5. If all capillaries have passed the test, the last calibration file for the
Dye Set Any5Dye is activated automatically in the Spectral Viewer.
Rename the calibration file (e.g., BT5_Date of calibration).
Sample preparation
1. Set up a mixture of formamide and DNA size standard according to
Table 27.
Table 27. Setup of formamide and DNA size standard mixture
Component
Volume per sample
Hi-Di Formamide
12.0 μl
DNA Size Standard 550 (BTO)
0.5 μl
2. Aliquot 12 μl of the mixture to a tube for each sample to be
analyzed.
3. Add 1 μl PCR product or allelic ladder (diluted, if necessary).
4. Denature for 3 min at 95°C.
5. Snap freeze by placing the plate on ice for 3 min.
Alternatively, the thermal cycler set to 4°C may be used to cool the plate.
6. Load the samples on the tray.
Investigator Argus Y-12 QS Handbook 02/2015
35
Since injections take place simultaneously on all capillaries, 4 or 16 samples
must be pipetted onto the plate of multi-capillary analyzers. If fewer samples
are analyzed, the empty positions must be filled with 12 μl Hi-Di Formamide.
To ensure a reliable allelic assignment on multi-capillary analyzers, several
ladders should be run.
Room temperature may influence the performance of PCR products on multicapillary instruments, so that shoulder peaks or split peaks occur especially at
low temperatures. Ensure ambient conditions are kept, as recommended by the
instrument manufacturer.
Setting up the Data Collection Software
1. Edit the Run Module once for the first run. In the Module Manager of
the Data Collection Software, click “New” to open the Run Module
Editor dialog box.
Note: Modify the Run Module Default settings from
“HIDFragmentAnalysis36_POP4_1” to those shown in Table 28.
2. Modify the Injection Voltage to 3 kV and the Injection Time to 10 s
(Table 28).
3. Click “Save As”, enter a name for the new Run Module
(e.g., 3kV_10s_400bp), and confirm by clicking “OK”.
4. Click “Close” to exit the Run Module Editor.
36
Investigator Argus Y-12 QS Handbook 02/2015
Table 28. Run Module 3kV_10s_400bp for the Applied Biosystems
3130/3130xl Genetic Analyzer
Parameter
Settings
Oven Temperature (°C)
Default
Poly Fill Volume
Default
Current Stability (μA)
Default
Pre-Run Voltage (kV)
Default
Pre-Run Time (s)
Default
Injection Voltage (kV)
3.0
Injection Time (s)
10*
Voltage Number of Steps
Default
Voltage Step Interval
Default
Data Delay Time (s)
Default
Run Voltage (kV)
Default
Run Time (s)
1200†
* Deviating from the standard settings, the injection time may range between 1 and 20 s
depending on the type of sample. If samples with very high signal intensities are recorded, a
shorter injection time may be selected. For samples with low DNA content, an injection time
of up to 20 s may be necessary.
†
The run time for Investigator Argus Y-12 QS was modified in order to be able to analyze
fragments with lengths of up to 400 bp.
Starting the run
1. Place the prepared 96-well plate on the autosampler tray.
2. Open the Protocol Manager of the Data Collection Software.
3. Click “New” in the Instrument Protocol window to open the Protocol
Editor dialog box and enter the information in Table 29.
4. Click “OK” to exit the Protocol Editor.
Investigator Argus Y-12 QS Handbook 02/2015
37
Table 29. Settings in Instrument Protocol
Protocol Editor
Settings
Name
Run36_POP4_BT5_20min
Type
REGULAR
Run Module
3kV_10s_400bp*
Dye Set
Any5Dye
* See Table 28, “Run Module 3kV_10s_400bp for the Applied Biosystems 3130/3130xl
Genetic Analyzer”.
5. Before each run, it is necessary to create a plate definition. In the
Plate Manager of the Data Collection Software, click “New” to open
the New Plate Dialog box.
6. Enter the information in Table 30.
Table 30. GeneMapper Plate Editor (I)
Protocol Editor
Settings
Name
e.g., Plate_BT5_Date
Application
Select GeneMapper Application
Plate type
96-Well
Owner Name/
Operator Name
…
7. Click “OK” and a new table in the Plate Editor opens automatically
(Table 31).
8. Click the column header to select the entire column. Select “Fill
Down” from the Edit menu to apply the information to all selected
samples. Click “OK”.
9. In the Run Scheduler, click “Find All”, and select “Link” to link the
reaction plate on the autosampler tray to the newly created plate
record (position A or B).
38
Investigator Argus Y-12 QS Handbook 02/2015
Table 31. GeneMapper Plate Editor (II)
Parameter
Settings
Sample Name
Enter the name for the samples
Priority
e.g., 100 (Default)
Sample Type
Sample or Allelic Ladder
Size Standard
e.g., SST-BTO_60-400bp
Panel
e.g., Argus_Y12_Panels
Analysis Method
e.g., Analysis_HID_3130
Snp Set
–
User-defined 1-3
–
Results Group 1
(Select results group)
Instrument Protocol 1
Run36_POP4_BT5_20min (setting described
before)
10. Start the run.
11. During the run, view Error Status in the Event Log or examine the
quality of the raw data for each capillary in the Capillaries Viewer or
the Cap/Array Viewer.
12. View data as an overview in Run History or Cap/Array Viewer of the
Data Collection Software.
Run data are saved in the Run Folder of the previously chosen Result Group.
Investigator Argus Y-12 QS Handbook 02/2015
39
Analysis parameters/analysis method
Table 32 lists the recommended analysis parameters in the worksheet Peak
Detector.
Table 32. Recommended settings for the Applied Biosystems
3130/3130xl Genetic Analyzer
Parameter
Settings
Peak Detection Algorithm
Advanced
Ranges
Analysis: Partial Range
Start Point: 2000; Stop Point: 10,000
Sizing: All Sizes
Smoothing and Baselining
Smoothing: Light
Baseline Window: 51 pts
Size Calling Method
Local Southern Method
Peak Detection
Peak Amplitude Thresholds
B:*
Y:*
G:* R:*
O:*
Min. Peak Half Width: 2 pts
Polynomial Degree: 3
Peak Window Size: 11 pts†
Slope Thresholds: 0.0
* The peak amplitude threshold (cutoff value) corresponds to the minimum peak height that
will be detected by the GeneMapper ID Software. The thresholds are usually 50–200 RFU
and should be determined individually by the laboratory. Recommendation: The minimal
peak height should be three-times higher than the background noise of the baseline.
†
Only the setting for Peak Window Size is different to defaults from Applied Biosystems for
HID analysis.
Note: For information on the use of the recommended Template Files (as
analysis parameters), refer to the appropriate Investigator Template Files User
Guide (Genotyper, GeneMapper ID, or GeneMapper ID-X).
40
Investigator Argus Y-12 QS Handbook 02/2015
Protocol: Electrophoresis Using the Applied
Biosystems 3500/3500xL Genetic Analyzer
For detailed instructions on instrument setup, spectral calibration, or application
of the Applied Biosystems 3500 Series Data Collection Software version 1.0 and
the GeneMapper ID-X Software version 1.2, refer to the Applied Biosystems
3500/3500xL Genetic Analyzers User Guide.
The system with 8 capillaries is the Applied Biosystems 3500 Genetic Analyzer
and the system with 24 capillaries is the Applied Biosystems 3500xL Genetic
Analyzer.
The virtual filter set AnyDye is used for combined application of the 5
fluorescent labels 6-FAM, BTG, BTY, BTR, and BTO. This matrix standard is
known as BT5.
The materials required for electrophoresis are given in Table 33.
Table 33. Materials required for electrophoresis
Material
Specifications
Capillary
36 cm Array for Applied Biosystems 3500/3500xL
Genetic Analyzer
Polymer
POP-4 for Applied Biosystems 3500/3500xL Genetic
Analyzer
Buffer
Anode Buffer Container (ABC) 3500 Series
Cathode Buffer Container (CBC) 3500 Series
Spectral calibration/matrix generation
Before conducting DNA fragment size analysis, it is necessary to perform a spectral
calibration with the 5 fluorescent labels 6-FAM, BTG, BTY, BTR, and BTO for each
analyzer (Table 34). The calibration procedure creates a matrix which is used to
correct the overlapping of fluorescence emission spectra of the dyes.
IMPORTANT: Spectral calibration must be performed for each new capillary
array.
Spectral calibration is comprised of the following steps:
Preparation of the instrument
Preparation of dye set BT5
Preparation of the standard calibration plate
Plate assembly and loading the plate in the instrument
Investigator Argus Y-12 QS Handbook 02/2015
41
Performing a spectral calibration run
Checking the matrix
Preparation of the instrument
Before the spectral calibration process, ensure that the spatial calibration has
been performed. This process is described in detail in the Applied Biosystems
3500/3500xL Genetic Analyzers User Guide.
Preparation of dye set BT5
Prior to the spectral calibration, a dye set for the Matrix Standard BT5 must be
set up.
Table 34. The fluorescent labels of BT5
Color
Matrix standard
Blue (B)
6-FAM
Green (G)
BTG
Yellow (Y)
BTY
Red (R)
BTR
Orange (O)
BTO
1. To create a new dye set, go to “Library” and select “Analyze”,
followed by “Dye Sets” and click “Create”.
2. Enter a “Dye Set Name”, e.g., BT5.
3. Select “Matrix Standard” as a chemistry and “AnyDye Template” as a
dye set template.
4. Disable “Purple” in the field “Arrange Dyes”. Ensure that all other
colors are enabled.
5. Under “Calibration Peak Order” the colors need to be arranged as
follows: 5 – blue, 4 – green, 3 – yellow, 2 – red, and 1 – orange.
6. Do not alter the “Parameter” settings.
7. Click “Save” to confirm the changes.
42
Investigator Argus Y-12 QS Handbook 02/2015
Setup of dye set BT5.
Preparation of the standard calibration plate
Example for 8 capillaries (Applied Biosystems 3500 Genetic Analyzer)
1. Set up a mixture of formamide and Matrix Standard BT5 according to
Table 35.
Investigator Argus Y-12 QS Handbook 02/2015
43
Table 35. Setup of formamide and Matrix Standard BT5 mixture for
8 capillaries
Component
Volume
Hi-Di Formamide
90 μl
Matrix Standard BT5 multi cap.
10 μl
2. Load 10 μl of the mixture to a 96-well plate, e.g., positions A1–H1.
3. Denature for 3 min at 95°C.
4. Snap freeze by placing the plate on ice for 3 min.
Alternatively, the thermal cycler set to 4°C may be used to cool the plate.
Example for 24 capillaries (Applied Biosystems 3500xL Genetic Analyzer)
1. Set up a mixture of formamide and Matrix Standard BT5 according to
Table 36.
Table 36. Setup of formamide and Matrix Standard BT5 mixture for
24 capillaries
Component
Volume
Hi-Di Formamide
225 μl
Matrix Standard BT5 multi cap.
25 μl
2. Load 10 μl of the mixture to a 96-well plate, e.g., positions A1–H1,
A2–H2, and A3–H3.
3. Denature for 3 min at 95°C.
4. Snap freeze by placing the plate on ice for 3 min.
Alternatively, the thermal cycler set to 4°C may be used to cool the plate.
Plate assembly and loading the plate in the instrument
The necessary steps are described in detail in the Applied Biosystems
3500/3500xL Genetic Analyzers User Guide.
Performing a spectral calibration run
Once the multiwell plates containing the spectral calibration mixture are placed
in the autosampler tray, the spectral calibration process can be started.
44
Investigator Argus Y-12 QS Handbook 02/2015
1. To access the Spectral Calibration screen, select “Maintenance” on
the Dashboard of the 3500 Series Data Collection software.
2. The number of wells in the spectral calibration plate and their
location in the instrument must be specified.
3. Select “Matrix Standard” as a chemistry standard and “BT5” for dye
set.
4. (Optional) Enable “Allow Borrowing”.
5. Click “Start Run”.
Checking the matrix
Click a capillary in the table in order to display the results for each capillary
(spectral data, Quality value, and Condition Number) below the run results table.
The quality value (Q value) of each capillary must be greater than 0.8 and
the number range (C value) must be between 1 and 20.
Check the matrix samples for a flat baseline. As shown in the figure, there
should be 5 peaks with peak heights of about 1000–5000 RFU for each
matrix sample (Note: The optimal range is 2000–4000 RFU).
Electropherogram of spectral calibration of the matrix standard BT5 on an Applied
Biosystems 3500 Genetic Analyzer.
When a spectral calibration is successfully completed, the “Overall” row
displays green results. If the “Overall” row displays red results, refer to the
“Spectral calibration troubleshooting” section of the Applied Biosystems
3500/3500xL Genetic Analyzers User Guide.
Investigator Argus Y-12 QS Handbook 02/2015
45
Example of successful spectral calibration of the matrix standard BT5 for all capillaries
with an Applied Biosystems 3500 Genetic Analyzer.
For each capillary, select and display the spectral and raw data. Check that the
data meet the following criteria:
The order of the peaks in the spectral profile from left to right read orangered-yellow-green-blue
No extraneous peaks appear in the raw data profile
Peak morphology in the spectral profile shows no gross overlaps, dips, or
other irregularities. Separate and distinct peaks should be visible
If the data for all capillaries meet the criteria above, click “Accept Results”. If
any capillary data does not meet the criteria above, click “Reject Results”, and
refer to the “spectral calibration troubleshooting” section of the Applied
Biosystems 3500/3500xL Genetic Analyzers User Guide.
Sample preparation
1. Set up a mixture of formamide and DNA size standard according to
Table 37.
Table 37. Setup of formamide and DNA size standard mixture
Component
Volume per sample
Hi-Di Formamide
12.0 μl
DNA Size Standard 550 (BTO)
0.5 μl
2. Aliquot 12 μl of the mixture to a tube for each sample to be
analyzed.
3. Add 1 μl PCR product or allelic ladder (diluted, if necessary).
4. Denature for 3 min at 95°C.
46
Investigator Argus Y-12 QS Handbook 02/2015
5. Snap freeze by placing the plate on ice for 3 min.
Alternatively, the thermal cycler set to 4°C may be used to cool the plate.
6. Load the samples on the tray.
Since injections take place simultaneously on all capillaries, 8 or 24 samples
must be pipetted onto the plate of multi-capillary analyzers. If fewer samples
are analyzed, the empty positions must be filled with 12 μl Hi-Di Formamide.
To ensure a reliable allelic assignment on multi-capillary analyzers, inject one
allelic ladder for each set of 24 samples:
8-capillary instruments: One allelic ladder per 3 injections
24-capillary instruments: One allelic ladder per 1 injection
Room temperature may influence the performance of PCR products on multicapillary instruments, so that shoulder peaks or split peaks occur, especially at
low temperatures. Ensure ambient conditions are kept, as recommended by the
instrument manufacturer.
Setting up a run
If you are using the Investigator Argus Y-12 QS Kit for the first time on an
Applied Biosystems 3500 Genetic Analyzer, you will first need to set up a
number of protocols:
Instrument Protocol
Size Standard
QC Protocol
Assay
All protocols can be set up via the Dashboard of the 3500 Series Data
Collection software.
1. To set up the Instrument Protocol, go to “Library” and select
“Analyze”, followed by “Instrument Protocols” and click “Create”.
Note: Modify the Run Module Default settings from “HID36_POP4” as
shown in Table 38.
2. The parameters in Table 38 must be entered or selected.
Investigator Argus Y-12 QS Handbook 02/2015
47
Table 38. Instrument Protocol parameters for the Applied Biosystems
3500 Genetic Analyzer
Parameter
Setting
Application Type
HID
Capillary Length
36 cm
Polymer
POP4
Dye Set
e.g., BT5
Run Module
HID36_POP4
Protocol Name
e.g., Investigator Argus Y-12 QS
Oven Temperature (°C)
Default
Run Voltage (kV)
Default
PreRun Voltage (kV)
Default
Injection Voltage (kV)
3.0
Run Time (s)
1300
PreRun Time (s)
Default
Injection Time (s)
8.0*
Data Delay (s)
Default
Advanced Options
Default
* Deviating from the standard settings, the injection time may range between 1 and 20 s
depending on the type of sample. If samples with very high signal intensities are recorded, a
shorter injection time may be selected. For samples with low DNA content, an injection time
of up to 20 s may be necessary.
3. Click “Save” to confirm the changes.
4. To set up the Size Standard, go to “Library”, select “Analyze”,
followed by “Size Standards”, and click “Create”.
5. The parameters in Table 39 must be entered or selected.
The DNA Size Standard 550 (BTO) should be used with the following
lengths of fragments: 60, 80, 90, 100, 120, 140, 160, 180, 200, 220,
240, 250, 260, 280, 300, 320, 340, 360, 380, 400, 425, 450, 475, 500,
525, and 550 bp.
48
Investigator Argus Y-12 QS Handbook 02/2015
Table 39. Size standard parameters
Parameter
Setting
Size Standard
e.g., SST-BTO_60-550bp
Dye Color
Orange
6. Click “Save” to confirm the changes.
7. To set up the QC Protocol, go to “Library” and select “Analyze”,
followed by “QC Protocols”, and click “Create”.
8. The parameters in Table 40 must be entered or selected.
Table 40. QC Protocol parameters
Parameter
Setting
Protocol Name
e.g., BTO_550
Size Standard
SST-BTO_60-550 (from step 4)
Sizecaller
SizeCaller v1.1.0
9. Go to “Analysis Settings”, followed by “Peak Amplitude Threshold”
and disable “Purple”. Ensure that all other colors are enabled.
Check the recommended analysis settings in Table 43. All other settings
should remain as “Default”.
10. Click “Save” to confirm the changes.
11. To set up an Assay, go to “Library” and select “Manage”, followed
by “Assays”, and click “Create”.
Investigator Argus Y-12 QS Handbook 02/2015
49
12. To analyze Investigator Argus Y-12 QS fragments, the parameters in
Table 41 must be selected.
Table 41. Assay parameters
Parameter
Setting
Assay Name
e.g., Investigator Argus Y-12 QS
Color
Default
Application Type
HID
Instrument Protocol
e.g., Investigator Argus Y-12 QS (from step 1)
QC Protocols
e.g., BTO_550 (from step 4)
13. Click “Save” to confirm the changes.
Starting the run
1. In the Dashboard, click “Create New Plate”.
2. Go to “Define Plate Properties” and select “Plate Details”. Select or
enter the parameters in Table 42.
Table 42. Plate properties
Property
Setting
Name
e.g., Investigator Argus Y-12 QS
Number of Wells
96
Plate Type
HID
Capillary Length
36 cm
Polymer
POP4
3. Click “Assign Plate Contents” to confirm the changes.
4. Enter the designated sample name in each well containing a sample
or allelic ladder. This will identify the well positions of each sample
for the data collection and processing.
50
Investigator Argus Y-12 QS Handbook 02/2015
5. Choose the correct Assay for the analysis. If you followed the steps
under “Setting up the Run”, this would be Investigator Argus Y-12
QS from step 11. All named wells on the plate must have an
assigned assay.
6. Select the wells for which to specify an assay. Check the box next to
the assay name to assign it to the selected wells.
7. (Optional) Repeat for file name conventions and results group.
8. If not already done, load the assembled plate to the instrument and
close the instrument door to re-initialize the instrument. Then, click
“Link Plate for Run”. In the next screen, enter the desired Run Name
and click “Start Run”.
Investigator Argus Y-12 QS Handbook 02/2015
51
Analysis parameters/analysis method
Table 43 lists the recommended analysis parameters in the worksheet Peak
Detector.
Table 43. Recommended settings for the Applied Biosystems
3500/3500xL
Parameter
Settings
Peak Detection Algorithm
Advanced
Ranges
Analysis: Partial Range
Start Point: 1000; Stop Point: 20,000
Sizing: All Sizes
Smoothing and Baselining
Smoothing: Light
Baseline Window: 51 pts
Size Calling Method
Local Southern Method
Peak Detection
Peak Amplitude Thresholds
B:*
Y:*
G:* R:*
O:*
Min. Peak Half Width: 2 pts
Polynomial Degree: 3
Peak Window Size: 11 pts†
Slope Thresholds: 0.0
* The peak amplitude threshold (cutoff value) corresponds to the minimum peak height that
will be detected by the GeneMapper ID-X Software version 1.2. The thresholds are usually
50–200 RFU and should be determined individually by the laboratory. Recommendation:
The minimal peak height should be three-times higher than the background noise of the
baseline.
†
Only the setting for Peak Window Size is different to defaults from Applied Biosystems for
HID analysis.
52
Investigator Argus Y-12 QS Handbook 02/2015
Protocol: Analysis
For general instructions on automatic sample analysis, refer to the appropriate
User and/or Workflow Guides for GeneScan, GeneMapper ID, or GeneMapper
ID-X Software.
Note: The red panel should be faded out.
Finding the exact lengths of the amplified products depends on the device type,
the conditions of electrophoresis, as well as the DNA size standard used. Due to
the complexity of some loci, determining the size should be based on evenly
distributed references. The DNA Size Standard 550 (BTO) should be used with
the following lengths of fragments (Figure 2): 60, 80, 90, 100, 120, 140, 160,
180, 200, 220, 240, 250, 260, 280, 300, 320, 340, 360, 380, 400, 425,
450, 475, 500, 525, and 550 bp.
Figure 2. Electropherogram of the DNA Size Standard 550 (BTO), fragments with
lengths in bp.
As previously mentioned, the Investigator Argus Y-12 QS Kit contains an
internal PCR control (Quality Sensor “QS”), which provides information about
the efficiency of the PCR and the presence of PCR inhibitors. A 6-FAM–labeled
74 bp fragment is amplified independently of the DNA. The PCR control assay
without DNA shows only the QS fragment (Figure 3) and indicates successful
polymerase chain reaction.
Figure 3. Electropherogram of the 6-FAM–labeled PCR control (QS) fragment.
Fragment length in base pairs, signal intensities in peak height.
Investigator Argus Y-12 QS Handbook 02/2015
53
Special features
In general, the electropherogram displays a single peak for each Y-STR locus.
However, locus DYS385 produces 2 peaks of different lengths or of the same
length. These 2 fragments originate from duplicated and inversed copies of one
Y-chromosomal locus. The primers provided in the Investigator Argus Y-12 QS
Kit simultaneously co-amplify the 2 homologous loci. For separate
amplification, see reference 5.
On locus DYS385, alleles 14.3, 15.3, 16.3, 17.3, and 19.3 represent the
alleles 15, 16, 17, 18, and 20, respectively, with one thymidine deletion
between the primer binding site and the repeat region (6). This deletion may
serve as an additional distinctive feature for differentiation in forensic casework.
If more than one peak is obtained in the electropherogram for one or several
markers, this does not necessarily suggest mixed samples. Duplications or
triplications of STR markers also result in such an effect and have already been
observed for DYS385 and DYS19 (7). Rarely, single systems can also fail because
of Y-chromosomal deletions as known in azoospermic patients, which has
already been described for DYS385 and DYS392 (8).
Analysis software
Allele allocation should be carried out with suitable analysis software, e.g.,
Genotyper, GeneMapper ID, or GeneMapper ID-X Software in combination with
the Investigator Template Files available as a download from www.qiagen.com,
see Table 44 and Table 45.
The recommended Investigator Template File for Genotyper Software is Argus
Y-12 QS.
54
Investigator Argus Y-12 QS Handbook 02/2015
Table 44. Recommended Investigator Template Files for GeneMapper ID
File type
File name
Panels
Argus_Y12_Panels
BinSets
Argus_Y12_Bins
Size standard
SST-BTO_60–500bp
Analysis Method
Analysis_HID_310
Analysis_HID_3130
Analysis_HID_310_50rfu
Analysis_HID_3130_50rfu
Plot Settings
Plots BT5_4dyes
Table Settings
Table for 2 alleles
Table for 10 alleles
Panels and BinSets must always be used; other template files are optional.
Table 45. Recommended Investigator Template Files for GeneMapper ID-X
File type
File name
Panels
Argus_Y12_Panels_x
BinSets
Argus_Y12_Bins_x
Stutter
Argus_Y12_Stutter_x
Size standard
SST-BTO_60–500bp
Analysis Method
Analysis_HID_310
Analysis_HID_3130
Analysis_HID_310_50rfu
Analysis_HID_3130_50rfu
Analysis_HID_3500
Plot Settings
Plots BT5_4dyes
Table Settings
310 Data Analysis/31xx Data Analysis
Panels and BinSets must always be used; other template files are optional.
Investigator Argus Y-12 QS Handbook 02/2015
55
Controls
The alleles listed in Table 46 represent the Control DNA 9948 (included in the
Investigator Argus Y-12 QS Kit) and DNA from other commercially available
standard cell lines.
Table 46. Allele assignment of the Investigator Argus Y-12 QS Kit
Locus
Control DNA
9948
CCR
9947
CCR
3657
ATCC
K562
DYS19
14
–
13
–
DYS385
11/14
–
16/19
–
DYS389-I
13
–
12
–
DYS389-II
31
–
29
–
DYS390
24
–
24
–
DYS391
10
–
10
–
DYS392
13
–
11
–
DYS393
13
–
13
–
DYS437
15
–
14
–
DYS438
11
–
10
–
DYS439
12
–
12
–
For further confirmation, the table above displays the alleles of the reference DNA
purchased from Coriell Cell Repositories (CCR), as well as 3 reference DNAs
purchased from CCR and ATCC up to the standard of Szibor et al. (9).
Alleles
Table 47 shows the alleles of the allelic ladder. All analyses have been
performed using an Applied Biosystems 3500 Genetic Analyzer with POP-4
polymer (Figure 4 and Figure 5, page 58). Different analysis instruments, DNA
size standards, or polymers may result in different fragment lengths. In addition,
a visual alignment with the allelic ladder is recommended.
Scaling
Horizontal: 75–405 bp (with Quality Sensor 65–405 bp)
Vertical: Depending on signal intensity
56
Investigator Argus Y-12 QS Handbook 02/2015
Table 47. Allelic ladder fragments included in the Investigator Argus
Y-12 QS Kit
Locus
Dye label
Repeat numbers of allelic ladder
DYS439
6-FAM
8, 9, 10, 11, 12, 13, 14,
DYS437
6-FAM
12, 13, 14, 15, 16, 18
DYS390
6-FAM
20, 21, 22, 23, 24, 25, 26, 27
DYS385
6-FAM
9, 10, 11, 12, 13, 13.2, 14, 15, 15.2, 16,
17, 17.2, 18, 19, 20, 21
DYS391
BTG
8, 9, 10, 11, 12, 13,
DYS389-I
BTG
11, 12, 13, 14, 15
DYS19
BTG
11, 12, 13, 14, 15, 16, 17, 18
DYS389-II
BTG
27, 28, 29, 30, 31, 32, 33
DYS393
BTY
11, 12, 13, 14, 15, 16
DYS438
BTY
8, 9, 10, 11, 12, 13, 16
DYS392
BTY
7, 9, 10, 11, 12, 13, 14, 15
Investigator Argus Y-12 QS Handbook 02/2015
57
Figure 4. Electropherogram of the Investigator Argus Y-12 QS Kit using 500 pg
Control DNA 9948. The Quality Sensor (QS) is shown at 74 bp. Analysis was performed on
an Applied Biosystems 3500 Genetic Analyzer with the DNA Size Standard 550 (BTO). Allele
assignment was performed using Investigator IDproof Software.
Figure 5. Electropherogram of the allelic ladder Argus Y-12 QS analyzed on an
Applied Biosystems 3500 Genetic Analyzer. Allele assignment was performed using
Investigator IDproof Software.
58
Investigator Argus Y-12 QS Handbook 02/2015
Interpretation of Results
Post-PCR analysis and automatic allele assignment with suitable analysis
software ensure a precise and reliable discrimination of alleles.
General procedure for the analysis
1.
2.
3.
4.
5.
Check the DNA size standard.
Check the allelic ladder.
Check the positive control.
Check the negative control.
Analyze and interpret the sample data.
Pull-up peaks
Pull-up peaks may occur if peak heights are outside the linear detection range
(see “Troubleshooting Guide”, page 61), or if an incorrect matrix was applied.
They appear at positions of specific peaks in other color channels, typically with
lower signal intensities. Peak heights should not exceed 3000 RFU in order to
prevent pull-up peaks.
Stutter peaks
The occurrence of stutter peaks depends on the sequence of the repeat structure
and the number of alleles. n –4 peaks are caused by a loss of a repeat unit during
amplification of tetranucleotide STR motifs, caused by slippage effects of the Taq
DNA Polymerase. These peaks should be interpreted using the Investigator
Template Files for Genotyper, GeneMapper ID, and GeneMapper ID-X Software.
Template-independent addition of nucleotides
Because of its terminal transferase activity, the Taq DNA Polymerase may cause
incomplete adenylation at the 3'-end of the amplified DNA fragments. The artifact
peak is one base shorter than expected (–1 peaks). All primers included in the
Investigator Argus Y-12 QS Kit are designed to minimize these artifacts. Artifact
formation is further reduced by the final extension step of the PCR protocol at 68°C
for 60 minutes. Peak height of the artifact correlates with the amount of DNA.
Laboratories should define their own limits for analysis of the peaks.
Investigator Argus Y-12 QS Handbook 02/2015
59
Quality Sensor to check PCR results
The Investigator Argus Y-12 QS Kit contains an internal PCR check (QS), which
provides information about PCR efficiency and presence of PCR inhibitors
(Figure 3, page 53). Complete QS failure indicates total inhibition of the PCR or
errors in the assay. If the sensor signal is amplified in presence of DNA either in
the negative control or in the positive control, the PCR is not inhibited. Samples
that contain sufficient DNA and no inhibiting substances result in a DNA profile,
according to the kit and the sensor fragment. Reduced sensor peak heights in
forensic samples indicate partial PCR inhibition. If only the QS is amplified, the
sample contains very little, only female, or degraded DNA.
Artifacts
Room temperature may influence the performance of PCR products on multicapillary instruments, so that shoulder peaks or split peaks occur. If shoulder or
split peaks appear, we recommend injecting the sample again.
60
Investigator Argus Y-12 QS Handbook 02/2015
Troubleshooting Guide
This troubleshooting guide may be helpful in solving any problems that may
arise. For more information, see also the Frequently Asked Questions page at
our Technical Support Center: www.qiagen.com/FAQ/FAQList.aspx. The
scientists in QIAGEN Technical Services are always happy to answer any
questions you may have about either the information and protocols in this
handbook or sample and assay technologies (for contact information, see back
cover or visit www.qiagen.com).
Comments and suggestions
Sample preparation
Sample signal intensity
must be increased
Reduce the volume of the DNA Size Standard
550 (BTO) to peak heights of about 500 RFU.
Purify the PCR products before starting the
analysis. We recommend the MinElute® PCR
Purification Kit for rapid and effective purification
(see Ordering Information).
Matrix/spectral calibration is not appropriate
There are pull-up
peaks between the dye
panels (B, G, Y, R, O)
with the current matrix/
spectral calibration
This matrix cannot be used for the analysis.
Repeat the matrix generation/spectral
calibration. Be sure to carefully follow the correct
protocol for the specific analysis instrument.
Many peaks are labeled as off-ladder (OL) alleles in the samples
a) DNA Size Standard
550 (BTO) was not
defined or identified
correctly
Click the orange “Size Match Editor“ icon in the
upper toolbar or the GeneMapper ID or
GeneMapper ID-X Software. Mark the orange
fragments of all samples.
Always use the DNA Size Standard 550 included
in Investigator Human Identification PCR Kits.
Investigator Argus Y-12 QS Handbook 02/2015
61
Comments and suggestions
b) Signal intensities are
too high. If the peak
heights of the samples
are outside the linear
detection range
(>4000 RFU/>5000
RFU*), stutters, split
peaks, and artifacts
may be increased
Reduce the injection time in increments to a
minimum of 1 s, reduce the amount of the PCR
amplification product for analysis, or reduce the
quantity of DNA for PCR.
c) Bubbles in the capillary
lead to pull-up peaks
in all color panels
(“spikes”) that result in
allele misnomer
Repeat electrophoresis to confirm results.
d) Differences in the run
performance among
the capillaries of a
multi-capillary analyzer
may result in allelic
assignment shift
For reliable allelic assignment on multi-capillary
analyzers, a number of allelic ladders should be
run.
e) Use of 32-cycle PCR
program for small
amounts of DNA
Too small amounts of DNA may result in allelic
dropouts and imbalances of the peaks.
Furthermore, unspecific amplification products
may appear. By increasing the number of cycles,
there is a risk of cross-contamination due to
impurities.
Injection/file of the allelic ladder is not appropriate
a) An additional signal
can be identified as
peak of the allelic
ladder because of
dysfunctions during the
electrophoresis. If
peaks of the allelic
ladder are miscalled,
the ladder cannot be
used for the analysis
Use a different injection/file of the allelic ladder
and check the data of the analyzed sizes from
the Size Standard (in bp) of the allelic ladder.
Always use the DNA Size Standard 550 for
Investigator Human Identification PCR Kits.
* >4000 RFU for the ABI PRISM 310 Genetic Analyzer; >5000 RFU for the ABI PRISM 3100
and Applied Biosystems 3130/3500 Genetic Analyzers.
62
Investigator Argus Y-12 QS Handbook 02/2015
Comments and suggestions
b) One peak of the allelic
ladder is below the
peak detection value
(50–200 RFU) of the
analysis method used,
and thus, is not
identified
The allelic ladder must be loaded onto the
analysis instrument at a higher concentration
than samples to be analyzed.
c) One peak of the allelic
ladder is not identified
because it is outside
the expected size range
of the software (in bp)
Compare the length of the fragments (in bp) of
the first allele in one color of the allelic ladder
with the corresponding value in the categories.
Then compare it with the other alleles.
d) Point alleles are not
found
Point alleles are i.e., alleles with at least 1 bp
difference to the next integer allele. Check the
settings of the analysis method. Lower the Peak
Window Size value to 11 points.
Alternatively, allelic ladder data can be analyzed
with a lower peak detection value in Analysis
Software.
Investigator Argus Y-12 QS Handbook 02/2015
63
References
QIAGEN maintains a large, up-to-date online database of scientific
publications utilizing QIAGEN products. Comprehensive search options allow
you to find the articles you need, either by a simple keyword search or by
specifying the application, research area, title, etc.
For a complete list of references, visit the QIAGEN Reference Database online
at www.qiagen.com/RefDB/search.asp or contact QIAGEN Technical Services
or your local distributor.
Cited references
1. Gill, P., et al. (2001) DNA commission of the International Society of
Forensic Genetics: recommendations on forensic analysis using Ychromosome STRs. Int. J. Legal Med. 114, 305.
2. Gill, P., et al. (2001) DNA Commission of the International Society of
Forensic Genetics: recommendations on forensic analysis using Ychromosome STRs. Forensic Sci. Int. 124, 5.
3. Gusmão, L., et al. (2005) DNA Commission of the International Society
of Forensic Genetics (ISFG): an update of the recommendations on the
use of Y-STRs in forensic analysis. Int. J. Legal Med. 119, 1.
4. Kittler, R., Erler, A., Brauer, S., Stoneking, M., and Kayser, M. (2003)
Apparent intrachromosomal exchange on the human Y chromosome
explained by population history. Eur. J. Hum. Genet. 11, 304.
5. Füredi, S., Woller, J., Padar, Z., and Angyal, M. (1999) Y-STR
haplotyping in two Hungarian populations. Int. J. Legal Med. 113, 38.
6. Butler, J.M., Decker, A.E., Kline, M.C., and Vallone, P.M. (2005)
Chromosomal duplications along the Y-chromosome and their potential
impact on Y-STR interpretation. J. Forensic Sci. 50, 1.
7. Stein, B., Willuweit, S., Nagy, M., Vogt, P.H., and Roewer, L. (2005) AZF
deletions of the Y chromosome and failed amplification of commonly
used Y-STRs. 21st Congress of the International Society for Forensic
Genetics, Ponta Delgada, Portugal.
8. Szibor R, et al. (2003) Cell line DNA typing in forensic genetics – the
necessity of reliable standards. Forensic Sci. Int. 138, 37.
64
Investigator Argus Y-12 QS Handbook 02/2015
Ordering Information
Product
Contents
Cat. no.
Investigator Argus
Y-12 QS Kit (100)
Primer mix, reaction mix, DNA Polymerase,
Control DNA, allelic ladder, DNA size
standard, and nuclease-free water
383615
Related products
Investigator Human Identification PCR Kits
Investigator Argus
X-12 Kit (25)*
Primer mix, reaction mix, DNA Polymerase,
Control DNA, allelic ladder, DNA size
standard, and nuclease-free water
383213
Investigator 24plex
QS Kit (100)*
Primer Mix, Fast Reaction Mix 2.0 including
Taq DNA Polymerase, Control DNA, allelic
ladder 24plex, DNA size standard 550
(BTO), and nuclease-free water
382415
Investigator ESSplex
Plus Kit (100)*
Primer mix, Fast Reaction Mix including
HotStarTaq® Plus DNA Polymerase, Control
DNA, allelic ladder ESSplex Plus, DNA size
standard 550 (BTO), and nuclease-free water
381535
Investigator ESSplex
SE Plus Kit (100)*
Primer mix, Fast Reaction Mix including
HotStarTaq Plus DNA Polymerase, Control
DNA, allelic ladder ESSplex SE Plus, DNA size
standard 550 (BTO), and nuclease-free water
381545
Investigator IDplex
Plus Kit (100)*
Primer mix, Fast Reaction Mix including
HotStarTaq Plus DNA Polymerase, Control
DNA, allelic ladder IDplex Plus, DNA size
standard 550 (BTO), and nuclease-free water
381625
Investigator HDplex
Kit (100)
Primer mix, reaction mix, DNA Polymerase,
Control DNA, allelic ladder, DNA size
standard, and nuclease-free water
381215
Investigator Triplex
AFS QS Kit (400)
Primer mix, reaction mix, DNA Polymerase,
Control DNA, allelic ladder, DNA size
standard, and nuclease-free water
380317
Investigator Triplex
DSF Kit (400)
Primer mix, reaction mix, DNA Polymerase,
Control DNA, allelic ladder, DNA size
standard, and nuclease-free water
380327
* Larger kit sizes available; please inquire.
Investigator Argus Y-12 QS Handbook 02/2015
65
Product
Contents
Cat. no.
Investigator DIPplex
Kit (25)*
Primer mix, reaction mix, DNA Polymerase,
Control DNA, allelic ladder, DNA size
standard, and nuclease-free water
384013
Investigator Quantification Kits
Investigator
Primer mix IC FQ, reaction mix FQ, Control
Quantiplex Kit (200) DNA Z1, dilution buffer
387016
Investigator
Quantiplex HYres Kit
387116
Primer mix IC YQ, reaction mix FQ, Control
DNA Z1, dilution buffer
Investigator Human Identification PCR Kit Accessories
DNA Size Standard
550 (BTO) (100)
DNA Size Standard 550 (BTO) for 100
reactions
386015
Matrix Standard BT5 Matrix standard 6-FAM, BTG, BTY, BTR,
single cap. (5 x 25) and BTO
386113
Matrix Standard BT5 Matrix standard 6-FAM, BTG, BTY, BTR,
multi cap. (25)
and BTO
386123
Matrix Standard BT5 Matrix standard 6-FAM, BTG, BTY, BTR,
multi cap. (50)
and BTO
386125
Multi Taq2 DNA
Polymerase (100)
386315
100 Units Multi Taq2 DNA Polymerase
DNA extraction and purification
QIAamp® DNA
Investigator Kit (50)
50 QIAamp MinElute Columns, Proteinase K,
Carrier RNA, Buffers, Collection Tubes (2 ml)
56504
EZ1® DNA
Investigator Kit (48)
Reagent Cartridges, Disposable Filter-Tips,
Disposable Tip-Holders, Sample Tubes
(2 ml), Elution Tubes (1.5 ml), Buffer G2,
Proteinase K, Carrier RNA
952034
For 192 preps of 200 μl each from
QIAsymphony®
DNA Investigator Kit casework and reference samples: includes
(192)
2 reagent cartridges and enzyme racks and
accessories
MinElute PCR
Purification Kit (50)*
50 MinElute Spin Columns, Buffers,
Collection Tubes (2 ml)
931436
28004
* Larger kit sizes available; please inquire.
66
Investigator Argus Y-12 QS Handbook 02/2015
For up-to-date licensing information and product-specific disclaimers, see the
respective QIAGEN kit handbook or user manual. QIAGEN kit handbooks and
user manuals are available at www.qiagen.com or can be requested from
QIAGEN Technical Services or your local distributor.
Investigator Argus Y-12 QS Handbook 02/2015
67
Notes
68
Investigator Argus Y-12 QS Handbook 02/2015
Notes
Investigator Argus Y-12 QS Handbook 02/2015
69
Notes
70
Investigator Argus Y-12 QS Handbook 02/2015
Trademarks: QIAGEN®, QIAamp®, QIAsymphony®, EZ1®, HotStarTaq®, Investigator®, MinElute® (QIAGEN Group); 3500™, ABI PRISM®, Applied
Biosystems®, Avant™, GeneAmp®, GeneMapper®, GeneScan®, Genotyper®, 6-FAM™, POP-4™, Hi-Di™ (Applera Corporation or its subsidiaries);
Eppendorf®, Mastercycler® (Eppendorf AG); GenBank ® (US Department of Health and Human Services). Registered names, trademarks, etc. used in
this document, even when not specifically marked as such, are not to be considered unprotected by law.
Limited License Agreement for the Investigator Argus Y-12 QS Kit
Use of this product signifies the agreement of any purchaser or user of the product to the following terms:
1.
The product may be used solely in accordance with the protocols provided with the product and this handbook and for use with components
contained in the kit only. QIAGEN grants no license under any of its intellectual property to use or incorporate the enclosed components of this
kit with any components not included within this kit except as described in the protocols provided with the product, this handbook, and
additional protocols available at www.qiagen.com. Some of these additional protocols have been provided by QIAGEN users for QIAGEN
users. These protocols have not been thoroughly tested or optimized by QIAGEN. QIAGEN neither guarantees them nor warrants that they do
not infringe the rights of third-parties.
2.
Other than expressly stated licenses, QIAGEN makes no warranty that this kit and/or its use(s) do not infringe the rights of third-parties.
3.
This kit and its components are licensed for one-time use and may not be reused, refurbished, or resold.
4.
QIAGEN specifically disclaims any other licenses, expressed or implied other than those expressly stated.
5.
The purchaser and user of the kit agree not to take or permit anyone else to take any steps that could lead to or facilitate any acts prohibited
above. QIAGEN may enforce the prohibitions of this Limited License Agreement in any Court, and shall recover all its investigative and Court
costs, including attorney fees, in any action to enforce this Limited License Agreement or any of its intellectual property rights relating to the kit
and/or its components.
For updated license terms, see www.qiagen.com.
© 2010–2015 QIAGEN, all rights reserved.
www.qiagen.com
Australia [email protected]
Austria [email protected]
Belgium [email protected]
Brazil [email protected]
Canada [email protected]
China [email protected]
Denmark [email protected]
Finland [email protected]
France [email protected]
Germany [email protected]
Hong Kong [email protected]
India [email protected]
Ireland [email protected]
Italy [email protected]
Japan [email protected]
Korea (South) [email protected]
Luxembourg [email protected]
Mexico [email protected]
The Netherlands [email protected]
Norway [email protected]
Singapore [email protected]
Sweden [email protected]
Switzerland [email protected]
UK [email protected]
USA [email protected]
1091087 02/2015
Sample & Assay Technologies