1
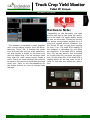
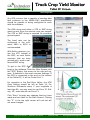
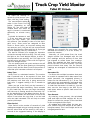
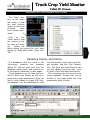
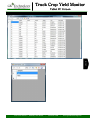
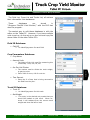
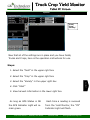
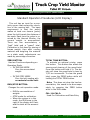
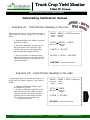
Innovative Technological Solutions for Agricultures Challenges
Truck Crop Yield Monitor
Tablet PC Version - 2011
204 Fifth Street E., Halstad, MN 56548
-
218.456.2486
-
www.geektechforag.com
Truck Crop Yield Monitor
Tablet PC Version
Innovative Technological Solutions for Agricultures Challenges
Contents
Page 1
Section 1
Nuts & Bolts
Section 2
GPS Configuration
Section 3
Yield Monitor Configuration
Section 4
Setting the Data Home Location & Database Display and Editing
Section 5
Section 6
Field Names, Truck IDs & Crop Parameters
Section 7
Operation
Section 8
KB Manufacturing Harvest Monitor (TNKN-0700-BELT)
a - Standard Operation Procedure
b - How to Enter Parameters & Parameters List
c - Test Weight Calibration
d - Calculating Calibration Values (2000-2010 Cal Chip)
e - Entering Calibration Values and Zero Static Weight (2000-2010 Cal Chip)
f - Calculating & Adjusting Calibration Value (2011 & Newer Cal Chip)
g - Time and Date Option
h - Load Cell Connection
204 Fifth Street E., Halstad, MN 56548
-
218.456.2486
-
www.geektechforag.com
Truck Crop Yield Monitor
Tablet PC Version
Innovative Technological Solutions for Agricultures Challenges
Nuts & Bolts - Virtual & Real
Page 1
Section 1
Hardware Note:
Depending on the harvester, the data
may be sent one or two times per revolution of the shaft. The weight ideally should
be sent no more than 3 times per second.
The laptop version takes weights up to 6
times per second without problems, but
the Pocket PC has a tough time keeping
up over 3 Hz. The shaft RPM reading in
the software is calculated for one pulse
per revolution. If the shaft RPM is reading
over 150, we may want to look at putting
on a collar with only one pulse per revolution. On the other side, if the shaft RPM is
reading below 60 we may want to put a
collar on that has two pulses per revolution.
This software is designed to work together
with a truck weight monitor from KB Manufacturing, Fisher, MN. It handles the inputs
from the load cells and the shaft speed sensor and outputs a weight to the serial port
with the weight that is on the conveyor each
time that the shaft speed sensor sends a
pulse. There are some settings that need to
be made in the monitor to send data from the
serial port. Refer to the documentation for
the weight monitor for how to change these
settings.
204 Fifth Street E., Halstad, MN 56548
-
218.456.2486
-
www.geektechforag.com
Truck Crop Yield Monitor
Tablet PC Version
Innovative Technological Solutions for Agricultures Challenges
GPS Configuration
Any GPS receiver that is capable of sending data
that conforms to the NMEA-0183 specification
should be capable of being configured to work
with the software.
Section 2
The GGA string and either a VTG or RMC string
must be sent from the receiver once per second.
The VTG or RMC string is required for providing
ground speed.
The baud rate can be
configured in the software, 4800 or 9600 is
recommended.
With Satloc receivers, select the VTG instead of
the RMC, as most Satloc
receivers that we have
worked with, send a malformed RMC string.
To get to the GPS Settings in the software, from the Main Screen click
the “GPS” Button, the screen to the right will appear. It defaults to the most common settings. If
the GPS is connected to the port on the bottom
of the Tablet PC, it will be Comm Port 1.
For operation in the Red River Valley, the UTM
Zone Setting should be left at Zone 14. For
Southern Minnesota users, if your longitude is
less than 96, you may want to use Zone 15. Sidney, MT, users should use Zone 13.
Click “Save” to apply any changes that you have
made and exit back to the Main Screen. Clicking
the “X” in the top right corner will exit but will
not save changes.
204 Fifth Street E., Halstad, MN 56548
-
218.456.2486
-
www.geektechforag.com
Truck Crop Yield Monitor
Tablet PC Version
Innovative Technological Solutions for Agricultures Challenges
Yield Monitor Configuration
updating too smoothly for your taste, then
decrease the number, if it is too erratic, increase the number.
Internally, all yield pulses from the truck
weight monitor are averaged with the last
four readings and the amount of time that
has elapsed to collect those four readings.
Those four readings are then used to calculate a crop flow in ‘Lbs Per Second’. The filter
period controls how many ‘Lbs Per Second’
readings are averaged to calculate the final
yield.
Delay Time
Harvester ID
Delay Time is a calculated number. The number
that is entered here is the amount of time that
elapses from when the crop is first introduced into
the machine until that crop is going across the
load cells. I suggest setting it at 6 seconds to
start.
When you get to the field, put the harvester in
the ground and begin harvesting. Count seconds
in your head from the time you begin harvesting
until the crop is flowing across the load cells. Enter the elapsed time in the delay time box. By doing this, the software will look back in time to see
where it was when the crop that is on the load
cells now was harvested. This will help to create
precise yield maps.
For farms with multiple harvesters that want
to be able to separate which data came from
which harvester, the suggested scheme is
letters for the Harvesters A, B, C, D etc. The
load names are automatically generated with
the scheme Harvester ID-Load Number. The
1st load from Harvester A is load A-1. You can
then use the time tags in the DBF File to
track down where a specific load came from
in the field.
Section 3
To make the settings required for yield monitor operation, click the “Yield” button.
The most difficult setting to
make is the Comm Port selection. Depending on the
Tablet PC, the port that is
created when the Serial IO
card is inserted is numbered
differently on almost every
PC.
It should be between 4 and
7. If the port does not exist
when you click “Start”, you
will receive a “Port Already in Use or Is Not Available” error. Since ports are assigned to Blue
Tooth or Phone ports, an incorrect setting may
not cause an error, but just will not communicate
with the Yield Monitor. Start with Port 6, if you get
an Error Message, then try 5 and then 7.
The test for success is to engage the harvester
so that the sensed shaft is turning. This will cause
the light on the Truck Weight Monitor to blink. If
communications are working, the “YM” light in the
top left corner will blink in time with the light on
the Truck Weight Monitor.
The row spacing and row count numbers are self
-explanatory. Set the Row Spacing to the spacing
of your rows, and the Row Count to the number of
rows that your harvester collects in a full pass.
Tare Percent
By entering a tare percent, the calculated
yield and load and field weights will be adjusted to reflect the percent of the load that
is dirt coming back to the field.
All weights and yields reflect the tare percent, EXCEPT the truck weight as the load is
being harvested. This is raw weight and is not
being adjusted for tare.
Filter Period
Filter Period is the number of seconds of yield
readings averaged using a moving average to create the values that will be stored in the map. 4
seconds is the suggested setting. If the display is
204 Fifth Street E., Halstad, MN 56548
-
218.456.2486
-
www.geektechforag.com
Truck Crop Yield Monitor
Tablet PC Version
Innovative Technological Solutions for Agricultures Challenges
Setting the Data Home Location & Database Display and Editing
The “Data” button, in the lower
left corner, is how
the user controls
where to store the
collected
data
from harvest operations.
Section 4
Click
on
the
“Data” button, and
the screen to the
far right will come
up.
Select the
folder where you would like your data
stored (or “Make New Folder”) then click
“OK”.
Database Display and Editing
The databases that are used in GK
Technology products are standard
dBase IV. We will start with how the
database editor works and continue on
to the specific databases in later pages.
These databases can be read and created in Excel and Access as well as a
great many other applications. Since we
had to write dBase to create SHP files,
we adopted it as the databases to hold
204 Fifth Street E., Halstad, MN 56548
the field names, truck names and target weights, and the Crop Parameters. The Field and Load Reports also
use the dBase format as well, more
on that in the Collected Data Section.
This is showing the first record in the
Crops database. Screen shot on the
bottom of the page shows the Crop
parameters table in Excel.
-
218.456.2486
-
www.geektechforag.com
Truck Crop Yield Monitor
Tablet PC Version
Innovative Technological Solutions for Agricultures Challenges
Section 5
204 Fifth Street E., Halstad, MN 56548
-
218.456.2486
-
www.geektechforag.com
Truck Crop Yield Monitor
Tablet PC Version
Innovative Technological Solutions for Agricultures Challenges
Field Names, Truck IDs & Crop Parameters
The Field List, Crops List and Trucks List, all retrieve
their information from databases.
These
databases
are
stored
in
“\Program Files\GK Yield Monitor\” with the EXE that
runs the program.
The easiest way to edit these databases is with the
editor on the Tablet PC. However, if you have multiple
units to set up, do the set up on one unit and copy the
above folder to the other Tablet PC’s.
Field ID Database:
⇒ Field ID
⇒ An identifying name for each field.
Crop Parameters Database:
⇒ Crop Name
⇒ Harvest Units
⇒ The Name of the Unit used for measuring this
commodity. Tons, cwt, bu, etc.
Section 6
⇒ Lbs Per Unit Divisor
⇒ The number used to divide the truck weight,
to get the units.
⇒ Enter 2000 for tons, 100 for cwt etc.
⇒ Tare Percent
⇒ Enter the % of tare that is being returned to
the field from the piler.
Truck ID Database:
⇒ Truck ID
⇒ An identifying name for this truck.
⇒ Net Weight
⇒ This entry is the desired net pounds that you
would like loaded on this truck. When entered, it will subtract from the current truck
weight and show lbs left to load.
204 Fifth Street E., Halstad, MN 56548
-
218.456.2486
-
www.geektechforag.com
Truck Crop Yield Monitor
Tablet PC Version
Innovative Technological Solutions for Agricultures Challenges
Operation
“Field”
“Crop”
“Variety”
Now that all of the settings are in place and you have Fields,
Trucks and Crops, here is the operation instructions for use.
Steps:
1. Select the “Field” in the upper right box
2. Select the “Crop” in the upper right box
3. Select the “Variety” in the upper right box
Section 7
4. Click “Start”
5. View harvest information in the lower right box
As long as GPS Status is OK
Each time a reading is received
the GPS Indicator Light will re-
from the Yield Monitor, the “YM”
main green.
Indicator Light will flash.
204 Fifth Street E., Halstad, MN 56548
-
218.456.2486
-
www.geektechforag.com
Truck Crop Yield Monitor
Tablet PC Version
Innovative Technological Solutions for Agricultures Challenges
KB Manufacturing Harvest Monitor (TNKN-0700-BELT)
Standard Operation Procedures (LCD Display)
This unit has an input for a proximity sensor that senses the revolution of the moving belt. The basic
requirement is that the switch
makes at least one closure (pulse)
when the belt travels the distance of
the scale. Each time the pulse is received by the Harvest Monitor, the
current weight is accumulated.
There are two accumulators, a
"load" total and a "grand" total.
Calibration is first done by placing of
known weight, then after running
material and weighing the material
on a static scale, adjustments are
made by percentage correction.
ZERO BUTTON:
Has two Functions depending on
Operation Mode:
⇒ IN THE RUN MODE
Zero the accumulated
weight.
⇒
IN THE STOP MODE
Zero the belt reading with
no material on the belt.
RUN/STOP BUTTON:
Changes the unit operation mode.
RUN for accumulation of
weights
⇒ STOP mode for calibration.
⇒ When the system is in this
mode, the RUN lamp to the
right of the display will flash,
and the total will be accumulated.
TOTAL TONS BUTTON:
To activate an optional printer, press
this button. This button also allows the
viewing and clearing of the grand total.
Press the button and hold it in. The display will show the grand total in tons by
1/10 ton increments. To clear the grand
total, press the ZERO button while still
holding the TOTAL TONS button.
Note: This does not clear the load accumulation; this needs to be done separately by pressing the ZERO button
while in the RUN mode.
⇒
-
218.456.2486
-
www.geektechforag.com
Section 8a
204 Fifth Street E., Halstad, MN 56548
CAL-1 & CAL-2:
Used For Calibration and Data Entry
Truck Crop Yield Monitor
Tablet PC Version
Innovative Technological Solutions for Agricultures Challenges
KB Manufacturing Harvest Monitor (TNKN-0700-BELT)
How to use parameters
Parameter Entry:
1. Turn OFF and hold the CAL-1 button.
2. Turn ON while holding the CAL-1 button until the
display shows ------- then release the CAL-1 button.
3. Press and release the RUN/STOP button.
4. The display will show 01--nn (The 00 denotes
parameter number 1 and the nn may be any 2digit number representing the current value set
for parameter number 1.
5. To change the value of this parameter, press the
TOTAL TONS button until the digit you want to
change is flashing.
6. Press the CAL-2 button to increment the flashing
digit.
7. To cycle to the next parameter, press the TOTAL
TONS button until the parameter number is flashing, then increment by pressing the CAL-2 button.
8. Continue steps 5 through 7 for all parameters
desired.
9. When finished, press the CAL-1 button to return
to the weight display mode.
Parameter List
# 0 = (Default 01) Number of pulses per accumulate (1 to 9) Set to the number of pulses that
it takes to accumulate when in the RUN mode.
For example: To wait for 4 pulses of the proximity sensor before accumulating, then set this
parameter to 04. (NOTE: A value of 00 or
greater than 09 is not allowed).
splice passes, this will create an increase in
accumulated weight it the system is left in
the accumulate mode when the belt is running and empty. Set this parameter to the
minimum value that can be accumulated. If
product on the scale will always be over this
5 bounce, then set this parameter higher
than 5 but less than a normal weight value.
# 1 = (Default 01) The sample/averaging rate. A
setting of 1 is the fastest display rate update,
and does not average. A setting of 3 (for example) will take 3 samples and average them
before updating the displayed weight.
MAKE SURE THAT THE THE UDATE RATE IS
FASTER THAN THE MAXIMUM PULSE RATE
FROM THE PROX. SWITCH.
# 6 = (Default 00) The decimal point position.
ie, 02 will cause 0.00
# 7 = (Default 01) The print size and Time/
Date option 00=small 01=medium 02=large
all with no time/date print
10=small 11=medium 12=large with time/
date printed
# 2 = (Default 01) The displayed graduation size.
Set at 10 if a graduation size of 10 is required.
# 8 = (Default 01) Printer pre-spaces (indent)
and print inverted x0 = non inverted print
x2 = inverted print
0x = no pre-spaces
2x = 4 pre-spaces(double the digit entered)
# 9 = (Default 23) Remote data enable / Printer
type and baud rate
x0= 300 baud inverted data
x1= 300 baud print data
x2= 1200 baud PR-2 roll-tape printer
x3= 1200 baud PR-1 ticket printer
0x= no remote output
1x= continuous remote output enabled
2x= For GPS output sent when conveyor
pulse in RUN mode
# 4 = (Default 02) The motion detection window
setting. Set this to the number of graduations
that will be allowed as a no-motion condition.
# 5 = (Default 07) ACCUMULATION THRESHOLD
This parameter is used to set the minimum
value that can be accumulated. For example,
if the empty belt bounces to 5 when the belt
204 Fifth Street E., Halstad, MN 56548
-
218.456.2486
-
www.geektechforag.com
Section 8b
# 3 = (Default 99) LEAVE THIS SET AT 99
The overload trip-point in hundreds of graduations +1% If the scale is to be 2,500 by a
graduation of 1, then a setting of 25 would
cause the overload to activate at 2,525.
Set to 99 if no overload point is desired.
Set to 00 for a 10,000 graduation overload.
Truck Crop Yield Monitor
Tablet PC Version
Innovative Technological Solutions for Agricultures Challenges
KB Manufacturing Harvest Monitor (TNKN-0700-BELT)
Test Weight Calibration
This procedure is done to set the initial calibration. From then on, the
"Minor" calibration routine can be used.
1. Turn OFF and hold the CAL-1 button.
2. Turn ON while holding the CAL-1 button until the display shows------- then
release the CAL-1 button.
3. Press and release the CAL-2 button.
4. The display will show the raw UN-calibrated value.
5. Assure that the scale is at a zero load condition.
6. Press ZERO to remove the dead load.
7. Load the scale with a known weight value.
8. The display must now show a value larger than the test weight. If the display
is not larger than the weight value, do one of the following.
⇒
⇒
⇒
Check the load cell size, it may need to be reduced.
Increase the graduation size.
Raise the internal amplifier gain by adding the jumper across the gain pins
on the main board.
9. When the weight is stable, press the RUN/STOP button and the display will
come up with the last used calibration weight that was entered. If this is the
same weight as what was placed on the scale, go to step #11.
11. Press the CAL-1 button, and the display will return to the weight display
mode, showing the calibrated weight.
204 Fifth Street E., Halstad, MN 56548
-
218.456.2486
-
www.geektechforag.com
Section 8c
10. Change the display to show the known calibration weight value.
⇒ Press the TOTAL TONS button to select the flashing digit.
⇒ Press the CAL-2 button to increment the flashing digit.
Truck Crop Yield Monitor
Tablet PC Version
Innovative Technological Solutions for Agricultures Challenges
KB Manufacturing Harvest Monitor (TNKN-0700-BELT)
Calculating Calibration Values
Example #1: Yield Monitor Reading is Too Low
The displayed total on the Harvest Monitor is
26500 and the actual weight of this load is
38900.
38900 - 26500 = 12400
actual
weight
1. Subtract 26500 from 38900 to get the
difference (12400)
12400
difference
2. Divide the difference (12400) by the
Harvest Monitor total (26500) to get
(.4679) and move the decimal point 2
places to get percentage 46.79%.
(difference)
displayed
weight
..
26500 = 0.4679
displayed
weight
0.4679 = 46.79%
3. Since we need to increase the total,
add 100.00 percent to get 146.79% and
use this as the entry in the percent correction procedure.
46.79% + 100% = 146.79%
146.79% - Percent Correction
Example #2: Yield Monitor Reading is Too High
The displayed total on the Harvest Monitor is
56200 and the actual weight of this load is
32490.
56200 - 32490 = 23710
displayed
weight
23710
difference
..
56200
displayed
weight
0.4218 = 42.18%
42.18% - Percent Correction
204 Fifth Street E., Halstad, MN 56548
-
218.456.2486
-
www.geektechforag.com
Section 8d
1. Subtract 32490 from 56200 to get
the difference (23710)
2. Divide the difference (23710) by the
Harvest Monitor total (56200) to get
(.4218) and move the decimal point 2
places to get the percentage 42.18%
42.18 is the entry for the percent
correction procedure.
(difference)
actual
weight
Truck Crop Yield Monitor
Tablet PC Version
Innovative Technological Solutions for Agricultures Challenges
KB Manufacturing Harvest Monitor (TNKN-0700-BELT)
Calibration to Truck Weights
After initial calibration, the system can
be run and the material weighed by a
static scale. The static weight then can
be compared to the systems accumulated total and a calibration correction can
be made.
The recalibration can decrease the total by any amount, but can
only increase by 99.99 percent. Therefore if the true weight is more the twice
the systems total, do the initial calibration correctly, then re-run a test load.
PERCENT CORRECTION
PROCEDURE:
1. ASSURE THAT THE SYSTEM IS IN
THE STOP MODE
2. To access this feature, requires that
two buttons be pressed and released quickly and at the same
time. Press and release the CAL-1
button and the CAL-2 button at the
same time.
3. If done correctly, the display will
show 0000.00.
4. Enter the percent to correct. (Over
100.00 is up, below 100.00 is
down)
5. Use the TOTAL TONS button to increment the flashing digit and use
the RUN/STOP button to change
which digit is flashing.
6. When the desired number has been
set, press the CAL-2 button to enter
the number.
7. With the belt clear, press ZERO to
balance the scale.
Section 8e
204 Fifth Street E., Halstad, MN 56548
-
218.456.2486
-
www.geektechforag.com
Truck Crop Yield Monitor
Tablet PC Version
Innovative Technological Solutions for Agricultures Challenges
KB Manufacturing Harvest Monitor (TNKN-0700-BELT)
Adjusting your Calibration
My Cal Value is _______________
For this example the Beginning Cal # 620
Example #1: Yield Monitor Reading is Too Low
The displayed total on the Harvest Monitor is 26500 and truck weight of this load is 38900.
Truck Weight / KB Weight = Cal change %
38,900 / 26,500
= 1.468%
Cal # x Cal Change % = NEW CAL VALUE
620 x 1.468 = 910
Example #2: Yield Monitor Reading is Too High
The displayed total on the Harvest Monitor is 56,200 and truck weight of this load is 32,490.
Truck Weight / KB Weight = Cal change %
32,490 / 56,200
= 0.578%
Cal # x Cal Change % = NEW CAL VALUE
620 x 0.578 = 358
1. Turn the Display OFF
2. Press & hold the CAL-1 and turn on the display.
3. If done correctly, the display will show - - - - - - 4. Press the TOTAL TONS button, this will display the “Current Cal Value”
6. When the New Cal Value has been entered, press the CAL-2 button.
7. With the belt clear & running, press ZERO to balance (zero) the scale.
8. Press the RUN button to collect data
Note: Once calibrated “WRITE DOWN YOUR CALIBRATION VALUE”
204 Fifth Street E., Halstad, MN 56548
-
218.456.2486
-
www.geektechforag.com
Section 8f
5. Use the TOTAL TONS button to increment the flashing digit and use the
RUN/STOP button to change which digit is flashing.
Truck Crop Yield Monitor
Tablet PC Version
Innovative Technological Solutions for Agricultures Challenges
KB Manufacturing Harvest Monitor (TNKN-0700-BELT)
Time and Date Option
If the time/date option is installed, the
time and date can be printed after the
weight. The time and date is battery
powered and will run when power is removed from the unit.
To View and or Set the Time/Date:
Press the CAL-1 button, and
hold until the display shows the
current time, and then after a
short delay, the date will be
displayed.
⇒
To set the Time/Date, press
and hold the ZERO button,
while the time/date is being
displayed. After the date has
been displayed, the unit will go
into the entry mode, with the
time display flashing.
⇒
Use the TOTAL TONS button to
increment the flashing digit,
and use the RUN/STOP button
to select which digit flashes.
⇒
When the correct time has
been set, press and release the
CAL-2 button to advance to the
DATE display.
⇒
Use the TOTAL TONS button to
increment the flashing digit,
and use the RUN/STOP button
to select which digit flashes.
⇒
When the correct date has
been set, press and release the
CAL-2 button to return to the
weight display mode.
204 Fifth Street E., Halstad, MN 56548
Section 8ig
⇒
-
218.456.2486
-
www.geektechforag.com
Truck Crop Yield Monitor
Tablet PC Version
Innovative Technological Solutions for Agricultures Challenges
KB Manufacturing Harvest Monitor (TNKN-0700-BELT)
Load Cell Connection
INSIDE TERMINAL
PIN
PIN
PIN
PIN
PIN
#
#
#
#
#
1
2
3
4
5
=
=
=
=
=
NEG EXCITATION (Black)
POSITIVE EXCITATION (Red)
POSITIVE SIGNAL (Green)
NEGATIVE SIGNAL (White)
SHIELD
REVERSE SIGNAL LINES IF SCALE OPERATES BACKWARDS
INTERNAL CONECTOR DB9 (* denotes lines for proximity switch)
* PIN 1 ---- DC GROUND (Proximity switch ground)
PIN 2 ---- RS232 CONTINUOUS DATA OUTPUT (OPTIONAL)
* PIN 3 ---- PULSE INPUT from proximity switch
PIN 4 ---- (RS232 SIGNAL INPUT - OPTION)
* PIN 5 ---- 5 volt power for solid state proximity switch
PIN 6 ---- Printer data to pin 3 of printer, or -20ma Printer data
PIN 7 ----+20ma Printer
PIN 8 ---- Continuous data to computer, or - 20ma continuous data.
PIN 9 ---- + 20ma continuous
Printer Data:
Baud rate selectable 300, 600, or 1200
Data bits are 8 with 2 stop bits and no parity
Nominal single line print data string will be;
Polarity sign / 6 weight digits / LB or KG or TN / Time and
Date if option is ordered / Carriage Return and Line Feed.
------------------------------------------------------------Remote Continuous Data:
Baud rate is 1200 fixed.
Data bits are 8 with 2 stop bits and no parity
Section 8h
Data stream is as follows;
STX / Space or - / 6 weight digits / L / G for gross /
if negative
K N for net
Space or a
/ Carriage Return / Line Feed
M if in motion or
O if in overload
204 Fifth Street E., Halstad, MN 56548
-
218.456.2486
-
www.geektechforag.com