1
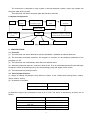
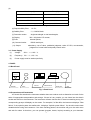
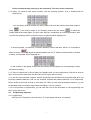
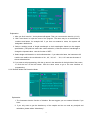
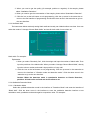
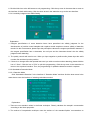
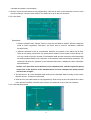
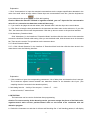
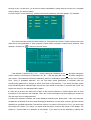
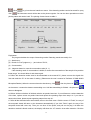
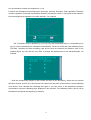
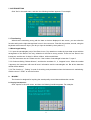
DNM-9602G Microplate Reader
USER’S MANUAL
Madell Technology Corp.
7372 Walnut Ave. Suite V
Buena Park, CA 90620
USA
Phone: 1-877-670-9023
http://www.madelltech.com
1
CONTENTS
1. INTRODUCTION
1.1 CHARACTERS
1.2 MAIN FUNCTIONS
1.3 DENOMINATING RULE
1.4 WORK CONDITIONS
1.5 DIMENSIONS AND WEIGHT
2. PRINCIPLE AND FEATURES
2.1 WORK PRINCIPLE
2.2 STRUCTURE FEATURES
2.3 SYSTEM CONFIGURATION
3. SPECIFICATIONS
3.1 FUNCTIONS
3.2 TECHINCAL SPECIFICATIONS
3.3 POWER SUPPLY
4. PANEL
4.1 BACK PANEL
4.2 PREPARATIONS AND EXAMINATION
5. PROGRAMMING
5.1 PROGRAMMING INTRODUCTION
5.2 PROGRAMMING OPERATION
6. DETECTION
7. SYSTEM SETTING
7.1 TIME SETTING
7.2 WAVELENGTH SETTING
8. INQUIRY
9. MAINTENANCE
9.1 FILTER
9.2 LAMP
9.3 TRAY
9.4 FUSE
10. TRANSPORTATION
11. PACKING LIST
12. QUALITY GUARANTEE
13. WARNING
2
1.
INTRODUCTION
1.1 Characters
The DNM-9602G Microplate Reader is a semi-automated bench top instrument focused on clinical
immunity-test in hospitals or epidemic preventing stations. It has good characters such as high sensitivity,
high accuracy, high speed of detection and the easiness of operation etc. Display is a liquid crystal one with
alphanumeric and graphic options. Parameters can be checked on the display without using difficult
command sequences.
1.2 Main Functions
(1) The instrument is mostly used for the detections of viruses, germina, symbols of tumor, human body’s
hormones and other items based on the principles of immunology in the clinical tests;
(2) Corresponding detection for microanalysis in chemistry or biochemistry.
1.3 Denominating Rule
DN
M-
9602
G
Serial Number
Designing Number
Symbol of the instrument
Symbol of computer
1.4 Work Conditions
(1) Environmental temperature:
(2) Relative humidity:
10~30℃;
<=70%;
(3) Keep away from strongly electromagnetic field and avoid direct irradiation by strong light;
(4) Avoid dust and shake. There must be no caustic gas such as hydrochloric acid in air;
(5) Before you begin to detect, you must wait 20 minutes for a complete warm up since the instrument has
been switched on.
1.5 Dimensions and Weight
Dimension: 420×325×210 mm(l×h×w)
Weight: 10 kg
2. PRINCIPLE AND FEATURES
2.1 Work Principle
Work principle of the instrument is photoelectric colorimetry. Firstly, the instrument detects
absorbencies of the under-detecting sample and the standard liquid. Secondly, it analyses and calculates
the absorbencies. Finally, it produces the value or the condition of the under-detecting material in the
sample liquid.
2.2 Structure Features
The instrument has two main components: the mainframe and the printer.
3
The mainframe is composed of optic system, 8-channel detection system, single chip system and
enzymatic plate driving system.
The instrument can detect enzymatic plate that has 96 or 48 wells.
2.3 System Configuration
Lamp
Optic
system
8-channel
Prismatic organ
Enzymatic
plate
Photoelectric
detection
Drive circuit
Steady-voltage
power
Simulative-signal disposal
and A/D-conversion circuit
CPU
Display
Keyboard
Printer
RS232 serial port
Fig. 1: System Configuration
3. SPECIFICATIONS
3.1 Functions
(1) The instrument can detect absorbency and do quantitative, qualitative and kinetic detection.
(2) The instrument maximally memories 120 programs in common use and displays parameters of the
programs on LCD;
(3) The instrument can automatically select filters for different items;
(4) When the instrument starts up, it will auto-check at first. Then an initial setting and self-check will begin
to operate. If there is something wrong, the corresponding prompt will appear on the screen;
(5) The instrument has printing function.
3.2 Technical Specifications
(1) Range of working wavelength is from 400nm to 700nm. It has 4 filters when leaving factory: 405nm,
450nm, 492nm, 630nm;
(2) Characters of the filters
Accuracy of wave (nm)
Half-width(nm)
±3.0
≤12
Table 1: Characters of the Filters
(3) Detection range of the instrument is from 0.1A to 3.0A. The errors of absorbency accuracy are as
follows:
Absorbency (A)
Accuracy Error
0.1--1.0
±1.0% or ±0.01A
>1.0--2.0
±2.0% or ±0.02A
>2.0--3.0
±5.0% or ±0.05A
>3.0--4.0
±8.0% or ±0.15A
Table 2: Absorbency Accuracy
4
(4)
Absorbency (A)
Error (%)
0.1--1.0
±0.8
>1.0--2.0
±1.0
>2.0--3.0
±3.0
>3.0--4.0
±6.0
Table 3: Linearity of the Instrument
(5) Reproducibility Error:
≤0.5%;
(6) Stability Error:
≤±0.005A/10min;
(7) Detection modes:
single wavelength or dual wavelengths;
(8) Display:
320×240 pixels LCD screen;
(9) Print:
external printer;
(10) Communication:
(11) Output:
RS232 serial port;
absorbency, cut-off value, qualitative judgment, value of P/CO, concentration,
judgment of normal value and quality control value
3.3 Power Supply
(1)
Voltage:
220×(1±10%)V;
(2)
Frequency:
(3)
Power supply must be earthed perfectly.
50×(1±2%)Hz;
4. PANEL
4.1 Back Panel
Switch
Fuse
Power
RS232 Port
Print port
Fan
Fig. 3: Back Panel
4.2 Preparation and Examination
You should first examine the instrument whether there are scathes such as distortion and crack for the
sake of inappropriate transportation and storage. If there isn’t any scathe, you can insert into the electric
socket and switch on the instrument. The instrument will auto-check at first. If there is something wrong, the
corresponding prompt will display on the screen. For example, if a filter fails, the instrument displays “Filter
failure”; if the optical system has malfunction, it displays “Optical system failure”. You should correct these
mistakes before using the instrument. If the auto-checking passes, the machine will go to the main menu
and wait for orders. At that time, you can operate (program, detect, inquire) according to your demands.
5
Before you begin to detect, you must wait 20 minutes for a complete warm up since the instrument has
been switched on. If the instrument has no operations for 30 minutes, it will automatically switch to the
sleeping state in order to prolong its life. When you start operating again, the instrument will return to the
normal state.
5. PROGRAMMING
Before beginning detection, you should first program according to your demands. In order for
convenience of later work, order of program numbers should be based on the following principles:
(1) Put the most commonly used detection items in the front and arrange combined items together.
(2) Because the instrument only allows five items to process quality controls synchronously, you should put
the item, which needs quality control, in the first five items when programming.
5.1 Programming Introduction
5.1.1 The following picture is the main menu of the instrument.
Explanation:
Detect: After the programming is finished, you can click the icon to begin to detect. It allows to select
item, set the row number and the column number and decide whether to use the calibrating
factors saved in the instrument or not.
Program: Click the icon to enter the interface of programming. The instrument can save 120 programs
(from 0 to 119).
Set: The instrument allows setting wavelengths and the system time and deleting all items saved,
detection results, quality control results and the calibrating factors.
Inquire: Query the result of quality control, detection results and parameters of programs.
Time: After you click the icon of Time, the current time shows on the bottom of the display. The time will
show a few seconds and then return to the main menu.
Finish: After you click the icon of Finish, the tray returns to the instrument and then the instrument
does not respond for other icons. Till you click the icon again to make the tray comes out, you
can click other functional icons.
Caution: After you click the icon of Finish, the system will save some important parameters
(For example, results of quality control and detection results. So you must click the icon of
6
Finish and wait the tray returning to the instrument. Then turn off the instrument.
5.1.2 When you need to input some numbers, click the inputting position. Then a keyboard will be
displayed as:
You can directly click the number you wan to select. When all the numbers have been entered,
press
. If the number needs to be changed, please click the button
to delete the
number entered and enter again. The item name may be a combination of numbers and letters. After
you click the inputting position of the item name, a keyboard will be displayed as:
In above keyboard, 1/A means a conversion between number and letter. When it is conversed to
letter, the button
will appear for selecting letters from A to Z. When the well’s position is needed
to select, the keyboard will be displayed as:
In this moment, it will appear a letter after first clicking and will appear the corresponding number
after second clicking.
5.1.3 There is a status bar on the left side of the display when you are programming. Click the up arrow to
return to the previous menu and click the down arrow to go to the next menu.
5.1.4 You can freely set blank, negative, positive and quality-control wells on the enzymatic plate when you
are doing qualitative detection. And you can set blank, negative and positive wells from 1 to 3, respectively.
But the quality control well must be no more than one. When you are doing quantitative detection, you can
set standard wells from small to large values according to rows or columns.
5.1.5 In the process of programming, you can click the icon on the left bottom to exit programming and
return to the main menu.
5.2
Programming Operation
5.2.1 Programming
Click the icon of Program in the main menu. The next display will show, for example:
7
Explanation:
1. After you click “Item No.”, the keyboard will appear. Then you can enter the item No. (0-119).
2. Click “Item Name” to input the name of the program. The name may be a combination of
numbers and letters, for example 8IG. If you have not entered a name, the system will
designate a default one.
3. Select a working mode of single wavelength or dual wavelengths based on the reagent
specification. (The pink box means the current selection.) Click the number of wavelength to
change the inputted value(see the function of SET).
4. Select single well detection or dual wells detection. If you select the latter, the instrument will
combine two wells in the row direction as “A1, A2”, “A3, A4” … “H11, H12” and use the mean of
the two absorbencies.
5 If you want to exit programming, click the up arrow in the status bar in the right side of the screen
or click the icon at the left bottom. Click the down arrow to go to the next interface of
programming.
5.2.2 Vibration Mode and Detection Mode
Explanation:
1. The instrument has the function of vibration. But we suggest you use external vibration if you
have.
2. If you only want to get the absorbency of the sample and do not need any analysis and
calculation, please select “Absorbency”.
8
3. When you need to get the quality (for example, positive or negative) of the sample, please
select “Qualitative Detection”.
4. When you need to get the concentration of the sample, please select “Quantitative Detection”.
5. Click the icon at the left bottom to exit programming, click the up arrow in the status bar to
return to the first interface of programming and click the down arrow in the status bar to go into
the next interface.
5.2.3 Set Blank Well
The instrument allows randomly setting blank wells and mostly set 8 blank wells at one time. User can
select the mode of “Average Column Blank Wells” and set all the 8 wells of one column as
blank wells. For example:
Explanation:
1. When you select “Randomly Set”, click the strings and input the number of blank wells. Then
input the positions of the blank wells. When you select “Average Column Blank Wells”, directly
input the column number and needn’t input position of every well.
2. Click the icon at the left bottom to exit programming. Click the up arrow in the status bar to
return to the interface of “Vibration mode and detection mode”. Click the down arrow in the
status bar to go to the next interface.
Caution: When the detection mode is quantitative detection or Kinetic Detection,
positions of blank wells are fixed and do not allow to set.
5.2.4 Qualitative Detection Mode
5.2.4.1 Calculation Mode
Select the qualitative detection mode in the interface of “Detection Mode” and enter the interface of
“Blank Well”. Click the down arrow in the interface to enter the qualitative detection interface to set
calculation mode, qualitative mode and negative comparison value. For example:
9
Explanation:
1.
The definitions of letters in above formula are as follows:
NCV----Negative comparison value
P----Absorbency of under-detection sample;
N----Average absorbency of negative-control wells;
Y----Average absorbency of positive-control wells;
A, B, D, A1, B1, D1, A2, B2, D2----Parameters needed to input(according to reagent
specification).
CO, CO1, CO2----Cut-off values used for judgment.
2. Click “Single”, and then the instrument displays the next interface of inputting the parameters: A, B, D.
Please input the three parameters according to the reagent specification. Click the down arrow in the status
bar to finish the operation of inputting the three parameters. The parameters set will not display in the
process of programming, but appear in detection. If the calculation mode is “Single”, “+” means positive and
“-” means negative.
3. The “Dual” calculation mode demands to input two groups of parameters. The first group is A1,B1 and
D1. The second group is A2,B2 and D2. Take these two cut-off values as upper limit and lower limit to judge
quality (positive or negative). Inputting method is the same as that of “Single”. If the calculation mode is
“Dual”, “+” means positive; “-” means negative; “ ”(blank) means the absorbency is between the two cut-off
values.
4.
Please input two parameters at the position of “Limit Value”. (Click the underline and the keyboard
appears) The two parameters are the upper limit and the lower limit for subsection of absorbencies. Make
the difference of the two parameters to 10 average shares. The difference between the two absorbencies
and the lower limit is put to the corresponding subsection. The result is a number from 0 to 9. For example,
input two parameters 0.5 and 1.0. Average subsection is 0.05. If the absorbency is 0.6, the difference
between the sample’s absorbency and the lower limit is 0.1 and then the result is 2.
5.
If the regent specification prescribes that when the negative-control value is less than the input value
(for example: 0.05) you should calculate according to the input value, please click the corresponding
underline and input the regulated value. If the regent specification prescribes that when the negative-control
value is more than the input value (for example: 1.20) you should calculate according to the input value,
please click the corresponding underline and input the regulated value.
10
6. Click the little icon at the left bottom to exit programming. Click the up arrow in the status bar to return to
the interface of blank wells setting. Click the down arrow in the status bar to go to the next interface.
5.2.4.2 Invalidity Judgment and Wells Setting
Explanation:
1. Reagent specifications of some detection items have prescribed the validity judgment for the
absorbencies of positive-control samples and negative-control samples to ensure validity of detection
results. On this circumstance, please input the prescriptive value as the reagent specification demand. If
the reagent specification has no demands, do not input and the instrument doesn’t do the validity
judgment when detecting.
2. The quality control well must be one. When you input negative or positive wells, please input the well’s
number first and then input the position.
3. If there is no change about the inputted items and you wish to use them when detecting, please click the
icon of “Save”. Click the icon of “Exit” to quit this programming. Click the up arrow in the status bar to
return to the superiors interface. Thus, the programming of qualitative detection mode is complete.
5.2.5 Quantitative Detection Mode
5.2.5.1 Detection Mode
Click “Quantitative Detection” in the interface of “Detection Mode” and then click the down arrow in the
status bar to enter the interface of selecting calculation method.
Explanation:
1. There are two standard values in the linear technique. Directly calculate the sample’s concentration
according to the linear proportion.
2. The method of interpolation technique uses the sections of the standard liquids’ concentrations to
11
calculate the sample’s concentration.
3. Click the icon at the left bottom to exit programming. Click the up arrow in the status bar to return to the
previous interface. Click the down arrow in the status bar to go to the next interface.
5.2.5.2 Set Wells
Explanation:
1. Click the underline after “Dilution Factor” to input the real dilution multiple. When the detection
mode is “Ratio Logarithmic Technique”, the factor input is used for calculation coefficient
(revised factor).
2. When the detection mode is concentration detection, the position of the blank well is fixed.
There is one quality control well. You should select whether to have quality control data or not.
You only needs to input the number of the standard wells and the instrument will automatically
set wells’ positions based on the direction of the standard wells and detection demands. The
instrument will show the positions of the standard wells when it displays the item information
before detection.
Caution: You must first set the direction of the standard wells, and then input the quality
control well. If the direction of the standard wells has been changed, the quality control
well must be set again.
3. The direction A1, B1 of the standard wells means put the standard wells according to the column
direction and A1, A2 means row direction.
4. Click the icon at the left bottom to exit programming. Click the up arrow in the status bar to return
to the previous interface. Click the down arrow in the status bar to go to the next interface.
5.2.5.3 Set Standard Values
12
Explanation:
1. Click “Concentration” to input the standard concentrations as the reagent specification demands in the
order from small values to large values. Please input two concentrations each line. (Use the keyboard to
input values and then press
to finish this inputting.
Caution: When the detection method is logarithm method, you can’t input the first concentration
value if it is 0, otherwise the detection results will be wrong.
2. If you need to do judge the normal values, click “Normal Value” and then input two normal values.
3. Click “Save” to keep the item parameters in the instrument and then return to the main menu. If you click
“Exit”, the instrument will not save the parameters. Click the up arrow to return to the previous interface.
5.2.6 Absorbency Detection Mode
Click “Absorbency” in the interface of “Detection Mode” and then click the down arrow in the status bar
to enter the interface of blank wells setting. After you set the blank wells, click the down arrow in the status
bar. Then save the results. The operations are the same as above.
5.2.7 Kinetic Detection Mode
5.2.7.1 Click “Kinetic Detection” in the interface of “Detection Mode” and then click the down arrow in the
status bar to enter the following interface.
Explanation:
1. Click underline to input the corresponding parameters. Unit of delay time and detection time is second.
The instrument adjusts interval between two detections based on the detection time input. (The
sampling times is 6 seconds in the detection period.)
2. Calculating formula:
Activity of the enzyme=△A/min×F (IU/L)
In above formula, F means factor.
6. DETECTION
The instrument can be used to clinical test after programming.
Caution: To ensure veracity of the detecting results, you must arrange the places of the blank wells,
negative-control wells and the positive-control wells on the board to be consistent with the
detection program.
6.1 Switch the instrument on and then it will start self-checking first. If self-checking passes, it will display
13
the main menu. At that time, you should not detect immediately. Please wait 20 minutes for a complete
warm up before you begin to detect.
6.2 Click “Detect” in the main menu, and then the following detection interface appears. For example:
The LCD shows item names and item numbers of 18 programs at one time. Click the down arrow in the
status bar to see parameters of other programs. Please select a program number before detection. After
selection, click the icon
to return to the main menu.
If the direction of detection is A1, A2…, click the string bar “Detecting to Col.
” and then change the
column number; if the direction of detection is A1, B1…, click the string bar “Row
” and then change the
row number. The instrument has saved calibrating factors of quantitative detection and the cut-off values
(CO1, CO2) of qualitative detection. You can use these saved parameters to calculate (click the
corresponding parameter to change) or select “Use result of this detection”. If you select the latter, please
input standard liquids to calibrate again and use the new results to calculate. If you select the former, the
sample can be put on the standard wells to detect.
6.3 Click the up arrow in the status bar to return to the previous interface or click the down arrow to show
information of the detection item selected. When the correct information has been displayed, continue to
click the down arrow to begin detection.
6.4 When the detection is started, the screen displays “Detecting now, please wait.”. After a few seconds,
the detection is finished. First, the instrument displays absorbency of every well; second, it give the result of
qualitative or quantitative detection. Results from column 1 to column 6 first show on LCD. If you wish to see
the results from column 7 to column 12, please click the button of Next at the bottom of the display. The
symbol of * means there is no detection in the position. If you want to print the absorbency, please click
14
. Click
click
to go into the next interface or return. If the detecting results need to be stored for query,
. The instrument sends all the data to the printer together. You can do other operations once the
printing starts and needn’t wait. The printing format shows as table 3.
Item
Plate
Wavelength
Date
Time
Operator
-----------------------------------------------------------------------------01 02 03 04 05 06 07 08 09 10 11 12
A
B
(Results)
C
D
E
-0.8
F
Qualitative Results
+1.3
P/CO Value
Table
3:
Printing
Format
G
H
Negative
Positive
Cut-off value
Quality control
Explanation:
The program decides the output of detecting results. Detecting results are mainly four:
(1) Absorbency;
(2) Result of cut-off judgment (+, -) and value of P/CO;
(3) Concentration;
(4) Judgment based on normal concentration value (H, L).
If the detecting result of concentration is 99999, it means the concentration of the sample is beyond the
linear range. You should dilute it and detect again.
6.5 When the detection results need to be transmitted to the external PC, please connect the signal wire
first and make the PC in the state of waiting. (Please see the user’s manual of Software of DNM-9602G
Microplate Reader.) When the screen shows the absorbency, click
then the picture of
shows
on the screen. It means the data are transmitting now. Until the transmitting is finished,the picture of
does not disappear.
6.6 When all the work above is finished, take the enzymatic board out. If you still want to continue detection
of the item, replace a new enzymatic board and repeat the operating steps since step 6.4. If you wish to
detect other items, please repeat operating steps since step 6.1.
6.7 After all the detection items are finished, return to the main menu. Click the menu of “Finish”, the tray of
the enzymatic board will return to the instrument automatically (if you click “Finish” again, the tray of the
enzymatic board will come out). Then you can shut off the power, and pull out the plug. 6.8 When the
detection method is kinetic method, the display will show the A-T reaction chart after detection. Click the
15
icon at the bottom to switch the sample from 1 to 8.
6.9 When the calculation mode is Regression Technique, Semi-log Technique, Total Logarithmic Technique
or Ratio Logarithmic Technique of quantitative detection and select the item of “Use results of this detection”,
the screen displays the standard curve after detection. For example:
The Y-coordinate may be absorbency (A) or log10 (A) and the abscissa may be concentration(C) or
og10(C), which is decided by the calculation mode selected. The line is confirmed by the calibrating factor.
The letter r denotes the lineal correlating ratio and the pink box denotes the detection value of the
standard liquid. You can click the icon “Edit” to change the absorbencies of the standard liquids. For
example:
Click the corresponding position of the number and input a new absorbency. When the new number
has been entered, click the up or down arrow in the status bar and return to the interface, where calibrating
curve shows. Then calculate the correlating ratio again. If you click “Next”, it will calculate the sample’s
concentration using the calibrating factor displayed in this interface. The calibrating factor a and b can be
showed and changed at the beginning of detection.
16
7. SYSTEM SETTING
Click “Set” in the main menu, and then the following interface appears. For example:
7.1 Time Setting
When there is something wrong with the date or the time displayed in the screen, you can select the
function and input the right date and time in turn in the next menu. First click the position; second, using the
keyboard at the bottom to input. (The bit you input is decided by the symbol of *.)
7.2 Wavelength Setting
7.2.1 Input the wavelengths (nm) of the filters in turn. Pay attention to make the input data accord with the
arrangement of the filters in the tray, otherwise it will lead to wrong results. There are four filters in the
instrument, and the turn of them is: 405nm, 450nm, 492nm and 630nm.
7.2.2 The instrument can set 7 filters at most. If the number of wavelength is less than 7, input 0.
7.2.3 Continue clicking “Delete all items”, and then the numbers of 1, 2, 3 appear in turn. When the number
3 appears, the instrument will save all items’ information and the wavelengths set. But all the detection
results will be deleted.
7.2.4 The function of
“Debug” is used for checking work parameters when the instrument is maintaining.
Click the icon of “STOP” to exit the function.
8.
INQUIRY
The function is designed for inquiring the saved quality-control data and detection results.
8.1 Inquiry Introduction
Click “Inquire” in the main menu, and then the following interface appears. For example:
17
Explanation:
1. If you need to print the quality-control results, click “Result of QC”. The screen displays the symbol of *.
The symbol means the item number (0-5). The six items are quality-control items detected in this month.
When you input the item number, the LCD shows the data of this item.
2. When “Detection Result” is selected, the screen will display the list of detection results. Enter the result
number you want to inquire. Then the display shows the saved result. There are 30 results saved in the
instrument. Click the up arrow or the down arrow to go other interface. Click the icon of “STOP” to exit
inquiry.
3. When the instrument displays the detection results or the quality-control results, a keyboard appears at
the bottom.
When inquiring the detection results, the user should select “Print” or “Trans” and the function of “Save”
is invalid. But when the instrument displays the quality-control results, the functions of “Trans” and
“Save” are invalid and the function of “Next” is changing between quality-control results and
quality-control chart.
4. The format of “Item Information” is the same as that appeared in the interface of detection. Click “Item
Information”, and the display shows “****”. At this moment, enter the item number (1-3 bits) and click
.
5. Click the up or down arrow in the status bar to leave the interface.
9. MAINTENANCE
The instrument only needs cleaning in normal usage. But the following assemblies will be invalid or
have malfunctions after a long time usage. You may as well maintain them under the guidance of
professional.
9.1 Filter
The transmission rate of filters will be declined after a period of usage. When the instrument doesn’t
work naturally, it will give you a clue. In order for accuracy of detection, the invalid filter must be changed by
professional in time.
9.2 Lamp
The instrument will prompt you if the light lamp fails. At that time, you should open the lid of the
instrument and examine it. If you confirm that the lamp is invalid, please change for the same standard lamp.
If something is wrong with the power, you should repair it.
9.3 Tray
When there is something wrong with the tray (it can’t pass in and out of the instrument), there are some
possible reasons: down lead of the step-motor does not perfectly link; synchronous strap is loose or doffed;
movement parts shift and block etc. Please find out the causation and get rid of the malfunction.
9.4 Fuse
If the fuse burns out, you must cut off the power supply at first, and then change the fuse for the same
standard. You may as well change the fuse under the professional’s guidance.
18
10. TRANSPORTATION
(1) Range of environmental temperature: -20℃ ~
+55℃;
(2) Relative humidity of environment: <=93%;
(3) Range of atmosphere pressure: 500hpa~1060hpa.
11. PACKING LIST
Name
Number
(1) DNM-9602G Microplate Reader
1
(2) Printer
1
(3) User’s manual
1
(4) Product certificate
1
(5) User checking and accepting sheet
1
(6) Accessories
a. Wire for power supply
1
b. Fuse φ5×20 2A
2
c. Plastic cover
1
12. QUALITY GUARANTEE
We will repair or replace the instrument or accessories free of charge if there is any problem with the
instrument, provided that you have complied with the instructions of this operating manual, and it is within
one year from the date of purchase. You will be charged if you have not followed this operating manual or
you have disassembled the instrument without authorization. We will answer maintenance related
questions for the instrument even after the one year warranty period.
13. WARNING
(1) The power supply should be grounded perfectly;
(2) Filters must be changed by a trained professional.
Madell Technology Corp.
7372 Walnut Ave. Suite V
Buena Park, CA 90620
USA
Phone: 1-877-670-9023
http://www.madelltech.com
19