
1
Advanced Well Testing Tools Copyright ©2015 Petro Class Inc. www.petroclass.com About PetroClass FlowTest FlowTest is a Production Testing software tool for testing oil and gas wells in Alberta Canada. FlowTest implements the Alberta Energy and Utilities Board (EUB) Pressure ASCII Standard (PAS PRD) version 4.00. FlowTest generates and reads PAS PRD V4 files and the accompanying PDF image files. FlowTest implements all meter types and standards defined by the ERCB PAS PRD V4 Pressure ASCII Standard. In Addition to standard production tests, FlowTest provides the ability to perform completion tests including perforating and fracturing, with commingled flow and load fluid recovery reporting. If you have any questions or comments about PetroClass FlowTest, please feel free to contact us at [email protected] or visit us at www.petroclass.com Mission Critical Disclaimer THIS SOFTWARE AND SUPPORTING MODULES (INCLUDING REAL-TIME DATA COMPONENTS) ARE NOT SUITABLE FOR USE AS PART OF A MISSION CRITICAL OPERATION OR SAFETY MONITORING SYSTEM. At PetroClass safety is a top priority and we recognize the importance of properly designed, redundant safety systems. PetroClass software products DO NOT meet the stringent requirements of such systems. In general, ANY software running on a commercial operating system, using (off the shelf) hardware is NOT SUITABLE for monitoring critical systems! Be cautious of those who make claims to the contrary. Copyright ©2015 Petro Class Inc. www.petroclass.com Version History (New Additions) Version 4.5.0.0 • • Added ‘Net Cum’ Series (zero meters during the test). Added ‘High Flow Rate’ alarm to gas and liquid meters. Version 4.3.6.1 • • November 2013 Added in-situ mixture velocity calculation and erosional velocity alarm. Added liquid lift/loading calculation and liquid loading alarm. Added Flow-Time calculations for gas only option. Version 3.3.1.0 • April 2014 Added PetroClass Cloud functionality (News, Files & Job-Sync to cloud) Version 3.5.0.0 • • • October 2014 Added Strip chart view. Added Table formatting for data comments. Added ability to create new views (plot, table, strip chart) on the fly without the need to use the UI designer. Version 4.0.0.0 • February 2015 Added Calculated Generic Series. Added ‘Table Smart Tag’ to retrieve any series value. Version 4.2.5.0 • • • July 2015 Added Total Liquids, GLR and LGR to the data summary. Added the option to specify ISO date Formatting in the CSV Export. Version 4.3.3.0 • • September 2015 August 2013 Added Data Table Stage Comments. Copyright ©2015 Petro Class Inc. www.petroclass.com Version 3.2.0.0 January 2013 • Added Custom Excel export templates. See Appendix A. • Added Series categories for ‘Add to’ tables and plot dialog boxes. • Added Series categories and ability to add/remove series from tables and plots via the navigation bar. • Added Plot annotations (with series items) that represent end-of-test values. • Added TVD entries/calculations(hole deviation survey) for test intervals Version 3.0.5.0 October 2012 • • Added ability to specify (override) the destination of any individual gas meters production to: flare, vent, pipeline … Added the ability to save/recall table comments. Version 3.0.0.0 • Added Real-Time data capabilities. Version 2.8.3.0 • • • March 2012 Added dual load recovery (Oil/Water) to the oil meter. Added gas produced to flare, vent, pipeline … to the data summary group. Added flare permit (with flare permit remaining series) to the data summary group. Version 2.8.1.0 • • • • • • August 2012 January 2012 Plot Enhancements. Added Custom Report Templates. Added additional Test Information, Contact entries. Data Table will display numbers as ##### if the column is too narrow. Added CSV attachment for the report. Added report data table row filter. Copyright ©2015 Petro Class Inc. www.petroclass.com Version 2.7.0.0 • • • • • Propane Load Gas. Test Separators and Wellhead Series. User Defined Data Table Header. PDF Report Bookmarks. Plot label customizations. Version 2.5.0.0 • • • October 2010 Added previous production for all meters. Add sand recovery to water and oil/water meters. Added additional reporting options. Version 2.0.1.0 • May 2011 September 2010 Added user definable report header items. Version 1.29.6.12 • Added subsonic velocity flow correction to choked gas meters. Version 1.29.6.4 • • Added Rate series for N2 & CO2 gasses in gas meter Added Total Fluid Rate series in liquid meter Version 1.29.6.3 • Added Spell Checker. The spell checker is optional and is installed separately from the main FlowTest installer package (you can find this installer on the FlowTest download page) Version 1.29.6.0 • • • Added Excel Data Export. Added Table Comment Smart Tags. Added ability to attach PAS file to the PDF report. Version 1.29.5.5 • Added Plot Series Annotation Items Copyright ©2015 Petro Class Inc. www.petroclass.com Version 1.29.5.0 • • • • • Modified ‘Data Summary’ to include totals for all, produced and load fluids. Added option to PAS generator to exclude load fluids from the generated PAS file. Added ‘Include in Totals’ option for all meters. Modified Reports to report produced and load fluids. Removed ‘Liquid Separator’ meter (load fluid is handled by the ‘frac gas’ and ‘load fluid recovery’ additions to base meters). The additions above complete the ‘frac gas’ and ‘load fluid recovery’ functionality (added to gas and liquid meters in previous versions). By making the ‘Data Summary’, PAS generator and reporting components, “load fluid aware”, it is now possible to discriminate between produced and load fluids consistently thought FlowTest. Version 1.29.4.0 • Add Load Fluid Recovery for liquid Meters Version 1.29.3.0 • • • • • • • • Add CSV data export Add Daily totals to reports Add custom colors for plot series Add ability to change report page order Add user defined logo to reports Add frac (N2, CO2) load gas recovery to gas meters Add auto-backup of data files Add additional entries for well information Version 1.19 • • Alarm Monitor (meter warnings) (Hydrate formation warning) Find In Series (search dialog) Version 1.18 • • Orifice plate sizing calculations and standard plate selector Daily Summaries additions to the PDF reports Copyright ©2015 Petro Class Inc. www.petroclass.com About PetroClass FlowTest ................................................................................................. 2 FAQ .................................................................................................................................... 10 FlowTest Menu and Toolbar items ................................................................................... 13 Test Information ............................................................................................................... 15 Production Intervals ...................................................................................................... 16 Deviation Survey ............................................................................................................ 17 General Test Comments ................................................................................................... 18 User Preferences and Defaults ......................................................................................... 19 Data Entry View ................................................................................................................ 20 Data Table ......................................................................................................................... 22 Change Units.................................................................................................................. 23 Set Decimal Point........................................................................................................... 25 Entering Test Comments ............................................................................................... 25 Data Plot............................................................................................................................ 32 Plot Toolbar and Menu items ........................................................................................ 33 Plot General Properties Dialog ...................................................................................... 34 Visual Editing of the Plot Axis ........................................................................................ 35 Plot Annotations ............................................................................................................ 38 Annotation Arrows ........................................................................................................ 40 Data Strip Chart................................................................................................................. 51 Strip Chart Toolbar and Menu items ............................................................................. 52 Configuring the Strip Chart ............................................................................................ 53 Strip Chart Properties .................................................................................................... 55 Creating Additional Plots, Tables and Strip Charts ........................................................... 66 User Interface Design Mode ............................................................................................. 67 Meters ............................................................................................................................... 73 Common Meter Options:............................................................................................... 74 Previous Production: ..................................................................................................... 74 Gas Meters: ....................................................................................................................... 76 Orifice Meter ................................................................................................................. 76 Critical Flow Prover Meter............................................................................................. 80 V-Cone Meter ................................................................................................................ 82 Pitot Tube Meter ........................................................................................................... 83 Choke Meter .................................................................................................................. 84 Turbine Meter................................................................................................................ 86 Measured Rate Meter ................................................................................................... 87 Gas Properties ............................................................................................................... 89 Frac. Load Gas Recovery ................................................................................................ 90 Gas To: Flare, Vent, Pipeline, Incinerate, Other ............................................................ 92 Liquid Meters .................................................................................................................... 93 Turbine Meter................................................................................................................ 94 Level Meter .................................................................................................................... 95 Measured Volume Meter .............................................................................................. 96 Copyright ©2015 Petro Class Inc. www.petroclass.com Measured Rate Meter ................................................................................................... 97 Liquid Separator Meter ................................................................................................. 98 Sand Recovery ............................................................................................................. 101 Liquid Load Fluid Recovery .......................................................................................... 104 Advanced Meter Properties (common to all meters)..................................................... 108 Series Properties ............................................................................................................. 113 Generic Series ................................................................................................................. 115 Calculated Generic Series: ........................................................................................... 117 Net Cumulative Series..................................................................................................... 122 Time Series Group ........................................................................................................... 126 Well Series Group ........................................................................................................... 129 Wellhead Series ........................................................................................................... 131 Separator Configuration .............................................................................................. 132 Liquid Loading .............................................................................................................. 134 Mixture Velocity .......................................................................................................... 138 Tubing/Casing Drawdown ........................................................................................... 140 Data Summary................................................................................................................. 141 Gas To: Flare, Vent, Pipeline, Incinerate, Other .......................................................... 142 Gas Flare Permit .......................................................................................................... 146 Alarms ............................................................................................................................. 150 Smart Tags....................................................................................................................... 154 Table Smart Tag Reference .......................................................................................... 155 Creating a data table comment with Smart Tags ........................................................ 159 Events .............................................................................................................................. 162 Marker Event: .............................................................................................................. 163 Zone Event: .................................................................................................................. 163 Inline Summary Event:................................................................................................. 164 Section Summary Event: .............................................................................................. 165 Add Load Fluid Event: .................................................................................................. 167 Liquid Meter Grind-out Event...................................................................................... 168 Reporting......................................................................................................................... 171 Quick Report ................................................................................................................ 172 Custom Report ............................................................................................................. 173 Report Options ............................................................................................................ 174 P.A.S. ............................................................................................................................... 187 Create PAS PRD file ...................................................................................................... 188 Read PAS PRD file ........................................................................................................ 198 Real-Time ........................................................................................................................ 199 User Interface .............................................................................................................. 199 Configuration ............................................................................................................... 202 Mapping RTM channels to FlowTest series ................................................................. 206 Troubleshooting........................................................................................................... 209 Cloud ............................................................................................................................... 210 Getting started............................................................................................................. 212 Copyright ©2015 Petro Class Inc. www.petroclass.com Creating an evaluation account ................................................................................... 213 Logging in ..................................................................................................................... 215 Client cloud access....................................................................................................... 217 Synchronizing a FlowTest job to the cloud .................................................................. 218 View, upload and download cloud files....................................................................... 227 Data Exporting ................................................................................................................ 233 CSV Export ................................................................................................................... 234 Excel Export ................................................................................................................. 235 Standard Conditions Dialog ............................................................................................ 238 Units (Metric/Imperial) ................................................................................................... 240 Start-Up View .................................................................................................................. 241 Data File Templates ........................................................................................................ 242 Backup File Recovery ...................................................................................................... 243 Absolute / Gauge Conversions........................................................................................ 244 Spell Checker ................................................................................................................... 246 APPENDIX A: Custom Excel Exports ................................................................................ 248 Example 1 .................................................................................................................... 249 Advanced Exporting Features ...................................................................................... 262 Manifest Reference ..................................................................................................... 267 Unit Tag Reference ...................................................................................................... 269 APPENDIX B: Smart Tag Reference ................................................................................. 271 APPENDIX C: Generic Series Expression Reference ........................................................ 273 APPENDIX D: FlowTest Block Diagram ............................................................................ 274 Copyright ©2015 Petro Class Inc. www.petroclass.com FAQ 1. In a PAS file, why are the gas rates reported in the Data summary section different than the gas rates reported at the meter level. All flow rates reported at the data summary level are average rates and have been normalized to properly represent material balance for all summarized fluids. The Meter Flow rates may differ (from the normalized data summary rates) if the meters integration method type is set to a trapezoidal mode. See ‘Advanced Meter Properties’ and ‘Data Summary’ sections of this document for more information. Also see: http://www.petroclass.com/flowtest/doc/ProdTestPitfalls1.pdf 2. When I start FlowTest I get a message about a spell check module being available. There is a spell checker add-on module that is installed separately from FlowTest. The install is available on the installation CD or download page. 3. The ‘Print’ menu option is disabled (grayed out) how do I print? FlowTest does not print directly to a printer; rather it generates PDF documents (which in turn can be printed). To print a table or plot, go to the ‘Reporting’ view, select the items for the report, and press the ‘Generate’ button. Once the report has been generated, you can use the print menu command (no longer grayed out) to print the PDF document. 4. Sometimes when I enter a time in the data table the date will increment on its own. If you enter a time less than the previous time, FlowTest assumes it is the next day and automatically increments the date. This behavior can be turned on or off in the ‘User Preferences’ table section. 5. How do I change the title printed on the report for the tables and plots, they seem to default to “Grid” and “Plot”? Either: a. When in the report generator the Report menu contains a “Report Titles…” option. b. Under the Plot or Table menu there is an item called “Report Title…” allowing you to change the report title? Copyright ©2015 Petro Class Inc. www.petroclass.com Can I create multiple plots and tables? Yes, any number of plots and tables can be created for a given test. See the section titled “PRD User Interface Design Mode” for instructions on customizing FlowTest to add additional plots and tables. 6. The PDF report has missing columns (but they are visible in the data table) Table columns can be excluded (filtered) when generating the report. On the Reporting Tab, under Contents, expand the table missing the columns. Then select Filter, Columns and check the missing columns. 7. How do I make the data table fit on a single page in the report? On the Report navigation bar under “contents” expand the Table node and check the “Fit To Page” option. Re-generate the report. 8. If I change the %CO2 or N2 load gas in the data table the total rate changes, why? When the load gas recovery option is added to a gas meter the load gas inputs (CO2, N2 or C3) become part of the volumetric rate calculation. FlowTest continually adjusts the gas properties to account for the added load gas in the output stream. In a typical case (for a constant static, diff and temp) as you add load gas (which is typically more dense than the methane reservoir gas) the volumetric flow rate decreases as the gas gravity increases. 9. Some numbers show up as #### in the data table, what does this mean? When numbers in the data table are displayed as ##### this means that the column width is too narrow to display the entire number. Increasing the column width will display the number. 10. Report headers are not updating to what was entered in the test information. The likely cause of this is that a previous user has entered test information (from a previous job) into the report preferences template. Go to ‘User Preferences’, ‘Report’ section, ‘Page Header Items’ and clear out the hard coded information. Test specific information should not be entered into the User preferences report header items. For more information see: Reporting, Report Options, Page Header Items. Copyright ©2015 Petro Class Inc. www.petroclass.com 11. How can I zero meters during the test? Meter and Data Summary totals can effectively be zeroed by using a ‘Net Cum’ series. Net Cum series allow you to net-out (or zero) any cum during the test. For additional information see: Net Cumulative Series. Copyright ©2015 Petro Class Inc. www.petroclass.com FlowTest Menu and Toolbar items • • • • • • • • • • • • • • • • • • • New File Open File Save File Cut Copy Paste User Preferences Calculator Standard Conditions Alarms Change Units units. Start Page Data Entry Reporting P.A.S. Test Information Test Comments Print About FlowTest - creates a blank FlowTest file from a template. - opens an existing FlowTest file. - saves the current FlowTest file. - cut to the clipboard. - copy to the clipboard. - paste from the clipboard. - display the User Preferences dialog. - display the calculator application. - display the Standard Conditions dialog. - display the alarm monitor dialog. - toggles the unit mode between Metric and Imperial - displays the start-up view - set the Navigation bar to the Data Entry view. - set the Navigation bar to the Report view. - set the Navigation bar to the PAS view. - display the Test Information dialog. - display the Test Comment dialog. - print the current report. - display current program information. Copyright ©2015 Petro Class Inc. www.petroclass.com • • • • • Spell Checker Highlight Smart Tags Restore View Maximize View UI Designer - Spell checker (on/off). - Highlight table smart tags (on/off) . - Restore a maximized view. - Maximize the active view. - Enter/exit UI design mode. Copyright ©2015 Petro Class Inc. www.petroclass.com Test Information The Test Information dialog is where well and company information is entered. The data entered in this dialog is used in the PAS file generation as well as the PDF report (see PAS and Reports sections). The Test Information dialog is accessed via the Test Information button on the main toolbar. Production Intervals can be defined as a single range or (by pressing the “Intervals…” button) additional perforations and zones can be defined. Copyright ©2015 Petro Class Inc. www.petroclass.com Production Intervals Production intervals are specified by a formation name along with a ‘from/to’ measured depth, optionally, true vertical depths can be either entered or calculated (given a deviation survey) by specifying the appropriate settings via the toolbar. Copyright ©2015 Petro Class Inc. www.petroclass.com Deviation Survey A deviation survey can be specified to calculate true vertical depths from measured depths for each perforation interval. For the deviation survey, entries can be calculated or entered manually as specified by the ‘Calculation Method’ toolbar setting as follows: • • • • • • None (Manual Entry) Tangential Balanced Tangential Average Angle Minimum Curvature Radius Of Curvature Copyright ©2015 Petro Class Inc. www.petroclass.com General Test Comments The Test Comments dialog can be used to record general test notes or user instructions. The “Display Comments when File is Opened” check box, when enabled, will cause the dialog to be displayed when the file is opened. The comments entered in this dialog will appear on the PDF report as a comment annotation (see reporting section). The Test Comments dialog is accessed via the Test Comments button on the main toolbar. Copyright ©2015 Petro Class Inc. www.petroclass.com User Preferences and Defaults The User Preferences and defaults dialog allows defaults to be set for the various views within FlowTest. User Preferences is accessed via the Preferences button on the main toolbar. User Preference Sections: Copyright ©2015 Petro Class Inc. www.petroclass.com Data Entry View The Data Entry Navigation bar panel contains the main data entry views. It is here where the actual test data is entered and displayed on various table and plot views. Copyright ©2015 Petro Class Inc. www.petroclass.com Data Entry Options: The Add Meter Button displays a menu of meter types that can be added to FlowTest. The upper pane of the Data Entry Navigation Bar displays a summary of current objects. These include all added meters, the meter data summary and the test time configuration objects. The Recycle object will contain delete objects (i.e. Meters) . The lower pane of the Data Entry Navigation Bar will display the properties of the currently selected object in the upper pane. To edit the object properties press the Edit button on the top of the Properties pane. Copyright ©2015 Petro Class Inc. www.petroclass.com Data Table The Data Table is the main interface to display and edit well, meter information and test comments. The columns in the table represent the objects configured in the ‘Data Entry’ Navigation bar. Copyright ©2015 Petro Class Inc. www.petroclass.com The Data table contains three main header rows. “Right Click” of the header row and column will display a context menu for the column. Table Header Context Menu Functions: • • • • • Remove Series Form Table Removes the series from the table (does not delete the series) Add To Table Displays a list of all available series for addition to the table Properties… Displays the series Properties Dialog Add Series to Plot Adds the series to the plot Find Displays a window to search for values in the column Change Units Copyright ©2015 Petro Class Inc. www.petroclass.com “Left Click” of the Series unit row displays a pick-list to change the column display units for the series. Copyright ©2015 Petro Class Inc. www.petroclass.com Set Decimal Point To change the number of digits displayed after the decimal point, select the “Dec…” option from the units drop down list. Entering Test Comments Test Comments are entered into the table by typing in the “Event” column. The comment entered spans the entire table and is displayed above any data already in the row. When editing comments an editing toolbar is displayed above the comment. The editing toolbar provides the ability to easily insert common super script characters and also edit the comment in a separate window when enhanced editing is required. Copyright ©2015 Petro Class Inc. www.petroclass.com Comment Editing/Formatting Options Table Comment Editor Window Comments can be edited in a separate window making it easier to create multi-line comments and align items with tab stops; along with providing additional features like table formatting (see Table mode below) and adding smart tags (see Smart Tag section for more information). In the Table Comment Editor, comments can be saved and recalled for easy reuse in the same or different test files. Copyright ©2015 Petro Class Inc. www.petroclass.com General Table Comment Editor Toolbar Buttons Table Comment Editor Modes Table Comments can be created in two basic formatting modes: 1) The freeform text mode provides a general text, editor to edit the test comment, and includes general editor abilities such as multiple lines and tab stops. 2) The formatted column mode (or table mode) provides greater control over the comment appearance when aligning discrete items into multiple columns and is ideal for creating test summaries with smart-tags items. In addition to the text and table formatting modes, a preview mode is available to preview the comment in place with smart-tags converted and formatting applied. Copyright ©2015 Petro Class Inc. www.petroclass.com Formatted Column (Table) Mode Table Comment Editor Window (Table Mode) Table Mode Toolbar Table mode formats the comment as a series of table cells. Table column widths may be sized and text alignment can be applied to individual cells making the table comment mode ideal for tabular information such as test summaries. Copyright ©2015 Petro Class Inc. www.petroclass.com Table Test Summary The ‘Test Summary’ button on the ‘Table Mode’ toolbar provides a convenient means of creating a test summary. The ‘Create Test Summary’ window (shown below) provides various options to select fluids and times for display in the summary. Create Test Summary window Test summaries created using the ‘Create Summary’ window can contain multiple test fluid types and up to 3 summarized columns. Copyright ©2015 Petro Class Inc. www.petroclass.com Stage Comments Test comments can be set as a ‘Stage comment’ whereby the comment is displayed as vertical text in the data table stage series of the ‘Test Time’ group as shown below. Stage comments are primarily intended to be a single line comment, if a multi-line comment is set as a stage comment the stage series will only display the first line. The stage comment series must be enabled in the data table in order to make the stage comments visible. Copyright ©2015 Petro Class Inc. www.petroclass.com Data table items displayed by a series of # symbols i.e. ###### (Train Tracks) indicate that the column width is to narrow to display the entire number in order to display the number increase the column width. This behavior can be disabled in the table section of the “User Preferences” dialog. As seen in the 2nd column, if a data column width is too narrow some significant digits are cut off, presenting erroneous values to the user. Copyright ©2015 Petro Class Inc. www.petroclass.com Data Plot The Data plot is a general plotting view which can plot any test series. Multiple axis are supported along with the ability to tie similar series to a common axis scale. Annotations can be added to indicate significant events. Example plot with one series and a single annotation. Plot configuration described below. Copyright ©2015 Petro Class Inc. www.petroclass.com Plot Toolbar and Menu items • • • • • • • • Plot Properties displays the General plot Configuration Dialog: Zoom changes the plot cursor to a magnifying glass. Click and drag the zoom cursor in the plot to zoom the enclosed area. Undo-Zoom will undo successive zoom actions. Auto-Scale scales all plot axis to display all series Cross-hair Cursor displays X and Y reference lines that track the cursor movement. Arrow Cursor displays the plot cursor as a standard arrow pointer. Add Annotation adds a new annotation to the plot Show/Hide annotations toggles the visibility of the annotation layer. Copyright ©2015 Petro Class Inc. www.petroclass.com Plot General Properties Dialog The Plot General Properties dialog allows for configuration of all plot parameters. In this dialog the following properties can be set: • • • • • • • • Grid Lines Axis Trackers (sliding axis windows that track the cursor) Plot Colors Plot Fonts Axis Auto-Scaling mode Axis Minimum and Maximum values Axis positioning Series Line type, color and symbols This dialog is accessed via the Plot Properties menu and toolbar button. Copyright ©2015 Petro Class Inc. www.petroclass.com Visual Editing of the Plot Axis Plot scales can be set in the General properties dialog as well as visually on the plot itself. • Method 1 Clicking on the upper or lower scale values of either the X or Y axis allows for a direct input of the scale value. Copyright ©2015 Petro Class Inc. www.petroclass.com • Method 2 a) When the cursor is in the axis scale area, pressing the space-bar cycles through the access the following axis scale cursors: b) Axis scale cursors can be accessed in the axis context menu via a “rightclick” on the axis. • • • • Pin Minimum Value holds the minimum value constant while increasing or decreasing the maximum value depending on the cursor movement. Pin Maximum holds the maximum value constant while increasing or decreasing the minimum value depending on the cursor movement. Pin Center holds the center value constant while increasing/decreasing the minimum and maximum values depending on the cursor movement. This function may also be viewed as a window sizing function. Move Window pans the data while keeping the data range (max – min) constant. To use the scale cursor: Select the desired Cursor. “Click and drag” within the axis scale to change the scale as per the cursor function. Copyright ©2015 Petro Class Inc. www.petroclass.com Holding the shift button down will accelerate the action. Press the “Esc” key to exit the Axis scaling action. Copyright ©2015 Petro Class Inc. www.petroclass.com Plot Annotations Annotations can be added to the plot by clicking on the “Add Annotation” button on the plot toolbar. To configure an annotation, “Right Click” to display the annotation context menu and select “Configure: This displays the Annotation Configuration dialog. Copyright ©2015 Petro Class Inc. www.petroclass.com The Annotation Configuration Dialog contains the following properties: • • • • • • • Color (Sets the background color for the annotation) Opacity slider (makes the annotation transparent) Anchor (defines a fixed location (anchor) which remains constant to the plot when the plot is resized) Border (draws a thin border around the annotation using the specified color) Annotation Type specified as either ‘Text’ for General Annotations or ‘Series Items’ for dynamic annotations. Annotation Text Window (the text for the annotation standard or “Rich-Text” mode) Above the annotation text window is a toolbar for setting standard text formatting Copyright ©2015 Petro Class Inc. www.petroclass.com Some additional items on the annotation context menu include: • Save in Template (Save the annotation when the file is saved as a template) • Delete (removes the annotation from the plot). • Lock Position (prevents the annotation from being moved on the plot). • Auto-Size (automatically sizes the annotation the fit the contents) • To Front, To Back (sets the position of Annotations relative to other annotations on the plot). • Arrow (Attaches the annotation to a plot series). (described below) Annotation Arrows Annotation Arrows can be added the plot annotation, effectively attaching the annotation to a point on any plot series. When the “Arrow” option is selected from the annotation context menu, the cursor will change to the Annotation arrow symbol. Use the arrow cursor the select a plot series point. Copyright ©2015 Petro Class Inc. www.petroclass.com Display the configuration dialog for the new annotation. Copyright ©2015 Petro Class Inc. www.petroclass.com Annotations with attached arrows have an additional anchor option. The arrow anchor option will keep the annotation positioned relative the arrow. If the annotation arrow is repositioned or the plot is rescaled the annotation will reposition itself relative to the new arrow position. If any of the other anchors are selected the annotation will remain in a fixed location irrespective of the arrow location. Once an arrow is positioned, the arrow can be moved either by dragging the arrow to a new location (or series) with the mouse or selecting the arrow and using the keyboard (arrow keys) to reposition the arrow. The annotation arrow has configuration options available via a context menu on the arrow itself. Copyright ©2015 Petro Class Inc. www.petroclass.com • • • • • Fill sets the arrow color Border specifies a border and border color for the arrow Connector specifies the attributes of the line connection the arrow to the annotation. Orientation allows for a fixed arrow position (where the “Automatic” option maintains the arrow parallel to the connector line). Symbol The arrow image can be replaced by a symbol Copyright ©2015 Petro Class Inc. www.petroclass.com Automatic arrow orientation maintains the arrow parallel to the connector line. Arrow position fixed at 90 ° Copyright ©2015 Petro Class Inc. www.petroclass.com Arrow symbol set Adding Content to Annotations with attached Arrows Arrow specific content can be added to the annotation through the use of pseudo variables. In the Annotation configuration dialog annotation pseudo variables can be used to display information about the arrow location Arrow Pseudo variables: • • • • • • <DateTime> Date and Time of the arrow location. <Date> Date of the arrow location. <Time> Time of the arrow location. <AName> Series name the arrow is attached to. <AValue> Series data value at the arrow location. <AUnit> Series units (current plot units) Copyright ©2015 Petro Class Inc. www.petroclass.com The resulting annotation and arrow in the plot. Pseudo variables are replaced with the actual series data and are updated if the arrow is reposition Copyright ©2015 Petro Class Inc. www.petroclass.com Series Annotations (with Annotation Arrows) Series Annotations work in conjunction with annotation arrows to display dynamic content for any data series. On the main annotation interface, select the ‘Series Items’ option to display data values for series at the arrow location. Copyright ©2015 Petro Class Inc. www.petroclass.com The annotation contains 3 main sections: • Header (text displayed at the top of the annotation) • Series Items (values of selected series at the arroe location) • Footer (text displayed at the bottom of the annotation) Press the ‘Edit Data Items button to add or remove series from the annotation. Copyright ©2015 Petro Class Inc. www.petroclass.com Select the desired series in the left tree view. (note: no data values will appear in the table to the right if the annotation does not currently have an attached arrow. The arrow can be attached before or after the annotation is defined and the annotation will update accordingly see add annotation arrow above) Use the toolbar items above the annotation table to specify font, color and other formatting options. To format individual items, (in the table) select only those items, then apply the formatting for those items. Select OK to view the annotation. Copyright ©2015 Petro Class Inc. www.petroclass.com Use the ‘Edit Header/Footer’ button to add additional annotation text. Copyright ©2015 Petro Class Inc. www.petroclass.com Data Strip Chart The strip chart provides a unique view of the test data by combining the visual effectiveness of a data plot along with the descriptive qualities of the test comment annotations. Copyright ©2015 Petro Class Inc. www.petroclass.com Strip Chart Toolbar and Menu items • • • Strip Chart Properties, displays the general strip chart configuration window. Add/Remove Comments, selects the test comments to be displayed within the comment section of the strip chart. Add Series, selects data series to be displayed within the plot/chart strip section of the strip chart. Copyright ©2015 Petro Class Inc. www.petroclass.com Configuring the Strip Chart Configuring the strip chart is done in two basic steps: 1) Select the test comments to display. 2) Select the data series to display in the chart strips. Selecting Comments: Use the ‘Add/Remove Comments’ button to display the ‘Strip Chart Comment’ window. Within the comment window specify the comments to display by selecting the appropriate boxes under the ‘Add’ column. The Chart/Range section is used to specify the start and end time range for the chart. Use the ‘Auto-Scale’ options to automatically set the range to encompass selected comment range. Adding Data Series: Data series can be added (and removed) from the strip chart in much the same way as in the data plots; three different methods include: 1) Right click data columns in the data table and select ‘Add to Strip Chart’. 2) Select the strip chart and enable the series from the ‘Navigation window’. 3) Use the ‘Add Series’ button to select the data series from all available series. Copyright ©2015 Petro Class Inc. www.petroclass.com Once a series has been selected, to add to the strip chart, the “Add Series to Strip Chart” window is displayed to configure and position the series within the chart strips. Line style properties can be specified by clicking on ‘Line Type’. Radio select options under the ‘Axis” section list all existing strips in the chart, any strips that are not valid targets for the new series will be grayed out (unavailable). In addition to all existing strips, a ‘Create new strip’ option is always available to create a new strip for the series. Add Series window displaying 3 existing strips. Copyright ©2015 Petro Class Inc. www.petroclass.com Strip Chart Properties Context Properties Many of the properties found in the strip chart properties window can be accessed directly from the strip chart via a “right-click” context menu popup on the appropriate chart section (as detailed below). Strip chart context menu sections. Copyright ©2015 Petro Class Inc. www.petroclass.com Date Menu: • The top section of the context menu provides a range offormatting options for the date display. • Font… specifies date font properties (style, size, color) • Color… specifies the background color for the day. Comment Menu: • Font… specifies the comment font properties (style, size, color) • Color… specifies the background color for the day. Copyright ©2015 Petro Class Inc. www.petroclass.com Time Menu: • The top section of the context menu provides a range of formatting options for the time display. • Font… specifies time font properties (style, size, color) • Match Day Colors, When selected, the background color of the time tags will match the given day background color. • Custom Color… specifies a background color for the time tags. • Border, outlines the time tag with a black border. • Pin to Top of Comment, when selected the time tag is positioned vertically at the top of the corresponding comment. When not selected, the time tag vertical position is determined automatically as to minimize the length of the tag stem. Strip Axis Menu: • Two context menus are available within the strip axis, the first is available when positioning over a series label and provides options to configure or remove the series. The second strip axis context menu ‘Configure…’ provides a quick shortcut to the strip chart properties window. Copyright ©2015 Petro Class Inc. www.petroclass.com Strip Body Menu: • Move Strip Right, Move Strip Left, provide a quick means of repositioning the strip ordering. • Show Chart Gridlines, show or hides the gridlines. • Show Day Colors, When selected, the strip background color will be filled with the corresponding day colors. • Background Color, specifies a background color for the strip body. Copyright ©2015 Petro Class Inc. www.petroclass.com Property Window Use the ‘Properties’ button on the strip chart tool bar to display the strip chart properties window. The strip chart properties window provides a convenient place to view and edit most of the strip chart properties. The main sections include: • Attributes, the attributes section contain appearance properties basically fonts and colors for the entire strip chart. • Axes, the axis section contain ‘x’ and ‘y’ subsections and contain settings to specify strip axis ranges and the series they contain. Most of the commonly used strip chart properties are available via context menus from the strip chart window; however the strip chart properties window provides a convenient place to view and edit all properties together. Copyright ©2015 Petro Class Inc. www.petroclass.com Additional Strip Chart Properties Specifying the chart date start and end range The chart date range is specified via the ‘Strip Chart Date Range’ window, which can be accessed from either the ‘Properties’ window or the ‘Strip Chart Comment’ window. Setting the Strip Chart Date Range The ‘Strip Chart Range’ window provides calendar and time options to manually specify a start and end date or an auto-scale option that will automatically select an appropriate scale. Copyright ©2015 Petro Class Inc. www.petroclass.com Chart Time Gridlines Horizontal time gridlines can be displayed on the chart at either fixed or variable intervals. Property Window Gridline Configuration The ‘Specify times…’ option provides a means of specifying non-repeating or daily cut-off times. Copyright ©2015 Petro Class Inc. www.petroclass.com Chart Type and Axis Configuration A chart strip can be configured as either a line or stacked area chart with the differences illustrated in the diagram below: Selecting the Chart Type The Chart type is specified from the ‘Properties’ window and is configured on a per-strip basis. Copyright ©2015 Petro Class Inc. www.petroclass.com Changing the Series Order The order of the series displayed in the chart can be specified in the series ‘Order’ option of the ‘Properties’ window. The series order may be important when using the stacked area chart type. Copyright ©2015 Petro Class Inc. www.petroclass.com Chart Scale Configuration Chart Scales Line and Area Charts The following options are available for configuring the strip scales: • • Scale Orientation, specifies the orientation (rotation) of the scale values. The default is 60°. Auto-Scaling, specifies the minimum and maximum values for the scale. Copyright ©2015 Petro Class Inc. www.petroclass.com Sizing the Strip Chart The strip chart components can be moved/sized along the blue lines indicated below. Strip Chart Reporting Options In addition to the standard report generation options, the strip chart provides the option to scale the chart to fit a single page or automatically size the page height to provide a continuous form (or log) report. Copyright ©2015 Petro Class Inc. www.petroclass.com Creating Additional Plots, Tables and Strip Charts Additional views (plot, table, strip chart) can be created by accessing the ‘Manage Views’ section in the main menu. Manage Views In the diagram above ‘Manage Views’ is found under the ‘Table’ heading (of the main menu) however the heading name is dependent upon the active view and could also be named ‘Plot’ or ‘Strip Chart’. Additional views are added to the active view as additional tab panes. Copyright ©2015 Petro Class Inc. www.petroclass.com User Interface Design Mode The main ‘Data Entry’ view is fully user configurable and may contain any number of plot and tables. Configurations can be customized for a particular test type, making it easy for field staff to partition different test aspects. The following procedure illustrates how to create a custom UI from scratch. Enter the UI designer by pressing the infinity button on the PRD Toolbar. Press the down arrow of the Infinity toolbar button and select “Clear” to clear any UI views. This will leave a blank view as shown below. Blank User Interface Copyright ©2015 Petro Class Inc. www.petroclass.com “Right Click” in the Blank UI View displays the following context menu: The PRD UI currently consists of Plot and Table views as well as UI container elements consisting if Tab and splitter elements. The views and containers can be infinitely nested creating a unique design of plot and table views. Select the “Table” menu option, creating the following view: Copyright ©2015 Petro Class Inc. www.petroclass.com “Right Click” the view and select the “Split Horizontal” menu option, creating the following: “Right Click” the new (blank) view and select the “Plot” menu option, creating the following: Copyright ©2015 Petro Class Inc. www.petroclass.com To add a second plot, within a tab container, “Right Click” the plot view and select the “In Tab” menu option. “Right Click” the new tab and select the “Add Tab: menu option. Copyright ©2015 Petro Class Inc. www.petroclass.com Repeat the previous steps for creating a plot view in the new tab pane Tab names and positions can be changed context menu by clicking on the appropriate tab To exit design mode press the infinity button on the PRD Toolbar Copyright ©2015 Petro Class Inc. www.petroclass.com The following is a summary of the commands available in the UI designer context menus: View Context Menu (“Right Click” on a View) • • • • • • Split Vertical (Splits the current view vertically adding a second view) Split Horizontal (Splits the current view horizontally adding a second view) In Tab (Places the current view inside a new Tab container) Plot (Changes the current view to a plot view) Table (Changes the current view to a table view) Report Name (Edit the name that will appear on reports for the current view) Tab Context Menu (“Right Click” on a Tab Pane) • • • Add Tab (Add a new view to the current Tab Container) Tab Position (Set the location of the tabs) Tab Name (Edit the tab name) Copyright ©2015 Petro Class Inc. www.petroclass.com Meters FlowTest provides a large suite of meters to measure produced gas and liquids. The meter types can be classified as follows: • Gas Meters • Liquid Meters of type: Oil Water Condensate Oil/Water (with a 2 phase separator) Meters are added via the “Add Meter” button on the ‘Data Entry’ pane of the Navigation Bar, displaying a menu to select the meter type. A meter configuration dialog will be displayed to configure the specified meter (as detailed below). Copyright ©2015 Petro Class Inc. www.petroclass.com Common Meter Options: The following options are common to all meter types (gas and Liquid): • • • The label field is the display name for the meter and can be changed to reflect any naming convention desired. The ‘Include in Totals’ option determines whether the meted fluids are included in the ‘Data Summary’ (see the Data Summary section) “Enable Previous Production” allows for the inclusion of fluids prior to the beginning of the test. The fluid types listed under the “Previous Production” node are specific to the meter type and additional options enabled. Previous Production: Liquid Meter: Previous Production for a liquid meter is entered directly into each field (for each fluid type the meter produces (as shown in the diagram above). Gas Meter: Previous Production for a gas meter can be input according to the gas destination (or sink) refer to section: Gas To: Flare, Vent, Pipeline, Incinerate, Other. If you do not track the gas destination (or do not know) all previous production can be entered into the “Other” field. Copyright ©2015 Petro Class Inc. www.petroclass.com Previous Production for a Gas meter Copyright ©2015 Petro Class Inc. www.petroclass.com Gas Meters: Orifice Meter The Gas Orifice meter calculations are based on the AGA 3 (1992) or ANSI/API 2530-92 specification. The Gas Orifice meter contains the following configuration variables: • • • • • Meter Size (the internal diameter of the orifice tube) the “…” button in the entry field displays a common list of pipe dimensions to choose from. Diff full scale (an optional entry to specify the maximum differential pressure transducer range) see plate sizing below. Meter Position (static pressure tap Upstream or Downstream of the orifice plate) Tap Type (Flange or Pipe location of the differential pressure taps on the tube) Gas Properties (see Gas Properties) Copyright ©2015 Petro Class Inc. www.petroclass.com Under the Advanced section the Orifice meter has additional entries for plate and tube composition to correct for thermal expansion of the plate and tube Orifice Tube size selector (displayed in current units) (accessed via. the “Meter Size” button in the configuration dialog.) Copyright ©2015 Petro Class Inc. www.petroclass.com Plate Sizing The orifice meter has a plate sizing option available to aid in the changing and sizing of orifice plates from the data table. In the Data Table “right click” the orifice meter plate size. The following “Plate Selector” dialog is displayed: The columns are defined as follows: • Plate (standard plate sizes in fractional inches)mm (decimal value of the plate in the current units) • Diff (differential pressure for the specified plate at the operation point) • Diff (%) (Differential % full-scale value for the specified plate, at the operation point) requires a Diff full scale value to be entered in the Orifice meter configuration dialog. Copyright ©2015 Petro Class Inc. www.petroclass.com The operation point is either the current point or the previous flow point. If there is no current or previous flow calculation, the operating point is blank and the differential pressures are not calculated. The “Plate Selector” dialog readily indicates the effect different plates will have, on the differential pressure, for the current flowing conditions, allowing the user to select the most appropriate plate by keeping the differential in the optimum operating range. To select a new plate simply click on the plate, the dialog will close, and the plate will be entered into the table. To cancel the dialog, click off the dialog. The differential pressure calculations use the following assumptions: • Sub critical flow (choked flow upstream of the meter) • Constant flowing temperature • Semi-constant back pressure (+- the differential pressure) Copyright ©2015 Petro Class Inc. www.petroclass.com Critical Flow Prover Meter The Gas Critical Flow Prover meter calculations are based on specifications from the Railroad commission of Texas. The Gas Critical Flow Prover meter contains the following configuration variables: Copyright ©2015 Petro Class Inc. www.petroclass.com • • • • Meter Size (the internal diameter of the prover tube either 2 or 4 inch ID) Subsonic Velocity Flow Correction o Correct flow rate applies a correction to the calculated gas rate when the meter is below critical flow. This flow correction assumes that the meter downstream pressure is constant and at atmospheric pressure. o Issue Warning will issue an alarm when the meter drops below critical flow. Critical flow is calculated based on a constant meter downstream pressure at atmospheric pressure. Enable Frac Gas Recovery (see: ‘Frac Load Gas Recovery’ section) Gas Properties (see Gas Properties) Copyright ©2015 Petro Class Inc. www.petroclass.com V-Cone Meter The Gas V-Cone meter calculations are based on standard V-Cone specifications. The Gas V-Cone meter contains the following configuration variables: • • • • Meter Size (the internal diameter of the V-Cone tube) the “…” button in the entry field displays a common list of pipe dimensions to choose from. Bata Ratio (a constant relating the diameter of the cone to the Tube ID) Discharge Coeff. (specified by the manufacturer) Gas Properties (see Gas Properties) Copyright ©2015 Petro Class Inc. www.petroclass.com Pitot Tube Meter The Gas Pitot Tube meter calculations are based on standard Pitot Tube specifications The Gas Pitot Tube meter contains the following configuration variables: • • • Meter Size (the internal diameter of the pipe containing the Pitot Tube) the “…” button in the entry field displays a common list of pipe dimensions to choose from. Pitot Tube Constant. (specified by the manufacturer) Gas Properties (see Gas Properties) Copyright ©2015 Petro Class Inc. www.petroclass.com Choke Meter The Gas Choke meter calculations are based on specifications from the Railroad commission of Texas for Bean and nipple chokes in critical flow. The Gas Choke meter contains the following configuration variables: Copyright ©2015 Petro Class Inc. www.petroclass.com • • • • Type (the Choke Type selections are either a 6” Bean Choke or 1-1/2” nipple) Subsonic Velocity Flow Correction o Correct flow rate applies a correction to the calculated gas rate when the meter is below critical flow. This flow correction assumes that the meter downstream pressure is constant and at atmospheric pressure. o Issue Warning will issue an alarm when the meter drops below critical flow. Critical flow is calculated based on a constant meter downstream pressure at atmospheric pressure. Enable Frac Gas Recovery (see: ‘Frac Load Gas Recovery’ section) Gas Properties (see Gas Properties) Copyright ©2015 Petro Class Inc. www.petroclass.com Turbine Meter The Gas Turbine meter calculations are based on the AGA 7 specification The Gas Turbine may also be used to calculate flow rates through a Vortex meter. The Gas Turbine meter contains the following configuration variables: • • • K factor (specified by the manufacturer) Reading Type (specifies the pulse reading type and can be either cumulative input readings or incremental input readings) Gas Properties (see Gas Properties) Copyright ©2015 Petro Class Inc. www.petroclass.com Measured Rate Meter The Gas Measured Rate meter calculations are based on standard PVT property calculations allowing corrections to gas rates and volumes from flowing conditions, other reference conditions or mass flow rates to standard conditions. The Gas Measured Rate meter contains the following configuration variables: • Input Rate Type (specifies the input type to be converted to a standard conditions) The Following Options are available: o Volumetric Flow Rate @ Standard Conditions The input gas rate(Qin) is a standard rate at the base conditions specified by the Base Pressure and Base Temperature entries. The Input Rate is converted to standard conditions by either of the following equations depending upon the setting of the ‘Convert Base to Standard as:’ Copyright ©2015 Petro Class Inc. www.petroclass.com Qs = Qin(Pb1/Ps)(Ts/Tb1) ideal gas Qs = Qin(Pb1/Ps)(Ts/Tb1)(Zb1/Zs) real gas Where the input reference conditions are Pb1 and Tb1 Pb = 14.73 psia, Tb = 60.0 °F The standard rate is converted to local unit base conditions via the nonrigorous (ideal gas) equation: Qb = Qs(Ps/Pb)(Tb/Ts) (see Standard Conditions section) Where Pb and Tb are the unit base conditions o Volumetric Flow Rate @ Flowing Conditions The Input gas rate is at (variable) flowing conditions and is converted to Standard Conditions. o Mass Flow Rate The Input gas rate is a Mass flow rate and is converted to a volumetric flow rate at Standard Conditions. o Constant Fpv The input gas rate is at the standard conditions of Ps = 14.73 psia and Tf = 60.0 °F. However the gas rate is calculated with the fixed (constant) Fpv specified for all flowing pressures and temperatures. The input rate is first converted back to flowing conditions: Qf = Qs/(Pf/Ps*Ts/Tf*Zterm) where Zterm = (Const_Fpv) ² and (Zb in the Fpv calculation = 1.0) The gas rate at flowing conditions) is then converted to standard conditions using option 2(Volumetric Flow Rate @ Flowing Conditions). ** The static pressure and flowing temperature inputs are only required if “Volumetric Flow Rate @ Flowing Conditions” mode is selected. • Gas Properties (see Gas Properties) Copyright ©2015 Petro Class Inc. www.petroclass.com Gas Properties All Gas Meters contain gas properties in the meter configuration dialog. The gas properties describe the gas flowing through the meter, and are used by the meter calculations to correct the gas flow rates and volumes to standard conditions. Gas properties contain two different correlation types, available in the Correlation options under Gas Properties. • BWR EOS is a generally accepted correlation with and optional correction for acid gas impurities. • AGA 8 Detailed is a correlation based on the American Gas Association Report # 8 (1992) and requires a full compositional gas analysis. Copyright ©2015 Petro Class Inc. www.petroclass.com Frac. Load Gas Recovery All gas meters have an option to separate load gas and produced gas from the metered gas stream via the “Enable Frac. Gas Recovery” option. The Load Gas Recovery option performs two basic functions: o Allows metered gas properties to vary, in real time, as differing volumes of reservoir and load gasses are comingled in the metered stream. o Separates the load gasses and produced gas from metered stream, reporting the relative volume of each type. The choices for load gas can be; N2, CO2, C3 or (both N2 and CO2). Copyright ©2015 Petro Class Inc. www.petroclass.com The “Frac. Gas Inputs” specify the load gas(s) present in the test. For each load gas selected, the following table series will be created for the meter: • Percent Load Gas (input) User input to specify the amount of the specified load gas (N2, CO2, C3) in the metered stream. • Recovered Load Gas (calculated cumulative volume) Cumulative volume of recovered load gas (N2, CO2, C3). • Recovered (Reservoir) Gas (calculated cumulative volume) Cumulative volume of produced reservoir gas. The meter gas properties should be configured to reflect the reservoir gas properties only. These gas properties will be dynamically adjusted to take in account for the amount of load gas in the metered stream. Copyright ©2015 Petro Class Inc. www.petroclass.com Gas To: Flare, Vent, Pipeline, Incinerate, Other For a gas meter with the ‘Include in Totals’ option checked, the produced and recovered load gas will be added to the totals and classified as either flared, vented… via the ‘Gas To’ series in the ‘Data Summary’ group. This behavior can be overridden at the meter level to route all metered gas to a specific destination. Options for the metered gas destination: • Manual (Use ‘Gas To’ series) Destination is controlled by the ‘Data Summary Gas To’ series. • To ‘Other’ All metered gas classified as ‘Other’ • To ‘Flare All metered gas classified as ‘Flared’ • To ‘Vent All metered gas classified as ‘Vented’ • To ‘Incinerate All metered gas classified as ‘Incinerated’ • To ‘Pipeline All metered gas classified as ‘Pipelined’ Note: Previous Production is specified independently of these settings. For additional information see: ‘Gas To: Flare, Vent, Pipeline, Incinerate, Other’ in the ‘Data Summary’ section. Copyright ©2015 Petro Class Inc. www.petroclass.com Liquid Meters Properties common to all liquid meters For convenience liquid meters a separated into three categories (oil, Water and Condensate) internally there is only a single fluid meter type where the type of fluid being metered can be set to Oil, Water, Condensate or an Oil/Water type (as seen above). Any liquid meter can be reconfigured to flow a different liquid type without creating a new meter. Copyright ©2015 Petro Class Inc. www.petroclass.com Turbine Meter The Liquid Turbine meter calculations are based on the AGA 7 specification. The Liquid Turbine may also be used to calculate flow rates through a Vortex meter. The Liquid Turbine meter contains the following configuration variables: • • K factor (specified by the manufacturer) Reading Type (specifies the pulse reading type and can be either cumulative input readings or incremental input readings) Copyright ©2015 Petro Class Inc. www.petroclass.com Level Meter The Liquid Level meter calculations are based on constant tank level measurements relating the tank volume to a tank depth. The Liquid Level meter contains the following configuration variables: • • Level Constant (constant factor relating level to volume where Volume = Level * Level Constant ) Reading Type (specifies the pulse reading type and can be either cumulative input readings or incremental input readings) For an oil meter, the BS&W measurement entered is always represents the BS&W percentage of the incremental liquid gain, irrespective of the cumulative or incremental setting. Copyright ©2015 Petro Class Inc. www.petroclass.com Measured Volume Meter The Liquid Volume meter calculates a liquid rate from entered liquid volumes. The Liquid Volume meter contains the following configuration variables: • Reading Type (specifies the pulse reading type and can be either cumulative input readings or incremental input readings) For an oil meter, the BS&W measurement entered is always represents the BS&W percentage of the incremental liquid gain, irrespective of the cumulative or incremental setting. Copyright ©2015 Petro Class Inc. www.petroclass.com Measured Rate Meter The Liquid Rate meter calculates liquid volumes from entered liquid rates. The Liquid Rate meter contains the no configuration variables. Copyright ©2015 Petro Class Inc. www.petroclass.com Liquid Separator Meter The Liquid separator meter operates in a manner similar to that of the “produced volume” meter, except the BSW cut has been replaced by a special event called the “Grind-out” event. The liquid separator can meter any liquid or solid defined in the test including; produced reservoir fluids, recovered load fluids, sands and other solids. New liquid types can be added or removed throughout the test. The grind-out event is used in conjunction with this meter to specify the actual fluids, and there relative volumes, throughout the test. Under the “Fluids in Grind out” section all of the fluids, present in the test, are listed. The user can check the fluids that will be produced by this meter. All checked fluids will add into the data table. Copyright ©2015 Petro Class Inc. www.petroclass.com New fluid types can be added at any time, throughout the test, by pressing the “Add New Fluid Definition” button (as shown above). Copyright ©2015 Petro Class Inc. www.petroclass.com The “Add New Fluid Definition” allows the addition of other fluid types in addition to the predefined Oil, Water and Condensate types. Any fluid types already defined are grayed out in the dialog. Select the new fluid to add to the Meter. The selected fluid will then be available under the “Fluids in Grind out” in the meter. Any fluids specified as load fluid will add “LFLTR” and “RCVLF” columns in the data summary. As noted above, the liquid separator meter works in conjunction with a grind out event (see event section for a description of the grind out event). Copyright ©2015 Petro Class Inc. www.petroclass.com Sand Recovery The sand recovery option will separate sand and water from the BS&W portion of any liquid meter producing water. Sand Revovery Inputs: • • Effective Porosity provides a means of accounting for the extra water occupied within the pore space of the sand volume. See “Effect of Sand Porosity on recovered water volume” below. Bulk Density (if specified) will allow the recovered sand volumes to be reported in terms of recovered sand weight. Copyright ©2015 Petro Class Inc. www.petroclass.com Sand Recovery Series associated with a Oil/Water meter. The “Sand Cut” is a user entered value representing the relative portion of sand to water for the BS&W seperator fluid. The” Sand Cut” input entered is always represents the water-sand percentage of the incremental BS&W gain, irrespective of the cumulative or incremental setting of the parent meter. If the “Sand Recovery” option is used in conjunction with the “Load Fluid Recovery” , and the recovered load fluid is water, then ALL metered sand is classified as a Recovered Frac Sand. As such, the sand will be classified as a load fluid in the totals and PAS report. If “Load Fluid Recovery” is disabled or the load fluid is not water then the sand is classified as a reservoir fluid and is included as BS&W in the totals and PAS report. Copyright ©2015 Petro Class Inc. www.petroclass.com Effect of Sand Porosity on recovered water volume. The Diagram above illustrates two cases where the separator fluid levels are identical but the recovered fluid volumes are not. Case A has a specified sand porosity of 0% as such it is assumed that no water is contained within the pore space of the sand. Case B has a specified sand porosity of 50% indicating that 50% of the sand volume contains water. As a result the recovered water volume for case B is the sum of the water contained in the sand pore space and the water above the water-sand interface. Copyright ©2015 Petro Class Inc. www.petroclass.com Liquid Load Fluid Recovery All liquid meters have an option to track recovered load fluid from produced liquids. Features include: • Track Load Recovered and Load Left to Recover • Load recovery can start at any point in the test. • Load fluid can be added at any point in the test. • Additional load fluid can be added at any time. Procedure to enable load fluid recovery in liquid meters: Copyright ©2015 Petro Class Inc. www.petroclass.com Enable the Load fluid recovery option in the liquid meter. And select the Load fluid type. The Load fluid recovery option creates two additional columns in the data table LF RCV (load fluid recovered) and LF LTR (load fluid left to recover). Copyright ©2015 Petro Class Inc. www.petroclass.com To set the initial load fluid to recover, ‘right click’ or ‘double click’ the LF LTR cell at the table row where you want to start recovering load fluid. (This will display the ‘Add Load Fluid’ dialog box below) Enter the initial load fluid to recover and select OK. Copyright ©2015 Petro Class Inc. www.petroclass.com The point where the load fluid is added is colored Blue. To change the initial load fluid, simply bring up the ‘Add Load Fluid’ at the blue cell. A load fluid of both oil and water can be specified for an oil meter by selecting “Oil/Water” as the load fluid type. When recovering both oil and water load, separate “LF RCV” and “LF LTR” columns will be created for each fluid type and the load is entered into each individually (oil, water). Additional load fluid can may added at any time (as the test progresses) by simply ‘right clicking’ or ‘double clicking’ the LF LTR cell at the table row where you want to add additional load fluid. In the example above, the initial load (of 49.25) can also be specified via the ‘Initial Load In-place’ entry in the meter properties window. Copyright ©2015 Petro Class Inc. www.petroclass.com Advanced Meter Properties (common to all meters) All meter configuration dialogs have an “Advanced” section which contains advanced of “less common” configuration variables. The following is a description of advanced properties common to all meters: • • • • The series section contains all the input and output series for the meter. The series can be properties can be individually set (see Series Properties). Discretization sets the methods used to relate flow rates to cumulative volumes for the meter. Sampling is fixed at “End of Period” sampling where entered values represent the end of the flow period. (Volume) Numerical Integrator sets the method used to calculate cumulative volumes from calculated flow rates. (this option only appears in meters that directly calculate a flow rate) There are three options available; Trapezoidal, Rectangular and Trapezoidal (Detect Flow/Shut-in), as defined below. Copyright ©2015 Petro Class Inc. www.petroclass.com Flow Rate (q) Measured Rates Time (t) The diagram above illustrates a series of measured or calculated rates over time. Measured Rates Flow Rate (q) Calculated Volume Time (t) The diagram above illustrates the cumulative volume calculated by using a Rectangular volume integration method. Copyright ©2015 Petro Class Inc. www.petroclass.com Measured Rates Flow Rate (q) Calculated Volume Time (t) The diagram above illustrates the cumulative volume calculated by using a Trapezoidal volume integration method. Copyright ©2015 Petro Class Inc. www.petroclass.com Measured Rates Flow Rate (q) Calculated Volume Time (t) The diagram above illustrates the cumulative volume calculated by using a Trapezoidal (Detect Flow/Shut-in) volume integration method. This is a combination of the Trapezoidal and the Rectangular integration methods. Where the method is primarily trapezoidal with an exception for rate transitions to and from zero, where the rectangular method is used. When a meter rate calculation transitions to zero it is taken as a “flow to shut-in” condition, and is treated as an event asynchronous to the sampling process. Likewise, when a meter rate calculation transitions from zero it is taken as a “shut-in to flow” condition. In general: If the inputs into the meter calculation represent average values for the sample period, then the calculated flow rate is, also, representative of the average flow rate for the sample period. In this case, a” Rectangular” integration method should be used. If the inputs into the meter calculation represent instantaneous values, then the calculated flow rate is representative of an instantaneous flow rate. In this case, a” Trapezoidal” Integration method could be used. The Trapezoidal (Detect Flow/Shut-in) method is provided for compatibility with some pre-existing procedures used in production testing. This method is not based on any accepted instrumentation practices, suffers from a lack of data portability and promotes poor sampling practice. As such, this method is not endorsed by PetroClass. Copyright ©2015 Petro Class Inc. www.petroclass.com An additional note: The process of measuring and quantifying ‘real world’ analog quantities involves; not only obtaining a measured value, but also understanding the implied precision (or error) associated with the measured value. In the diagrams above, it may seem that trapezoidal integration fits the data more precisely than the rectangular method (and as such it should be used in the majority of cases) however there are some additional points the need be considered: 1. As stated above, sampled data has an associated error band. As the sample rate increases the error band decreases (as does the difference between the differing methods). 2. If the data is random the trapezoidal and the rectangular methods are equally valid (irrespective of the sample rate). Additionally, if the data tends to trend in a single direction (i.e. a declining rate) more accurate results can be realized using a trapezoidal method. 3. The models described here are essentially different accounting methods used to calculate cumulative volume; any decision made here ultimately affects the material balance of the entire system. The trapezoidal method has an added consequence where; the flow rates are not representative of a normalized flow rate, required to honor material balance for all fluids. The following equation shows the relationship of the volumetric flow rates to the total mass flow rate for gas, oil, water and condensate. I order for this equation to hold true (honor material balance) each volumetric flow rate qx should represent a common, normalized, flow rate such as those defined using a rectangular integration method. Trapezoidal method flow rates need to be normalized for use in this equation. Normalized volumetric flow rate Trapezoidal volumetric flow rate to normalized volumetric flow rate Flow rates and cums reported in the ‘Data Summary’ section of FlowTest, ensure the proper material balance across ALL phases of gas, liquid and solids, for ALL meters, irrespective of the discretization mode set at the meter level. Copyright ©2015 Petro Class Inc. www.petroclass.com Series Properties The Series Properties dialog allows, the user, to edit the properties for a given series. The series dialog can be accessed by either by the ‘Data Entry’ Navigation bar or via the “Properties” context menu option on the table header. The Series Properties contains the following configuration variables. • • Label (edit the series name) Full Name (a non editable name displaying the parent object and series names) Copyright ©2015 Petro Class Inc. www.petroclass.com • • • Precision (set the precision of the series). The series precision sets the number of decimal points displayed in the tables for any given unit type. In the example above, a value of 0.1 psi will display 1 digit after the decimal point for psi unit types. A value of 0.01 psi will display 2 digits after the decimal point for psi unit types. For other unit types the appropriate number of decimal points is automatically selected based on the precision value. Imperial (sets the unit type for imperial unit mode) Metric (sets the unit type for metric unit mode) Copyright ©2015 Petro Class Inc. www.petroclass.com Generic Series All data series belong to either the well or summary groups, or are created as part of a meter process with fixed roles to either input data or perform value added calculations. There are times when the predetermined group and meter series are inadequate to record all required input data or special ‘user defined’ calculations are required, FlowTest provides a set of input and calculated generic series to fulfill these requirements. Generic series are created via the ‘Add Meter’ button on the top of the Navigation Bar. The ‘Add Meter’ button provides a dropdown, from there select “Generic Series…” to display the ‘New series’ window shown below. Copyright ©2015 Petro Class Inc. www.petroclass.com New Series window to create generic series. The ‘New Series’ window allows the user to specify the type and attributes for the generic series including: • Group The group option specifies the parent group for the new series. All FlowTest series are associated with a parent grouping, these may be fixed groups like the ‘well’ or ‘summary’ groups or user created meter groupings. The ‘Add to Group’ dropdown contains all existing groups and meters, in addition, a new (user defined) group can also be created via the ‘New’ button. • Series The Series section contains an input for the series name and requires a definition for the series ‘Type’. The series type defines the “type” or units for the series, all supported unit types are listed in the ‘Type’ dropdown. The Input/Calculated radio option determines the “kind-of” generic series. Input series allow for user entered values whereas calculated series are read-only performing user defined calculations based on other series and inputs. Copyright ©2015 Petro Class Inc. www.petroclass.com Input Generic Series: As stated above, input generic series provide a means for the user to input (and report) data that is not included through the default group or meter series. Input generic series are the simpler of the two generic series types where the user need only specify the group, series name and type then select “OK’ on the ‘New Series’ window to create the series. Calculated Generic Series: Creating a calculated generic series is more involved than creating an input series, as it requires specifying a calculation expression, which can range from a simple series clone to an advanced mathematical formula involving several input variables. When ‘Calculated’ mode is selected, the ‘...’ button is enabled allowing for the definition of the series calculation. Pressing the ‘…’ displays the ‘Expression Builder’ window as follows: Copyright ©2015 Petro Class Inc. www.petroclass.com Generic Series Expression Builder The expression builder window’s purpose is to define the series calculation. There are three main components to defining the series formula: • The calculation expression: The calculation expression is a user defined expression, using standard mathematical notation, which defines the series calculation. • Expression variables: Formula variables are references to other data series and provide input to the calculation expression engine. • Resultant Unit/Type: The ‘Units of Result’ essentially specifies the unit of the expression result. The series ‘type’ (pressure, temperature…) is specified in the initial creation window and as a result, the ‘Units of Result’ dropdown contains the available units for the type specified. For the ‘Calculated Generic Series’ the series output (or calculation) is governed by the mathematical expression entered into the ‘Expression’ box. The expression receives input in the form of variables; variables are the output from other data series and are defined in the ‘Variables’ box. The ‘Expression Builder’ can also be accessed from the ‘Series Properties’ window (of the generic series) for viewing/editing of the expression after the series is created. Copyright ©2015 Petro Class Inc. www.petroclass.com Defining expression variables: The Variables box displays the variable definitions that can be used in the calculation expression. New variable are created via the ‘Add…’ button which displays the ‘Variable Definition’ window, as shown below: Variable Definition window (data series input for calculation expression) The ‘Variable Definition’ window contains the following inputs: • Name specifies the variable name (this is the name that will be referenced in the calculation expression). • Series the ‘…’ button allows the user to select the data series as the variable source. • Units once a series is specified, the ‘Units’ dropdown will be populated with all available series units. The selected unit specifies the units returned when the variable is referenced in the expression. • Default the ‘Specify Default Value’ when checked, allows for a default value (in the selected units) to return when the series value is empty (null). Variable names may contain the following characters: • upper/lower case A-Z • numbers 0 -9 (first character cannot be a number) • underscore _ Copyright ©2015 Petro Class Inc. www.petroclass.com Defining Calculation Expressions: The ‘Expression’ box contains the series calculation expression and is the heart of the series makeup. The expression uses standard mathematical notation referencing the defined series variables by name. The calculation expression represents the right-side of a mathematical equation as follows: Calculated_Series_Output[n] = Expression[n] Where: ‘n’ represents a series reading For the expression side, all input variable are evaluated as: variable[n] The expression may contain: • standard mathematical operators: */+• parenthesis to specify precedence: () • defined variable (by name) to provide input • predefined function such as: sin(), cos(), tan()… For a complete list of supported operators and functions see: Generic Series Expression Reference in Appendix C When entering an expression in the ‘Expression Builder’ window you are entering the right-side of the equation where, the first character of the entry should be the “=” sign. The “=” sign is optional and if omitted it is automatically added by the software. Implementation Note: When declaring series variables all declared variables are evaluated (value assigned per reading) prior to evaluating the expression, if the result of ANY variable evaluates to be null (after applying any specified default) the expression evaluation is skipped (for the reading) and the out value is set as null, even if the null variable is not actually used in the expression. This behavior can be useful to prevent output on specific readings (i.e. readings with no associated time) by including a variable (i.e. cum time) without any reference in the expression. Copyright ©2015 Petro Class Inc. www.petroclass.com Expression Examples: • • • • Constant Value Variables: Expression: Comment: Series Clone Variables: Expression: Comment: none =7 Assigns the constant value of 7(in the result units) to all readings. Not very practical, but essentially the simplest expression possible. TubingPres (references the Tubing Pressure Series) = TubingPres Essentially clones the tubing pressure series. This can be useful if you want to display tubing pressure in different units in the data table. Note: It is important that the variable and the result units match! Difference Calculation Variables: TubingPres (references the Tubing Pressure Series) CasingPres (references the Casing Pressure Series) Expression: = TubingPres – CasingPres Comment: Provides a “Tubing – Casing” calculation. Note: Tubing and Casing units must be the same and the result units would also be the same with the exception that the type should NOT be specified gauge/absolute (as the result is a relative pressure). Rate Sum Variables: Q1 (reference to flow rate 1) Q2 (reference to flow rate 2) Expression: = Q1 + Q2 Comment: Provides the sum of two rates. Note: as stated previously, units must match. In addition, a default value of zero should be specified for the Q1 and Q2 variables if there is a possibility of having null reading for either series. Calculation Errors: If there is an error in the expression (be it syntax i.e. misspelled name or logical i.e. division by zero) the reading output is set to null for the affected readings. For less obvious errors the series may output the following error codes: • REF! Indicates that a series variable references a deleted series. • CREF! Indicates that the expression contains a variable with a circular reference. Copyright ©2015 Petro Class Inc. www.petroclass.com Net Cumulative Series Net Cumulative Series (Net Cum Series) are a special case of ‘Generic Series’ that allow you to zero (or net-out) cumulative values for meters and ‘Data Summary’ totals. To create a net cum series for an existing cumulative series: ‘Right Click’ the column header of any cum series and select “Create Net Cum Series” from the context menu. A net cum series is created to the right of the selected cum series. The net cum series displays the same values as the parent cum series with values displayed in blue italic text (by default). Copyright ©2015 Petro Class Inc. www.petroclass.com The net cum series column displays the cumulative values of the parent cum series with the ability of being zeroed at any point in the data table. To zero a net cum in the data table: ‘Right Click’ the net cum cell at the reading to zero and select “Finalize (Zero) All Net Cums Here”. At the reading where the cum was zeroed, a finalized total is displayed as an orange cell. Subsequent readings begin accumulating from zero. Additional zero sequences can be applied at any reading by repeating these steps. Copyright ©2015 Petro Class Inc. www.petroclass.com Additional net cum series can be created for other cum series simply repeat the creation process for each cum. Net cum readings can be zeroed or cleared via the context menu. Net Cum Zero menu options: • • • • Finalize (Zero) All Net Cums Here This option will zero ALL net cum series at the given reading. Clear All Net Cums Here This option will clear ALL net cum series at the given reading. This Net Cum Only -> Finalize (Zero) Here This option zeros only the selected net cum. This Net Cum Only ->Clear Here This option clears only the selected net cum. The various menu options give the user the ability to quickly zero or clear all net cums together or individually. Allowing for a great deal of flexibility in how the net cums can be applied for a given test. Copyright ©2015 Petro Class Inc. www.petroclass.com The appearance of the net cum column, within the data table, can be customized in the series property window for the net cum series. Net Cum Series Property Window. Copyright ©2015 Petro Class Inc. www.petroclass.com Time Series Group The time group contains a set of series representing the time track for all entered data. The series include: • • • • Date (sample date part) Time (sample time part) Cum (cumulative test time relative to the first date and time sample) Flow (cumulative time of the well on flow) The following outlines the behavior of the date and time series: Date Series: • Dates only need be entered if the current date is different from the previous date. • If no date is entered the previous date is assumed. • If there is no previous date, the current date is assumed. Time Series: • Time values can be partially entered where: o 12 <enter> resolves to 12:00:00 o 1213 <enter> resolves to 12:13:00 Cum Time • The entered cum time is relative to the first date and time entry If there are no dates or times entered the current date and time is used. Copyright ©2015 Petro Class Inc. www.petroclass.com Flow Time • Flow time is a calculated series and does not allow for user entry. • Flow Time is considered active if any production meter is flowing. • Flow Time can be configured to calculate for either of the following conditions: o Any gas or liquid meter flowing o Only gas meter(s) flowing The flow time calculation mode can be configured in the ‘Flow Time’ series properties. Flow Time Series properties. Copyright ©2015 Petro Class Inc. www.petroclass.com Time Sequence Error • In the event of an error in the date time order, all times after the error are displayed in red. • If a sequence error is present in the data, all calculations are suspended until the error is resolved. Copyright ©2015 Petro Class Inc. www.petroclass.com Well Series Group The well group contains data series and items associated with wellhead measurements, choke manifold and production separators. The data table “Well” group contains the following series: • • • • • • • • • • • • • Choke (Manifold Choke Size) Tubing Pressure Tubing Temperature Casing Pressure Casing Temperature Wellhead Pressure Wellhead Temperature Primary/Secondary Separator Pressure Primary/Secondary Separator Temperature % Tubing Drawdown (Calculated) % Casing Drawdown (Calculated) Minimum gas rate to unload liquids (Calculated) In-situ mixture velocity (Calculated) Well series items are configured via the properties configuration dialog accessible by selecting the “Well” item node in the configuration pane of the ‘Data Entry’ view or by right clicking the “Well” header in the data table, and selecting properties. Copyright ©2015 Petro Class Inc. www.petroclass.com Well configuration dialog contains configuration properties for wellhead series, test separators and monitors for liquid loading and in-situ mixture velocity. The options available are detailed as follows: Copyright ©2015 Petro Class Inc. www.petroclass.com Wellhead Series Wellhead series consist of both a pressure and temperature series added to the data table. Options include: • None (no series added) • Internal (add independent series for manual data entry) • Use Tubing (add series and tie each to the respective tubing series) • Use Casing (add series and tie each to the respective casing series) Series Proxy: The “Use Tubing” and “Use Casing” options tie the wellhead series to the respective tubing or casing series effectively creating one or more series sharing common data. In the case of “Use Tubing” the Wellhead pressure and the Tubing pressure share common data, data entered via the casing series will be reflected immediately in the wellhead series and vice versa. This tying of series is called a Series Proxy. ** Note: as of FlowTest version 3.5.0 series proxies will be read only in the data table (preventing data changes via the proxy) if you require the data to be changed from the proxy there is a ‘Read Only’ option in the proxy series property window that can be cleared to restore the previous behavior. If the ‘Read Only’ option is grayed out, this is due to the source series being read only. When wellhead series are specified, hydrate predictions at the wellhead will be calculated. Copyright ©2015 Petro Class Inc. www.petroclass.com Separator Configuration Primary and secondary test separators can be enabled providing (value added) alarms/warnings for monitoring over pressure and operating conditions of each test separator. Options Include: • None • Primary • Primary & Secondary Each separator includes the following configuration options: • • Maximum Pressure (Enter maximum separator pressure) over-pressure Alarm Operating Range (The specified operating range provides an alarm alerting operator when conditions fall outside of the designated separator Pressure & Temperature range) The Separator operating range can be used for general production testing, but is primarily designed to be used in conjunction with propane (HD5) fracs, where you want to ensure that all the recovered propane has completely flashed to a vapor when it hits the secondary separator, as it will alert the operator that volatile liquids may be accumulating in the secondary separator. Selectable operating ranges include: Unspecified (no operating range) Vaporize Propane Vaporize Butane Vaporize Propane-Butane (75/25)% mix • Pressure Series (Separator Pressure Series Selection) see series selection below. Copyright ©2015 Petro Class Inc. www.petroclass.com • Temperature Series (Separator Temperature Series Selection) see series selection below. Series selection: Separator pressure and temperature series can be either an independent series or a proxy of an existing series (see Series Proxy above). The series selector dropdown contains an independent series option (as specified by the <Internal> entry as well as available proxies of the appropriate type. For example: If a gas meter is being used to meter (Gas Meter 1) the gas phase of the primary separator and a liquid meter (Liquid Meter 1) is metering the separator liquid level then it may be convenient to specify the pressure series as Gas Meter 1.Static and the temperature series as Liquid Meter 1.Temp Note: only existing meter pressure and temperature series will appear in the series selectors i.e. Meters must be created prior to separator configuration. Pressure temperature diagram illustrating the separator operating range. Copyright ©2015 Petro Class Inc. www.petroclass.com Liquid Loading The liquid loading option allows for the monitoring, and alerting, of conditions where the gas velocity may be insufficient to remove liquids from the well. A calculated series that displays the minimum gas rate to unload liquids is available to monitor potential loading conditions along with a ‘liquid loading’ alarm when loading conditions are present. In order to enable the liquid loading calculations, the well flow path and pipe dimensions need to be specified as follows: Copyright ©2015 Petro Class Inc. www.petroclass.com Once the well flow path and pipe dimensions have been entered, two calculated entries (Equivalent hydraulic diameter and Effective lifting area) will be displayed along with the following options: • Calculate sub-surface loading: In addition to surface loading calculations, loading calculations can also be computed for sub-surface conditions. Enabling the sub-surface option provides additional options to define the sub-surface conditions: o Hydraulic diameter override: Use this option to specify an effective hydraulic diameter (overriding the effective surface hydraulic diameter). When the down hole tubular are of different dimensions than at surface (generally this is the tubing landed depth). Leave this entry blank if the dimensions are the same as specified at surface. • Always calculate for unloading water: Forces the liquid loading calculation to always calculate for water loading. Copyright ©2015 Petro Class Inc. www.petroclass.com Data table series related to the liquid loading calculations: Copyright ©2015 Petro Class Inc. www.petroclass.com Once the liquid loading calculation has been enabled (by specifying well flow path and pipe dimensions) a new series will be available under the ‘Well’ group showing the minimum rate required to unload liquids. When the total gas rate is below the minimum lift, the minimum lift rate will be marked in red in the data table (this option can be cleared in the series property window). Surface loading calculations require wellhead pressure and temperature inputs, the values are taken from the data table and can be any of the: Tubing, Casing or Wellhead P&T columns depending upon the selected flow path. The software will automatically select the appropriate P&T inputs for the calculation. The gas rate for determining a loading condition is the sum of all gas meters (included in the totals) as indicated by the ‘Total gas rate’ series in the ‘Data Summary’ group. Sub-surface loading calculations require bottom-hole pressure and temperature inputs that are added to the data table when this option is selected. When both surface and sub-surface calculations are enabled, the effective minimum gas rate is determined by the greater of the two calculations. The liquid loading calculation will calculate for either lifting water or condensate depending on the fluids present. If only condensate is present (and no water) the calculation will be for condensate otherwise the calculation will be for water. ** Note: The ‘Always calculate for unloading water’ option overrides this behavior. Copyright ©2015 Petro Class Inc. www.petroclass.com Mixture Velocity The mixture velocity is a calculation of all well flow (combined: gas, oil, water, condensate and sand) at a specified (in-situ) flowing pressure and temperature. The mixture velocity is calculated and displayed in the data table to monitor velocity changes and optionally alert the operator when liquid or sand conveying mixtures are exceeding an acceptable erosional threshold (upon which an ‘Erosional velocity’ alarm is issued). The following options are available to configure the velocity calculation: • Pipe ID: the inside diameter that the mixture is flowing through. This is a required entry and effectively enabled the velocity calculation. (Leaving this entry blank disables the calculation). • Pressure Series: the data series to provide the in-situ pressure for the velocity calculation (see series selection below). • Temperature Series: the data series to provide the in-situ temperature for the velocity calculation (see series selection below). • Maximum Velocity: the maxim (erosional) velocity allowed. This entry specifies the ‘Velocity’ alarm threshold, leaving this entry blank will disable the alarm. Series selection: Mixture pressure and temperature series can be either an independent series or a proxy of an existing series (see Series Proxy under the wellhead series above). The series selector dropdown contains an independent series option (as specified by the <Internal> entry as well as available proxies of the appropriate type. Copyright ©2015 Petro Class Inc. www.petroclass.com Once the mixture velocity calculation has been enabled (by specifying a pipe ID) new series will be available under the ‘Well’ group including: • Mixture Flow (Pressure) an input to enter the in-situ pressure. • Mixture Flow (Temperature) an input to enter the in-situ temperature. • Mixture Flow (Velocity) the calculated mixture velocity. The mixture velocity is comprised of the sum of all meters (included in the totals) including all: gas, liquids and sand. Velocities above the maximum velocity will be marked in red in the data table (this option can be cleared in the series property window). ** Note: depending on how the pressure and temperature series are configured they not be required if they are proxies of existing series. Often it may be desirable to use the tubing/casing dimensions entered in the liquid loading, if this is desired you can simply enter the ‘Equivalent hydraulic diameter’ from the liquid loading as the Pipe ID. Copyright ©2015 Petro Class Inc. www.petroclass.com Tubing/Casing Drawdown The tubing and casing drawdown series will calculate a percent drawdown (of the respective pressure series) for a specified initial pressure. The tubing and casing drawdown series require an initial pressure. The initial pressure is entered in the series property dialog, for each drawdown series. Copyright ©2015 Petro Class Inc. www.petroclass.com Data Summary The Data Summary is a group of series displaying the total fluids (gas and liquids) metered during the test and includes only the meters with the ‘Include in Totals’ checkbox checked (see Common Meter Options section). The Data Summary defines three basic totals for each test fluid, and is qualified by the following names: • Produced (produced reservoir fluid of type; gas, oil, water or condensate) • Load (recovered load fluid of type; gas or liquid) • Total (total fluid = Produced + Load of type; gas, oil, water or condensate) If load fluid does not exist for a given fluid type, produced and total will be the same. Each test fluid type (Produced, Load and Total) contains the following three series: • Volume (cumulative volume) • Rate (fluid rate) • Gain (volume gain from previous reading) Test fluids of type “Load” may have and additional series of type: • LTR (Load Left to Recover) Load fluids are grouped into two broad categories in the Data Summary; ‘Load Gas’ and ‘Load Liquid’ where load liquid contains the sum of all loads of type Oil, water or condensate. Table view of Data Summary series (cumulative volumes) for a test producing gas, oil and water. Load liquid in this case is the sum of all water or oil loads with a LTR series indicating the initial load is known. It is important to note that data summary maintains a consistent and fixed relationship between time, rate and volume for all fluid types irrespective of the discretization mode (see advanced meter properties) selected for any given meter. The rate displayed for any fluid type in the data summary is an average rate back calculated from the respective time and volume series as a result the rate displayed in the data summary may not match meters with a non-rectangular discretization mode. The data summary rate series represents a normalized average rate, applied consistently for all fluid types, as a results the individual fluid rates are comparable (on a volumetric basis) thus honoring material balance. Copyright ©2015 Petro Class Inc. www.petroclass.com Gas To: Flare, Vent, Pipeline, Incinerate, Other Data Summary also provides a provision to define the destination of the produced gas and the cumulative volumes produced (as defined in EUB PAS PRD V4.0). The additional gas destination series are displayed below. The diagrams below illustrate the Data Summary with “gas to” calculations. The “Gas To” column allows the user to specify the destination of the produced gas. For simplicity, only the “Total Gas” associated columns are shown identical column sets exist for Produced and load gas as well. The “Gas To” column is a user defined input which controls the destination (or sink) of the gas volume produced from the meters with the “Include in totals” option set. The “Total Gas” column displays all gas. The “Total Gas Flared, Vented, Incinerated, Pipeline and Other” columns display respective gas volume cums as directed by the “Gas To” column. In the diagram above, all gas is directed to the “Other” sink. Copyright ©2015 Petro Class Inc. www.petroclass.com To define a gas destination, “Click” the green arrow (or “Right Click” the cell) in the “Gas To” column to display the destination menu then select the destination. Copyright ©2015 Petro Class Inc. www.petroclass.com Changing the “Gas To” designation from “Other” to “Flare” The gas destination can be changed at any time by configuring the appropriate “Gas To” cell (as shown below). Copyright ©2015 Petro Class Inc. www.petroclass.com Gas to “Flare” for 8 readings then to “Pipeline” The gas destination behavior can be overridden for any meter as specified at the meter level (meter properties window). For additional information see: the ‘Gas to: Flare, Vent, Pipeline, Incinerate, Other’ section of the ‘Gas Meter’. When opening older FlowTest data files the “Gas To” column defaults to the “Other” sink. The “Other” sink is a general purpose sink and useful if you do not know (or do not need to track) the gas destination. Copyright ©2015 Petro Class Inc. www.petroclass.com Gas Flare Permit The gas flare permit works in conjunction with the “Gas to:” series (described above) to provide a running tally of the flare permit volume remaining. Data Summary properties window The flare permit options are accessed via the “Data Summary” properties window, with the following options: • Permit specifies the gas volume of the flare permit. • Include Load Gas (if checked) includes the recovered load gas as flared. • Include Incinerate (if unchecked) only gas designated as “flared” is reported in the flare permit, (if checked) the sum of both the flared and incinerated gas is reported. Copyright ©2015 Petro Class Inc. www.petroclass.com Flare permit example with “Gas To” sinks. The “Flare Permit Remaining” column will (by default) display over-flare volume cums in red; this action can be set or cleared via the series properties window. Copyright ©2015 Petro Class Inc. www.petroclass.com “Right-Click” the “Flare Permit Remaining” column header to display the “Series Properties” window “Flare Permit Remaining” series property window Copyright ©2015 Petro Class Inc. www.petroclass.com The Data Summary contains the following calculated (ratio) series for produced fluids; • GOR (Gas Oil Ratio) • GOR Cum (Cumulative Gas Oil Ratio) • GWR (Gas Water Ratio) • GWR Cum (Cumulative Gas Water Ratio) • WOR (Water Oil Ratio) • WOR Cum (Cumulative Water Oil Ratio) • CGR ( Condensate Gas Ratio) • GOR Cum (Cumulative Condensate Gas Ratio) Copyright ©2015 Petro Class Inc. www.petroclass.com Alarms FlowTest displays alarm indicators in the leftmost column of the data table. The alarm indicators alert the user to various warning and error conditions that may arise in the meter calculations. Data Table with Alarm indication. The following list describes the available alarm types: • • • • The multiple alarm indicator is displayed when more than one alarm condition exists at a given time. A sub-critical flow alarm indicates that a critical-flow meter (chokes and critical flow prover) is operating below the critical pressure. A beta ratio warning is issued by an orifice meter when the ratio of the plate to tube diameters is outside the meter calculation limits. A pressure ratio error is issued by an orifice meter when the ratio of the downstream to up-stream pressures is outside the meter calculation limits. Copyright ©2015 Petro Class Inc. www.petroclass.com • • • • • • • The hydrate warning is an indicator of the potential for hydrate formation. Hydrate warnings can be issued for the wellhead or by any gas meter type. This is not a definitive indication of hydrate formation, but is an indication that conditions are favorable for the formation of hydrates. A separator operating range alarm indicates a separator pressure and temperature outside the specified operating range. An erosional velocity alarm is an indicator that the in situ mixture velocity is greater than the erosional limit. A liquid loading alarm is an indicator that the gas velocity may be insufficient to remove liquids from the well. A flare permit alarm is issued when the flared gas volume exceeds the permitted flare volume. The critical alarm is displayed for any condition that requires immediate operator attention. A separator pressure in excess of the specified maximum is a critical alarm. The high flow rate alarm is displayed when a meter (gas or liquid) exceeds the preset maximum rate. Rate presets can be configured in the ‘Alarm Monitor’ dialog (described below). Copyright ©2015 Petro Class Inc. www.petroclass.com Alarms can be configured (enabled or disabled) in the Alarm monitor dialog. To display the Alarm monitor select the Alarm Monitor toolbar button. The ‘Enable’ checkbox under each alarm type, enables or disables the alarm. The ‘High Rate’ thresholds for gas and liquid meters specify the maximum allowable flow rate before triggering an alarm. Clearing the high rate threshold value (or setting the value to zero) will disable the high rate alarm warning. Copyright ©2015 Petro Class Inc. www.petroclass.com To get details on an alarm condition (including the alarm types and meters issuing the alarms) “right-click” the alarm indicator and select Alarm Details. The Alarm Details dialog displays the alarm description, type and the meters issuing the alarm for the specified time index. Copyright ©2015 Petro Class Inc. www.petroclass.com Smart Tags Smart Tags provide the user with the ability to easily incorporate table calculations into the comments for daily summaries and other calculated sub reports. The smart tag engine is an enhancement of the Inline Summary and Section Summary events (see event section). If you create comments in the data table that look like the following: Summary: Total Produced: Gas = 3.28 10³m³ Oil = 11.50 m³ Water = 1.50 m³ Last 8 Hours: Gas = 2.29 10³m³ Oil = 9.50 m³ Water = 1.50 m³ (Then smart tags can make you life easier) General Smart Tag Syntax: All smart tag definitions state with a < character and end with a > character and include a moniker that defines the tag source followed by an optional set of moniker specific arguments (or modifiers) and an optional formatting directives. <MONIKER MODIFIER(S) FORMATTING> MONIKER: can be any moniker listed in the ‘Table Smart Tag Reference’ below or test information monikers Smart Tag Reference in appendix B. Copyright ©2015 Petro Class Inc. www.petroclass.com Table Smart Tag Reference Moniker Description Test Time General: DATETIME Date/Time Predefined Well series: CASINGP Casing Pressure CASINGT Casing Temperature CASINGDD Casing Draw Down CHOKE Choke Size TUBINGP Tubing Pressure TUBINGT Tubing Temperature TUBINGDD Tubing Draw Down Predefined Data Summary Series: GAS_PRO Produced Gas GAS_PRO_VENT Produced Gas (vented) GAS_PRO_FLARE Produced Gas (flared) GAS_PRO_INCIN Produced Gas (incinerated) GAS_PRO_PIPE Produced Gas (to pipeline) GAS_PRO_OTH Produced Gas (to other) GAS_LOAD Recovered Load Gas GAS_LOAD_VENT Load Gas (vented) GAS_LOAD_FLARE Load Gas (flared) GAS_LOAD _INCIN Load Gas (incinerated) GAS_LOAD _PIPE Load Gas (to pipeline) GAS_LOAD _OTH Load Gas (to other) GAS_ALL Total Gas (produced + load) GAS_ALL_VENT Total Gas (produced + load) (vented) GAS_ALL_FLARE Total Gas (produced + load) (flared) GAS_ALL _INCIN Total Gas (produced + load) (incinerated) GAS_ALL _PIPE Total Gas (produced + load) (to pipeline) GAS_ALL _OTH Total Gas (produced + load) (to other) WTR_PRO Produced Water WTR_ALL Total Water (produced + load) OIL_PRO Produced Oil OIL_ALL Total Oil (produced + load) CND_PRO Produced Condensate CND_ALL Total Condensate (produced + load) LIQ_PRO Produced Liquids LIQ_ALL Total Liquids (produced + load) LIQ_LOAD Recovered Load Liquid LIQ_LOAD_LTR Load Liquid Left To Recover FLARE_REMAIN Flare permit remaining Copyright ©2015 Petro Class Inc. www.petroclass.com Series Tag: SERIES[TAG] Any series where “TAG” is the series tag name For series representing a volume, under the ‘Data Summary’ heading in the table above, an additional syntax is supported allowing the user to specify the fluid gain over a specified time interval as indicated below: MODIFIER(S): Various modifiers can be included within the moniker tag, after the moniker name. The modifiers define value-added functionality, for certain monikers, as defined below: • GAIN modifier Format: <MONIKER GAIN ##.##> • • • MONIKER specifies the data summary volume series (by predefined name) GAIN keyword specifies that the moniker represents a gain rather than the cumulative volume. ###.## a number (in hours) representing the time interval the gain is calculated for. Example: <OIL_PRO GAIN 8> • Reports the oil produced over the last 8 hours OFFSET modifier Format: <MONIKER OFFSET ##.##> • • • MONIKER specifies the date-time series (by name: DATETIME) OFFSET keyword specifies that the moniker represents an offset from the current date-time. ###.## a number (in hours) representing the offset. Example: <DATETIME OFFSET 8> Copyright ©2015 Petro Class Inc. www.petroclass.com Resolves to a [DATE + 8 hours] • RANGE modifier Format: <MONIKER RANGE ##.##> • • • MONIKER specifies the date-time series (by name: DATETIME) RANGE keyword specifies that the moniker represents a from-to date rather than a single date. ###.## a number (in hours) representing the time interval the range is calculated for. Example: <DATETIME RANGE 8> Resolves to a [DATE – 8 hours] – [DATE] FORMATTING: For smart tags representing a numeric value, control over the display precision, units and other visual attributes can customized via a ‘number format’ definition. The number format definition contains format specifiers to control display output and a series of optional directives to control units and other attributes. A number format definition is contained within a matching set of {} characters and must be the final tag item before the closing > character of the smart tag. Number Format: {‘Format Specifiers’, Directive, Directive, …} Format specifiers are specified within a matching set of ‘’ characters. Valid specifiers are as follows: Formatting specifiers: V outputs the numerical value of the resulting tag U outputs the abbreviated unit % the ‘%’ character is used with the ‘V’ character to control the precision of the numeric tag value. The default numeric formatting (when no formatting is specified) is equivalent to: {‘V U’} resulting in the numeric value followed by the unit. Tags can be configured to display only the numeric value by omitting the ‘U’ specifier, in addition omitting the ‘V’ specifier displays the units only (without the associated value). Copyright ©2015 Petro Class Inc. www.petroclass.com When a smart tag represents a data series, the default precision for the ‘V’ specifier and the unit type is the same as that specified for the series (precision and units follow the series). The display precision ‘V’ specifier can be overridden by preceding % specifier to explicitly specify the numeric precision as shown below: %0.nV where: n specifies the number of digits following the decimal. ‘V’ format examples: %V outputs the value in maximum precision. %0.2V outputs the value formatted to 2 decimal points %0.4V outputs the value formatted to 4 decimal points Format directives can be applied to the number formatting to change both the reported units and base conditions using the directive commands as follows: Directives: IN(UNIT) AT(CON) overrides the display units for the tag (affects the ‘V’ and ‘U’ output) “UNIT” can be any valid unit tag for the value (for a list of unit tags see ‘Unit Tag Reference’ in appendix A). “UNIT” can also be one of the following key words: ACTIVE Use the current active units, this is the default when no IN directive is specified. METRIC Use the active metric units. IMPERIAL Use the active imperial units. overrides the pressure and temperature base of the displayed ‘V’ value (where applicable) “CON” can be one of the following condition key words: ACTIVE Use the current active conditions, this is the default when no AT directive is specified. METRIC Use the active metric base conditions. IMPERIAL Use the active imperial base conditions. STD Use the default imperial standard conditions of: 14.73 psia and 60 °F PAS Use the default metric standard conditions of: 101.325 kPaa and 15 °C Table Comments may also include test information smart tags, for more information see Smart Tag Reference in appendix B. Copyright ©2015 Petro Class Inc. www.petroclass.com Creating a data table comment with Smart Tags The following demonstrates how to use smart tags in the data tables. Example production with produced gas, oil, water and load fluids. Add a comment with the produced gas smart tag Copyright ©2015 Petro Class Inc. www.petroclass.com The smart tag is calculated when the user clicks away from the comment line An example of using smart tags to create multi-line comments with test totals and daily summaries. Copyright ©2015 Petro Class Inc. www.petroclass.com Resulting calculated smart tag. Using Smart Tags in the table comments provides the following advantages over hard entered values and fluid volumes: 1. Eliminates the need to manually calculate fluid gains for daily totals. 2. Smart tags are automatically recalculated when the table data is modified. 3. Changing units will also change the smart tag values and units. 4. Gas volume smart tags will update automatically when gas properties are updated from the gas analysis results. Copyright ©2015 Petro Class Inc. www.petroclass.com Events FlowTest includes a number of events to indicate specific actions during the test. Events are created in the data table by clicking the blue triangle in the event column, and selecting the “Event…” menu option. The “Event…” option will display the main event dialog. The buttons across the top of the event dialog specify the event to be added as described below: Copyright ©2015 Petro Class Inc. www.petroclass.com Marker Event: The Marker event is similar to a data comment with the exception that other events can be referenced to the marker event. The contents of the Comment Text will be displayed in the data table. Zone Event: Zone events allow the user to specify the zones(s) currently under test. The zone event can be any single zone or a commingling of zones specified in the intervals of the “Test Information” dialog. A Zone event is created by selection the “Zone” on the add Event dialog. Select the zone or commingled zones under test via. Check the box beside the respective zone to specify the current zone(s) under test. Additional comment text can be entered under “Comments”, for display in the data table. Copyright ©2015 Petro Class Inc. www.petroclass.com Inline Summary Event: An Inline Summary event provides the ability to add test summaries, based on the previous (n hours) of production, to the data table An Inline Summary event is created by selection the “Inline Summary” on the add Event dialog. The “Reference” for the summary can be either a fixed time (i.e. the last 8 hours) or a previous “marker” type event. Copyright ©2015 Petro Class Inc. www.petroclass.com All fluids, currently defined in the test, are listed in the “Test Fluids” table. The check boxes beside each fluid (when checked) will be included in the summary. Section Summary Event: The Section summary event operates in a manner similar to that of the Inline Summary with the exception that the summary is reported on a specified test section rather than the previous (n hours) of production. Valid test section include; the entire test and any Zone event. A Section Summary event is created by selection the “Section Summary” on the add Event dialog. The “Totals for” option specifies the section for the summary, options will include “Entire Test” and all zone events. Copyright ©2015 Petro Class Inc. www.petroclass.com All fluids, currently defined in the test, are listed in the “Test Fluids” table. The check boxes beside each fluid (when checked) will be included in the summary. The Section Summary events are stateless (they do not require an event time in the data table) as such Section Summaries can be placed anywhere in the data table, even before the actual, referenced, section event. Copyright ©2015 Petro Class Inc. www.petroclass.com Conditional Events Conditional events are not accessible though the “Add Event” dialog, these events are available only if certain criteria are met. Conditional events are accessed through the event column of the data table. The following events are conditional events: Add Load Fluid Event: The Add Load Fluid event provides a mechanism to add load fluid to the system and is available only if load fluid is specified for the test (see Liquid Separator Meter). The Add Load Fluid event(s) in conjunction with the load fluid recovered, by the liquid meters, form the basis of the LF LTR (load fluid left to recover) calculation. An Add Load Fluid event would typically follow a Zone event; however load fluid can be added at any point during the test. Copyright ©2015 Petro Class Inc. www.petroclass.com The Add Load Fluid dialog lists all fluid types defined as load fluid. The entered volume specifies the fluid addition for the event. Liquid Meter Grind-out Event In order for the liquid meter to calculate the proportions of separator fluids, a “Grindout” Event must be applied at a valid meter reading. The Grind-out event is available only for Liquid Separator meter types and only on valid meter readings. At a valid Meter reading, Select the Grind-out event Copyright ©2015 Petro Class Inc. www.petroclass.com The Grind-out event dialog allows for the entry of the relative proportions of the metered fluids. Copyright ©2015 Petro Class Inc. www.petroclass.com Data table with multiple events defined. Copyright ©2015 Petro Class Inc. www.petroclass.com Reporting The reporting engine in FlowTest generates report in PDF format directly and does not require any 3rd party PDF tools or printer drivers. The report view consists of a series of options in the navigation bar and a PDF viewer. The navigation bar options control the report contents and appearance. There are two reporting modes “Quick Report” and “Custom Report”. Quick report generates reports based on a fixed format and is useful for generating quick reports in the field. Custom reports allow for a more detailed report based upon a number of standard and user defined templates. Copyright ©2015 Petro Class Inc. www.petroclass.com Quick Report As described above, the quick report mode is useful for generating quick reports in the field the format of the report is fixed but does allow for control over the actual report contents. To generate a Quick Report: • Select the “Quick Report” tab in the report navigation bar. • Specify the desired options for the report. • Press the “Generate” button to create the report. Copyright ©2015 Petro Class Inc. www.petroclass.com Custom Report Custom reporting creates reports based upon a specified report template allowing for detailed reports specific to a particular test type or client. The custom report view is similar to the quick report with the addition of the template select button and display. The report options are displayed only after a report template has been loaded. To Generate a Custom Report: • Select the “Custom Report” tab in the report navigation bar. • Load a report template by pressing the select template button. • Specify the desired options for the report. • Press the “Generate” button to create the report. Copyright ©2015 Petro Class Inc. www.petroclass.com Report Options • • • • • • • Attach Data File (embed the FlowTest data file as an attachment in the report) Generate/Attach PAS File (generate and embed a PAS file as an attachment in the report) Attach CSV File (embed a CSV file as an attachment in the report) o Based on Table: (select the table in the data file to base the CSV attachment on) o Include Well Header (adds the well header to the CSV attachment) o Include Column Header (adds the column/series names and units to the CSV attachment) Watermarks (quick report only) (adds images to the report) Bookmarks (creates a bookmark or table of contents in the report indexing the sections within the report) Margins: (quick report only) (set page margins) Footer: (quick report only) o Page Numbers (adds page numbers to the footer of each page) o Filename (adds the data file name to the footer of each page) Copyright ©2015 Petro Class Inc. www.petroclass.com Contents: The contents section of the report options represents the various sections that will be included in the final report. Each section represents a report page or group of pages depending on the section type. Section Types include: • Test Information • Meter/Equipment report • Data Table • Data Plot • Template defined sections. Each section can be included or excluded from the report via a check box left of each section. In addition, a section may have additional configuration options available as indicated by the presence of a “+” (click to expand additional options). In addition to the sections, a “Page Order” item can be used to specify the order of the sections within the report. Copyright ©2015 Petro Class Inc. www.petroclass.com Content Section Descriptions: Data Table Options: • • • • • Size (specify page size for the data table section) Orientation (specify page orientation Portrait/Landscape) Fit To Page (check item to automatically scale the output so that all table columns fit (width wise) on a single page) o Scale (if “Fit To Page” is off, a scaling percentage can be entered to manually scale the output) Page Split (splits each page horizontally) see example below Appearance (specify appearance options of the table) o Black & White Cells (removes all coloring from the table) Copyright ©2015 Petro Class Inc. www.petroclass.com • • o Hairline Grid (prints the grid lines as a hairline (single pixel wide) o Gray Gridlines (print gridlines as light gray) Filter o Column (expand to display the columns in the table uncheck columns to exclude them from the report) o Rows (filters the data rows to include a specified range) see example below Daily Summary (Adds a daily summary to the footer of each page displaying the total and incremental cums) o Cutoff (specifies the daily cutoff time for the summary) The report table section of the report includes one or more pages of table data depending on the size of the table and the options selected. In general the report generator will print the data table spanning multiple pages (as required). In the event that all the table columns do not fit horizontally on a single page the report generator will automatically insert column breaks and print additional columns on subsequent pages in the report. In order to force all columns on a single page use either the “Fit To Page” or manual scaling options. Page Split: The page split option can be used to conserve page real-estate when the data table contains few columns. In the diagram below the usefulness of page splitting is illustrated for a wire line data set consisting of time, pressure and temperature columns. Copyright ©2015 Petro Class Inc. www.petroclass.com Copyright ©2015 Petro Class Inc. www.petroclass.com Row Filter The row filter can be used to filter the reported rows for the data table. Select the “Rows” button under the table filter to display the “Table Row Filter” window. The “Table Row Filter” window has the following options: • From Row (specify the first row number to print) • To Row (specify the last row to print a value of -1 prints to the end) • Remove Filter (remove any row filter) Copyright ©2015 Petro Class Inc. www.petroclass.com Data Plot Options: • • Size (specify page size for the data table section) Orientation (specify page orientation Portrait/Landscape) To change the report title for either the data table or plot… from the ‘Data Entry’ view click on either the plot or table and select “Report Title…” from the Plot or Table menu on the main menu bar. Copyright ©2015 Petro Class Inc. www.petroclass.com Report Generation In order to see the effect of any changes made to the report options the “Generate” button must be pressed to generate a new report with the changes. A report can be saved by clicking the “Save PDF” button. Report Preferences The following options are available in the report section of the “User Preferences” window (see user preferences) Press the ‘User Preferences’ toolbar button to display the “User Preferences” window. Copyright ©2015 Petro Class Inc. www.petroclass.com • • • • PDF Generation Options (options relating to the PDF document structure) o Font Embedding (specify how fonts are included in the PDF document) see example below Quick Report Options (Options specific to quick report generation) o Attach Data File (set default for new files) o Generate/Attach PAS File (set default for new files) o Watermarks (set default for new files) Page Header Items (customize the header items for quick and custom reports) see example below Page Footer Items (customize the footer items for quick and custom reports) see example below Font Embedding The font embedding option specifies the fonts to include/exclude in the PDF report as well as embedding an entire font or only a subset of the actual characters used in the report. These settings affect both the size of the PDF file and the compatibility when displayed/printed on computers that do not contain the original fonts. Some fonts are restricted by licensing conditions; such fonts will not be embedded in the PDF report. The font embedding window displays all the fonts available on the computer in the list on the left, the list on the right contains fonts not to be embedded within the PDF report. Fonts can be moved between the two list by selecting the fonts and using the < and > buttons. Additional options as follows: • Embed fonts in PDF document (if this is un-checked no fonts will be embedded in the report) Copyright ©2015 Petro Class Inc. www.petroclass.com • • Subset embedded fonts (if checked a subset of the font will be embedded in the report otherwise the entire font is embedded) Default button (default sets the “Never Embed” list to exclude the PDF standard fonts (and aliases of the standard fonts)) The recommended default for font embedding is to embed, subset and exclude the standard fonts (as set when the default button is pressed). Copyright ©2015 Petro Class Inc. www.petroclass.com Page Header Items Items appearing in the header section of each report page can be customized via the ‘Report’ section in the ‘User Preferences’ dialog. Up to 5 customizable header lines are available with each line containing a left and right justified item. Any fixed text may be specified as a header item along with replaceable smart tags. Replicable smart tags are key words enclosed by angle brackets <>. A list of valid smart tags is displayed in the right hand section of the dialog and represents values entered in the test information input screen. For example: If the operator name is “ABC Oil” and the well name is “Well 1” Monikers will print as follows: Moniker Text <OPERATOR> Operator: <OPERATOR> <WELL_NAME> Report Text ABC Oil Operator: ABC Oil Well 1 It is important to note that the page header items are a template for all reports created by the computer. Page header items should contain only smart tags and labels. Test specific information should not be entered here as it will show up on ALL reports for every test generated by the computer! Copyright ©2015 Petro Class Inc. www.petroclass.com Page Footer Items A company logo can be added to the page footer by adding the image file as a logo the “Page Footer” Copyright ©2015 Petro Class Inc. www.petroclass.com Generated report in FlowTest Copyright ©2015 Petro Class Inc. www.petroclass.com P.A.S. The PAS generator will create PRD V4.0 PAS file, of the current test data, for submission to the EUB. FlowTest implements an internal “zip” file compressor which can package the generated PAS file along with the current PDF report into a single “zip” file. A direct portal to the EUB Digital Data Submission site is provided, allowing the user to submit file directly from the FlowTest application. Copyright ©2015 Petro Class Inc. www.petroclass.com Create PAS PRD file PAS Options: The PAS PRD generator has several options for creating and packaging PAS file and reports. The items in the PRD Navigation bar provide context sensitive views for each associated item when clicked on. • • • Copyright ©2015 Petro Class Inc. www.petroclass.com EUB Digital Data Submission Displays a portal to the EUB submission site. ***.pas Displays the generated pas file in a native test format ***.zip Displays a view showing current files in the zip package as well as controls to add/ remove files. Files contained in the package are also displayed as sub items in the PAS Navigation bar. Clicking on the sub items will display their contents in the view. The following will outline the steps to create a PAS file form the current data and package it with the current report for submission to the EUB. These steps assume a report has been generated (see Report view for instructions on generating reports). Copyright ©2015 Petro Class Inc. www.petroclass.com 1) Press the ‘Generate’ button on the PAS navigation bar to bring up the PAS PRD Test Information dialog. Copyright ©2015 Petro Class Inc. www.petroclass.com PAS PRD Test Information The PAS PRD Test Information dialog contains 3 main sections: • Well Information • Test Data • Fluid Volumes The sections are described below: Copyright ©2015 Petro Class Inc. www.petroclass.com Well Information: The Well Information section contains a copy of the data entered into the main test Information dialog (see ‘Test Information’ for a description of each field) Copyright ©2015 Petro Class Inc. www.petroclass.com Fluid Volumes The Fluid Volumes display provides a detailed view of the respective fluid cumulative volumes metered during the test. The volume data is taken from the ‘Data Summary’ group and represents the total volume metered for each fluid type. A value displayed as ’—‘, indicates the absence of that particular fluid type. For PAS reporting the fluid types are defined as; gas, oil, water and condensate. Each fluid type is further classified as either produced or load as described below: Copyright ©2015 Petro Class Inc. www.petroclass.com • • • • Gas o Produced (produced reservoir gas) o Load (recovered load gas) o Total (all metered gas Produced + Load) Oil o Produced (produced reservoir oil) o Load (recovered load oil) o Total (all metered oil Produced + Load) Water o Produced (produced reservoir water) o Load (recovered load water) o Total (all metered water Produced + Load) Condensate o Produced (produced reservoir condensate) o Load (recovered load condensate) o Total (all metered condensate Produced + Load) A blue asterisk appears beside a single sub-type of each fluid type indicating the cumulative volume being reported in the PAS file for that fluid (see ‘Test Data’ description below). Copyright ©2015 Petro Class Inc. www.petroclass.com Test Data: • Exclude from PAS Report As described above, the cumulative volume for each fluid type is a combination of produced and load fluids. If load fluid exists, you have the option to exclude the load fluid from the PAS report via the following two checkbox options: o All Load Gasses, excludes all load gas from the PAS report. o All Load Liquids, excludes all loads of type oil, water and condensate from the PAS report. Changing these options will update the ‘Fluid Volumes’ pane to reflect the new cumulative reported for each fluid. • Gas metered during test PAS requires a destination of all gas reported and may be any combination of the flared, incinerated, produced to pipeline or vented. Five radio buttons are available under to quickly assign the gas destination described as follows: o Assign Manually (allow user to manually assign gas destination(s)) o To Flare (assign all gas to flare) o To Incinerate (assign all gas to incinerate) o To Pipeline (assign all gas to pipeline) o To Vent (assign all gas to vent) The sum of the gas destinations must equal the total gas reported for the test, an error will be displayed to the right of the total if this is not the case. Copyright ©2015 Petro Class Inc. www.petroclass.com 2) After entering all the required information press the ‘OK’ button on the dialog to generate the PAS file. The generated PAS file is then displayed as shown below. 3) Save the PAS file by right clicking the file in the tree and select ‘Save’ Copyright ©2015 Petro Class Inc. www.petroclass.com • EUB Digital Data Submission portal PAS files can be submitted directly, from within FlowTest, by clicking on the “EUB Digital Data Submission (DDS) item in the PAS Navigation bar pane. Copyright ©2015 Petro Class Inc. www.petroclass.com Read PAS PRD file FlowTest can read PAS PRE V4.0 files directly. To read a PAS PRD file select “Import PAS…” from the File menu. Copyright ©2015 Petro Class Inc. www.petroclass.com Real-Time FlowTest incorporates real-time data acquisition for any input series with sample times up to one second. Real-time data is acquired via the PetroClass Real-Time Monitor (RTM) software tool. The RTM contains all the logic necessary to interface with the instrumentation hardware and provides a means of transferring the data to FlowTest in real time. For information on configuring and using the RTM consult the PetroClass RTM user manual. User Interface The FlowTest real-time user interface is disabled (hidden) by default. The interface only becomes available when an RTM is detected (RTM is running). If an active RTM is detected when FlowTest first starts the real-time user interface is enabled, and made visible. Copyright ©2015 Petro Class Inc. www.petroclass.com PetroClass Real-Time Monitor (RTM) Copyright ©2015 Petro Class Inc. www.petroclass.com FlowTest Real-Time UI (enabled when the RTM is running). Copyright ©2015 Petro Class Inc. www.petroclass.com Configuration The real-time UI consists of two main windows, the control window and the digital data display. Copyright ©2015 Petro Class Inc. www.petroclass.com Control Window The control window displays all the RTM servers currently running and provides the means to set/adjust the data sample rate. The server list displays all the RTM servers currently running along with the connection status (connected/disconnected). To connect to a server, select the server in the list and press the ‘Connect Server’ toolbar button. The server list will change to display the connected server status and provides additional information with respect to the channels available, type and series tag name. Copyright ©2015 Petro Class Inc. www.petroclass.com The sample rate is the rate at which readings are updated in the FlowTest tables. To change the sample rate, press the ‘Sample Rate’ toolbar button. Sample Rate Window Allowable sample rates range from 1 second to 60 minutes. ‘Synchronize readings to top of hour’ will update readings into FlowTest synchronized to the top of the hour, this feature makes the readings fall on even increments of minutes eliminating fractional second and minutes in the data tables. The ‘Pause’ toolbar button will suspend the real-time update into FlowTest (it does not stop the readings as they will be cached during the pause and immediately updated when pause is removed). This feature is useful for updating table comments or generating reports/exports (basically any time you have several task to complete and you require consistent data for each task). Copyright ©2015 Petro Class Inc. www.petroclass.com Digital Data Display Digital Data Display The digital display displays all real-time data for connected servers. The data displayed is updated every second irrespective of the sample rate and pause status and is displayed in the units sent by the RTM. Copyright ©2015 Petro Class Inc. www.petroclass.com Mapping RTM channels to FlowTest series In order for the real-time data to be transferred to FlowTest, RTM channels are mapped to FlowTest data series by using channel tags. Data from the RTM will be mapped to FlowTest series that have matching tags (see diagrams below). **Tip** generally you would save series and channel mapping in FlowTest templates and RTM configuration files for a specific hardware arrangement. RTM channel mapping Copyright ©2015 Petro Class Inc. www.petroclass.com FlowTest series mapping “Right Click” series, select Properties Copyright ©2015 Petro Class Inc. www.petroclass.com When the real-time servers are configured and connected in FlowTest, data transfer will begin to update the tables and plots in real time. Copyright ©2015 Petro Class Inc. www.petroclass.com Troubleshooting This section assumes that the RTM is configured and is communicating successfully with the instrumentation hardware. If the RTM is not communicating with the instrumentation hardware consult the RTM user manual. Any detected errors in the configuration are displayed in red at the bottom of the screen and may include any of the following: • Output Series: The series is an output (or calculated series) and is not a valid target for real-time data. • Type Mismatch The series and channel types are not compatible i.e. you cannot assign a pressure to a temperature. Some of the more common errors and solutions are given below: • The real time window does not show up in FlowTest. The RTM server must be running prior to starting FlowTest. If FlowTest does not detect any servers when it is launched the real time window is not available. Solution: Start and configure the RTM then restart FlowTest. • The digital display does not show any channels. You must be attached to the server before any channels are displayed. Solution: Select the server and press the “Attach Server” button. Note: The server must have at least 1 configured channel in order to show up in the digital display. • The data shows up in the window but the units are wrong. This is a RTM configuration issue, consult the RTM user manual. • The data shows up in the window but does not get transferred to the series in FlowTest. The digital display has a column labeled “Series Feed” this column shows the series associated with the real time channel. If the “Series Feed” entry is empty there is either and error (displayed in the error window) or no matching series tag. Solution: For an error, the error condition must be resolved. For a tag mismatch you need to check the tag for the channel in the RTM and the tag in the series you want, both must match; Copyright ©2015 Petro Class Inc. www.petroclass.com Cloud The FlowTest cloud extensions allow for real-time synchronization of the active job to the PetroClass cloud server. Jobs on the cloud server can then be viewed by staff and clients using any standard web browser, including mobile devices. In addition to synchronizing the active job, the cloud can store additional job related files such as reports, csv exports, images etc. Copyright ©2015 Petro Class Inc. www.petroclass.com The PetroClass Cloud is offered to FlowTest users as a value added subscription service. For a limited time, an evaluation of the cloud extensions are available the FlowTest users free of charge * The main differences between the evaluation and the subscription service are as follows: • The duration of the evaluation is limited to 3 months. • The evaluation only allows for a single user, as such, it is not possible to create multiple users/clients and limit cloud access based upon the user. It is possible to allow multiple users to log into the cloud simultaneously, using the evaluation account. • Evaluation cloud data is not backed-up on the server. • Additional terms and conditions are described in the cloud EULA (available when activating the cloud account) * Cloud terms and conditions may change without notice. The remainder of this documentation describes the evaluation cloud functionality only. Document on the cloud subscription service is available either on the subscription cloud or by contacting PetroClass. Copyright ©2015 Petro Class Inc. www.petroclass.com Getting started To get started using the PetroClass cloud one must first activate the evaluation account. A single evaluation account applies to all FlowTest licenses within your organization as such, when the account is activated with any FlowTest license, all other licensed copies of FlowTest will share the same account. Note: An active internet connection is required to access the PetroClass cloud. If you have an active connection and still cannot access the cloud, the computer may have a firewall configured to block internet access from external programs. Consult you IT personnel to verify that internet connectivity to FlowTest is enabled. Copyright ©2015 Petro Class Inc. www.petroclass.com Creating an evaluation account In order to use the FlowTest cloud you must first create an account on the system as follows: 1. In the cloud navigation bar, click the ‘Login’ button or click the ‘Create an account or login…’ link in the main cloud view. 2. A cloud registration form, similar to the one below, will be displayed. If the cloud login window is displayed instead (see: Logging In below) then an account has already been registered for your company. In this case you will need to get the account information from the person that created the account and proceed to the ‘Logging In’ step below. If any other message is displayed, consult the cloud troubleshooting section for possible causes. Copyright ©2015 Petro Class Inc. www.petroclass.com 3. Fill out the cloud registration form and press the ‘Create Account’ button. Upon successful registration, a message will be displayed informing you that an email has been sent to the address provided. 4. Open the email, sent by the cloud server, and follow the instructions contained within to activate the cloud account. **Note: You must activate the account by following the link in the email before the account can be used. 5. Proceed to the ‘Logging In’ section below. If you have multiple users’ evaluating the FlowTest cloud functionality you must give them the login ID and password, as there is only a single evaluation account available for your entire company. For the evaluation, multiple accounts cannot be created but simultaneous logins using the same account are permitted. Copyright ©2015 Petro Class Inc. www.petroclass.com Logging in Logging into the cloud requires an activated account. If you do not have an active account, follow the instructions in the ‘Creating an evaluation account’ above. 1. In the cloud navigation bar, click the ‘Login’ button or click the ‘Create an account or login…’ link in the main cloud view. 2. The cloud login window, similar to the one below, will be displayed. If any other message is displayed, consult the cloud troubleshooting section for possible causes. 3. Enter your login ID and password and press the ‘Login’ button. Copyright ©2015 Petro Class Inc. www.petroclass.com 4. Upon a successful login, the Cloud navigation bar and view will display additional cloud options as shown below: The QR code (and the link below it) is the address used for client access to the cloud from any web browser. In the cloud navigation bar, two additional icons are available once logged in. The icons functionality is as follows: Main cloud page (documentation and links) Synchronize the active FlowTest job to the cloud. Explore cloud files. Upload, download and create cloud folders. Copyright ©2015 Petro Class Inc. www.petroclass.com Client cloud access To access the cloud from a web browser (client access) use the URL link address (or QR code) on the main cloud view in FlowTest. Secure cloud login screen Main cloud home screen (after login) * Use the same login ID and password from the FlowTest cloud registration. You can create a shortcut to the home page for easy future access. Copyright ©2015 Petro Class Inc. www.petroclass.com Synchronizing a FlowTest job to the cloud The current (active) FlowTest job can be synchronized to the cloud in real-time with either manual or automatic sync intervals. For simplicity, in this demonstration we will be working with an existing job (that already contains data). Steps to synchronize a job to the cloud: 1. Open an existing FlowTest data file. 2. Go to the cloud navigation view and login. 3. In the cloud navigation view select the ‘Job Sync’ icon to get the following view: 4. In the cloud view, press the ‘…’ button Copyright ©2015 Petro Class Inc. www.petroclass.com 5. The ‘Synchronize to cloud’ window opens up to allow you to specify a name and location for the job on the cloud server. 6. The ‘Synchronize to cloud’ window shows a list of folders and FlowTest cloud files that currently exist in the cloud. From here you can create the cloud file by specifying a file name in the desired folder location. To create folders of otherwise navigate this window; see the ‘View, upload and download cloud files’ section below. Specify a file name and location and click ‘Save’. Copyright ©2015 Petro Class Inc. www.petroclass.com 7. The main cloud window will now show additional synchronization for the job as shown below: A description of the options in this view will be described in detail below. 8. Using the default settings, manually synchronize the data file to the cloud by pressing the ‘Synchronize Job Now’ in the cloud view. 9. At this point you should receive confirmation that the sync was successful with the following message: Copyright ©2015 Petro Class Inc. www.petroclass.com 10. Log into the cloud with a web browser to view the job in the cloud. For instructions on how to do this see the ‘Client cloud access’ section above. 11. From the client cloud view select the ‘Explore’ icon. 12. Navigate the file view(s) to the location where the file was saved. Copyright ©2015 Petro Class Inc. www.petroclass.com 13. Select the job file to load the job. Job view Test Info (sections expandable) Data Table (pan and zoom) Data Plot (pan and zoom) FlowTest cloud job screen shots. For additional information consult the cloud user manual. Copyright ©2015 Petro Class Inc. www.petroclass.com Additional Synchronization options: Within the ‘Job Sync’ view, the following options are available to automate and customize the cloud synchronization. • Automatic synchronization An automated synchronization schedule can be set whereby the active job is synchronized to the cloud in the background at regular intervals. As shown below: To enable the automated Synchronization, check the ‘Enable’ button and specify the update frequency. Note: You can still force a manual sync at any time by pressing the ‘Synchronize Job Now’ button. • Specify the data table and plot to send In the ‘Contents section there are two drop boxes to configure which table and plot are synchronized to the cloud. As shown below: • Executive Summary and News Feed items The Executive Summary and News Feed items are used together to add value to the job synchronization. Within the client cloud interface there are essentially two ways of viewing cloud files (be they FlowTest jobs or other uploaded files) As we have seen above, we can view cloud files in a standard folder hierarchy via the ‘Explore’ icon in the main cloud view. The second way to view cloud file is via the ‘News Feed’ icon. The news feed displays news threads (with associated jobs or files) in a chronological order. The best way to illustrate the news feed and executive summary is with an example as follows: Copyright ©2015 Petro Class Inc. www.petroclass.com Job Synchronization add to News Feed 1. Enable the ‘Add to News Feed’ checkbox option. 2. Click the ‘Synchronize Job Now’ in the cloud view. 3. From the client cloud view select the ‘News Feed’ icon. The job now shows up in the news feed. The job can be loaded by selecting the job thread in the news feed. Copyright ©2015 Petro Class Inc. www.petroclass.com Executive summary items Executive summary items are value added charts that appear within the job thread in the news feed. FlowTest currently has five summary reports available as follows: 1. 2. 3. 4. 5. Volume Report Flow Time Report Reservoir Gas Report Load Fluid Report Flare Permit Report Bar chart of total test volumes. Pie chart off Flowing and shut-in time. Pie chart of reservoir gas by destination. Pie chart of RCV and LTR. Pie chart of flared gas to permit volume. Some of the chart items may be grayed out (unavailable) if the test contains no data to generate the report. For example if there is no load fluid being recovered, then the load fluid report is made unavailable. An example with new feed executive summary charts: 1. Enable the ‘Show Executive Summary’ option and select all available reports. 2. Click the ‘Synchronize Job Now’ in the cloud view. Copyright ©2015 Petro Class Inc. www.petroclass.com 3. Resulting executive summary reports in the news feed. Note: When re-synchronizing job files in the news feed the previous job thread is replaced by the current thread, and moved to the top of the news feed. This effectively keeps a single, per job, thread in the news feed. Synchronization Technical Note: The FlowTest job synchronization utilizes a highly efficient, proprietary, delta compression algorithm to minimize the data transfer over the internet. Our proprietary algorithm (operating in the background) detects and sends only the compressed changes between consecutive synchronization sessions over the internet. We realize that internet data bandwidth is expensive in the field and, as a result, we have dedicated a great deal of effort in conserving this resource. The net effect is you can synchronize more frequently without the fear of burning up you mobile or satellite data plan. Copyright ©2015 Petro Class Inc. www.petroclass.com View, upload and download cloud files FlowTest contains a cloud explorer to manage cloud files and folders. The cloud explores allows you to do standard operations such as creating directories, uploading files, downloading files and deleting files. The cloud explorer is accessed via the ‘Explore’ icon in the cloud navigation bar. The explorer has two main parts, the left pane displays a hierarchical view of the cloud folders and the right pane displays the files and folders contained in the selected (left pane) folder. Copyright ©2015 Petro Class Inc. www.petroclass.com Common operations: • Create Folder To create a new folder (in the file view) right click anywhere in the blank area of the file view (i.e. not on a file name) and select ‘New Folder…’ In the Create Folder window, name the folder and select ‘OK’ The new folder now appears in both views. Copyright ©2015 Petro Class Inc. www.petroclass.com • Upload a file To upload a file (in the file view) right click anywhere in the blank area of the file view (i.e. not on a file name) and select ‘Upload…’ In the ‘Upload File’ window select the file to upload and click the ‘Open’ button. The file is transferred to the cloud and appears in the file view. Copyright ©2015 Petro Class Inc. www.petroclass.com • Download a file To download a cloud file, in the file view, select the file, right click and select ‘Download’ In the ‘Download File’ window, select the destination for the download and click the ‘Save’ button. Copyright ©2015 Petro Class Inc. www.petroclass.com Uploading Files and adding to the news feed When uploading files to the cloud you can specify that the file reference is added to the news feed. In the ‘Upload File’ enable the ‘Add to News Feed’ option as follows: When ‘Add to News Feed’ is selected, the ‘News Thread’ window is displayed and requires a headline for the news thread and an optional message. The uploaded file is uploaded to the specified location, with the addition of creating a thread in the news feed referencing the file. If the news file is a picture then a thumbnail image of the file will also appear in the news thread as shown below. Copyright ©2015 Petro Class Inc. www.petroclass.com Uploaded picture file in news feed Uploaded files in cloud explore Select the file to view or download files from the cloud. Copyright ©2015 Petro Class Inc. www.petroclass.com Data Exporting FlowTest provides two data export options: a coma separated value (CSV) and a direct to Microsoft Excel format. To export the current data set select ‘Export’ from the File menu. Copyright ©2015 Petro Class Inc. www.petroclass.com CSV Export The CSV export allows for a single data table to serve as a template for the data being exported. Create a CSV export by selecting the ‘Export CSV’ option from the Export menu. In the export dialog select the table to base the export on, optionally include the well information and column headers, enter a name for the CSV file and select Save. Copyright ©2015 Petro Class Inc. www.petroclass.com Excel Export The Excel export directly transfers the current FlowTest file into Microsoft Excel. In order to use this export, excel must be installed on the computer running FlowTest. Create a Excel export by selecting the ‘Export Excel option from the Export menu. In the export dialog select the template to base the export on, and select Open. The export will launch a new instance of Microsoft Excel containing the exported data. Copyright ©2015 Petro Class Inc. www.petroclass.com Example: Excel export Sheet1 Example: Excel export Sheet2 Data is exported as multiple sheets within Excel. Sheet 1 contains well, company and test information. The remaining sheets will contain each table in the FlowTest file. Copyright ©2015 Petro Class Inc. www.petroclass.com Note: For Microsoft Excel versions prior to Excel 2007 The template provided ( FlowTest.xltx) is compatible with Microsoft Excel 2007 and newer. If you have a previous version of Excel installed, and the export will not open the template file, Microsoft provides an “office compatibility pack” free of charge, allowing previous office products to open office 2007 files. The office Compatibility pack is available for download at: http://www.microsoft.com/downloads/details.aspx?FamilyId=941b3470-3ae9-4aee8f43-c6bb74cd1466&displaylang=en Optionally; one can open the template in Excel 2007 and save a copy in an Excel 2003 or earlier format. Advanced export functionally is available, allowing for customized exports tailored to specific client requirements. For detailed information on creating custom Excel exports see: Custom Excel Exports in Appendix A. Copyright ©2015 Petro Class Inc. www.petroclass.com Standard Conditions Dialog The Standard Conditions Dialog displays the base conditions that gas rates and volumes are referenced to as well as the local atmospheric pressure for the test. Standard Conditions is accessed via the Preferences button on the main toolbar. • • • Atmospheric Pressure is the local atmospheric pressure for the test. It is used when converting gauge pressures to absolute pressures (and vise versa). Standard Conditions are fixed (non editable values) representing the standards the meter calculations are rigorously calculated to. Base (Contract Conditions) represent base conditions for each of the Unit modes (Metric and Imperial) as well as the base conditions for PAS submissions. PAS base conditions are fixed at 101.325 kPa absolute and 15.0 °C and cannot be changed. Copyright ©2015 Petro Class Inc. www.petroclass.com The current unit mode is set via the Units button on the main toolbar. Metric and Imperial bases can be changed but PAS base conditions are fixed (non Editable) Rates and Volumes are converted from standard to base conditions via the following formula: Vb = Vs(Ps/Pb)(Tb/Ts)(Zs/Zb) where Zb = Zs = 1 (non rigorous calculation excludes Z, assuming ideal gas behavior, in the conversion) • Absolute/Gauge Pressures ‘Mark opposite type in tables’ will give an indication that the displayed unit type (either absolute or gauge) differs from the type set when the data was originally entered, by coloring the respective values green. See section titled “Absolute / Gauge Conversions” for more information. Copyright ©2015 Petro Class Inc. www.petroclass.com Units (Metric/Imperial) FlowTest provides a rich set of units for entry and display of the test data. Units are categorized into two working modes (Metric and Imperial) providing the appropriate oilfield units. The current unit mode is set via the Units button on the main toolbar. Pressing the unit button effectively toggles between the metric and imperial modes. The active unit mode is displayed in the status bar at the bottom of the program window. The metric and imperial unit modes have independent pressure and temperature bases for reporting standard gas rates and cums (see: Standard Conditions Dialog). In addition to the metric and imperial modes the units for any column in the data table can be further customized to override the default units. For more information see: ‘Change Units’ in the ‘Data Entry’ data table section. The default unit mode (for new files) can be set in the User Preferences window, see: User Preferences and Defaults section. Copyright ©2015 Petro Class Inc. www.petroclass.com Start-Up View The start-up view is displayed is the initial view displayed when FlowTest is started. The Start-up view provides a convenient means of opening recent files and templates. The Start-up view can be accessed at any time through the “Start Page” button on the main toolbar. Copyright ©2015 Petro Class Inc. www.petroclass.com Data File Templates Data file templates are a convenient means of defining default UI and meter configurations for various test types. Any file can be saved as a template by selecting “Save Template …” from the File menu. A Template contains only UI and meter configuration any specific data is removed from the template. A dialog displaying the current templates is displayed whenever an “new" file is created. Copyright ©2015 Petro Class Inc. www.petroclass.com Backup File Recovery FlowTest will create backups of the currently edited file at 15 minute intervals. Six such backups are maintained and overwritten in a round-robin fashion. To view or recover a backup file, select the “Backup File Recovery..” option from the “File” menu. Copyright ©2015 Petro Class Inc. www.petroclass.com Absolute / Gauge Conversions FlowTest treats absolute and gauge pressure readings as distinct types where: Absolute pressure = Gauge pressure + Atmospheric pressure Gauge pressure = Absolute pressure - Atmospheric pressure In order to maintain Data integrity, FlowTest stores an absolute/gauge indicator with each reading. In addition, the Atmospheric pressure is defined (in FlowTest) to be constant throughout the test. Meter calculations require a static pressure in absolute readings. If the static meter pressure inputs contain gauge pressures they are converted to absolute pressure for the meter calculation. If the (Global) Atmospheric pressure is changed, meters with gauge static pressure inputs will be forced to recalculate whereas meters with static inputs defined as absolute pressure need not recalculate. Series can contain both absolute and gauge types, and, the type can be changed on the fly. If a series contains a mixture of absolute and gauge readings, those reading that are not of the selected unit type are displayed in “green”. To illustrate this, consider the following series of actions (as demonstrated below): o In the first diagram all readings were entered in absolute mode and are all displayed in black. o The second diagram shows the readings as “green” after the units are changed to gauge mode (indicating the readings are actually entered as absolute). Copyright ©2015 Petro Class Inc. www.petroclass.com o In the third diagram the first three readings are modified (while in gauge mode) changing the first three reading to gauge, but leaving the remaining readings as absolute. o In the fourth column the units are changed back to absolute. o The fifth and sixth columns display the result of changing the global atmospheric pressure form 13.0 psia to 14.0 psia, for both absolute and gauge units. Although it would be highly unusual for a single series to contain a mixture of reading types, FlowTest always preserves the data as entered, and provides an obvious visual indication. At the very least it is an indicator that something unusual has happened. Copyright ©2015 Petro Class Inc. www.petroclass.com Spell Checker The spell checker module is a separate installer package called ‘PetroWordSetup’ and is available on the FlowTest download page. In order to get the spell check functionality described below, this package must be installed in addition to the FlowTest upgrade. (The order of the install is not important i.e. you can install the FlowTest upgrade first, then run PetroWordSetup or vice versa. just restart FlowTest after both packages have been installed. Spell checker additions: Comment with spelling error. To correct the error: • Double click the comment (to enter the edit mode) • Right click the word in error Copyright ©2015 Petro Class Inc. www.petroclass.com • From the context menu select one of the suggested replacement words or ‘Add to Dictionary’. • Spelling errors are displayed throughout the table but can only be corrected when the individual comment is in edit mode (double click comment to enter edit mode). The red squiggly lines under error words will not print on the reports. • The spell checker can be turned on or off via. the ‘Spell Check’ toolbar button. The spell checker contains a custom petroleum terms dictionary along with Alberta formation names and places. If you find any words that you think should be in the base dictionary, please send them to me and I will add them to future revisions. Copyright ©2015 Petro Class Inc. www.petroclass.com APPENDIX A: Custom Excel Exports There is often a requirement to export data in predefined fixed format in order to either be imported into a database or for use by other applications. FlowTest can generate custom tailored Excel data files through the use of user defined Excel templates. Custom Excel templates offer several advantages over the standard Excel, or CSV, export modes including: • • • • The ability to format data (headers, columns …) as a fixed format irrespective of any table layouts within the FlowTest data file. The ability to specify unit types and precision within the template regardless of the configuration within the FlowTest data file (at the time of the export). Include value-added calculations within Excel. Automatically create charts and graphs from the exported data. Excel export templates for the examples below can be found in the ‘Examples’ folder of in the Excel export dialog box. Copyright ©2015 Petro Class Inc. www.petroclass.com Example 1 Oil company ABC requires test data in a fixed format (as either an Excel or CSV file) in order to be imported into a company database. The format required is as follows: Name of Well UWI of Well Well Name: UWI: Data Table: Date DD/MM/YY Data Data… Time HH:MM Data Data… Comment Tubing psia Data Data Data… Data… Casing psia Data Data… Gas Mcf Data Data… Oil bbl Data Data… Water bbl Data Data… The item names in black specify the fixed format required with the blue items being actual data. Step 1 Create a new Excel work book and enter in the fixed format items. Copyright ©2015 Petro Class Inc. www.petroclass.com Step 2 Define the data items. Template data items are defined using Excel ‘Named Ranges’ as shown below. The named ranges (or named cells) allow FlowTest to link the cells to actual test data. The actual name can be any valid Excel name. Excel names indicated in blue. The names in blue on the Excel work sheet are for illustration only; the important thing here is that each cell name is set via the Excel name box. Copyright ©2015 Petro Class Inc. www.petroclass.com Step 3 Name and format the table data. Select the entire data row (from DATE to WTR_V) and assign the name TABLE_1 via the Excel name box. Set the Date, Time and data column format as required. Copyright ©2015 Petro Class Inc. www.petroclass.com At this point we have defined the basic structure for the data template. Now we need to link the Excel names to FlowTest this is done by creating a special sheet in Excel called ‘FlowTest Manifest’. Step 4 Create the Manifest Insert a new sheet into the Excel workbook and re-name it to FlowTest Manifest Step 5 Define the manifest The manifest is structured sections with each section containing items and values in a column format where: • Column A Section tag / Item name • Column B Item value The manifest begins with a <BEGIN_MANIFEST section tag and ends with an END_MANIFEST> tag anything outside these tags are ignored by the FlowTest manifest processor. Additionally any row within the manifest tags that begins with // is ignored and can be used to add comments to the manifest. Within the <BEGIN_MANIFEST and END_MANIFEST> there are two mandatory sections <MANIFEST and <GLOBAL additionally we will be defining additional sections: <MONIKER, <DATA_TABLE and <SERIES in implementing the manifest for our Excel template. For a full description of the manifest directives see Manifest Reference below. Copyright ©2015 Petro Class Inc. www.petroclass.com Start the manifest by adding the required sections as shown below. The export format is in imperial units so we will use IMPERIAL and STD for the manifest global section items. Copyright ©2015 Petro Class Inc. www.petroclass.com Step 6 Add manifest entries for the well name and UWI items. The well name and UWI items will be described in the manifest as <MONIKER sections these sections will relate the Excel names (as specified in step 2 above), for the respective items, to the appropriate FlowTest smart tags as follows: Item Well Name UWI Excel Named Range WELL_NAME UWI FlowTest smart tag <WELL_NAME> <WELL_DOWNHOLE_LOC> For a complete list of available moniker tags see: Smart Tag Reference of Appendix B. Copyright ©2015 Petro Class Inc. www.petroclass.com Step 7 Test the excel template At this point we have a valid manifest that will actually do something, so we can test it by saving the excel file as a .xltx (Excel Template). • In Excel, select ‘Save As’ • Set ‘Save As Type:’ to ‘Excel Template (*.xlxt)’ • Set ‘File Name:’ to ‘Example1.xltx’ • Save Open a blank FlowTest File • In the ‘Test Information’ o Set Well Name to ‘My Well’ o Set UWI Bottom Location to “My Well Location’ • Select “Excel Export” from the File menu • In the Export window, select our Example1.xltx as the export template FlowTest generates a new excel file based on the Example1.xlxt template with the manifest sheet removed and the items ‘My Well’ and ‘My Well Location’ populated in the appropriate locations. Copyright ©2015 Petro Class Inc. www.petroclass.com Step 8 Add the data table items to the manifest. For the manifest data table we need to define and map the following: • Map FlowTest series to Excel column names • Define which Excel column names make up the table In steps 2 and 3we assigned excel names for the data columns and also gave the entire table row a name. In the manifest the data columns are defined using the <SERIES section(s) and the table is defined using a single <DATA_TABLE section. Series within FlowTest are identified using the series tag name. Within FlowTest, the series tag name can be viewed or modified in the series property window as shown below: Series tag names in FlowTest Copyright ©2015 Petro Class Inc. www.petroclass.com Note: Series in the Time, Well and Data Summary groups are assigned default tag names, generic series and series in other meters are blank by default and must be assigned before they can be used in Excel templates. Copyright ©2015 Petro Class Inc. www.petroclass.com Manifest Series Definitions: <SERIES Name Tag SERIES> <SERIES Name Tag SERIES> <SERIES Name Tag SERIES> <SERIES Name Tag Unit SERIES> <SERIES Name Tag Unit SERIES> <SERIES Name Tag Unit SERIES> <SERIES Name Tag Unit SERIES> <SERIES Name Tag Unit SERIES> DATE DATETIME TIME DATETIME CMT EVENT TUBE_P TUBINGP PSIA CASE_P CASINGP PSIA GAS_V GAS_ALL MCF OIL_V OIL_ALL BBL WTR_V WTR_ALL BBL Copyright ©2015 Petro Class Inc. www.petroclass.com In addition to the manifest <SERIES definitions we need to define the <DATA_TABLE as follows: <DATA_TABLE Name TABLE_1 DATA_TABLE> Copyright ©2015 Petro Class Inc. www.petroclass.com <BEGIN_MANIFEST <MANIFEST Type Version MANIFEST> <GLOBAL UnitBase PTBase GLOBAL> <MONIKER Name Tag MONIKER> <MONIKER Name Tag MONIKER> <SERIES Name Tag SERIES> <SERIES Name Tag SERIES> <SERIES Name Tag SERIES> <SERIES Name Tag Unit SERIES> <SERIES Name Tag Unit SERIES> <SERIES Name Tag Unit SERIES> <SERIES Name Tag Unit SERIES> <SERIES Name Tag Unit SERIES> <DATA_TABLE Name DATA_TABLE> END_MANIFEST> Entire manifest for Example 1 Copyright ©2015 Petro Class Inc. www.petroclass.com PetroClass FlowTest 1.0 IMPERIAL STD WELL_NAME <WELL_NAME> UWI <WELL_DOWNHOLE_LOC> DATE DATETIME TIME DATETIME CMT EVENT TUBE_P TUBINGP PSIA CASE_P CASINGP PSIA GAS_V GAS_ALL MCF OIL_V OIL_ALL BBL WTR_V WTR_ALL BBL TABLE_1 Step 9 Test the completed template. This completes the Excel template of Example 1. The template can be tested by loading a data file in FlowTest and exporting using the Example 1 template (as done in step 7 above). Excel export of ‘Example FlowTest.flowtest’ using ‘Example1.xltx’ template. Some noteworthy points on the generated export: • The Oil and Water columns are absent due to the fact that there are no liquids produced in the FlowTest example file. • Data units are as defined in the manifest, irrespective of the units selected in the data file, or order (if at all) in which they appear in any data table(s). • Because the data table names are specified as part of the template definition, renaming series in the FlowTest data file does not affect the template output. • When the data table rows are expanded all cell formatting is expanded as well (i.e. all the data is formatted in blue) this behavior includes advanced Excel formatting functions such as conditional formatting. • Additional calculated columns may also be included in the data table by simply ensuring they are contained within the table named range (TABLE_1 in this case). • When you examine the generated export, you will notice that the Excel names defined in the template remain in the exported file of particular interest are the data table names which now span the entire data column. This powerful feature, of the exports, allows you to include charts and graphs as part of the template by using the column names to represent the data series. • A CSV file, of the export, is easily created by simply doing a save-as ‘CSV’ within Excel. Copyright ©2015 Petro Class Inc. www.petroclass.com Advanced Exporting Features In Example 1 above, the data table column name and units were specified as part of the template; optionally, these items can be obtained as part of the manifest export operation. The manifest <SERIES section ‘Name’ property specifies the Excel named range of the column data additionally the manifest will resolve two additional names in the form: Name_UNIT and Name_LABEL with the series units and name respectively. As an example, given the manifest definition of Tubing pressure for example 1: <SERIES Name Tag Unit SERIES> TUBE_P TUBINGP PSIA The Excel data name is: TUBE_P The series unit name is: TUBE_P_UNIT The series label name is: TUBE_P_LABEL The Excel template can be modified replacing the ‘Tubing’ and ‘psia’ table header cells with the names TUBE_P_UNIT and TUBE_P_LABEL respectively (as a result, the column name will then change to reflect the series name in the FlowTest data file). Effectively there are two implied (read-only) properties for the <SERIES section given as: <SERIES Name UnitName LabelName Tag Unit SERIES> TUBE_P TUBE_P_UNIT TUBE_P_LABEL TUBINGP PSIA The main advantage of doing this is that it moves more of the definitions to the manifest. Copyright ©2015 Petro Class Inc. www.petroclass.com The manifest <MONIKER section has a similar functionality (to the <SERIES section described above) where if the FlowTest smart tag, specified in the moniker section, has associated units, then an implied (read-only) UnitName property for the <MONIKER section is given in the form: Name_UNIT. A manifest moniker for Tubing ID <MONIKER Name TUBE_SZ Tag <WELL_TUBING_SZ> Unit MM MONIKER> <MONIKER Name UnitName Tag Unit MONIKER> TUBE_SZ TUBE_SZ_UNIT <WELL_TUBING_SZ> MM (Implied Unit name) Template Definition Cell B1 Name = TUBE_SZ Cell C1 Name = TUBE_SZ_UNIT Export Export result for a 4” tubing ID (in metric units) Copyright ©2015 Petro Class Inc. www.petroclass.com Moniker value and units can also be combines into a single cell by specifying a custom cell format. In the TUBE_SZ (cell B1) a custom format can be contain the text <UNIT> where the manifest will replace <UNIT> with the unit text. Template Definition Cell B1 Name = TUBE_SZ Set custom formatting for the TUBE_SZ cell. Copyright ©2015 Petro Class Inc. www.petroclass.com 0.0” <UNIT>” specified as the custom format will yield the value formatted to 1 decimal point followed by the units. Export Export result for a 4” tubing ID (in metric units) Copyright ©2015 Petro Class Inc. www.petroclass.com The Example 1 template is relatively simple, when templates become more advanced one quickly finds many manifest series definitions contain a common set of properties. The <SERIES_DEF section can be used to abstract common properties into a single definition. Given the manifest Tubing and Casing definitions of Example1, we can refractor the manifest using a common <SERIES_DEF section as shown below. Original Example1 Definition <SERIES Name Tag Unit SERIES> <SERIES Name Tag Unit SERIES> TUBE_P TUBINGP PSIA CASE_P CASINGP PSIA Refactored Definition <SERIES_DEF Name Pressure Unit PSIA SERIES_DEF> <SERIES Name Tag Inherit SERIES> <SERIES Name Tag Inherit SERIES> TUBE_P TUBINGP Pressure CASE_P CASINGP Pressure Copyright ©2015 Petro Class Inc. www.petroclass.com Manifest Reference Column A Section / Item Column B Value Description <BEGIN_MANIFEST Required beginning section tag <MANIFEST Type Version Remove Required section Required: must be PetroClass FlowTest Required: must be 1.0 Optional: TRUE/FALSE removes the manifest sheet in the final output Default = TRUE MANIFEST> <GLOBAL UnitBase PTBase GLOBAL> <MONIKER Name Tag Unit MONIKER> Copyright ©2015 Petro Class Inc. www.petroclass.com Required section Required: default units can be either METRIC or IMPERIAL Required: pressure/temperature base for rates and cums can be either STD or PAS STD = 14.73 psia, 60 °F PAS = 101.325 kPaa, 15 °C Required: Excel named range Required: FlowTest smart tag Form: <TAG> no additional tag formatting supported Optional: Units for the smart tag Can be any valid unit tag <DATA_TABLE Name ShowInterpValues ExcludeCommentRows SeparateDataComments BreakMultiLineComments MergeCommentRows DATA_TABLE> <SERIES_DEF Name Inherit Unit SERIES_DEF> <SERIES Name Inherit Tag Unit Required SERIES> END_MANIFEST> Copyright ©2015 Petro Class Inc. www.petroclass.com Required: Excel named range Optional: TRUE/FALSE Display interpolated values in the data table Default = FALSE Optional: TRUE/FALSE Remove comment data rows Default = FALSE Optional: TRUE/FALSE Separates data/comment rows Default = TRUE Optional: TRUE/FALSE Multi-line comments are separated to individual rows Default = TRUE Optional: TRUE/FALSE Default = FALSE Required: Name for the series def Optional: name of <SERIES_DEF to inherit Optional: any valid FlowTest unit tag Required: Excel named range Optional: name of <SERIES or <SERIES_DEF to inherit Required: FlowTest series tag name Required/Inheritable: Valid unit tag for the series Optional: TRUE/FALSE Issues an error if the series does not exist in the data file Default = TRUE Required ending section tag Unit Tag Reference Type Tag Unit Pressure (Differential) KPA PSI MPA HW KPAA PSIA MPAA KPAG PSIG MPAG DEGC DEGF DEGR DEGK FRACTION PERCENT PPM UNIT E3M3 MMCF MCF M3 CF M3 BBL CF GAL L E3M3/D MMCF/D MCF/D M3/D CF/D M3/HR CF/HR M3/MIN CF/MIN kPa Psi MPa inH2O kPaa Psia MPaa kPag Psig MPag °C °F R K Fraction % ppm Unit 10³m³ MMcf Mcf m³ f³ m³ bbl f³ Gal(US) L 10³m³/d MMcf/d Mcf/d m³/d f³/d m³/hr f³/hr m³/min f³/min Pressure (Absolute) Pressure (Gauge) Temperature Fraction Volume (Gas) Volume (Liquid) Volumetric Flow Rate (Gas) Copyright ©2015 Petro Class Inc. www.petroclass.com Volumetric Flow Rate (Liquid) Length Ratio (Gas/Liquid) Ratio (Liquid/Gas) Ratio (Liquid/Liquid) Copyright ©2015 Petro Class Inc. www.petroclass.com M3/D BBL/D CF/D M3/HR BBL/HR L/M GPM M FT MM IN 64 SCF/SCF SCF/STB M3/M3 E3M3/M3 MMCF/STB MCF/STB SCF/SCF STB/SCF M3/M3 M3/E3M3 STB/MMCF STB/MCF SCF/SCF M3/M3 STB/STB m³/d Bbl/d f³/d m³/hr Bbl/hr L/min gal/min m ft. mm in. 1/64 scf/scf scf/stb m³/ m³ 10³m³/m³ MMcf/stb Mcf/stb scf/scf stb/scf m³/ m³ m³/ 10³m³ stb/MMcf stb/Mcf scf/scf m³/ m³ stb/stb APPENDIX B: Smart Tag Reference Category Smart Tag Description Well <WELL_NAME> <WELL_SURFACE_LOC> <WELL_DOWNHOLE_LOC> <WELL_LIC> <WELL_FORMATION> <WELL_FIELD> <WELL_TYPE> <WELL_GND_ELV> <WELL_KB_ELV> <WELL_KB_GND_OFFSET> <WELL_DRILL_LEG> <WELL_FLOW_PATH> <WELL_FLUID_TYPE> <WELL_TUBING_SZ> <WELL_TUBING_WT> <WELL_CASING_SZ> <WELL_CASING_WT> <TEST_TYPE> <TEST_JOB> <TEST_AFE> <TEST_UNIT> <TEST_TIME_START> <TEST_TIME_END> <OPERATOR> <OPERATOR_CONTACT> <OPERATOR_STREET> <OPERATOR_CITY> <OPERATOR_PROV> <OPERATOR_POSTCODE> <OPERATOR_COUNTRY> <OPERATOR_WEB> <OPERATOR_TEL> <OPERATOR_MOBILE> <OPERATOR_FAX> <OPERATOR_EMAIL> Well Name Surface UWI Down hole UWI License Formation Field Type Ground Elevation Kelly Bushing Elevation Kelly Bushing, Ground Offset Drill Leg Flowing Path Fluid Type Tubing Size Tubing Weight Casing Size Casing Weight Test Type Job Number AFE Number Test Unit Test Start Time Test End Time Well Operator Contact Street Address City Province/State Postal/Zip Code Country Web Address Telephone Number Telephone Number Telephone Number Email Address Test Data Contact (Operator) Copyright ©2015 Petro Class Inc. www.petroclass.com Contact (Service) Contact (Report) <SERCO> <SERCO_CONTACT> <SERCO_SUPERVISOR_CONTACT> <SERCO_FIELD_CONTACT> <SERCO_STREET> <SERCO_CITY> <SERCO_PROV> <SERCO_POSTCODE> <SERCO_COUNTRY> <SERCO_WEB> <SERCO_TEL> <SERCO_MOBILE> <SERCO_FAX> <SERCO_EMAIL> <SERCO_SUPERVISOR_TEL> <SERCO_SUPERVISOR_MOBILE> <SERCO_SUPERVISOR_FAX> <SERCO_SUPERVISOR_EMAIL> <SERCO_FIELD_TEL> <SERCO_FIELD_MOBILE> <SERCO_FIELD_FAX> <SERCO_FIELD_EMAIL> <REPORTCO> <REPORTCO_CONTACT> <REPORTCO_STREET> <REPORTCO_CITY> <REPORTCO_PROV> <REPORTCO_POSTCODE> <REPORTCO_COUNTRY> <REPORTCO_WEB> <REPORTCO_TEL> <REPORTCO_MOBILE> <REPORTCO_FAX> <REPORTCO_EMAIL> Copyright ©2015 Petro Class Inc. www.petroclass.com Service Company Contact Supervisor Contact Field Contact Street Address City Province/State Postal/Zip Code Country Web Address Telephone Number Telephone Number Telephone Number Email Address Telephone Number Telephone Number Telephone Number Email Address Telephone Number Telephone Number Telephone Number Email Address Reporting Company Contact Street Address City Province/State Postal/Zip Code Country Web Address Telephone Number Telephone Number Telephone Number Email Address APPENDIX C: Generic Series Expression Reference Binary operators Operator + * / ^ () Description addition subtraction multiplication division raise to power parenthesis (operation precedence) Built-in functions Name sin(x) cos(x) tan(x) asin(x) acos(x) atan(x) log2(x) log10(x) log(x) ln(x) exp(x) sqrt(x) rint(x) abs(x) min(…) max(…) sum(…) avg(…) Arguments 1 1 1 1 1 1 1 1 1 1 1 1 1 1 variable variable variable variable Copyright ©2015 Petro Class Inc. www.petroclass.com Priority 1 1 2 2 3 -1 Description sine (argument x in radians) cosine (argument x in radians) tangent (argument x in radians) arcsine arccosine arctangent logarithm (base 2) logarithm (base 10) logarithm (base 10) logarithm (base e) e raised to power x square root round to nearest integer absolute value minimum of arguments maximum of arguments sum of arguments average of arguments APPENDIX D: FlowTest Block Diagram Copyright ©2015 Petro Class Inc. www.petroclass.com


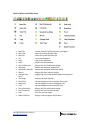

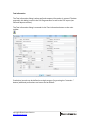

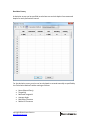
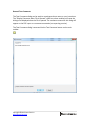
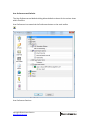

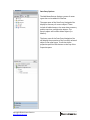
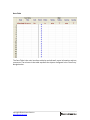
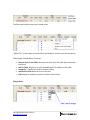

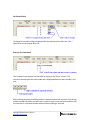
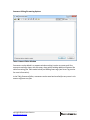

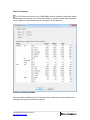
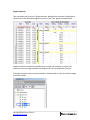
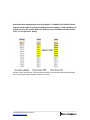
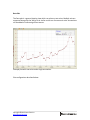
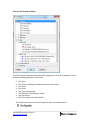
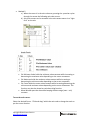


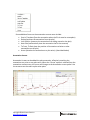
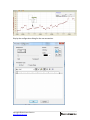
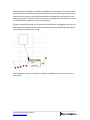

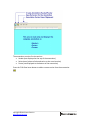

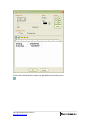
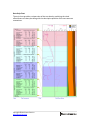

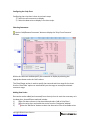
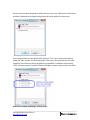


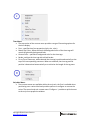
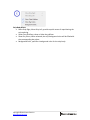
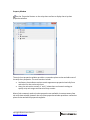
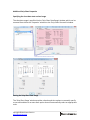
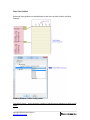
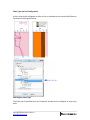
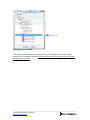
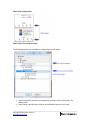
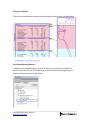
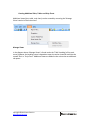
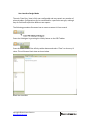


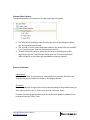
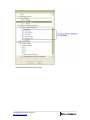

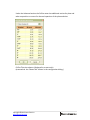

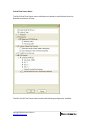

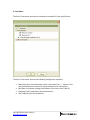
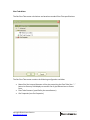


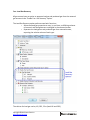
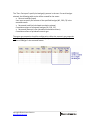
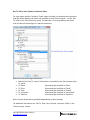
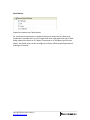
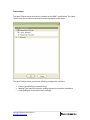
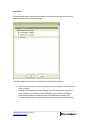
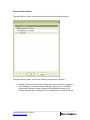
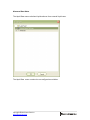

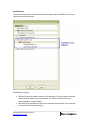
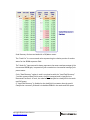
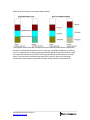
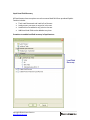
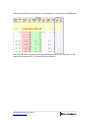
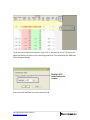


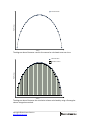
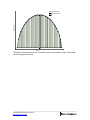

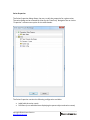

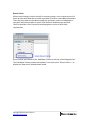
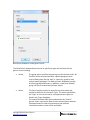
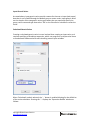
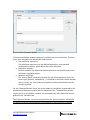
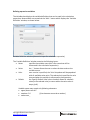
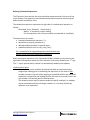

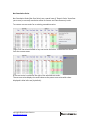
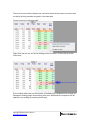
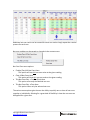
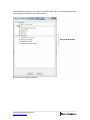
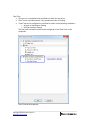

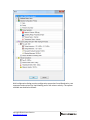
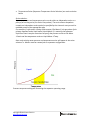
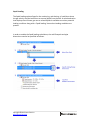
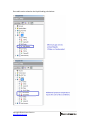


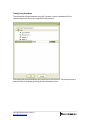
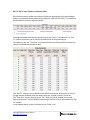
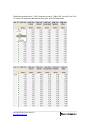
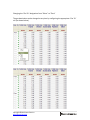
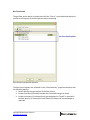
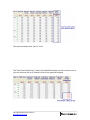
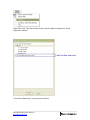


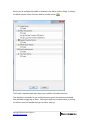
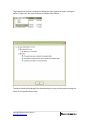
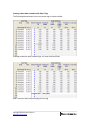
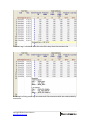
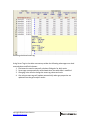
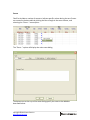
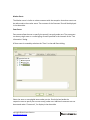
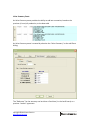

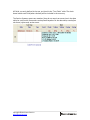

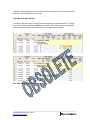


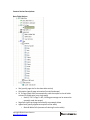

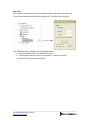
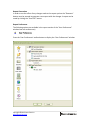


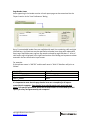

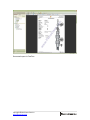


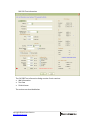
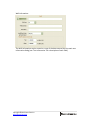
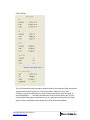

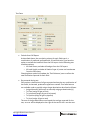
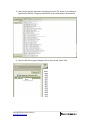
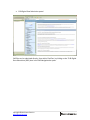

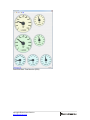
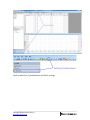
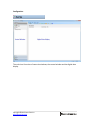
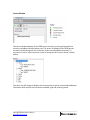
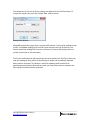
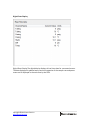
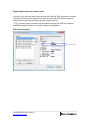
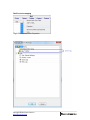
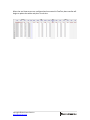
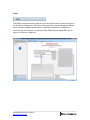
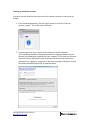

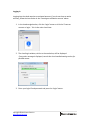
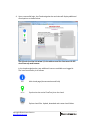
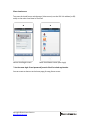

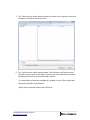
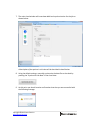

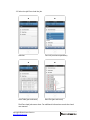

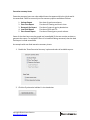
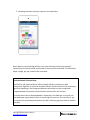
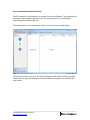

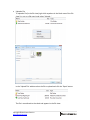
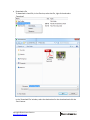
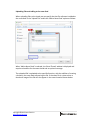

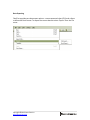
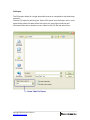
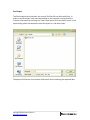
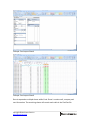

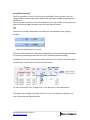


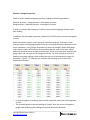
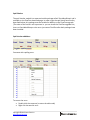
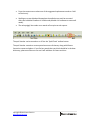


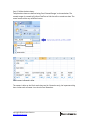
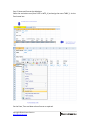
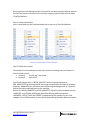
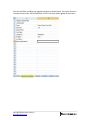

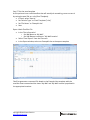
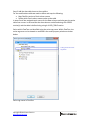


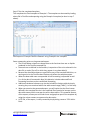

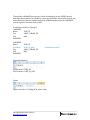
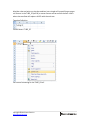
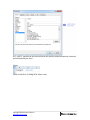
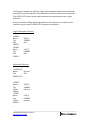
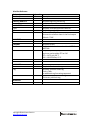
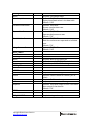


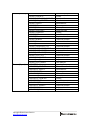

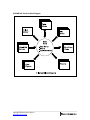


![IL 2.003.01 [Delta MK2]e-pag1.ai](http://vs1.manualzilla.com/store/data/005753338_1-488e124ad81f3853ba4b74f093f13849-150x150.png)