1
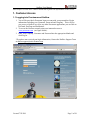
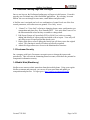
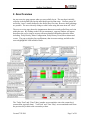
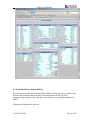
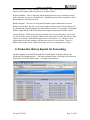
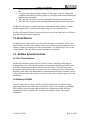
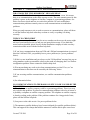
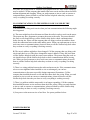
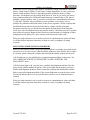
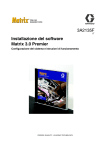
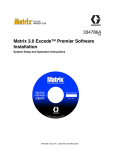
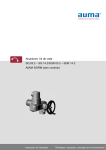
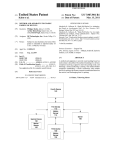
NETFLOW USER MANUAL
Version 6
Updated July 2011
________ _Netflow User Manual
______
TABLE OF CONTENTS
1. Customer Access
1.1 Logging into Netflow
1.2 Login Privileges
1.3 Netflow Security
1.4 Mobile Web (Blackberry)
2. Area Overview
2.1 Admin Menu Functions
3 Alarms
4 Meter configuration and Production History
4.1 Meter configuration
4.2 Production History Display/Editing
4.3 Liquid Meter History
5 Reports Menu
6 Production History Exports for Accounting
6.1 Date-Range Exports
6.2 Validated Exports
6.3 Automatic-Scheduled Exports
7 Trend, Meter Configuration and Setpoint
7.1 Line Graph Trend
7.2 Plunger Lift
7.3 Setpoint Control
8 Printing
9 Communication Status Display
10 Alarm and Event History
11 Compressors
12 Voice Callouts
13 Email Alarms
14 Netflow Special Features
14.1 ProTrend Interface
14.2 Walk up SCADA
Appendix A – Communication Troubleshooting Hints
Created 7/22/2011
Page 2 of 26
________ _Netflow User Manual ______
Most Netflow screens have a HELP button that explains the information on the screen.
1. Customer Access
1.1 Logging into Prostream and Netflow
1. You will be provided a Prostream logon account with your personalized Login
information including your Username, Password and Company. This will give
you access to Netflow as well as any other Prostream applications you use such as
ProTrend, ProChart and ProMonitor.
2. To access the Netflow network point your internet browser to
www.prostream.com (see figure below).
3. Enter your Company, Username and Password into the appropriate blanks and
click Log In.
*If you have not received your login information, Contact the Netflow Support Team
at [email protected]
Created 7/22/2011
Page 3 of 26
________ _Netflow User Manual
______
1.2 Prostream Landing Page and Privileges
Once a user logs on, the ProStream landing page will appear in his browser. From this
page the user can launch any of this ProStream applications. By selecting “Account
Admin” the user can change his user name, email address and passwords.
A Netflow user is assigned one level or a combination of control levels out of the four
control parameters, most often users are granted „View Only‟ access.
1. “Control” or “View Only” referring to changing alarms, meter configuration, gas
composition and plate sizes, flow controlled ECT. View only allows users to see
the aforementioned values but they are unable to change them.
2. Edit Export Groups or Export Only (PVR or Field View) refers to creating,
adding and deleting of export groups and which wells to export. View only will
only allow users to export groups that already exist.
3. History Edit allows users to change the history but will always store the original
values. This function is usually off unless specifically requested.
4. Admin Privileges allows user access to the administrative functions.
1.3 Prostream Security
On a company-wide basis, Prostream can require users to change their passwords
periodically. This will assist in eliminating shared accounts, which have the potential to
compromise information security.
1.4 Mobile Web (Blackberry)
Netflow users can access their meter data from their mobile phone. Using your regular
Netflow username and password, you can see all your meter data and update gas
composition and plate size. To logon go to https://netflow.net/phonelogin.php.
Created 7/22/2011
Page 4 of 26
________ _Netflow User Manual
______
2. Area Overview
An area overview page appears when you successfully log in. The area that is initially
called up is the default based on the individual logon account setup. Netflow groups all
wells into “Areas” usually defined by the facility they flow into, however other groupings
are possible. The user can easily change to other Areas using the menu item call “Area”.
The area overview page shows the instantaneous data most recently polled from each site
within the area. By clicking on the LSD (or metername), a pop-up window will appear
that allows the user to jump to screens with more detailed information about the meter
including: Daily History, Meter Configuration, Daily History Trend, Meter alarms and
events. The pop-up also has force poll buttons, shut-in reason settings, and allows the
user to highlight the LSD in Bold or Italic.
The „Today Total‟ and „Time Today‟ number are accumulative since the current day‟s
contract hour (typically 8am). „Yest Total‟ and „Time Yday‟ are accumulated totals from
the previous day at 8am to the current day at 8am.
Created 7/22/2011
Page 5 of 26
________ _Netflow User Manual
______
Each column is labeled and includes the unit of measure for each point. Columns can be
sorted by clicking on the column heading. Clicking again gives an inverted sort. Holding
the shift key and clicking a second column will make that column the secondary sort
column. This feature is also available on the Communication summary and All Meter
Report).
When the Overview screen is called up, a notification of any Measurement Problems will
scroll down into the Netflow banner at the top of the window. This notification will
show a count of the number of Measurement Problems in the selected Area and also a
count of the number of Measurement Problems in all the Areas the user has access to.
By clicking on the notification, a window showing a full list of Measurement Problems
will appear. For each detected problem, a recommended action on how to fix the
problem will also be shown. Netflow continuously checks every meter for 80 different
types of measurement problems and shows them to the user with this feature.
Other Information table at the bottom of the main area overview shows additional
information about each meter such as battery voltage, casing and tubing pressure,
ambient temperature, etc. This information may optionally be available through an
“Other Info” menu item (Used for larger area‟s).
The “Meter Search” link on the main menu allows the user to find meters in other areas
within his view.
“Support” link on the main menu will provide contact information for the Netflow
support team.
2.1 Admin Menu Functions
The Admin Menu is available to all users however, unless you have Full access you will
only be able to access: Export Groups, Switch to Imperial / Metric Units and Change
Password.
o Change Gas Meter Order – Brings up a separate screen that allows the
administrator to change the order in which the Gas Meters are seen on the
Overview screen. This change will affect all users in the company that view this
area.
o Change Liquid Meter Order – Brings up a separate screen that allows the
administrator to change the order in which the Liquid Meters are seen on the
Overview screen. This change will affect all users in the company that view this
area.
o Field Plant Balance – Allows users to monitor and track fuel metered in the field
and compare it to the fuel metered at the plant (See Section 7)
o Bold Meter Names – Brings up a separate screen that allows the administrator to
choose which or your LSD‟s you would like to see bolded on the Overview screen
for quick visual reference. This change will affect all users in the company and
any partner companies that view this area.
Created 7/22/2011
Page 6 of 26
________ _Netflow User Manual ______
o Export Groups – Allows users execute exports and, if authorized, can also
change the definition of the export groups (See Section 5.1)
o All Meters Report – Lists all of the user‟s meters providing a snap shot of
communication statistics and last poll status.
o Switch to Imperial Units – Allows individual users to choose if they want to see
their data in Imperial or Metric units.
o Problem Reports and Measruement Problems Report – These reports will list
all of the user‟s meters that have long term problems related to Gas Composition,
Differential Pressure, Plate Size, Communications, Low Volumes or Low Time
on Production. The reports will also recommend what action should be taken to
correct the problem. There is a help button that describes the reports in more
detail.
o Area Meter Configuration – This report shows all the configuration parameters
for all meters in the area in a convenient and sortable format.
o Area Gas Compositions – Provides a snapshot of the Gas Composition of all
Well‟s in that area.
o Export All Gas compositions – This function will create and excel file listing the
gas compositions for all meters in the area.
3. Alarms
If the data (flow rate, static, diff or temp) on the overview screen appears in red or
orange it indicates that the data polled is not within the specified acceptable high / low
limits. These limits are user defined (based on logon privileges). To alter the alarm
limits:
1. Click on the value (whether it is red, orange or green)
2. Change desired ranges
3. Click on “Submit”
To disable the desired Alarm ensure the “Enable Alarm” Check box is unchecked.
There are four levels of alarm that can be individually set: Critical High, High, Low, and
Critical Low. When the real time value crosses an enabled threshold value, an alarm is
generated which will change the colour on the overview screen, log an alarm in the alarm
log, and trigger any callouts and alerts the user has set for that alarm. Green is normal,
orange is High or Low and red is Critical High or Critical Low.
The user can also specify an alarm delay in minutes. If this is set, then the real-time
value has to stay above (or below for low alarms) the threshold for a period of time
before the alarm is generated. For example, this could be useful for plunger wells that
are continuously turning on and off. If the user would like an alarm only if the well does
not flow for 4 hours, he could enable a low flow alarm and set a 4 hour alarm delay.
Created 7/22/2011
Page 7 of 26
________ _Netflow User Manual
Figure below shows the alarm pop-up window.
______
4. Meter Configuration and Production History
4.1 Meter Configuration
Created 7/22/2011
Page 8 of 26
________ _Netflow User Manual ______
The Meter Configuration Icon will bring you to the Configuration and Composition
Information screen providing all the details about the meter including:
a. Gas Composition list (modifiable based on login)
b. Dates and Times of various events related to the Meter
c. Meter Configuration Data (modifiable based on login)
d. Gas Meter Configuration
e. Instantaneous Values
f. Yesterdays Averages
g. Date Gas comp and Orifice size last Changed through Netflow
h. Vcone meters will show Cone OD (outside diameter) and Beta Ratio.
i. User changeable lab ID and gas composition date field (only available if
user has „control‟ privileges)
j. Alarm and Event report available for selected meter.
*Gas Composition Writes: When there is a change to the Gas Comp, Netflow will
acknowledge a success or failure. If there is a communication failure, Netflow will
continue trying to write the new gas composition every hour for up to 24 hours.
Should the write still fails, Netflow will send an email to the user indicating that the
write change was not successful. Also if you have Protrend, gas compositions will be
written automatically to the meter once the new sample has been validated by
ProTrend.
The Meter Configuration menu contains buttons that will show all alarms or events
for the selected meter.
There is also a button to create an export (in excel format) on the Meter Configuration
page.
The Date Last Changed through Netflow menu provides an indication of if and when
any changes were made to the Gas Composition or the Plate.
For details on the changes made click on the “Event History” link on the toolbar in
the Meter Information Screen.
Created 7/22/2011
Page 9 of 26
________ _Netflow User Manual
______
4.2 Production History Display/Editing
By selecting on an individual LSD hyperlink, Netflow will open up a new window or tab
and show the production history display for an individual well and will allow
appropriately privileged users to add notes to the history or even modify the historical
values.
When the LSD hyperlink is selected:
Created 7/22/2011
Page 10 of 26
________ _Netflow User Manual ______
1. The Production History Daily Report will open providing the data for the current
month for the selected meter.
2. To see older information, click on “Previous Month” or utilize the “Select
Month” dropdown menu to view a specific month and click “Retrieve
Information”
3. The MONTHLY REPORT link on the menu will provide a yearly summary
when clicked on. Once on this screen you are able to request historical yearly
data or choose the desired month for report details.
4. The TREND link on the menu will show long term trends of the production
history in graphical format. Navigating this long term trend is similar to
navigating on the instantaneous trends described in section 6.
Both the Daily and Monthly report screens provide an option for a print version and an
option to export the information to an Excel spreadsheet.
The user can add notes to a specific day‟s history to advise others of known outages and
status or changes to the well.
o To add a note to for the specified well, click on the Options Icon on the left of the
required date. Use the „Display on‟ dropdown to determine which screen your
note will be shown.
o The Note List link on the toolbar will provide a list of the months notes for the
specified well (previous months also available).
o If there are any notes recorded for the well / date they will appear under the „view
note‟ column. To view the specific note click on the memo icon.
If the user has History edit privileges, the Options pop-up will have an Edit link. This
function allows the user to make changes or add missing data to the day‟s volume, static
and differential pressure, temperature, orifice plate size and time. The user must enter a
reason for the edit for ERCB Audit purposes. If a history record is missing, an Add
Record option is shows which allows users to add missing production history records (if
communications have failed, it is possible some production history may be missing and
will need to be estimated).
A sample History screen is shown below.
Created 7/22/2011
Page 11 of 26
________ _Netflow User Manual
______
4.3 Liquid Meter History and Alarms
Clicking on the LSD link for a Liquid Meter on the Overview page will bring you to the
production history for liquids for the selected well.
1. To edit a record, select the EDIT link. To add a missing record, select the ADD
RECORD button. Generally missing records are due to communication outages.
2. Production dates highlighted in orange indicate that a change has been made.
If configured, Netflow can calculate a liquid flow rate from the liquid accumulation
reported by the meter. This flow rate can be trended and alarms and callouts can be set
for it. For example, if the user would like a callout on low condy flow then this flowrate
could be setup to generate the callout.
5. Reports Menu
The Netflow Reports Menu has the following reports available to all users:
Event History – this audit trail report shows all events for all meters in the current area
for any selected month.
Created 7/22/2011
Page 12 of 26
________ _Netflow User Manual ______
Production History – Daily, Monthly or Annually – these reports show the Production
History for all meters in the current area in various formats.
Report Scheduler – this is a reporting function that allows the user to scheduler various
types of reports to occur on a regular basis. Scheduled reports will be emailed to a list of
email addresses entered by the user.
Balance Reports – The user can setup and run balance reports under this menu item.
Balance reports allow the user to select any number of meters whose daily volumes will
be summed and compared against any other number of meters. For example, a field/plant
balance might add up all the field meters and compare against an inlet meter volume.
Custom Reports - With custom reports and trends, the user can select any 8 values from
the meters he has access to and place them on the same report or trend. He can save these
reports as “Personal” which means only he has access to them, or as “Shared” which
means other users in his company with the same area view can see them. There is a
HELP button on the screen which instructs the user how to setup and view reports.
6. Production History Exports for Accounting
Netflow supports several different methods of exporting the Production History for
production accounting purposes. The main exporting screen is called up from either the
main menu or from the Admin menu. A sample is shown below:
Created 7/22/2011
Page 13 of 26
________ _Netflow User Manual
______
From here the user can execute exports and, if authorized, can also change the definition
of the export groups. An export group is a list of meters that will be exported together in
one CSV file. Usually it will contain all the meters in one area, however export groups
covering several areas or a subset of an area can be defined. From this screen the user
will be alerted to field issues and communication problems by highlighting the dates
where no data has been exported in the past 26 days. Netflow provides several different
formats for the export files and currently supports various formats like PVR, Merak,
Fieldview, etc… The most common file format is a comma separated file format
containing:
1. Meter name
2. Production Date (mm/dd/yyyy)
3. Yesterday's Time on Production (Hours)
4. Static Pressure (psi) – yesterday‟s average
5. Differential Pressure (IWC) – yesterday‟s average
6. Temperature (C) - yesterday‟s average
7. Orifice plate size (inches)
8. Casing Pressure (psi) – yesterday‟s average
9. Tubing Pressure (psi) – yesterday‟s average
10. Yesterday's volume (e3m3)
Netflow allows tthree different manners to export production history for accounting.
6.1 Date-Range Exports
The DateRange export allows the user to select a date range to be exported and allows the
user to open the export file or save it to his desktop. To perform DateRange exports
simply select the DateRange button and enter the selected date range.
6.2 Validated Exports
The Validated Export feature allows the user to export the .csv files as an attachment to
an email or to send the .csv files to an FTP Server. With validated export, each QTR
(Quantity Transaction Record) can only be exported once (should a record need to be
exported again use the Date Range Export tool):
1. Click on the EmailEx link for a specific export group.
2. Netflow will display all production records in previous 26 days that have not yet
been exported by email. (It is not possible to export any data older then 26 days
using Email export. For exporting older data, use the DateRange export.)
3. Each record has a confirm checkbox. Netflow will only export the records that
have been confirmed.
4. Netflow will automatically confirm records for which the volume is within 10%
of the previous 14 days average. Each production record can be exported once
and only once using the email export.
Created 7/22/2011
Page 14 of 26
________ _Netflow User Manual ______
5. This display will also show the dates for any missing production records. These
lines will be highlighted in red. This is caused by failed meter communication.
6. Users are able to manage the email distribution list and edit any of the production
values before exporting. To set up FTP exports, call the Netflow Support line to
request that it be set up for you.
7. The feature will also show a list of all meters exported by mail on the current day.
For security reasons, Netflow now only allow the user to view and export groups that are
in the areas available to their specific login ID.
6.3 Automatic-Scheduled Exports
Production exports by FTP or email can also be scheduled to automatically be exported at
a specific hour of each day. At the specified hour, all available production data that has
not already been exported will be sent by FTP or email. With this type of export, Netflow
does not validate the data; it sends whatever was reported by each meter. This is different
from the user requested exports which allows validation of the data and gives the user the
opportunity to edit the data before exporting. Please call for more information and to
have this feature set up for your company.
7. Trend, Meter Configuration and Setpoint
To the left of each LSD on the area overview screen you will see 2 Icons for most meters,
3 if it is a plunger lift site or has setpoint control. The first icon (figure 7a) will show
graphs giving trending information on the well. The second icon labeled “P” (figure 7b)
if configured, provides Plunger lift data. The third icon labeled “M” (figure 7c) provides
the Meter Configuration information. If your login is configured you will see another
icon which is used for Setpoint control (section 6.4)
Created 7/22/2011
Page 15 of 26
________ _Netflow User Manual
______
7.1 Line Graph Trend
The line graph icon (Figure 7a) will bring you to the “Meter Trend” Screen.
This graph will provide a graphical representation of your specified well. The chart
provides current and previous history on flow rate, static pressure, differential pressure
and temperature (all in different color sequences). Note that if you do not see the screen,
you will be provided a link to install Java. You will only be required to install Java one
time. Be advised that the first time a trend is opened after logon, Java will be launched
and will take some extra time. Subsequent trend call ups are faster.
1. The graph typically is set to show a 2 Day Span by default. To view the trend
over a longer or shorter period of time (from 8 hours to 1 month) click on the drop
down menu in the center of the toolbar.
2. To obtain exact number values for a specific day and time in the legend below the
graph click and drag the vertical black line showing on the chart to your desired
date and time or utilize the toolbar on the top of the screen choosing a specific
time and date (then click RETRIEVE) to obtain the desired readings.
Created 7/22/2011
Page 16 of 26
________ _Netflow User Manual ______
3. To change the start times of your trend forward or back ½ to ¼ of the trend
duration, click on buttons under the meter trend title (ie. <24 hours).
4. To obtain trend information in a table format with all numbers for the specified
time span click on the TABULAR button. Another window with your desired
numbers will appear.
5. Export CSV creates a CSV file of trend values.
6. Clicking on the Edit Button will bring you to the Trend Configuration page (based
on login privileges) where you can make changes to the set up of the Meter Trend
screen, changing options on this page will not affect the measurement of the wells
in the area.
a. Changing the options under “Trend Colors” will alter the aesthetic
appearance of the screen.
b. Changing the options under “Time” allows you to change the default trend
duration and the starting day of the trend.
c. Option under “Other” will allow you to change the number of gridlines on
the x-axis.
d. The edit buttons on the bottom table will allow you to alter the description,
the range for the high and low along the y-axis, the units label (not the
units themselves which is fixed), the pen color and the pen order for each
of the measurement points.
7. Help button on the Meter Trend Screen provides a picture map and explanations
of the functions throughout the screen.
Netflow allows custom screen layouts such as placing flow rate, tubing pressure and
casing pressure on the same trend. These can only be setup by the Netflow support line
at a minimal cost.
Created 7/22/2011
Page 17 of 26
________ _Netflow User Manual
______
7.2 Plunger Lift
Netflow supports Plunger Lift control systems. The “P” icon on the main screen (figure
7b) indicates the meter is an Plunger Lift type meter. When selected it shows the plunger
data and allows the user to select one of the two modes then enter in the configurable
parameters for that mode. The Plunger Lift system allows modifiable fields within the
Timer (Bypass, Off, PPST and Backup) and Status (Mode and Manual Start / Stop).
Created 7/22/2011
Page 18 of 26
________ _Netflow User Manual
______
The TREND button on the Plunger screen now provides Minute Trending for your
specified well. See Section 6.1 for details on how to make preferred changes to the
graphical data.
7.3 Setpoint Control
The user can manually or automatically control the flow from the well if the meter and
well is setup with flow control (Icon below will be found on the main screen under Meter
/ History for the specific area)
Created 7/22/2011
Page 19 of 26
________ _Netflow User Manual
______
WARNING: If the valve is manually controlled onsite, externally from the meter or from
Netflow, make sure the flow rate matches the flow setpoint before returning valve control
to the meter. Failing to do so may potentially damage equipment and cause extreme flow
rate fluctuations.
8. Printing
To print from various screens on the Netflow website, click on the Print Version link for
a printer friendly version of your screen. If the Print Version link is not available you
have two options
1. From any page on Netflow add “&print=print1” to the URL and the graphics from
the screen will be removed.
2. If background colors are desired in printout you can enable the “print background
colors” option in your browser.
a. Go to Tools – Internet Options – Advanced Tab – Printing – Check “print
background colors and images”
9. Communication Status Display
Netflow provides extensive communication status information access from the COMMS
link on the main menu. A sample display is below:
This display shows all meters in the area. The menu button for each device allows the
user to do a force poll or disable polling. It also allows the user to call up the
communication log and alarms for troubleshooting (showing all polls and responses and
Created 7/22/2011
Page 20 of 26
________ _Netflow User Manual ______
highlights failed polls) as well as any historical information on communication alarms
and when they cleared.
The display shows the time of last attempted connection to the modem, the time of last
successful connection to the modem, and the time of last successful poll to the meter. It
also shows the current status (OK or failed). A device is deemed failed if the 3
successive poll attempts (excluding retries) have failed. When this occurs, the status
shows FAILED in red and a hyperlink to communication troubleshooting hints will
appear. A copy of these troubleshooting hints can be found in appendix A of this user
guide.
The next three columns show the device type, device address and the poll frequency
which is the frequency that Netflow polls for instantaneous data. (Production data is
polled once a day after the contract hour.)
The last six columns show communication statistics for yesterday, month to date (MTD)
and previous month. Netflow first connects to the modem and if the connection is
successful it then polls the meter. Therefore separate % are shown for the modem
connections and the meter polls which will help determine if there is a modem/network
problem versus a meter or meter wiring problem. If the success rate is less than 75%, the
number is shown in red, otherwise it is green.
10. Alarm and Event History
The Alarm History Links and the Event History Links are located on the toolbar of the
Meter Information Screen. There are separate histories kept for Netflow alarms/events
versus Meter alarm/events.
Netflow alarms are process alarms generated by Netflow based on user defined limits.
Netflow events are Netflow user initiated events on the meter such as changing gas
compositions. Netflow alarm and event display is based on one month at a time. The
user can select older months using the buttons provided.
Meter events and meter alarms are the events and alarms read directly from the meter
itself. Meter events and alarms display default to a one month period, however the user
can select a yearly report as well. A properly configured meter will generate alarms for
ERCB compliance, including low/high differential pressure alarm, low power alarms and
range alarms.
The alarm History Toolbar also provides an option for a print version and an option to
export the information to an Excel spreadsheet.
11. Compressor
Created 7/22/2011
Page 21 of 26
________ _Netflow User Manual ______
The Compressor link (if configured) is found on the toolbar of the main Overview page.
It provides a quick view of various compressor points and plant alarms
Each of the above contains charted information (see details in Section 6.1 for information
on how to use and alter these charts).
Netflow compressor monitoring can also include graphic displays with start/stop buttons,
month-to-date runtime % and history, as well as compressor summary pages in situations
where there are many compressors in an area.
12. Voice Callouts
For users that take advantage of the Alarm Callout system, the alarm callout details for
the user are configured under the ALERTS link on the main menu. The Callout system
has the following capabilities:
1. Adding or editing names and phone numbers of individuals on call. You can also
set the number of call retires and number of message replays for each individual.
In addition, you can select the order in which the individuals are called. The
retries is the number of attempts the system will try the listed number before
moving onto the next user on the list to call. When a user is called, he must enter
the acknowledge code or Netflow will continue calling.
2. To configure the callout group options the user can select Edit Group and change
the retry delay, the number of rings and the acknowledge code. He can also select
Created 7/22/2011
Page 22 of 26
________ _Netflow User Manual ______
a time restriction for callouts that are only to be enabled for certain hours of the
day.
3. To select which alarms generate callouts for the group, select the Alarms link
ALARMS link and drag and drop alarms to or from the enabled and disabled lists.
and then save the changes.
4. The LOG link will show a log of all attempted calls and acknowledgements.
5. The LIST link will show a list of pending unacknowledged callouts in progress.
Netflow can also generate callouts based on communication failure alarms. Contact
Netflow support if you would like this feature setup for your critical devices.
Netflow will merge all alarms for one site that occur at the same time into one callout as
opposed to being called out separately.
13. Email Alarms
If configured, the Email Alarms (Located on the Overview screen under “Alerts” and
Email Alarms) act in the same manner as the Voice Callout system but instead of voice
callouts, it sends out an email as a form of notification. To configure this, click on the
“Email Alarms” link and add the contact information as required.
14. Netflow Special Features
14.1 ProTrend Interface
Netflow now interfaces with ProTrend, Critical Control‟s intelligent fluid analysis
management system. Fluid analyses can be electronically transferred to Netflow (and
most other measurement systems) with the push of a button. The ProTrend system
consolidates fluid analyses into one system; as well as schedules, tracks, validates and
distributes fluid analyses to measurement, operating and production accounting systems.
Using ProTrend ensures all analyses are accurate, current and validated prior to use and
distribution.
14.2 Walk up SCADA
Critical Control is now selling a Walk-up SCADA solution for cost effective chart
replacement and for sites where the cost of full SCADA is not warranted. A handheld
PDA reads the meter data and audit trail data from a Bluetooth enabled EFM and
immediately sends it to Netflow for viewing and reporting. Please call for more
information.
Created 7/22/2011
Page 23 of 26
________ _Netflow User Manual ______
APPENDIX A – COMMUNICATION TROUBLESHOOTING HINTS
WHAT DOES THE "FIELD PROBLEM" MESSAGE MEAN
If you see a "Field Problem" message on the communication status screen, this means
there is no communications to the radio or meter on site. The most common cause for this
problem is power or the telephone or Satellite Company is experiencing problems. See
below for what to check and how to resolve this problem. We can't troubleshoot
communication problems remotely since we need communications to troubleshoot
problems.
When you send someone to site to work on a meter or communications, please tell them
to call the Netflow help desk when they are done to verify everything is working
correctly.
THINGS TO CHECK FIRST
1) If this is a new installation and you do not see numbers on the screen, the meter might
not have been installed on site yet and you can ignore this message. If you think this
meter has been installed, please check with the installation company to make sure they
commissioned this meter with the Netflow help desk.
2) If you loose communications between 5 PM and 9 PM and communications is restored
between 8 AM and 1 PM, you probably have a power problem (see "power problems"
below).
3) If this is a new installation and you always see the "field problem" message but you are
seeing numbers on the screen and the values on the trend are changing, there is a Netflow
configuration problem. Please contact the Netflow help desk.
4) Was anyone doing any work at site when communications was lost? If so, see "no
communications to the meter can be caused by the following" below.
5) If you are using satellite communications, see satellite communication problems
below.
6) See information below.
NO COMMUNICATIONS TO THE RADIO ON SITE CAN BE CAUSED BY THE
FOLLOWING:
1) The telephone or satellite company could be experiencing problems. There is no easy
way to detect this problem. If you notice communication problems with a lot of meters it
is probably a telephone or satellite company problem. The telephone or satellite company
is already working on the problem. If the problem continues for a long period of time,
please call the Netflow help desk.
2) Lost power to the radio on site. See power problems below.
3) The antenna or satellite dish may have been misaligned (See satellite problems below).
This can happen if the clamps that hold the antenna or satellite dish in place came loose
Created 7/22/2011
Page 24 of 26
________ _Netflow User Manual ______
over time, due to high winds or vibration from equipment on site. More secure clamping
may be needed. Call the company that installed the meter on site and have them check the
antenna alignment and clamping. When you send someone to site to work on a meter or
communications, please tell them to call the Netflow help desk when they are done to
verify everything is working correctly.
NO COMMUNICATIONS TO THE METER CAN BE CAUSED BY THE
FOLLOWING:
1) If someone was doing work on site when you lost communications the following might
have happened:
A) The meter might have been disconnected from the radio in order to work on the meter.
The person may have forgotten to reconnect the meter to the radio. The person that did
the work on site should always call the Netflow help desk to check communications
before leaving site. Please call the company that was doing work on site and have them
check the connection between the radio and the meter. When you send someone to site to
work on a meter or communications, please tell them to call the Netflow help desk when
they are done to verify everything is working correctly.
B) The meter's address might have been changed. Call the company that was doing work
on site and check to see if they have changed the meter's address. If they did, have them
call the Netflow help desk with the correct meter address. The person doing the work on
site should always call the Netflow help desk to check communications before leaving
site. When you send someone to site to work on a meter or communications, please tell
them to call the Netflow help desk when they are done to verify everything is working
correctly.
2) There is a wiring problem between the radio and meter on site. If the communications
wires were not tightened when installed or wire was damaged, you can lose
communications to the meter especially during temperature fluctuations. Call the
company that installed the meter on site and have them check the wiring. When you send
someone to site to work on a meter or communications, please tell them to call the
Netflow help desk when they are done to verify everything is working correctly.
3) There is a problem with the meter and it is no longer responding. Call the company
that installed the meter on site and have them check the wiring. When you send someone
to site to work on a meter or communications, please tell them to call the Netflow help
desk when they are done to verify everything is working correctly.
4) Lost power to the meter on site or fuse blew. See power problems below.
POWER PROBLEMS
Created 7/22/2011
Page 25 of 26
________ _Netflow User Manual ______
If the meter you are using provides Netflow with battery voltage information, check the
battery voltage trend in Netflow. If the battery voltage drops below 10 volts, you have a
battery voltage problem. However, depending on how quickly the battery voltage
decreases, you might not see the voltage drop below 10 volts. If you notice you always
loose communications after 5 PM and communications is restored after 8 AM, there is
probably a power problem. Also, if you notice you only have communications between
11 AM and 1 PM only, there is probably a power problem. If you notice a power
problem, the problem could be the battery or the power regulator. Call the company that
installed the meter and have them check the battery voltage with the solar panel
disconnected (make sure you tell them to disconnect the solar panel when doing this
check since some installs don't know they need to do this). The battery or power regulator
may need to be replaced. Batteries don't last forever and constant over charging or under
charging decreases battery life. Also, extreme cold can decrease battery life.
When you send someone to site to work on a meter or communications, please tell them
to call the Netflow help desk when they are done to verify everything is working
correctly.
SATELLITE COMMUNICATION PROBLEMS
Make sure the satellite modem's power and system light are on and the power light on the
firewall is on. If you are not sure what the satellite modem or firewall looks like or where
it is located, please contact the company that installed the satellite modem and firewall.
1) If all lights are on, you probably have a communications problem to the meters. See
"NO COMMUNICATIONS TO THE METER CAN BE CAUSED BY THE
FOLLOWING" above.
2) If the System light is off, you may have a satellite dish alignment problem. Turn the
power on the satellite modem off and on, if the system light doesn't turn on you have a
satellite dish alignment problem. Please contact the company that installed the satellite
dish to correct the alignment problem. If the system light turns on, turn the power to the
firewall off and then back on. Force poll the meter on site to see if communications is
restored.
When you send someone to site to work on a meter or communications, please tell them
to call the Netflow help desk when they are done to verify everything is working
correctly.
Created 7/22/2011
Page 26 of 26