1
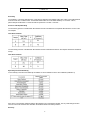
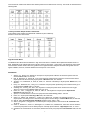
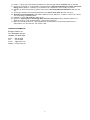
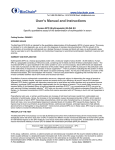
BioChain
User Manual and Instructions
Product: Human EPO (Erythropoietin) ELISA Kit
Specific quantitative assay for the determination of erythropoietin in serum
Catalog Number: Z6040001
INTENDED USAGE
The BioChain EPO ELISA is intended for the quantitative determination of Erythropoietin (EPO) in human serum. This assay
is intended for in vitro diagnostic use, as an aid in the diagnosis of anemias and polycythemias. With the advent of the
administration of recombinant erythropoietin as a biologic therapy to increase red blood cell mass, an erythropoietin assay
may be used also to aid in the prediction and monitoring of response to recombinant erythropoietin treatment in persons with
anemias.I. SUMMARY A
SUMMARY AND EXPLANATION
Erythropoietin (EPO) is a heavily glycosylated protein with a molecular weight of about 30,000 - 34,000 Daltons. Human
EPO is a polypeptide consisting of 165 amino acids, containing one O-linked and three N-linked carbohydrate chains1. The
recombinant EPO is a good substitute for the native protein for use in an immunoassay. Serum EPO levels are dependent
on the rate of production and the rate of clearance of the protein. Ninety percent of EPO is produced in the peritubular cells
3,4
of the adult kidney in response to a decrease in tissue oxygenation . There is evidence indicating that the protein on these
cells which detects oxygen saturation of the blood is a heme-containing moiety5. As the pO2 of the plasma, a function of the
6
hematocrit decreases, EPO concentration will increase . There are also observations suggesting that normally there is an
inverse correlation between serum EPO levels and red blood cell mass7.
Quantitation of serum erythropoietin concentration serves as a diagnostic adjunct in determining the cause of anemia or
erythrocytosis. Aplastic anemia, hemolytic anemia and anemia due to iron deficiency all result in serum EPO elevation.
Whereas, EPO levels in patients with secondary anemia due to renal failure and other disorders such as acquired immune
deficiency syndrome (AIDS) are generally inappropriately low for the degree of anemia. This is mostly likely caused by an
8
impaired ability of the diseased kidney to produce adequate quantities of EPO . Low concentrations of EPO may give an
10
early warning of kidney transplant rejection . EPO also can be used to monitor AIDS patients undergoing Zidovudine (AZT)
therapy. An increased concentration of EPO verifies that anemia associated with AZT therapy is due to red cell hypoplasia or
apliasia10.
Polycythemia rubra vera, or primary erythrocytosis (an increase of red blood cell mass) results from unstimulated over
production of erythrocytes. Hence, the increase in the hemoglobin causes decreased production of EPO, which results in
subnormal levels of serum EPO9. Secondary polycythemias, which are also characterized by an increase in the total red
blood cell mass, occur as a physiological response to elevated levels of circulatory EPO caused by tissue hypoxia. The
hypoxia may be due to such factors as pulmonary fibrosis, cardiovascular disease, prolonged exposure to high altitude,
abnormal forms of hemoglobin or drug treatment10. Some tumors produce EPO and, in these cases, EPO may be used as a
tumor marker to monitor the effectiveness of treatment.
PRINCIPLE OF THE TEST
The BioChain EPO Immunoassay is a two-site ELISA [Enzyme-Linked ImmunoSorbent Assay] for the measurement of the
biologically active 165 amino acid chain of EPO. It utilizes two different mouse monoclonal antibodies to human EPO specific
for well-defined regions on the EPO molecule. One mouse monoclonal antibody to human EPO, is biotinylated and the other
mouse monoclonal antibody to human EPO is labeled with horseradish peroxidase [HRP] for detection.
Streptavidin Well - Biotinylated Anti-EPO (mouse monoclonal) -- EPO -HRP conjugated Anti-EPO (mouse monoclonal)
In this assay, calibrators, controls, or patient samples are simultaneously incubated with the enzyme labeled antibody and a
biotin coupled antibody in a streptavidincoated microplate well. At the end of the assay incubation, the microwell is washed
to remove unbound components and the enzyme bound to the solid phase is incubated with the substrate,
tetramethylbenzidine (TMB). An acidic stopping solution is then added to stop the reaction and converts the color to yellow.
The intensity of the yellow color is directly proportional to the concentration of EPO in the sample. A dose response curve of
absorbance unit vs. concentration is generated using results obtained from the calibrators. Concentrations of EPO present in
the controls and patient samples are determined directly from this curve. The BioChain, Inc. standards have been calibrated
against the World Health Organization (WHO) erythropoietin international standard that consists of recombinant DNA derived
EPO. The WHO reference standard used was erythropoietin 1st international standard (87/684).
1
KIT COMPONENTS
Kit Components
RGT 1 = Reagent 1
RGT 2 = Reagent 2
RGT A = Reagent A
RGT B = Reagent B
SOLN = Stopping
Solution
PLA = Microplate
Description
Biotinylated EPO Antibody [mouse monoclonal anti human EPO] containing
Proclin 300 as preservative
Peroxidase (Enzyme) labeled EPO Antibody [mouse monoclonal anti
human EPO]
ELISA Wash Concentrate [Saline with surfactant with the preservative
ciprofloxacin hydrochloride
TMB Substrate [tetramethylbenzidine]
ELISA Stop Solution [1 N sulfuric acid]
One holder with Streptavidin Coated Strips.
CAL = Calibrators
A: 0 mU/mL
B:
C: Refer to vial labels
D: for exact
E:concentration
F:
Lyophilized synthetic h-EPO. Lyophilized Zero calibrator is a buffered
protein solution and all other calibrators consist of synthetic h-EPO (1-165)
in buffered protein solution. These standards have been calibrated against
st
the World Health Organization erythropoietin 1 international standard
[recombinant DNA derived EPO] (87/684). Each calibrator contains the
preservative ciprofloxacin hydrochloride
CTRL = Controls 1 & 2
Refer to vial labels for
exact ranges
Lyophilized. 2 Levels. Synthetic h-EPO (1-165) in
a buffered protein solution. Each control contains
the preservative ciprofloxacin hydrochloride
Quantity
1 x 3.5 mL
1 x 3.5 mL
1 x 30 mL
1 x 20 mL
1 x 20 mL
12 x 8-well
strips
1 x 4 mL for
the zero
calibrator
1 x 2 mL for
all other
calibrators
1 x 2 mL per
level
MATERIAL AND EQUIPMENT REQUIRED BUT NOT PROVIDED
•
Microplate reader capable of reading at 450nm and 405nm.
•
Microplate washer [if washer is unavailable, manual washing is acceptable].
•
Precision Pipettors to deliver 25, 200, 100 and 150 µL.
•
(Optional): A multi-channel dispenser or a repeating dispenser for 25, 100 and150 µL.
•
Timer capable of ± 2 minute accuracy.
•
Distilled or Deionized water.
•
Orbital rotator or shaker.
WARNINGS AND PRECAUTIONS FOR USERS
For in vitro diagnostic use.
Potential Biohazardous Material Caution
Stopping Solution consists of 1 N Sulfuric Acid. This is a strong acid. Although diluted, it still must be handled with care. It
can cause burns and should be handled with gloves and eye protection and appropriate protective clothing. Any spill
should be wiped immediately with copious quantities of water. Do not breath vapor and avoid inhalation.
ELISA Reagent 1, Biotinylated EPO Antibody contains Proclin 300 as a preservative. Avoid contact and wear gloves while
handling with this reagent. Promptly wash skin with mild soap and water if accidental skin contact should occur. Flush eyes
with water for 15 minutes, if reagent should be in contact with eye(s). If ingested, avoid vomiting and give large amount of
water. Contact a physician immediately.
ELISA Reagent A, Wash Concentrate, and EPO Calibrators and Controls all contain ciprofloxacin hydrochloride as a
preservative. Keep from personnel who have demonstrated a sensitivity to Quinoline based drug products. Females who
are, or may be pregnant should avoid any contact with Ciprofloxacin.
SAMPLE COLLECTION AND STORAGE
The determination of EPO should be performed on human serum. To assay the specimen in duplicate, 400 µL of human
serum is required. It is highly recommended that the specimen be collected between 7:30 a.m. to 12:00 noon, because
11,12
Collect whole blood without anticoagulant and allow
diurnal variation of erythropoietin has been reported in literature.
blood to clot between 2-8°C, if possible. It has been reported that serum samples clotted at room temperature (22°C to 28°C)
caused a decrease in EPO value as assessed by radioimmunoassay of about 30% over clotting on ice13. Then, the serum
should be promptly separated, preferably in a refrigerated centrifuge, and stored at -15°C or lower. Serum samples may be
stored up to 24 hours at 2-8°C. Serum samples frozen at -15°C are stable for up to 12 months. Do not store samples in selfdefrosting freezers. Avoid repeated freezing and thawing of samples. For long term storage of samples, it is recommended
that samples should be aliquoted into sample tubes or vials prior to freezing. Prior to use, allow all specimens to come to
room temperature (22°C to 28°C) and mix by gentle inversion or swirling. Avoid grossly hemolyzed or grossly lipemic
samples.
2
REAGENT PREPARATION AND STORAGE
Store all kit components at 2-8 °C except the Wash Concentrate
1. All reagents except the calibrators, kit controls and the Wash Concentrate are ready-to-use. Store all reagents at 28 °C except the Wash Concentrate, which should be kept at room temperature (22°C to 28°C) until dilution to avoid
precipitation.
2. For Zero Calibrator (Calibrator A) reconstitute vial with 4 mL of distilled or deionized water and mix. For each of the
non-zero calibrators (Calibrator B through F) and kit controls 1 and 2, reconstitute each vial with 2 mL of distilled or
deionized water and mix. Allow the vials to stand for 10 minutes and then mix thoroughly by gentle inversion to
insure complete reconstitution. Use the calibrators and controls as soon as possible upon reconstitution.
Freeze (-15°C) the remaining calibrators and controls as soon as possible after use. Standards and controls
are stable at -15 °C for 6 weeks after reconstitution with up to 3 freeze thaw cycles when handled as recommended
in “Procedural Notes” section.
3. ELISA Reagent A: Wash Concentrate: Mix contents of wash concentrate thoroughly. If precipitate is present in the
Wash Concentrate due to storage at lower temperature such as 4°C, dissolve by placing the vial in a 37°C water
bath or oven with swirling or stirring. Add wash concentrate (30 mL) to 570 mL of distilled or deionized water and
mix. The diluted working wash solution is stable for 90 days when stored at room temperature.
ASSAY PROCEDURE
1. Place sufficient Streptavidin Coated Strips in a holder to run all six (6) calibrators, A - F of the EPO
CALIBRATORS [Exact concentration is stated on the vial label], Controls and patient samples.
2. Pipet 200 µL of calibrators, controls and samples into the designated or mapped well. Freeze (-15°C) the
remaining calibrators and controls as soon as possible after use.
3. Add or dispense 25 µL of Reagent 1 (Biotinylated Antibody) into each of the wells which already contain the
calibrators, controls and samples.
4. Add or dispense 25 µL of Reagent 2 (Enzyme Labeled Antibody) into each of the same wells. Tap the microplate
firmly against a rigid object, such as a pen, to achieve thorough mixing of the sample with Reagents. For complete
assurance of mixing, repeat the tapping for a minimum of 5 times for each of the remaining three of the four sides of
the plate. Be careful to avoid spillage. Cover the microplate(s) with aluminum foil or a tray to avoid exposure to light,
And place it on an orbital shaker or rotator set at 170 ± 10 rpm for 2 hours ± 15 minutes at room temperature
(22°-28°C).
5. First aspirate the fluid completely and then wash/aspirate each well five (5) times with the Working Wash Solution
(prepared from Reagent A), using an automatic microplate washer. The wash solution volume should be set to
dispense 0.35 mL into each well.
6. Add or dispense 150 µL of the ELISA Reagent B (TMB Substrate) into each of the wells. Tap the microplate as
described in Step #(4).
7. With appropriate cover to avoid light exposure, place the microplate(s) on an orbital shaker or rotator set at 170 +
10 rpm for 30 ± 5 minutes at room temperature (22°-28°C).
8. Add or dispense 100 µL of the Stopping Solution into each of the wells. Tap the microplate as described in Step
#(4). Be careful to avoid spillage.
9. Read the absorbance of the solution in the wells within 10 minutes, using a microplate reader set to 450 nm against
250 µL of distilled or deionized water. Read the plate again with the reader set to 405 nm against distilled or
deionized water.
Note: The second reading is designed to extend the analytical validity of the calibration curve to the value
represented by the highest calibrator, which is approximately 450 mU/mL (the exact concentration is printed on the
vial label and will change slightly from one lot to another). Hence, patient samples with EPO > the penultimate [2nd
to the highest] calibrator, i.e.Calibrator E. can be quantified against a calibration curve consisting of the readings all
the way up to the concentration equivalent to the highest calibrator using the 405 nm reading, away from the
wavelength of maximum absorbance. Patient and control samples should be read using the 450 nm for EPO
concentrations up to the concentration of Calibrator E. EPO concentrations reading above that of Calibrator E
should be interpolated using the 405 nm reading.
10. By using the final absorbance values obtained in the previous step, construct two calibration curves using 405 nm
reading and 450 nm reading via cubic spline, 4 parameter logistics, or point-to-point interpolation to quantify the
concentration of EPO.
PROCEDURAL NOTES
•
Samples that have values below the limit of detection (1.2 mU/mL) should be reported as “ < 1.2 mU/mL”.
•
It is recommended that all calibrators, controls, and patient samples are assayed in duplicate, until the analyst or
technician has gained sufficient experience (as evidenced by the coefficient of variation duplicate being less than
nd
10% [except for the values below the 2 non-zero lowest standard] and the ability to obtain results for the kit
controls within the suggested acceptable ranges).
•
The samples should be pipetted into the well with minimum amount of airbubble.
•
Patient samples with values greater than the highest calibrator (Calibrator F), which is approximately 450 mU/mL
(see exact concentration on vial label, because it can vary from one lot to another), must be diluted with Calibrator
A (Zero Calibrator) and re-assayed. Multiply the result by the dilution factor. Alternatively, the result may be
reported as greater than the highest calibrator concentration (Calibrator F). For example, if the Calibrator F has an
assigned EPO value of 494 mU/mL, the report should be “ > 494 mU/mL”.
3
•
•
Reagents from different lot numbers must not be interchanged.
If preferred, mix in equal volumes, in sufficient quantities for the assay, Reagent 1 (Biotinylated Antibody) and
Reagent 2 (Enzyme Labeled Antibody) in a clean amber bottle. The combined reagent is stable for seven (7) days
when stored at 4°C. Then use 50 µL of the mixed antibody into each well. This alternative method should replace
Step (3) and (4), to be followed with the incubation.
•
When mixing avoid splashing of reagents from wells. This will affect assay precision and accuracy.
ULATION OF R
CALCULATION OF RESULTS
Manual Method
1. For the 450 nm readings, construct a dose response curve (calibration curve) using the first five calibrators
provided, i.e. Calibrators A, B, C, D and E. For the 405 nm readings, construct a second dose response curve using
Calibrators A, D, E and F.
2.
Assign the concentration for each calibrator stated on the vial in mU/mL. Plot the data from the calibration curve on
linear graph paper with the concentration on the X-axis and the corresponding A.U. on the Y-axis.
3.
Draw a straight line between 2 adjacent points. This mathematical algorithm is commonly known as the "point-topoint" calculation. Obtain the concentration of the sample by locating the absorbance unit on the Y-axis and finding
the corresponding concentration value on the X-axis. Patient and control samples should be read using the 450 nm
nd
for EPO concentrations up to the penultimate [2 to the highest] calibrator, i.e. Calibrator E. EPO concentrations
above the concentration of the penultimate calibrator (in the example shown below as 120 mU/mL) should be
interpolated using the 405 nm reading.
Automated Method:
4.
Computer programs using cubic spline or 4 PL [4 Parameter Logistics] or Point-to-Point can generally give a good
fit. For the 450 nm readings, construct a dose response curve (calibration curve) using the first five calibrators
provided, i.e. Calibrators A, B, C, D and E. For the 405 nm readings, construct a second dose response curve using
Calibrators A, D, E and F.
Sample Data at 450 nm [raw A.U. readout against distilled or deionized water]
* Because the Concentration of these samples are > the Concentration of Calibrator E, e.g. 120 mU/mL, it is
recommended to use the data obtained at 405 nm as shown in Sample Data at 405 nm in the table below.
Sample Data at 405 nm [raw A.U. readout against distilled or deionized water]
¶ For samples with concentrations < the concentration of Calibrator E, e.g. 120 mU/mL, it is recommended to use
the data obtained at 450 nm as shown in Sample Data at 450 nm in the table above. This practice should give the
results with optimum sensitivity of the assay.
4
NOTE:The data presented are for illustration purposes only and must not be used in place of data generated at the time of
the assay.
QUALITY CONTROL
Control samples or serum pools should be analyzed with each run of calibrators and patient samples. Results generated
from the analysis of the control samples should be evaluated for acceptability using appropriate statistical methods. When
the laboratory first introduces this EPO assay, the release of patient sample results should be based on whether the kit
Control results fall within the suggested acceptable ranges. If one or more of the quality control sample values lie outside
the acceptable limits, the assay should be repeated. Once the laboratory has generated data of its own, the quality control
parameters should be based on the statistical data by the laboratory, using either kit Control and/or serum pools made
by the laboratory. Levy-Jenning plots on control results should be used. If the results for all the control samples are within
mean + 2 standard deviations, with no definitive trend or bias of the quality control data, the assay should be deemed
acceptable. The Westgard rule should be followed to be compliant with CLIA 88 regulations. If the control results do not fall
within the stated parameters as described, assay results are invalid.
LIMITATIONS OF THE PROCEDURE
OF THE PR°CEDURE
Like any analyte used as a diagnostic adjunct, EPO results must be interpreted carefully with the overall clinical
presentations and other supportive diagnostic tests.
Purified IgG proteins of the same species as the ones for which the capture and the label antibodies, were derived, in
addition to one commercial heterophile antibody blocker, have been incorporated in the reagents to minimize the heterophile
antibodies.14 Nonetheless, there can be no assurance that the heterophile interference has been completely eliminated.
Therefore, it is recommended that at least three dilutions of any elevated and/or suspect positive results be assayed to
15
detect nonparallelism compared to reference standards.
Because results obtained with one commercial EPO assay may differ significantly from those obtained with any other, it is
recommended that any serial testing performed on the same patient over time should be performed with the same
16
commercial EPO test. This test may not be sufficiently sensitive to consistently discriminate abnormally low EPO values
from normal levels of EPO.
Lower EPO levels than expected have been seen with anemias associated with the following conditions: rheumatoid arthritis,
17
18
acquired immunodeficiency syndrome, cancer, and ulcerative colitis , sickle cell disease, and in premature neonates.
17
After allogeneic bone marrow transplant, impaired erythropoietin response may delay erythropoietin recovery.
Patients with hypergammaglobulinemia associated with multiple myeloma or Waldenstrom’s disease have impaired
17
production of erythropoietin in relation to hemoglobin concentration. This has been linked to increased plasma viscosity.
No drugs have been investigated for assay interference.
19
EPO levels of persons living at high altitudes with erythrocytosis may rapidly fall to normal after returning to low altitudes.
EXPECTED VALUES
EPO levels were measured in 120 apparently normal individuals in the U.S. with the BioChain EPO ELISA. The samples
consist of 61 males and 59 females, ranging from 18 to 96 years of age. There is no significant statistical difference on the
reference ranges obtained from the female and male population of data. This finding, that there is no gender difference, is
21
consistent with the literature . Further, the EPO values do not appear to have significant age dependence, except
higher values were obtained in samples from early phases of adulthood, i.e. approximately 22 to 42 years of age). Using the
nonparametric method for the analysis of reference values outlined in the NCCLS publication “How to Define, Determine,
and Utilize Reference Intervals in the Clinical Laboratory” (NCCLS Document C28-A, Vol. 15 No. 4) the reference ranges
(2.5 – 97.5 percentile) were 4.3 – 32.9 mU/mL for EPO in serum. Each laboratory should establish their own range of
expected normal values.
“In patients with erythrocytosis due to uncompensated hypoxia, serum immunoreactive EPO is elevated; in those with
compensated hypoxia, the serum immunoreactive EPO level is usually within the range of normal, and in patients with
polycythemia vera, serum immunoreactive EPO is either normal or low. Thus, while an elevated serum EPO level suggests
that erythrocytosis is a secondary phenomenon and a low EPO level supports the possibility of autonomous erythropoiesis, a
normal serum EPO level excludes neither hypoxia nor autonomous EPO production as the cause of erythrocytosis.” 20
PERFORMANCE CHARACTERISTICS
Accuracy
Eighty five (85) patient samples, with EPO values ranging from 3.8 to 304 mU/mL, were assayed by the BioChain ELISA
procedure and an ELISA EPO kit. Linear regression analysis gives the following statistics:
5
BioChain ELISA = 0.94 ELISA Kit – 0.41 mU/mL
r = 0.989 N = 85
Sensitivity
The sensitivity, or minimum detection limit, of this assay is defined as the smallest single value, which can be distinguished
from zero at the 95% confidence limit. The BioChain EPO ELISA has a calculated sensitivity of 1.2 mU/mL. Hence,
patient sample results below 1.2 mU/mL should be reported as “Less than 1.2 mU/mL.”
Precision and Reproducibility
The Intra-assay precision of the BioChain EPO ELISA Test was calculated from 22 replicate determinations on each of the
two samples.
Intra-Assay Variation
The inter-assay precision of the BioChain EPO ELISA Test was calculated from data on two samples obtained in 22 different
assays.
Inter-Assay Variation
Specificity and Cross-Reactivity
Cross-reactivity in the EPO was studied by the addition of various substances to the Zero Calibrator (Calibrator A).
None of the cross reactants interferes with this EPO ELISA in the concentrations studied. The very small changes in EPO
seen for some cross reactants were well within the statistical limits of intraassay variation.
Recovery
6
Various amounts of EPO were added to four different patient sera to determine the recovery. The results are described in the
following table:
Linearity of Patient Sample Dilutions: Parallelism
Three patient serum samples were diluted with Calibrator A (Zero Calibrator).
Results in mU/mL are shown below:
High Dose Hook Effect
The BioChain EPO ELISA kit has exhibited no “high dose hook effect” in standard diluent spiked with 200,000 mU/mL of
EPO. Additionally, three samples with known high EPO values (1,920 mU/mL, 1,520 mU/mL, and 966 mU/mL) were tested
without dilution and their results read much greater than the highest standard. Samples with EPO levels greater than the
highest calibrator, however, should be diluted and re-assayed for correct values.
REFERENCES:
1.
2.
3.
4.
5.
6.
7.
8.
9.
10.
11.
12.
13.
Sawyer, S.T., Krantz, S.B., Sawada, K. Receptors for Erythropoietin in Mouse and Human Erythroid Cells and
Placenta. Blood 1989; 74: 103-109.
Imai, N., Kawamura, A., Higuchi, M., et al. Physicochemical and Biological Comparison of Recombinant Human
Erythropoietin with Human Urinary Erythropoietin. J Biochem 1990; 107: 352-359.
Jacobson, L.O., Goldwasser, E., Fried, W., Pizak, L.F. The Role of the Kidney in Erythropoiesis. Nature 1957; 179:
633-634.
Koury, S.T., Bondurant, M.C., Koury, M.J. Localization of Erythropoietin Synthesizing Cells in Murine Kidney by insitu Hybridization. Blood 1988; 71: 524-527.
Goldberg, M.A., Dunning, S.P., Bunn, H.F. Regulation of the Erythropoietin Gene: Evidence that the Oxygen
Sensor is a Heme Protein. Science 1988; 242: 1412-1415.
Erslev, A.J., Caro, J., Birgegard, G., Silver, R., Miller, O. The Biogenesis of Erythropoietin. Experimental
Hematology 1980; Suppl 8: 1-13.
Spivak, J.L. The Mechanism of Action of Erythropoietin. Int J Cell Cloning 1986; 4: 139-166.
Erslev, A.J. Erythropoietin. New Eng J Med 1991; 324:1339-1344.
Garcia, J.F., Ebbbe, S.N., Hollander, L., Cutting, H.O., Miller, M.E., Cronkits, E.P. Radioimmunoassay of
Erythropoietin: Circulating Levels in Normal and Polycythemic Human Beings. J Lab Clin Med 1982; 99: 624-635.
Wild, D., editor. The Immunoassay Handbook, Stockton Press, 1994, p. 428.
Wide L., Bengtsson C., Birgegard G. Circadian Rhythm of Erythropoietin in Human Serum. Br J Haematol 1989;
72: 85-90.
Cahan C., Decker M.J., Arnold J.L., Washington L.H., Veldhuis J.D., Goldwasser E., Strohl K.P. Diurnal Variations
in Serum Erythropoietin Levels in Healthy Subjects and Sleep Apnea Patients. J Appl Physiol 1992; 72: 2112-7.
Goldwasser E. and Sherwood J.B. Annotation, Radioimmunoassay of Erythropoietin. Br J Haematol 1981; 48: 35963.
7
14. Kricka L.J. Human Anti-Animal Antibody Interferences in Immunological Assays. ClinChem 1999; 45: 942-956.
15. Cotes P.M. and Spivak J.L. Erythropoietin in Health and Disease. Erythropoietin Molecular, Cellular and Clinical
Biology, Editors: Erslev A.J., Adamson J.W., Wschbach J.W., Winearls C.G. 1991; Chapter 11:184-207.
16. Jelkmann W. Renal Erythropoietin: Properties and Production. Rev Physiol Biochem Pharmacol 1986; 104: 139215.
17. Cotes M.P. Anomalies in Circulating Erythropoietin Levels. Annals of NY Acad, Sci 1994; 718:103-9.
18. Wintrobe’s Clinical Hematology, ninth edition, edited by Lee G.R., Bithell T.C., Foerster J., Athens J.W., Lukens
J.N. Lea & Febiger, Philadelphia 1993.
19. Fairbanks V. Q & A. CAP Today Nov 1996, pg. 88.
20. Spivak, JL. “Erythrocytosis”, Hematology: Basic Principles and Practice; editors: Hoffman R, Benz EJ Jr.,
Shattil, SJ; Furie B., Cohen HJ; Silberstein LE; 1995; Chapter 37:484-491
21. Miller, ME, Chandra M, Garcia JF: “Clinical applications of measurement of serum immunreactive levels of
erythropoietin”, Ann. N.Y.Acad. Sci. 459: 375-381, 1985.
ORDERING INFORMATION
BioChain Institute, Inc.
3517 Breakwater Avenue
Hayward, CA 94545 USA
Phone:
Fax:
E-mail:
Website:
888-762-2568
510-783-5386
[email protected]
www.bioChain.com
8