1
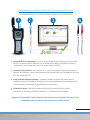
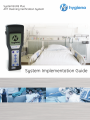
Contents Introduction Components 2 3 Section 1: An Overview of ATP Cleaning Verification 1.1 What is ATP? 1.2 Measuring ATP with Bioluminescence Technology 1.3 Additional Uses of SystemSURE Plus 4 4 6 Section 2: Implementing an ATP Cleaning Verification System 2.1 Establishing Test Locations and Limits 2.2 Broad Risk Categories and Limits 2.3 Corrective Action Procedures 2.4 Suggested Cleaning, Testing, and Corrective Action Procedure Flowchart 2.5 Programming Locations 2.6 Setting Up Test Plans 2.7 Testing Frequency 2.8 Daily Monitoring 2.9 Using SureTrend Software to Maximize a Monitoring Program 2.10 Additional Testing 2.11 Calibration 7 11 12 13 14 15 16 19 21 21 22 Appendices Appendix A: Recommended Test Locations Appendix B: Proper Sampling Procedure 11 23 24 Contents Introduction Components 2 3 Section 1: An Overview of ATP Cleaning Verification 1.1 What is ATP? 1.2 Measuring ATP with Bioluminescence Technology 1.3 Additional Uses of SystemSURE Plus 4 4 6 Section 2: Implementing an ATP Cleaning Verification System 2.1 Establishing Test Locations and Limits 2.2 Broad Risk Categories and Limits 2.3 Corrective Action Procedures 2.4 Suggested Cleaning, Testing, and Corrective Action Procedure Flowchart 2.5 Programming Locations 2.6 Setting Up Test Plans 2.7 Testing Frequency 2.8 Daily Monitoring 2.9 Using SureTrend Software to Maximize a Monitoring Program 2.10 Additional Testing 2.11 Calibration 7 11 12 13 14 15 16 19 21 21 22 Appendices Appendix A: Recommended Test Locations Appendix B: Proper Sampling Procedure 23 24 1 11 Introduction to the SystemSURE Plus ATP Cleaning Verification System Hygiena’s SystemSURE Plus ATP Cleaning Verification System is a tool used to: Educate environmental services professionals and other personnel on proper cleaning technique Monitor and improve the cleanliness levels of surfaces in healthcare facilities Monitor the effects of changes within a cleaning program Document and track individual and overall cleaning performance Healthcare facilities that implement an objective monitoring system experience a 42% increase in cleaning thoroughness.i The Centers for Disease Control and Prevention (CDC) encourages all hospitals to develop preventative programs to optimize and monitor the thoroughness of high-touch surface cleaning.ii The SystemSURE Plus ATP Cleaning Verification System enables healthcare organizations to: Instantly assess the cleanliness of surfaces, allowing immediate corrective action to be taken Reduce or eliminate variation in surface cleaning performance by standardizing acceptable cleaning levels Improve and enhance the training of environmental services personnel Provide insight into whether current cleaning processes and tools are sufficient or below adequate Reduce the use of conventional microbiological testing methods that are slow, labor intensive, and costly Record and track test results to identify problem areas, make improvements, and show due diligence to auditors and compliance with regulations Enhance environmental cleaning programs which help to prevent the spread of harmful bacteria and viruses that are associated with healthcare associated infections Ensure patient safety and increase patient satisfaction Using Hygiena’s SystemSURE Plus Cleaning Verification System, healthcare facilities are able to create a standard by which to measure cleaning effectiveness. i Carling, P.C., & Bartley, J.M. (2010). Evaluating hygienic cleaning in health care settings: What you do not know can harm your patients. American Journal of Infection Control; 38 : S41 ii http://www.cdc.gov/HAI/toolkits/Evaluating-Environmental-Cleaning.html 2 Components of the SystemSURE Plus ATP Cleaning Verification System The SystemSURE Plus ATP Cleaning Verification System consists of four parts: 1 2 3 4 1. SystemSURE Plus Luminometer – a user-friendly, handheld, light-reading unit that provides precise, on-site test results. Used with the UltraSnap testing device, extremely low levels of contamination can be detected in just 15 seconds. (Catalog # SS3H) 2. UltraSnap Testing Device – a convenient, all-in-one ATP test device. Simply swab, snap, and squeeze, and the test is ready to be measured in the SystemSURE Plus. Packaged 100 tests per box. (Catalog # US2020) 3. SureTrend Data Analysis Software – a powerful software program that allows users to upload test results to a database, analyze trends and generate reports for management and record-keeping. (Included with SystemSURE Plus Luminometer). 4. Calibration Devices - optional calibration rods confirm SystemSURE Plus is within specifications. (Catalog # PCD4000) See section 2.11 Calibration for more details. Hygiena’s luminometer, testing devices, and software are designed to be easy to use, enabling operation by both technical and non-technical staff. 3 33 Section I: System Overview The SystemSURE Plus ATP Cleaning Verification System is a rapid cleaning monitoring system used to help hospitals and other healthcare organizations achieve optimal standardized cleaning levels. The system uses bioluminescence technology to identify and measure adenosine triphosphate, commonly known as ATP. 1.1 What is ATP? ATP is an energy molecule found in all living cells that allows cellular metabolism to take place. All organic matter contains ATP, including blood, saliva, and bacteria. In healthcare facilities, organic matter such as bodily fluids, blood, and bacteria left on surfaces can become a point of crosscontamination between patients and staff, leading to infections if not properly cleaned. Therefore the detection of ATP on a surface after cleaning is an indication of improper cleaning. 1.2 Measuring ATP with Bioluminescence Technology UltraSnap ATP surface tests contain an enzyme called luciferase which produces a bioluminescence (light-producing) reaction when it comes into contact with ATP. The light emitted from the reaction is measured and quantified in the SystemSURE Plus luminometer. The graphic below illustrates how ATP on a surface reacts with the enzyme in UltraSnap ATP test devices to emit light. 4 ATP Presence and RLU Measurement Fail Pass Clean Dirty Higher Contamination = Higher RLU The quantity of light generated by the bioluminescence reaction is directly proportional to the amount of ATP present in the sample. The reaction is immediate, allowing results to be processed in real-time. Results are then expressed numerically on the SystemSURE Plus screen as Relative Light Units (RLU). 5 55 1.3 Additional Uses of SystemSURE Plus In addition to routine ATP cleaning verification by Environmental Services (EVS), the SystemSURE Plus ATP Cleaning Verification System can be used for: Central/Sterile Services – Used for verifying the cleanliness of flexible endoscopes and other reusable medical devices. Improper cleaning of equipment before sterilization can lead to non-sterile equipment. Hand Hygiene Compliance – Used to measure levels of ATP present on personnel’s hands before and after hand washing to demonstrate efficacy and thoroughness of hand washing efforts. Food Service/Cafeteria Food Safety – Used to verify food preparation surfaces and dining areas have been cleaned properly. For more information on implementing the SystemSURE Plus in these and other areas of a hospital, visit www.hygiena.com/healthcare.html 6 Section 2: Implementing an ATP Cleaning Verification System 2.1 Establishing Test Locations and Limits The SystemSURE Plus comes with a preset pass limit of 25 RLU and fail limit of 50 RLU. These limits are based on studies conducted in healthcare facilities, and a starting point from which custom limits can be refined. Pass Caution Fail 25 RLU 26-50 RLU 50 RLU This section will guide users through identifying test locations and establishing appropriate pass/fail limits for those locations. To optimize an ATP cleaning verification program, many hospitals choose to set custom limits for test locations. Before testing begins, it is necessary to: 1. Identify areas within the facility that will be tested 2. Establish appropriate pass and fail limits for each location The CDC provides a list of recommended locations to test in hospitals (see Appendix A on page 23). Locations typically tested are high-touch surfaces where the chance of spreading infectious bacteria is high. Monitoring of low-risk surfaces on a less frequent basis is also essential to verifying a facility is being thoroughly cleaned. Prepare the list of locations on a piece of paper or Microsoft Excel worksheet. 7 77 Collecting Test Samples Once locations to be tested have been identified, pass and fail limits for each location can be established by collecting samples or assigning the locations to broad risk categories (see Section 2.2 on page 11). Before collecting initial samples, it is essential to master proper sampling procedure as detailed in Appendix B, page 24. Managers may choose to collect test samples in one of two ways: 1. After Routine Cleaning Time to implement: 1-4 weeks To use this method, sample each location a minimum of 10 times after routine cleaning. If locations are the same from room to room, it is acceptable to test the same location from different rooms. 2. Optimal cleaning Time to implement: 1-3 days To use this method, the manager overseeing the ATP cleaning verification program should clean each location that will be tested the way he or she wants the location to be cleaned each time. A minimum of 10 samples should be taken from the same locations in different rooms to ensure that no site is tested more than once. For example, the call buttons in ten different rooms could be sampled after the cleaning of these sites. Record RLU measurements on a spreadsheet (Example 1). (For an Excel® spreadsheet that automatically calculates pass/fail limits, visit the resources section at www.hygiena.com/healthcare.html) Example 1: Collected Test Samples 1 2 3 Tests Location 8 11 4 5 6 RLU measurement 7 8 9 10 Bedrail 48 49 50 38 38 35 73 118 36 15 IV Pole 10 25 67 35 8 5 50 47 32 24 Bedside Table 45 27 0 2 51 5 0 2 10 6 Remote 112 215 78 45 89 86 95 148 62 71 Average Calculating Pass/Fail Limits with the Standard Deviation Method Result Calculation Instructions Pass Average To determine the lower (pass) limit of each location, calculate the average RLU score from the samples collected. To determine the upper (fail) limit, calculate the standard deviation of the samples collected and multiply by three (3)iii. Add that value to the average. Average + (3 * Standard Deviation) Fail Statistically, this calculation indicates that nearly all (99.7%) passing test results (clean surfaces) will be below the fail RLU limit. An RLU result higher than the fail limit would be a statistical outlier, indicating the location is not clean. Example 1 Continued: Calculated Limits Location Average = Pass Avg + (3 * Standard Deviation) = Fail Bedrail 50 134 IV Pole 30 91 Bedside Table 15 73 Remote 100 248 i. For calculations using Microsoft Excel: For lower limit (pass), use the function “=AVERAGE” For upper limit (fail) use the function “=3*STDEV and add to “=AVERAGE” 9 The range between the pass and fail values is the caution range. This could give different pass, caution, and fail levels for each location. This is typical when different surface types (plastic, stainless steel, etc.) are being tested and when the age of equipment varies. Thus, for Example 1 data, the limits for the locations using the standard deviation method are as follows: Example 1: Final Limits Location Pass Caution Fail Bedrail 50 51-133 134 IV Pole 30 31-90 91 Bedside Table 15 16-72 73 Remote 100 101-247 248 Eliminating the Caution Zone Many hospitals chose to eliminate the caution zone and consider anything greater than the pass score as a fail. Refer to the table below for an example. Example 1: Limits without Caution Range Location Pass Fail Bedrail 50 >50 IV Pole 30 >30 Bedside Table 15 >15 Remote 100 >100 10 33 2.2 Broad Risk Categories and Limits While establishing custom limits for your facility would be the gold standard for setting up a monitoring program, many hospitals rely on limits for broad–risk categories that have been validated by published, peer-reviewed, and third-party studies. For information on these studies, reference Technical Document: Establishing RLU Pass/Fail Limits available from the resource library on www.hygiena.com or contact your Hygiena technical representative. The general recommended limits below reflect an elimination of the caution zone. For hospitals that wish to use the caution zone, simply double the pass RLU (pass RLU x 2) to determine the fail RLU number. Application Public areas General Recommended Limits Pass (RLU) Fail (RLU) Examples: 50 >50 25 >25 IV pole Sterile services 10 >10 Washer disinfector 5 >5 Food preparation and catering 10 >10 Hand washing 60 >60 Elevator call buttons Hallway handrails Waiting room areas Patient rooms Examples: Call button Bed rails Patient restroom Monitor panels 11 2.3 Corrective Action Procedures Corrective action procedures provide clear instructions for what steps should be taken following pass, caution, or fail results. Recommended corrective action procedures are as follows: SYMBOL TEST RESULT Pass 12 55 CORRECTIVE ACTION The surface has been adequately cleaned. No action required. Caution The surface may not have been adequately cleaned. The area may be recleaned and retested, or monitored for future problems. Cleaning personnel may require retraining on proper cleaning procedures. Fail The surface has not been cleaned to the cleaning standard and must be recleaned and retested. Cleaning personnel should also be retrained on proper cleaning procedures. 2.4 Suggested Cleaning, Testing, and Corrective Action Procedure Flowchart 13 2.5 Programming Location Pass/Fail Limits into Software Once test locations have been identified and Pass/Fail limits determined, they must be entered into the SureTrend software and synced with the SystemSURE Plus luminometer. For instructions on how to install SureTrend software and add locations, see the installation guide and manual included with the SureTrend CD. See the SureTrend User Manual for steps on entering locations and limits. For assistance programming locations and limits in the SureTrend software, please contact your Hygiena representative. By default the SureTrend software assigns a pass limit of 10 and fail limit of 30 when you add a new location. Assign the correct limits to each location determined in Section 2.1 or 2.2. Group information can also be entered at this time. Group information is used for grouping locations together for reporting purposes. For example, groups can allow users to compare the performance of departments, wings, or facilities. Below is an example of the location setup in the SureTrend software. Prog # Location Group Pass Fail 1 Bedrail – East Community Hospital – East 50 100 2 Remote Control - East Community Hospital – East 25 50 3 Sink – East Community Hospital – East 15 30 4 Bedrail - West Community Hospital – West 50 100 5 Remote Control - West Community Hospital – West 25 50 6 Sink - West Community Hospital – West 15 30 14 77 2.6 Setting up Test Plans Once locations and limits have been input into SureTrend software, test plans may then be set up. Test plans are helpful groups of locations that are tested one after another, grouped together, or tested on a specific day. Test plans help to keep testing and data analysis organized. See the SureTrend User Manual for directions on setting up test plans in SureTrend software. Here are some examples of test plans with locations: Nurses’ Station Keyboard ICU Patient Room Ventilator control panel Public Areas Handrails Phone IV Pole Countertop Monitor cables Waiting area chair File cabinet handle Call button Telephone Light switch Door handle Water cooler ER Mobile Workstations West Wing Patient Room Monday Crash cart Bed tray table Bedrails ECG cart Patient phone IV Pole Laceration cart Call button Bedside Table Bedside cart Bed rail Remote Trauma cart Main light switch Panels IV cart Sink handles IV medication cart Toilet flush handle Cast cart Bathroom light switch Door levers Bathroom handrail Television remote 15 2.7 Testing Frequency Once test plans are programmed into the SureTrend software, sync the SystemSURE Plus with the software and begin testing. The frequency of testing will be determined by: Budget Size of facility Importance of the cleaning standard Logistical and staff constraints Compliance with CDC environmental monitoring recommendations or other auditing bodies’ recommendations Desired statistical accuracy of reports (the greater the amount of data generated, the more representative the data will be) The CDC has a recommended formula for sample size determination. It is divided in two segments: Baseline Monitoring and Ongoing Monitoring. Section 2.8 outlines a Daily Monitoring routine that most hospitals will chose to fully leverage an ATP Cleaning Verification program. 1. Baseline Monitoring – Getting Started Minimal Baseline Optimal This is the initial testing regiment that should be conducted to accurately assess the current level of cleanliness and compliance to cleaning processes. This initial testing will become the baseline to gauge improvements or deterioration of thoroughness of cleaning and will determine the number of points which must be monitored on a regular basis. While it would be ideal to identify small fluctuations in practice accurately (e.g., 10% relative change), such an approach takes slightly more time and testing. Instead, a meaningful change in cleaning practice (e.g., 20% relative change) can be detected without having to evaluate a substantial number of surfaces. The CDC recommends sampling all available surfaces identified in Section 2.1 or Appendix A (page 23) in a 10% - 15% sample of representative patient rooms in hospitals with over 150 beds. In hospitals with less than 150 beds, all available surfaces should be tested in a minimum of 15 rooms for baseline and ongoing monitoring. The CDC recommends baseline monitoring to be conducted at least three times per year. This is the minimum amount of testing that can be done to show a 20% relative change in cleaning levels. If pass levels decline, then more testing should be done in order to determine what has caused deterioration. (i.e., inefficient sanitizer, insufficient cleaning process, poor employee performance, etc.). Source: CDC Toolkit for Evaluating Environmental Cleaning, Appendix C, http://www.cdc.gov/HAI/toolkits/AppendicesEvaluating-Environ-Cleaning.html 16 99 The following is an example of a baseline evaluation (to measure levels of cleanliness): Baseline Evaluation Calculation for a Typical 250-Bed Hospital Number of Patient Rooms Locations per Room Operating Room Locations Sterile Services Locations Total Locations Percent of Total Locations to Monitor 2,700 270 – 405 For Example: 250 Patient Rooms Locations to Monitor 10 Test Locations in Each Room 100 Operating Room Locations 100 Sterile Services Locations 3 Evaluations per Year Totals Tests per Year 3 810 – 1,215 Total Locations Locations to Monitor For Example: 270 – 405 Locations to Monitor Evaluations per Year Totals Tests per Year For a 250 bed hospital with 10 locations in each patient room, 100 operating room locations, and 100 sterile services locations, there are 2,700 total locations to be tested. To monitor 10-15% of locations, a total of 270-405 locations will need to be tested three times per year (a total of 8101,215 tests per year). 17 2. Ongoing Monitoring – Minimalist Maintenance Minimal Baseline Optimal When hospitals have achieved more than 80% or higher pass results from baseline monitoring, the number of surfaces to be monitored can be decreased to those available in a 5% sample of rooms per evaluation cycle unless there is deterioration in practice. Though the CDC does outline minimal testing of 5% of potential test locations, Hygiena has found that hospitals that have a high cleaning thoroughness rate usually achieve such success through Daily Monitoring - see Section 2.8 on the following page. Below is an example of ongoing monitoring (once 80% or more of baseline test results are “Passing”): Ongoing Monitoring for a Typical 250-Bed Hospital Number of Patient Rooms Locations per Room Operating Room Locations Sterile Services Locations Total Locations Percent of Total Locations to Monitor For Example: 250 Patient Rooms Locations to Monitor 10 Test Locations in Each Room 3 Evaluations per Year 100 Operating Room Locations 100 Sterile Services Locations 2,700 Total Locations 135 Locations to Monitor Totals Tests per Year For Example: 135 Locations to Monitor 3 Evaluations per Year 405 Totals Tests per Year For a 250 bed hospital with 10 locations in each room, 100 operating room locations, and 100 sterile services locations, there are 2700 total locations to be tested. To monitor 5% of locations, a total of 135 locations will need to be tested three times per year (a total of 405 tests per year). 1111 2.8 Daily Monitoring – Optimal Program Minimal Baseline Optimal More and more hospitals are moving to daily or weekly ATP cleaning verification. Daily monitoring only requires a few tests per day, yet holds cleaning staff accountable for achieving an optimal level of cleanliness each and every day. Creating a reward system based on daily results can be a very powerful program that brings staff together and improves overall hospital cleanliness. Daily monitoring does take a greater time commitment and requires more consumables, so Hygiena will help every hospital to design a testing program within its resources and budget. Below are three scenarios breaking down the time and consumable use associated with a daily ATP monitoring program using 5, 10, or 15 tests per day. Scenario 1: Five Tests per Day Daily Monthly Yearly 5 150 1,800 tests tests tests # Tests 5 minutes 2.5 hours 30 hours Time (1 min/test) 19 Scenario 2: Ten Tests per Day Daily Monthly Yearly 10 300 3,600 tests tests tests # Tests 10 minutes 5 60 hours hours Daily Monthly Yearly 15 450 5,400 Time (1 min/test) Scenario 3: Fifteen Tests per Day tests tests tests # Tests 15 minutes Time (1 min/test) 20 1313 7.5 hours 90 hours 2.9 Use SureTrend Software to Maximize a Monitoring Program One of the greatest byproducts of a daily monitoring program is a robust database of test results to aid in decision making and management of hospital cleanliness programs. By frequently collecting test results, a hospital can build up a database of records to identify trends, asses training opportunities, and compare cleaning performance between departments, shifts, or facilities. Using these reports in regular performance feedback meetings with frontline personnel can be crucial in maintaining environmental cleaning effectiveness. SureTrend comes with dozens of preset reports so little setup is required by the user and reports can be automatically emailed to stakeholders. Visit www.hygiena.com for a helpful guide for using SureTrend reports in hospitals: Quick Start Software Report Guide for the Healthcare Industry. 2.10 Additional Testing ATP cleaning verification can also be integrated into a hospital’s emergency cleaning procedures as a final step to confirm thorough cleanliness. In the event of patient accidents, bio-waste spills, flood, new construction, outbreak, or other accidental contaminations involving blood, urine, or fecal waste, cleaning staff should perform an emergency cleaning of that area. To confirm thorough cleaning of the site, ATP tests can be taken. This will ensure that the spill site has been properly cleaned. 21 2.11 Calibration To verify instrument calibration, Hygiena offers two calibration kits that are recommended for periodic use with your system. Calibration Control Rod Kit (Catalog# PCD4000) Though Hygiena’s ATP Cleaning Verification System automatically checks calibration at startup, it is recommended that calibration is verified with the Calibration Control Kit once a month for audit record-keeping purposes. Incorporating the Calibration Control Kit into a cleaning verification program will confirm that the instrument is within specifications and operating correctly. Each kit contains a positive rod and negative rod. The positive rod emits a very low level of constant light output that can be measured in RLUs to verify proper calibration of the unit. The negative rod produces zero (0) RLU and is used to check that background light is not entering the instrument, while ensuring that the light sensor is calibrated correctly. Positive Control Kit (Catalog # CK25) The Positive Control Kit is used for validating the efficacy and quality of the UltraSnap ATP Testing Device. Each kit comes with 25 sealed glass vials, containing a certain amount (approx. 5 x 10-13 moles) of freeze-dried ATP and sugars to provide a predictable result if UltraSnap devices are used and stored correctly. 22 1515 Appendix A: Recommended Test Locations Patient Areas Airway cart Anesthesia cart Bathroom door knobs and levers* Bathroom handrails* Bathroom light switch* Bed control* Bed rails* Bedpan cleaner* Bedside chair* Bedside tables* BP machine cuff Cabinet door handles Call button* Door knobs* ECG cart Flush handle* IV cart IV pole* IV pump control* Laceration cart Light switch* Medication cart Monitor controls* Monitor touch screen* Monitor cables* Operating table base Operating table hand control Operating table mattress OR anesthesia machine OR boom OR keyboard OR door push plates OR spotlight Privacy curtain Phone* Sink top* Sink handles* Supply cart Toilet seat* Trauma cart Tray table* TV remote Ventilator control panel* Public Areas Drinking fountain buttons Elevator call buttons Hallway hand rails Nurses’ keyboard Nurses’ phone Vending machine buttons Visitor bathroom light switch Visitor bathroom door knobs Waiting room chairs Sterile Services Autoclave interior Biohazard receptacle Endoscope Sink Sterile tools Sterilizer handle Food Preparation: Cutlery Cutting board Dishwasher Freezer handles Fridge handles Knives Service trays Serving utensils Sink Sink handles Hand Hygiene: Preclean Post-clean Scrub sink Sink handles Soap dispenser * Source: CDC Environmental Checklist for Monitoring Terminal Cleaning available at http://www.cdc.gov/HAI/toolkits/Environmental-Cleaning-Checklist-10-6-2010.pdf 23 Appendix B: Proper Sampling Procedure Watch an instructional demo at www.youtube.com/HygienaTV The SystemSURE Plus luminometer is designed to detect contamination that cannot be seen by the naked eye. Excessive sample may interfere with the bioluminescence reaction and produce an inaccurate test result, which is why it is important to remove all visible soil from a surface before swabbing. Before collecting a sample for testing, the surface should be visibly clean. If any soiling or residue is present, reclean the area before testing. Turn on the SystemSURE Plus luminometer. The system will run through automatic calibration. Once calibration is complete, scroll through the program numbers (PROG) using the and arrows to find the programmed test location that correlates to the location being tested. This action should be taken prior to swabbing. Remove the individual UltraSnap device from the package. Next, remove the outer tube by holding onto the double ring base of the Snap-Valve while pulling down on the tube. The swab tip comes pre-moistened. Condensation may be visible on the inside of the swab tube. This is normal. Do not touch the swab tip or shaft with fingers or anything else, as this will contaminate the test. Discard any swabs that accidentally get tainted or activated. NOTE: For optimal performance, swabs that have been removed from cold storage should stand for 10 minutes at room temperature before use. Incorrect swabbing technique: Touching the swab shaft with your finger Lightly touching the swab to the sample area Collecting sample on only one side of the swab tip Correct swabbing technique: Sufficient pressure to create flex in the swab shaft (helps to break through any biofilm on the surface) Rotate the swab to collect sample on all sides of swab tip No contact with the swab shaft wand 24 1717 Regular surfaces: Swab a 10 x 10 cm (4 x 4 in) square on the test surface, making a criss-cross pattern as shown. Irregular surfaces: Where 10 x 10 cm square sampling is not feasible, such as a bed rail, swab as much of the surface as possible to collect a representative sample. Note: Consistent sampling pattern on irregular surfaces is necessary to ensure reliable and repeatable results. All individuals responsible for performing swab tests should agree on similar sampling pattern. Re-insert the swab into the tube. Holding the device upright, activate UltraSnap by bending the bulb at the top until the plastic Snap-Valve breaks, then bend once more in the opposite direction. Squeeze the bulb twice to expel the liquid-stable reagent contained in the bulb and allow it to flow to the bottom of the tube. 25 Gently shake the device with a side-to-side motion for 5-10 seconds, bathing the swab bud in the liquid-stable reagent. The test is now activated and the bioluminescence reaction is taking place. For optimal results, the reading should be taken on the SystemSURE Plus luminometer within 30 seconds of activation. Open the lid on the SystemSURE Plus luminometer, and insert the activated UltraSnap device into the reading chamber. Close the lid. Taking care to hold the unit upright for an accurate reading, press “OK” on the SystemSURE Plus to initiate measurement. Results are displayed on the screen in 15 seconds. 26 1919 Gently shake the device with a side-to-side motion for 5-10 seconds, bathing the swab bud in the liquid-stable reagent. The test is now activated and the bioluminescence reaction is taking place. For optimal results, the reading should be taken on the SystemSURE Plus luminometer within 30 seconds of activation. Open the lid on the SystemSURE Plus luminometer, and insert the activated UltraSnap device into the reading chamber. Close the lid. Taking care to hold the unit upright for an accurate reading, press “OK” on the SystemSURE Plus to initiate measurement. Results are displayed on the screen in 15 seconds. 1919 INS0153 REVC 102014