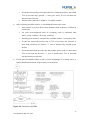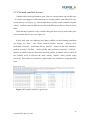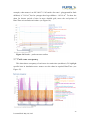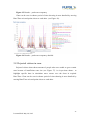
1
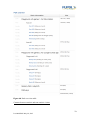
Zagreb-Open Green Park User Manual Table of contents General information ....................................................................................................... 5 1 2 Authorization .......................................................................................................... 5 1.1 User roles......................................................................................................... 5 1.2 Manage users ................................................................................................... 6 1.2.1 Add new user ........................................................................................... 6 1.2.2 Manage existing user ............................................................................... 6 Configuration .......................................................................................................... 7 Occupancy Analysis....................................................................................................... 8 3 4 General description ................................................................................................. 8 3.1 Visitor profiles............................................................................................... 10 3.2 Zones and activities ....................................................................................... 19 Simulation ............................................................................................................. 23 4.1 New simulation creation................................................................................ 23 4.1.1 4.2 Simulation configuration ............................................................................... 24 4.2.1 5 Simulation copy ..................................................................................... 24 Park zones .............................................................................................. 25 Simulation results ................................................................................................. 34 5.1 Simulation algorithm ..................................................................................... 34 5.1.1 Summary: ............................................................................................... 34 5.1.2 Detailed information: ............................................................................. 34 5.1.3 Initial input information ......................................................................... 35 5.1.4 Zone surface size changing algorithm ................................................... 36 5.1.5 Decision making .................................................................................... 38 5.2 Simulation description and parameters ......................................................... 38 5.3 Zone surface size ........................................................................................... 39 2 Last modified: May 28, 2015 5.4 Zone size at the beginning and end of the simulation ................................... 40 5.5 Potential conflicts in zone ............................................................................. 42 5.6 Park maximum capacity for each zone ......................................................... 43 5.7 Park zone occupancy ..................................................................................... 44 5.8 Rejected visitors in zone ............................................................................... 45 5.9 Returning to start page .................................................................................. 46 5.9.1 Deleting simulation ................................................................................ 47 Layout Design .............................................................................................................. 48 6 General description ............................................................................................... 48 6.1 Introduction ................................................................................................... 48 6.1.1 6.2 7 Preliminary information ......................................................................... 49 Rules .............................................................................................................. 51 6.2.1 Zones ...................................................................................................... 51 6.2.2 Activities ................................................................................................ 52 6.2.3 Relationships between Zones and Activities ......................................... 55 Attributes .............................................................................................................. 55 7.1 Zagreb Green Park visitors ............................................................................ 55 7.1.1 New visitor ............................................................................................. 56 7.1.2 Read, update & delete visitor ................................................................. 57 7.2 Zagreb Green park Visitor profiles ............................................................... 58 7.2.1 New visitor profile ................................................................................. 58 7.2.2 Read, update & delete visitor profile ..................................................... 58 7.2.3 Zagreb Green park zones ....................................................................... 58 7.2.4 Create new park zone ............................................................................. 59 7.2.5 Read, update & delete zones .................................................................. 59 7.3 Zagreb Green park activities ......................................................................... 59 7.3.1 Create new activity ................................................................................ 59 3 Last modified: May 28, 2015 7.3.2 7.4 8 Read, update & delete activity ............................................................... 60 Zagreb Green park Activity Minimal Distances ........................................... 60 7.4.1 Create new distance ............................................................................... 60 7.4.2 Read, update & delete minimal distance................................................ 61 Construction.......................................................................................................... 61 8.1 Connection with Occupancy simulation ....................................................... 61 8.2 Creating new simulation................................................................................ 61 8.3 Accessing Layout design ............................................................................... 62 8.4 Introduction ................................................................................................... 63 8.5 Construction menu ........................................................................................ 64 8.5.1 Map resources ........................................................................................ 64 8.5.2 Zones and areas ...................................................................................... 65 8.5.3 Activities and Facilities.......................................................................... 67 8.5.4 Weather and day options ........................................................................ 70 8.5.5 Minimal distance conflicts ..................................................................... 70 8.5.6 Save layout ............................................................................................. 71 8.5.7 Get information ...................................................................................... 71 8.5.8 Profile and activity list ........................................................................... 74 4 Last modified: May 28, 2015 General information 1 Authorization Working with Zagreb-Open Green park simulation software requires authorization. Authorization includes username and password (see Figure 1). Figure 1. Simulation software authorization Software provides two user roles with different access rights: User Admin 1.1 User roles “User” user role can access both simulations, their attribute management, create new simulations etc. “Admin” user role can do everything with simulation and additionally create new users, manage existing ones as well as manage configuration for simulation software. Admin can access mentioned sections by clicking or their titles in the menu (see Figure 2). 5 Last modified: May 28, 2015 Figure 2. Start page view for admin 1.2 Manage users User section is intended for user management - new users can be added and existing can be changed or deleted. 1.2.1 Add new user To add new user, click on "New User" in the menu on the top. It opens up registration form with username and password fields, "enabled" checkbox and user role list. Click and hold CTRL button on keyboard and select the roles to add more than one role to the user. Mandatory input fields are marked with *. 1.2.2 Manage existing user Although all the information about registered user is displayed in the table, it can also be seen by clicking on username in the list. It opens up all table with information and option buttons - "Edit" and "Delete". Click on "edit" to edit existing user. After clicking on the button, it opens up form as like creating new user, only in editing view all the fields are filled with user's existing information (except the password field). Click and hold CTRL button on keyboard and select the roles to add more than one role to the user. Changes can be saved by clicking "Update" button. 6 Last modified: May 28, 2015 2 Configuration Configuration is section for system administration and must not be changed without significant reason! It contains simulation model settings data. Configuration can be edited or deleted by clicking on its title in list and continued with "Edit" or "Delete" buttons. New can be added by clicking "New Configuration" link in the menu. Incorrectly set configuration will lead to crash of simulation software! 7 Last modified: May 28, 2015 Occupancy Analysis 3 General description Zagreb Green Park is agent-based simulation model designed in RePast environment (see Figure 3). The simulator is aimed to general square planning through potential occupancy analysis and park layout design and exploitation. Figure 3. Zagreb Open Green Park Simulator architecture The Occupancy Analysis simulator and the Layout Design and Exploitation simulator can be used together or separately. The Occupancy Analysis Simulation is based on statistical data (typical visitor and accompanying person / animal characteristics, time of arrival, list of desirable activities and probability of their choice), profile distribution on weekdays and weekends, as well as the minimal determined visitors’ service area allows creating a rough and hypothetical distribution of park zones. It is possible to ascertain the number of visitors in each zone in the simulated time slot, as well as determine the number of rejected visitors if the particular zone was totally occupied. This simulator takes into account the size of each activity and allows specifying the size of zones by summing up activity areas, as well as allows modification and creation the new visitor profiles during Green Park exploitation ensuring replacing 8 Last modified: May 28, 2015 theoretical assumptions about visitor distribution with real data and taking also into account meteorological information. Distances and possible conflicts between intermediary activities are being controlled. Activity/equipment inspection and/or maintenance deadlines are determined to permit planning the work of support services and predict servicing costs. Simulation days include weekdays and the weekend i.e. one full week. Depending on the date entered, the weekday is determined and simulation is performed for the selected amount of days. Simulation length determines result credibility because it anticipates the distribution of simulation results to conform to the normal distribution of probabilities. Result levelling can be observed visually but in keeping with classic methods it can be assumed that a 95% credible result can be achieved if the number of simulation cycles (days) are 30 or more. All activities are distributed over 16 zones in the park. The designer of the park has specified these. The same name activities can be located in different zones. The potential maximum number of visitors determines the required minimum area of a zone. If the initially determined zone area is too small, the disappointed visitor goes to another priority activity or leaves the park. If within one activity the presence of people with autism as well as other visitors is detected, the possibility of conflict is predicted. The use of the Zagreb Green Park Occupancy Analysis simulator allows the possibility to answer the following questions: • What is the minimal square of the park zones? • How many people had limited access to their favourite activity? • Are some potential conflicts predicted? However, the above-mentioned simulation provides information on the potential size of the zone area based on the potential number of visitors, but it does not take into account the locations and square of activities/facilities and reasonable distances between intermediary activities. The Zagreb Open Green Park Layout Design uses the operational data from the Zagreb Green Park Occupancy Analysis but allows for interactive layout design using spatial graphical information. The simulator takes into account: • Activities / equipment square size and inspection deadlines; 9 Last modified: May 28, 2015 • The meteorological conditions; • The opportunity to make changes to existing profiles and create new profiles by entering real data after commencing park operations; • Interactive layout design options; • The opportunity to report an occupancy and conflicts prediction for potential visitors through the Internet on the Zagreb Municipality website; • Conflict predictions for intermediary activities; • Park maintenance service job scheduling events. The Zagreb Open Green Park Layout Design simulator provides an opportunity to create a more accurate zoning distribution because it is not based on the individual comfort area determined for each visitor but on the defined square size of the activity and the maximum number of simultaneous visitors for this activity. Simulation system is available at http://prod.fupol.lv:8080/FupolSimulatorGui/ Recommended web browser is Google Chrome. 3.1 Visitor profiles Visitor profiles depend on the attributes: Age: Age of the citizens Domain: 0 - 120 defining ranges of age Gender: Gender of the citizens Domain: M (Male) or F (Female) ChildrenFamU: Number of children (under 18) in the family unit Domain: 0 - 10 AutisticDisorder: Shows if user profile has autistic disorder Domain: 1 (has disorder) or 0 (not autistic) HouseType: Type of house. It is different to live in an apartment than in a house. Domain: 1 - Apartment 2 - Town house without too much garden 3 - House with garden Dog: Existence of dog in family Domain: 1 (has dog) or 0 (no dog) Tables have 4 columns in this order: the name of the attribute, exact value if the attribute must have one, and minimum and maximum values if the attribute must be 10 Last modified: May 28, 2015 greater or equal than the minimum and less or equal than the maximum. When some attribute just has a minimum value, it means that the value must be greater or equal than that value; and when they just have a maximum value, it must be less or equal than that value. P1: P2: P3: P4: 11 Last modified: May 28, 2015 P5: P6: P7: P8: 12 Last modified: May 28, 2015 P9: P10: P11: P12: 13 Last modified: May 28, 2015 P13: P14: P15: 14 Last modified: May 28, 2015 P16: P17: P18: P19: P20: 15 Last modified: May 28, 2015 P21: P22: P23: P24: 16 Last modified: May 28, 2015 P101 P102 P103 P104 17 Last modified: May 28, 2015 P105 P106 P107 P108 18 Last modified: May 28, 2015 P109 P110 3.2 Zones and activities All activities are distributed over 16 zones in the park. The designer of the park has specified these. The same name activities can be located in different park zones. List of zones: 19 Last modified: May 28, 2015 Z1: Playground with games 1, for little children Z2: Playground with games 2, for younger school age Z3: Playground with games 3, for adolescents Z4: Sandbox Z5: Grass zone (with some trees to have some shade) Z6: Picnic zone (with tables and benches) Z7: Bike training ground (with basic traffic signs and rules) Z8: Sensory Park: Labyrinth Z9: Sensory Park: Music bells corner Z10: Sensory Park: aromatic herbs garden Z11: Sensory Park: building in the nature zone Z12: Sensory Park: amphitheatre Z13: Sensory Park: paths with different colours, textures and training ground for motoric tasks (jump, skip over, scrape through, reach and pull, etc.) Z14: Sensory Park: Fountain Z15: Pathways Z16: Bocce ball fields The list of possible activities, including activities for autistics, is: A1: Walking through the park pathway A2: Sitting on a bench A3: Sitting around a table A4: Feeding children A5: Playing in the Sandbox A6: Sitting on the grass A7: Sitting and playing on the grass A8: Swinging A9: Sliding down the toboggan (slide) A10: Spinning on roundabouts A11: Climbing on monkey bars A12: Roller skating A13: Playing ball on the grass 20 Last modified: May 28, 2015 A14: Playing rackets on the grass A15: Riding a bicycle A16: Playing football A17: Playing basketball A18: Skateboarding A19: Playing social games sitting around a table A21: Walking with a dog A22: Touching objects and surfaces A23: Playing frisbee A24: Playing with a dog A25: Playing bocce ball A26: Resting A27: Playing in the labyrinth A28: Standing A29: Standing with a parm A30: Watching water movement and/or listening the sound of the water A31: Following the paths with motoric tasks A32: Walking through the labyrinth A33: Sitting in the aromatic herbs garden A34: walking through the aromatic herbs garden A35: Listening bells sounds A36: Playing passing obstacles (climbing, crawling, going in and out, etc.) A37: Having a party in the amphitheatre A38: Playing theatre games A39: Playing in the Sensory Park The same name activities can be located in different zones. Following table in Figure 4 indicates all the possible activities for each zone. 21 Last modified: May 28, 2015 Figure 4. Zone and activity compatibility table 22 Last modified: May 28, 2015 4 Simulation 4.1 New simulation creation „Zagreb-Open Green Park Occupancy Analysis” link has to be clicked to create new Zagreb Green park simulation. (see Figure 5). Figure 5. Start page simulation list. After clicking on link mentioned above system opens basic information form to fill (see Figure 6) – „Title” and „Description” (of simulation) fields needs to be filled. Also simulation titles must be unique (Occupancy analysis and Layout Designs cannot have the same title as well). When filling those fields click „Next step” button to move further. Figure 6. Basic information form. 23 Last modified: May 28, 2015 4.1.1 Simulation copy To start new simulation, saving all the input data from another simulation and, for example, changing one or two parameters, the simulation copy can be created. To do so, click on the 'Start similar simulation' link in simulation results. It takes user through the same simulation creation steps as for new simulation, but saving data from previous simulation in all the input fields. Adjust initial data for the new simulation and run it the same way as all the other simulations. 4.2 Simulation configuration This step requires all the input parameters for the simulation (see Figure 7). Numbers in brackets shows range for each input field: Simulation date - click on that empty text field for calendar to pop up. Choose modeling date or fill it in format shown (mm/dd/yyyy i.e. 01.10.2013); Simulation period - shows an amount of days to be simulated; Park visitors per day - will be possible average number of people (per day) visiting the park; Persons with autisms - amount of autists in park; Accompanying persons - amount of accompaniers to all the autists. Figure 7. Simulation parameters. 24 Last modified: May 28, 2015 In „Configure park zones” section are defined all the park zones (16). Each zone requires it’s surface area/size (m2) and activities to perform in the zone. Only compatible activities for each zone are offered to choose from. Click the checkbox in front of each activity to add activities one by one or click „Select all”/”Select none” links to select/deselect all activities proposed for specific zone. 4.2.1 Park zones 4.2.1.1 Park zone - Playground with games 1, for little children First zone in the list is „Playground with games 1, for little children”, that is most suitable for little childer in pre-school age. In this are can be performed following activities (see Figure 8): Swinging; Riding a bicycle; Feeding children; Standing; Spinning on roundabouts; Sitting on a bench; Sliding down the toboggan (slide); Climbing on monkey bars; Roller skating; Standing; Standing with a pram. Figure 8. Playground with games 1, for little children 25 Last modified: May 28, 2015 4.2.1.2 Park zone - Playground with games 2, for younger school age „Playground with games 2, for younger school age” zone is most suitable for first year primary school children. Activities to plan in this area are as follows (see Figure 9): Swinging; Sliding down the toboggan (slide); Sitting on a bench; Standing with a pram; Standing; Spinning on roundabouts; Riding a bicycle; Climbing on monkey bars; Roller skating. Figure 9. Playground with games 2, for younger school age 4.2.1.3 Park zone - Playground with games 3, for adolescents „Playground with games 3, for adolescents” zone is created for adolescents. Following activities can be performed (see Figure 10): Standing with a pram; Swinging; Standing; Spinning on roundabouts; Sitting on a bench; Sliding down the toboggan (slide). 26 Last modified: May 28, 2015 Figure 10. Playground with games 3, for adolescents 4.2.1.4 Park zone - Sandbox „Sandbox” zone is area for little children to play or their parents to watch them. Activities allowed (see Figure 11): Sitting on a bench; Playing in the Sandbox; Standing. Figure 11. Sandbox 4.2.1.5 Park zone - Grass zone (with some trees to have some shade) „Grass zone” is recreational for people in any age. There are some trees for the shade. There can be performed these activities (see Figure 12): Playing rackets on the grass; Playing football; Feeding children; Standing; Playing ball on the grass; Sitting on the grass; Playing with a dog; Resting; Playing frisbee; Sitting and playing on the grass; 27 Last modified: May 28, 2015 Sitting on a bench. Figure 12. Grass Zone 4.2.1.6 Park zone – Picnic zone (with tables and benches) Picknic zone with tables and benches offers activities as follows (see Figure 13): Standing with a pram; Feeding children; Standing; Resting; Playing social games sitting around a tabele; Sitting around a tabele. Figure 13. Picnic zone 4.2.1.7 Park zone - Bike training ground (with basic traffic signs and rules) „Bike training ground (with basic traffic signs and rules)” is made for bike, skateboard, roller riding begginners to learn basics of traffic. Possible activities (see Figure 14): Skateboarding; Sitting on a bench; Standing; Riding a bicycle; Roller skating. 28 Last modified: May 28, 2015 Figure 14. Bike training ground 4.2.1.8 Park zone – Sensory Park: Labyrinth „Sensory Park: Labyrinth” offers activities as follows (see Figure 15): Touching objects and surfaces; Walking throught the labyrinth; Playing in the labyrinth ; Standing. Figure 15. Sensory Park: Labyrinth 4.2.1.9 Park zone – Sensory Park: Music bells corner „Sensory Park: Music bells corner” offers activities as follows (see Figure 16): Touching objects and surfaces; Standing with a pram; Sitting on a bench; Standing; Listening bells sounds. Figure 16. Sensory Park: Music bells corner 29 Last modified: May 28, 2015 4.2.1.10 Park zone – Sensory Park: Aromatic herbs garden „Sensory Park: Aromatic herbs garden” offers activities as follows (see Figure 17): Touching objects and surfaces; Standing with a pram; Walking through the aromatic herbs garden; Sitting in the aromatic herbs garden; Sitting on a bench; Standing. Figure 17. Sensory park: aromatic herbs garden 4.2.1.11 Park zone – Sensory Park: Building in the nature zone „Sensory Park: Building in the nature zone” offers activities as follows (see Figure 18): Touching objects and surfaces; Playing passing obstacles (climbing, crawling, going in and out, etc.); Sitting on a bench; Standing. Figure 18. Sensory Park:building in the nature zone 4.2.1.12 Park zone – Sensory Park: Amphitheatre „Sensory Park: Amphitheatre” offers activities as follows (see Figure 19): 30 Last modified: May 28, 2015 Touching objects and surfaces; Resting; Playing theatre gaumes; Standing; Having a party in the amphitheatre. Figure 19. Sensory Park: Amphitheatre 4.2.1.13 Park zone – Sensory Park: Paths „Sensory Park: Paths” offers activities as follows (see Figure 20): Touching objects and surfaces; Standing with a pram; Following the paths with motoric tasks; Standing. Figure 20. Sensory Park: paths 4.2.1.14 Park zone – Sensory Park: Fountain „Sensory Park: Fountain” offers activities as follows (see Figure 21): Touching objects and surfaces; Standing with a pram; Feeding children; Sitting on a bench; Resting; Standing; 31 Last modified: May 28, 2015 Watching water movement and/or listening the sound of the water. Figure 21. Sensory Park: Fountain 4.2.1.15 Park zone – Sensory Park: Pathways „Sensory Park: Pathways” offers activities as follows (see Figure 22): Standing with a pram; Walking through the park pathway; Roller skating; Walking with a dog; Standing; Riding a bicycle; Skateboarding. Figure 22. Pathways 4.2.1.16 Park zone – Sensory Park: Bocce ball fields „Sensory Park: Bocce ball” offers activities as follows (see Figure 23): Sitting in a bench; Standing; Playing bocce ball. 32 Last modified: May 28, 2015 Figure 23. Bocce ball fields Zone block (see Figure 24) can be opened by clicking on it’s name. „Start simulation” button can be pressed after filling all the zone size fields and choosing activities for zones. Those zones blocks, which not needed for the simulation, can be left closed. Figure 24. Closed zone blocks Simulation time can vary and it depends on the input data complexity. When simulation is finished all the results are shown with no interaction or help by user. 33 Last modified: May 28, 2015 5 Simulation results 5.1 Simulation algorithm For better result understanding, document includes explanation (see Figure 25) of how the simulator works and calculates zone surfaces and conflicts. Also information is given about simulation's stochastic factors. 5.1.1 Summary: Initial zone size - set before simulation by user Max zone surface - highest surface size that could have been assigned to the zone at any point of simulation (not necessarily at one point for all the zones). Min zone surface w/ rejected - surface size that is needed for the zone so no visitors would be rejected at any moment of the simulation time. 4m2 for each visitor. Surface for one visitor is 4m2. Except in pathway where it is 1m2 per person. Changes of zone size (according to the occupancy and capacity of previous day) are made at 2 a.m. every day of simulation. Available surface is total of all the available unused surface of the zones. Zone size after simulation is calculated by distributing available surface throughout all the overoccupanced zones. 5.1.2 Detailed information: Timing Data about users is gathered every minute (which users come to the zone and which go away) and ranges of 15 minute sum is displayed in charts and tables. The same situation is with occupancy conflicts. Simulation checks users every minute and total amount of conflicts of each 15 minute time period is shown in charts. 34 Last modified: May 28, 2015 Zone sizes (according to its' previous day changes, available surface (at the end of the day)) and occupancy conflicts (total during last 15 minute time period) are changed every day at 2 a.m. 5.1.3 Initial input information Autists' accompanies are not counted in park as visitors. Persons with autism occupy the same amount of surface as regular park visitors. Initial zone size Those are m2 given to each zone before the simulation. Written by user. Max zone surface Max zone surface is calculated with formula: (visitor count * area needed for one visitor). Minimum surface size needed for each visitor is 4m2. For 10 visitors needed surface is 10 * 4 = 40m2 Different situation is with pathways. Visitor on pathway needs only 1m2 free space for himself at any time, so visitor count on pathway equals surface size (in m2). If there are 10 visitors, needed surface for pathway is 10m2. Rejected zone size is calculated as 1m2 (for pathways) or 4m2 (for any other zone) needed for each rejected visitor. Rejected zone size counts maximum number of visitors who want to come to the zone at one 15 min time period (including allowed and rejected visitors) and multiplies it with size needed for each visitor. Max zone size is changed In the zone surface size table max zone surface (for each zone) is shown at each zone's top (most visitors) visiting moment, not all (necessarily) at the same time. Park zone max surface diagram shows zone changes during the simulation, when all the initially assigned surface is distributed between all the zones. Zone size changes are performed each day @ 2am. 35 Last modified: May 28, 2015 Zone size after simulation pie chart shows final data distribution. At first, it distributes available surface (that is taken from the zones, that have part of its' surface unused) between all the overused areas. Plus it involves left-over (after assigning needed surface to overoccupanced zones) available park surface equal distribution between all the zones that had been overoccupanced current day. Zones are changing surface sizes gradually, leaving itself significant amount of unused size for extra visitors. Rejected visitors in zone diagram shows how many visitors are rejected in each 15 minute time period (total number of current time period). Min zone surface with rejected visitors shows what would be the minimum zone size needed so no visitors would be rejected from current zone at any moment for each visitor. Explanation of max zone size If one zone has sudden (in one or two 15 minute time periods) huge amount of occupancy conflicts, only part of needed surface is added. Even if there is so much surface available, it will give more, only if this huge amount of conflicts will remain as high further on. There is no need to add huge surface size to the zone, if high number of visitors are anly at one point of the day. That's why sometimes some zones can have a lot of unused surface, but others still have rejected visitors at some point (it's because zone is overoccupanced for short amount of time). 5.1.4 Zone surface size changing algorithm Figure 25 shows visual explanation. Algorithm is run based on occupancy conflicts and previous day zone changes. First all the available surface is gathered. o Zone can give away part of it's surface if it has some unused area. o If zone hasn't decreased previous day or 75% of previous day growth is less than 50% of unused surface size - zone gives away 50% of it's unused area. 36 Last modified: May 28, 2015 o If zone has increased previous day and 50% of unused surface is more than 75% of previous day's growth --> zone gives away 75% of area that was increased previous day. o Surface from each zone is added to "Available surface". After collecting available surface, it is distributed between the zones. o Extra surface is given to those zones that have had occupancy conflicts on current day. o For each overoccupanced zone it's occupancy ratio is calculated (this zone's occup. conflicts / all occup. conflicts). o Possible given surface is calculated by available surface * occupancy ratio. o If zone has increased previous day or 75% of previous day decrease is more than possible given surface --> zone is increased by possible given surface o If zone has decreased previous day and possible given surface is more than 75% of previous day decrease --> zone is increased by 75% of area that was decreased previous day. If some part of available surface is left over after assigning it to overused zones, is equally distributed between all previously overused areas. Figure 25. Simulation algorithm 37 Last modified: May 28, 2015 5.1.5 Decision making In the Zagreb Occupancy Analysis simulation there are decisions for the users to make - at some points they have multiple options, which zone to go to, basing on their day plan (for example, where to eat lunch). Such decisions have incalculable impacts from everyday situations, so these decisions are calculated randomly. So basing on these stochastic decisions, simulation results with absolutely identical input data might turn out different - once a zone will be overloaded with people, sometimes it might be half-empty. 5.2 Simulation description and parameters After clicking „Start simulation” the result page is shown. As multiple days and situations are simulated, there is a high probability that user needs to wait multiple seconds until seeing end results. While simulation is still running, page shows details and configuration of simulation as well as it’s progress with percentage rate (see Figure 26). Selected zone information (their sizes and selected activities) are also available while waiting for simulation to finish. Click „show” link by the „Selected zone activities” title to see the list. Figure 26. Simulation still running List with selected zone activities are shown as follows (see Figure 27). 38 Last modified: May 28, 2015 Figure 27. Selected zone activities Click „hide” link to hide the list again. When simulation is completed, result tables and charts appear on screen. 5.3 Zone surface size „Zone surface size” table (see Figure 28) shows values for all the 16 zones. Columns describe: Initial size shows initial (user’s input) size Finish size is the zone size that was given to the zone at the last iteration of the simulation Max occupied zone surface shows highest amount of zone size that could be given to this zone at any point of simulation Max occupied zone with rejected visitors shows minimal size of the zone that is needed to fit all the people at one most occupanced moment (including rejected visitors), which means that it is maximal ever needed zone size. 39 Last modified: May 28, 2015 Figure 28. Zone surface size 5.4 Zone size at the beginning and end of the simulation First pie chart shows initial zone sizes (see Figure 29) and final values at the end of simulation (see Figure 30). Total park size is shown at the bottom of each chart. 40 Last modified: May 28, 2015 Figure 29. Initial zone size Figure 30. Results – zone size after simulation Hover the mouse over preferred slice, to see each pie chart slice’s details (zone name, size in number and percent). 41 Last modified: May 28, 2015 5.5 Potential conflicts in zone Conflicts table shows problematic spots. One row corresponds to one conflict type – in certain zone happens conflict between two certain profiles each doing their own certain activity (see Figure 31). Last column shows possible conflict number. Regular visitors’ conflicts between different activities and different profiles are shown in first table. Table that shows autistic visitor conflicts doing the same activity in the same place is shown under the first one (see Figure 32). In this table each row indicates how many conflicts occurred during simulation (see Figure 32). Zone - zone where occurred conflict. Activity1 - activity to be performed, Activity2 - conflicting activity, Profile1 - visitors profile who wanted to perform Activity1, Profile2 - visitors profile who performed Activity2, Conflicts number of conflicts between these activities and profiles. In autistic visitor’s table all the conflicts occur in between the same activity. Autistic visitor profiles range [101;110]. These tables are interactive, table headers are clickable to sort/group table rows. Figure 31. Potential conflicts in grass zone. 42 Last modified: May 28, 2015 Figure 32. Potential conflicts with autistic visitors. 5.6 Park maximum capacity for each zone This chart shows zone area size changes dynamically in time. Park zone max surface indicates the maximum capacity for each zone in particular time. During the simulation park max surface may increase or decrease depending on occupancy. Zones max surface decreases incremental till there is no unused space left. Max surface increases incremental, each step increasing max surface based on occupancy. (see Figure 33). Figure 33. Results – park zone max surface Moving mouse over max surface chart changes the data in the list at the right side of chart according to time axis point the mouse is hovering over in that moment. For 43 Last modified: May 28, 2015 example, when mouse is at 2013/09/17 15:45 surface for zone 1 (playground for little children) is 74.19 m2, but for younger shool age children - 103.19 m2. To show the chart for shorter period of time in more detailed grid, move the end points of Date/Time axis towards each other. (see Figure 34). Figure 34. Results – park zone max surface 5.7 Park zone occupancy This chart shows occupancy of each zone in certain time (each hour). To highlight specific hour in simulation move mouse over the chart in required Date/Time. (see Figure 35). 44 Last modified: May 28, 2015 Figure 35. Results – park zone occupancy Chart can be seen in shorter period of time showing it more detailed by moving Date/Time axis end points closer to each other. (see Figure 36). Figure 36. Results – park zone occupancy detailed 5.8 Rejected visitors in zone Rejected visitors chart shows amount of people who were unable to go to certain zone because of insufficient zone size (see Figure 37). As in previous charts - to highlight specific hour in simulation move mouse over the chart in required Date/Time. Chart can be seen in shorter period of time showing it more detailed by moving Date/Time axis end points closer to each other. 45 Last modified: May 28, 2015 Figure 37. Results – park zone occupancy conflicts If there are lots of visitors rejected regularly, corresponding zone size should be considered for expansion. If rejection happens only at one specific time period, no further actions are certainly necessary. 5.9 Returning to start page At any point of simulation (preparation, simulating, reviewing results) it is possible to return to the start page by clicking „Home” link at the left top corner of page (i.e. visible in Figure 38) From homepage you can start new simulation by clicking on links as explained previously in the document. Under new simulation section there is a list of previous simulations (last ten are shown). If simulation is still in draft (simulation hasn’t finished yet) there are options to edit it or delete (options available for each simulation at the end of it’s row). If simulation is finished, the options are „view results” and „delete” (see Figure 38). 46 Last modified: May 28, 2015 Figure 38. Start page 5.9.1 Deleting simulation Occupancy Analysis simulations are linked with connected Layout Designs. It is impossible to delete Occupancy simulation if there are connected Layout simulations – at the deletion error message (see Figure 39) shows the list of all Layout designs that are connected to particular Occupancy simulation. To delete Occupancy Analysis, all the connected Layouts must be removed beforehand. Figure 39 - Deletion error message 47 Last modified: May 28, 2015 Layout Design 6 General description 6.1 Introduction The simulation objective for the Green Park design in Zagreb is to provide the best solution for the facilities that would be included in the 2000m2 of green area situated near the Autism Centre. The design must satisfy most of the potential visitors’ demands and must encourage interactions between autistic and non-autistic visitors, while avoiding possible conflicts between them. At the same time, possible conflicts between all kinds of visitors must be avoided. For example, nobody likes to have dogs around children while they are playing in a playground. The Green Park consists of different zones and different activities to be performed inside these zones. Each activity is related to one or more zones, depending if the activity is performable inside them. Citizens of the neighbourhood, people with autistic disorder, their monitors and their familiars, are considered. Depending on different attributes (age, gender, children, among other), they are classified by profiles. Each profile, being used to go to the park, is related with several activities to be performed in the park at a specific time frame, which can differ during the week and during the weekend. These relations are called "rules", and the time frame indicates the interval of time that the person uses to go to the park; however, each person decides how long time (inside the time frame) it stays in the park. Each person has a predefined behaviour depending on the profile; however, its behaviour can be modified depending on its interactions (affinity, proximity, etc.) with other persons. Person in the park will be taken in count to control the amount of people performing each activity inside each zone. And each person will occupy a certain amount of surface depending on the activity it performs and the zone where it is in. If zone or activity is full, others won't be able to participate there until free space is available. 48 Last modified: May 28, 2015 The Zagreb Open Green Park Layout Design simulator provides an opportunity to create a more accurate zoning distribution because it is not based on the individual comfort area determined for each visitor but on the defined square size of the activity and the maximum number of simultaneous visitors for this activity. 6.1.1 Preliminary information Main information that accents results of Zagreb Green Park simulation is statistical data about people - their visitor profiles and any relevant information about autistics and their behaviours in the park. City of Zagreb has described specific information about profile differences and their characteristics. Greatest differences involve autistic and non-autistic people. That’s why it is important to describe their profile details. 6.1.1.1 Non-autistic people The different scenarios considered are: 1) Mother with children in pram age from 0-1 year: walking through the park pathway (40%), sitting on a bench (40%), sitting around the table and feeding children (20%) 2) Children between 1-2 years of age: playing in the sand box (50%), sitting on the grass and playing (30%), swinging and sliding down the toboggan (20%) 3) Children between 3-6 years of age – swinging, sliding down the toboggan, spinning on roundabouts and climbing on monkey bars (60%), playing ball on the grass (20%), riding a bicycle and roller skating (20%) 4) Male children between 6-9 years of age – riding a bicycle (40%), playing football on the playground (40%), sliding down the toboggan, spinning on roundabouts and climbing on monkey bars (20%) 5) Female children between 6-9 years of age – roller skating (40%), playing ball and rackets on the grass (40%), swinging, sliding down the toboggan, spinning on roundabouts and climbing on monkey bars (20%) 6) Male children between 9-13 years of age – riding a bicycle (40%), playing football on the playground (40%), sitting on benches (20%) 7) Female children between 9-13 years of age – roller skating (40%), walking through the park pathway (30%), sitting on a bench (30%) 49 Last modified: May 28, 2015 8) Male children between 13-17 years of age – sitting on benches (40%), playing basketball and football (40%), skateboarding (20%) 9) Female children between 13-17 years of age – sitting on benches (40%), walking through the park pathway (40%), roller skating (20%) 10) Young men between 17-24 years of age – sitting on benches (50%), playing basketball and football (50%) 11) Young women between 17-24 years of age – sitting on benches (50%), walking through the park pathway (50%) 12) Families with small children, parents and/or grandparents from 24-34 years, living in apartments – walking through the park pathway (40%), sitting on the grass and hanging out (30%), children use playground toys (30%) 13) Families with small children, parents and/or grandparents from 24-34 years, living in family houses – adults sitting on the bench while the children use the playground toys (100%) 14) Adults from 35-55 years of age – sitting on benches (50%), walking through the park pathway (50%) 15) Adults from 65+; sitting on benches (40%), walking through the park pathway (30%), sitting around the table and playing social games (30%) 16) People with dogs – walking through the park pathway (100%) 6.1.1.2 Autistic people Besides the scenarios, there is other information related to autistics that is considered and is included in this section. Activities for children/persons with autism disorder, regardless of chronological age and gender, but depending on individual abilities and interests (some part of the devices are in accordance with the weight and height of adolescents and adults): 1) Walking and running through the park pathway, 2) Sitting on benches, 3) Climbing and jumping from different areas, 4) Touching different objects and surfaces 5) Playing ball, Frisbee or racket on the grass, 50 Last modified: May 28, 2015 6) Dragon kiting, 7) Playing in the sandbox, 8) Swinging, sliding down the toboggan, spinning on roundabouts, climbing on monkey bars, 9) Less often roller skating or skateboarding or riding a bike, shooting basket or ball, bowling or playing bocce ball. Potential autistic visitors of the park for this special case are from 7 to 21 years, and they can be classified as follows: 1) Male from 7-21 years 2) Female from 7-21 years 3) Professional companions and personal assistants: monitor, assist and encourage the people by using the devices themselves in order to motivate them on action 4) Parents of children with autism disorder (occasionally when visiting the children in accommodation or regularly when leaving school): small number of visitors 6.2 Rules The information presented previously in the document is used as a base to define the rules. These rules depend on the people attributes (non-autistics and autistics), and they will define the activities to be performed, the time frame and the companion when performing the activity. For example, if the age of the person is 3 years, it cannot go alone to the park; it must have some companion (babysitter, father, mother or some other familiar). 6.2.1 Zones These are all the zones that can be modelled. 51 Last modified: May 28, 2015 List of zones: Z1: Playground with games 1, for little children Z2: Playground with games 2, for younger school age Z3: Playground with games 3, for adolescents Z4: Sandbox Z5: Grass zone (with some trees to have some shade) Z6: Picnic zone (with tables and benches) Z7: Bike training ground (with basic traffic signs and rules) Z8: Sensory Park: Labyrinth Z9: Sensory Park: Music bells corner Z10: Sensory Park: aromatic herbs garden Z11: Sensory Park: building in the nature zone Z12: Sensory Park: amphitheatre Z13: Sensory Park: paths with different colours, textures and training ground for motor tasks (jump, skip over, scrape through, reach and pull, etc.) Z14: Sensory Park: Fountain Z15: Pathways Z16: Bocce ball fields 6.2.2 Activities The complete list of activities is listed below: A1: Walking through the park pathway A2: Sitting on a bench A3: Sitting around a table 52 Last modified: May 28, 2015 A4: Feeding children A5: Playing in the Sandbox A6:Sitting on the grass A7:Sitting and playing on the grass A8: Swinging A9: Sliding down the toboggan (slide) A10: Spinning on roundabouts A11: Climbing on monkey bars A12: Roller skating A13: Playing ball on the grass A14: Playing rackets on the grass A15: Riding a bicycle A16: Playing football A17: Playing basketball A18: Skateboarding A19: Playing social games sitting around a table A21: Walking with a dog A22: Touching objects and surfaces A23: Playing Frisbee A24: Playing with a dog A25: Playing bocce ball A26: Resting 53 Last modified: May 28, 2015 A27: Playing in the labyrinth A28: Standing A29: Standing with a parm A30: Watching water movement and/or listening the sound of the water A31: Following the paths with motoric tasks A32: Walking through the labyrinth A33: Sitting in the aromatic herbs garden A34: walking through the aromatic herbs garden A35: Listening bells sounds A36: Playing passing obstacles (climbing, crawling, going in and out, etc.) A37: Having a party in the amphitheatre A38: Playing theatre games A39: Playing in the Sensory Park 54 Last modified: May 28, 2015 6.2.3 Relationships between Zones and Activities Each activity can be related to different zones, and some of them can depend on the visitor profile. Following table shows available activities in each zone (see Figure 39). Figure 39. Activity and zone incompatibility table 7 Attributes 7.1 Zagreb Green Park visitors To edit Green Park visitors list, click on "Zagreb Green Park visitors" link on the very top of the page. (see Figure 40). Note: The attribute menu is available in all the pages except starting/home page. 55 Last Modified: May 28, 2015 Figure 40. Start page simulation list. It opens up visitors page with its' list and options. 7.1.1 New visitor To create new visitor, click on the "New Zagreb Green Park visitor" button on the top of the list (see Figure 41). It opens up all the possible parameters' input field list. Fields are: Profile - which visitor profile this visitor corresponds. choose from the list; Number of visitors - how many visitors will be in this group; Week day type - choose from the list; Weather type - choose from the list; Hours (00H - 23H) - percentage of all the time spent in park in this particular hour; Activities - percentage of all the time spent in park doing this particular activity. When filling all the needed fields, click "Create" button at the bottom to create new visitor and open it's details page. Note: User has to fill out only those fields that one is about to use. 56 Last Modified: May 28, 2015 Figure 41. Zagreb Green park visitor list 7.1.2 Read, update & delete visitor To show particular visitor details, click on it's profile link (first column in the table). After opening up one particular visitor, there are his details table and two possible options (positioned at the bottom of the page) - Edit and Delete (see Figure 42). After clicking "Edit" button, the same input form (as creating new visitor) appears. Follow the rules mentioned in previous point to fill the form. After clicking "Delete", accept the popup box to complete deletion. Figure 42. Zagreb Green park visitor details 57 Last Modified: May 28, 2015 7.2 Zagreb Green park Visitor profiles To edit Green Park visitors’ profiles list, click on "Zagreb Green Park visitor profiles" link on the very top of the page (see Figure 43). It opens up visitors profiles page with its' list and options. Note: Working with visitor profiles is similar to visitors. See the section above for more details. 7.2.1 New visitor profile To create new visitor, click on the "New Zagreb Green Park Visitor Profile" button on the top of the list. It opens up all the parameters' input fields. Fields are: Title - name of the visitor profile; Description - textual description about it's features. When filling all the needed fields, click "Create" button at the bottom to create new visitor and open it's details page. 7.2.2 Read, update & delete visitor profile To show one particular profile details, click on its title link (first column in the visitors table). Note: If system is at different section, click "Zagreb Green Park visitor list" button to go to the list. After opening up one particular visitor profile, there are two possible options (positioned at the bottom of the page) - Edit and Delete. After clicking "Edit" button, the same input form (as creating new profile) appears. Follow the rules mentioned above to fill the form. After clicking "Delete", accept the popup box to complete deletion. 7.2.3 Zagreb Green park zones To start working with Green Park zones, click on "Zagreb Green Park zones" link on the very top of the page (see Figure 41). It opens up zones page with its' list and options. 58 Last Modified: May 28, 2015 7.2.4 Create new park zone Click on "New zone" in the top menu bar to create new Zagreb Green Park zone. Choose all the parameters for new zone: Code - Identifier for each zone. Must be unique; Title - Zone title that will appear in all the zone lists. Must not be empty; Color - Hexadecimal html color code (six symbols). Inputted using visual color box; Activities - choose from the list. Hold CTRL button on keyboard while clicking to choose multiple activities. 7.2.5 Read, update & delete zones To show one particular zone details, click on its code link (first column in the visitors table). After opening up one particular zone, there are two possible options (positioned at the bottom of the page) - Edit and Delete. After clicking "Edit" button, the same input form (as creating new zone) appears. Follow the rules mentioned above to fill the form. After clicking "Delete", accept the popup box to complete deletion. 7.3 Zagreb Green park activities To start working with Green Park activities, click on "Zagreb Green Park activities" link on the very top of the page (see Figure 41). It opens up activities page with its' list and options. 7.3.1 Create new activity Click on "New activity" in the top menu bar to create new Zagreb Green Park activity. Choose all the parameters for new activity: Code - Identifier for each zone. Must be unique; Title - Zone title that will appear in all the zone lists. Must not be empty; Type - choose from the list; Icon - image file, that will represent the object on the map. 59 Last Modified: May 28, 2015 7.3.2 Read, update & delete activity To show one particular activity details, click on its code link (first column in the visitors table). Figure 43. Show one activity After opening up one particular activity, there are two possible options (positioned at the bottom of the page) - Edit and Delete. After clicking "Edit" button, the same input form (as creating new activity) appears. Follow the rules mentioned above to fill the form. After clicking "Delete", accept the popup box to complete deletion. 7.4 Zagreb Green park Activity Minimal Distances In this section minimal allowed distances between two activities are set. To start working with Green Park minimal distances, click on "Zagreb Green Park Min Distances" link on the very top of the page (see Figure 41). It opens up activities page with its' list and options. 7.4.1 Create new distance Click on "New Zagreb Green Park Min Distance" in the top menu bar to create new Zagreb Green Park minimal distance. Choose all the parameters for new distance: Activity 1 - Choose from the list; Activity 2 - Choose from the list; Min distance - Set minimal distance (meters) between chosen activities; 60 Last Modified: May 28, 2015 Both chosen activities are the ones between which the minimal distance will be set. That means - if activity1 and activity 2 will be placed closer than set in new "min distance", conflict will occur in simulation. 7.4.2 Read, update & delete minimal distance To show one particular distance details, click on its 'Activity 1' link (first column in the visitors table). After opening up one particular distance, there are two possible options (positioned at the bottom of the page) - Edit and Delete. After clicking "Edit" button, the same input form (as creating new distance) appears. Follow the rules mentioned above to fill the form. After clicking "Delete", accept the popup box to complete deletion. All those actions are the same as in previous options - activities, visitors etc. 8 Construction 8.1 Connection with Occupancy simulation Layout analysis (when created) can be connected with any of finished Occupancy analysis simulations. If simulations are connected, Layout can be designed only from those zones, which were chosen and had activities checked for Occupancy simulation. Also each zone's block shows min. zone size and user can follow that during the designing process. Additionally, each zone can have only those activities that were selected during the initialization of the Occupancy analysis. No data about amount of visitors distributed in zones or overall is inherited to Layout Design. If Layout is not connected with 1st simulation, any zone can be used and user can show (optional) preferred zone size to follow during the designing. Also all the activities and facilities are allowed for all zones. 8.2 Creating new simulation To create new simulation, choose "Zagreb Green Park Layout Analysis" from possible simulation list under "New Simulation" title by clicking on that link (see Figure 44). 61 Last Modified: May 28, 2015 Then system opens basic information form to fill (see Figure 44) – „Title”, „Description” fields need to be filled. And connection with occupancy analysis (optional) where one of finished 1st simulations must be chosen. If there is no need to make a connection, check the checkbox to hide the Occupancy simulation list. When filling those fields click „Next step” button to move further. Figure 44. Basic information form. 8.3 Accessing Layout design Layout designs can be used only by one user at a time. If one user is working with one, another cannot open, edit, save or delete this Layout design. Start page list has an indicator for those Layout designs that are being used by someone else. Trying to manage occupied Layout design will redirect user to the start page showing warning message with full information about the situation (see Figure 45). For as long as the first user is working with the Layout design and is still logged in, nobody can access the Layout. Others can access simulation 30 seconds after previous designer has logged out or closed the designing view. Note: These access restrictions apply to different usernames. If two people are logged in with the same username, they both will have access to the same Layout Design. Figure 45. Layout design access warning. 62 Last Modified: May 28, 2015 8.4 Introduction If Layout design was not connected with Occupancy analysis, at least one new zone has to be added, to start working with chosen simulation. This action can be performed by clicking „Add zone” in the middle of the page. After that popup box will appear with the list of all the possible zones. Choose one of those and click on that. To add it to the design – press „Add” button at the bottom of the list. (see Figure 46). If simulations are connected, all the zone blocks are already loaded into the view and no addition zones can be added. Figure 46. Zone list 63 Last Modified: May 28, 2015 To create more zones, click „Add zone” and perform activities mentioned above. After creating at least one zone construction menu with multiple sections becomes available. At the top there are „Weather” and „Day of week” sections (see Figure 46). Further down is design toolbox, that is divided into separate minimizable information windows - one for each park zone that is created and „Conflicts” section (see Figure 47). design toolbar can be hidden (widening the map full size) by clicking on the arrow next to it. Figure 47. Layout design view 8.5 Construction menu There are yellow question marks next to multiple sections' titles (Weather, Day of week, Park zone, Min. distance conflicts) in the construction menu. Clicking on them widens/opens up information window that doesn't interrupt started simulation. 8.5.1 Map resources Base layer of the construction is a map, that can be changed. Layout design provides Google Road map, Sattellite map, OSM map and Zagreb Geoportal API (that is a default choice). Map also shows top-left and bottom-right corner coordinates next to the map at corresponding corners. 64 Last Modified: May 28, 2015 8.5.2 Zones and areas To start construcing a zone, click on it's name in the construction menu to open it's window. At the top there is preferred size (if set; see Figure 48), progress and sugestion (what should be added or removed) for regular Layout design zones. Min. size for connected for connected ones and designed zone size for all the simulations. Figure 48. Preffered size for new zone Lower in the information window there are three performable options under the „Zone tool box” title – Navigate, Draw areas, Edit area (see Figure 49). Figure 49. Zone information window 65 Last Modified: May 28, 2015 To create first area, click on „Draw areas”. Then click on the map to create first corner of new area. After that you can drag mouse to other coordinates and click to create more peaks of the shape. To create last peak and finish drawing, double click on chosen position. While drawing a polygon, label with the size follows the mouse (see Figure 50). After finishing the shape popup box will appear. Write new area's name in the text field and click „Ok” to save it. Saved area will fix on the map with it's name in the center (see Figure 51). Figure 50. Creating a polygon Figure 51. New zone drawn To draw more areas in the same zone, perform those same actions again. 66 Last Modified: May 28, 2015 To draw areas in other zones, click on other zone’s name in the construction menu to maximize it’s information window. Then click „Draw areas” and continue with the same actions. All the areas created in the zone are shown in the information window as a list under „This zone’s areas in the park” title. Each item has name, size and it’s own options (rename, delete and auto-size). Click on chosen option to perform actions (see Figure 49). Confirm the action in popup box that will appear on the screen. Auto-size an area is made to fit the area in exact size (for example, if there are problems to fit exactly 200m2, but closest the user can draw manually, is 204m2). Auto sizing requires new desired size. By clicking "Resize", area changes to new size. Auto sizing works also on increasing zone's size (see Figure 52). Figure 52. Zone resing pop-up Note: Automatic zone sizing will make the most adequate area resize with percentually small changes. Resizing zone by more than 30% may completely lose it's initial form. If an area is needed to be changed, click "Edit area" under "Zone tool box" to activize this option. When it is activized, click on the area needed to be changed. Circles at the peaks, edges and center will appear. Click and hold on center circle to move area; Click and drag other circles to change edges and peaks. Note: Clicking "Edit area" in one zone's window will not allow to edit other zone's areas. 8.5.3 Activities and Facilities. To add new activity to the map, click on "Add object" option on the top left corner of the map. After that click on the place on chosen area where activity needs to be placed to open activity choice box (see Figure 54). For connected simulations box 67 Last Modified: May 28, 2015 shows only allowed activities and facilities. After selecting an activity popup window will appear (see Figure 53). Figure 53. Object parameters popup Figure 54. Activity adding box Note: Facilities and activities can be placed only in previously drawn area. Note: Drag mouse on image to see label with activity/facility description. Note: Object parameters popup has only two mandatory fields - 'Name' and 'Capacity per hour'. Maintenance numbers can be left empty - that is only for object report. If in the same zone the same facility type is added, object parameters popup shows value of the previous facility, thus saving time repeating input of all the same numbers again. After placing objects on the map four options can be performed. All the options links are placed on the top of the map (Add object, Move object, Edit object, Objects report; see Figure 47). Choose „Edit objects” to activate chosen option. Then click on the map on the object of interest to see it’s parameters window (see Figure 53). Change parameters if 68 Last Modified: May 28, 2015 needed. Click „Save” to save new parameters or „Delete object” to delete chosen object. Choose „Objects report” to activate chosen option. Then click on the map on the object of interest to see it’s report window. Report window shows previously input details in text as well as occupancy and rejected visitors charts in hour periods. Under the charts is „more info...” link. Clicking on that shows maintenance information and visitor profile distribution number and percentage (see Figure 56). Object's report information is based on data about visitors and their profiles that is inputted in attributes section of the simulator software. If system lacks data for chosen object in the attributes section in chosen weather and day conditions, informational pop-up is shown (see Figure 55). Figure 55. Object report info pop-up 69 Last Modified: May 28, 2015 Figure 56. Full object report 8.5.4 Weather and day options On the top of the menu there are weather and day options under these titles according to each one of them (Figure 47). Click on the sun or cloud's image to choose, respectively, sunny or rainy weather for the simulation. Chosen weather condition’s image will be framed with light border. To choose weekday (Monday to Friday) for simulation, click on „Weekday”; for weekend (Saturday and Sunday) click „Weekend”. Chosen day type will be framed with light border. 8.5.5 Minimal distance conflicts At the bottom of the menu there is „Minimal distance conflicts” section (see Figure 57). Under the title list of all the conflicts is located. Each item in the list 70 Last Modified: May 28, 2015 shows both objects conflicting, their existing distance and minimal distance for them to have no conflict. Map will zoom in objects exact position after clicking on it’s underlined name. Figure 57. Conflicts' section 8.5.6 Save layout Click "Save layout" at the bottom of the page to save the layout (zones, areas, activities etc.) created to continue working with it later. After clicking popup, information box will appear to confirm the action. 8.5.7 Get information Click „Get information” button at the bottom of configuration menu (Figure 47) to show the chart and table area under it. Profile distribution Profile distribution pie chart shows all selected visitor profile distribution percentage in all the park. Moving mouse on certain slice of pie chart shows information label with visitor profiles' ID, distribution real number and percentage (see Figure 58). 71 Last Modified: May 28, 2015 Figure 58. Profile distribution chart Profile time distribution This bar chart shows visitor profile time distribution by hours. Profiles visiting time is split into percentage by each hour (see Figure 59). Figure 59. Profile time distribution chart Park overview In this subsection the total park overview is shown - which zones are added to Layout design, which areas are in which zone (and their sizes), as well as all the facilities and activities in each area. Clicking on object titles zooms the map to that particular object's position. At the end there is total park area (see Figure 60). 72 Last Modified: May 28, 2015 Figure 60. Park overview table Contacts between autistic and non-autistic visitors 73 Last Modified: May 28, 2015 This section shows table of potential contacts between autistic and non-autistic park visitors (see Figure 61). First column shows zone where the area (second column) is located in and the contacting activity (third column). Fourth column shows activitie's object name created by user. Next columns represent profiles involved in possible contact. Fifth and sixth show autistic profile and visitor number. Next ones non-autistic profiles with its' visitor number. Last column represents hour of the day when contact could happen. Figure 61. Potential contacts with autistic visitors table Note: After making some changes in the layout, click on the "Get information" button again to update all the charts and tables. 8.5.8 Profile and activity list Layout Design view also provides user with full list of visitor profiles and their complete description (see Figure 62) as well as activity list with their codes and full descriptions (see Figure 63). These informative windows can be shown by clicking the "Profiles info" or "Activities info" on the top of the screen (see Figure 47). Figure 62. Profiles info window. 74 Last Modified: May 28, 2015 Figure 63. Activities info window. 75 Last Modified: May 28, 2015