1
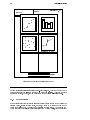
48
Graphical procedures
11 Graphical procedures
The graphical facilities are an important and extremely versatile component of the SPLUS environment. Best results are obtained when S-PLUS is used with a high quality
graphics system such as X windows, although even a simple ASCII terminal can be quite
eective for some purposes.
Before the graphical facilities of S-PLUS may be used, it is necessary to inform S what
type of device is being used by starting a device driver. In an X windows environment,
the command to do this may be
> X11()
(which creates a separate window in which high-quality graphical output will appear,)
or for a simpler graphics terminal the command
> tek4014()
may be appropriate.
Once a device driver is running S-PLUS plotting commands can be used to construct and
display graphical objects. Plotting commands are divided into three basic groups:
High-level plotting functions create a new plot on the graphics device, possibly with
axes, labels, titles and so on.
Low-level plotting functions add more information to an existing plot, such as extra
points, lines and labels.
Interactive graphics functions allow you interactively add information to, or extract
information from, an existing plot, using a pointing device such as a mouse.
Furthermore, S maintains a list of graphical parameters which allow you to customise
your plots.
11.1 High-level plotting commands
High-level plotting functions are designed to generate a complete plot of the data passed
as arguments to the function. Where appropriate, axes, labels and titles are automatically generated (unless you request otherwise.) High-level plotting commands always
start a new plot, erasing the current plot if necessary.
11.1.1 The plot() function
One of the most frequently used plotting functions in S is the plot() function. This is
a generic function: the type of plot produced is dependent on the type or class of the
rst argument.
plot(x,y)
plot(xy)
plot(x)
If x and y are vectors, plot(x,y) produces a scatterplot of x
against y. The same eect can be produced by supplying one
argument (second form) as either a list containing two elements x
and y or a two-column matrix.
Produces a time series plot if x is a numeric vector or time series
object, or an Argand diagram if x is a complex vector.