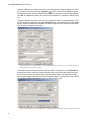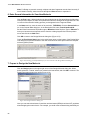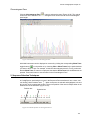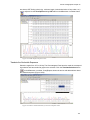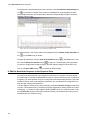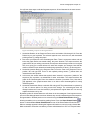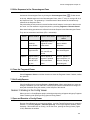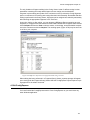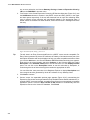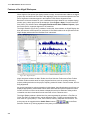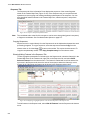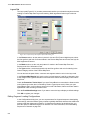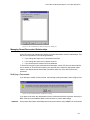
1
VECTOR NTI ADVANCE™10
USER’S MANUAL
www.invitrogen.com
Vector NTI Advance™ 10 User’s Manual
Published by:
Invitrogen Corporation
1600 Faraday Avenue
Carlsbad, CA 92008
USA
www.invitrogen.com
Copyright © 2004, 2005 Invitrogen Corporation. All rights reserved. This book contains proprietary information of Invitrogen Corporation. No part of this document, including design,
cover design, and icons, may be reproduced or transmitted in any form, by any means (electronic, photocopying, recording, or otherwise) without prior written agreement from Invitrogen
Corporation.
The software described in this document is furnished under a license agreement. Invitrogen
Corporation and its licensors retain all ownership rights to the software programs offered by
Invitrogen Corporation and related documentation. Use of the software and related documentation is governed by the license agreement accompanying the software and applicable copyright law.
Vector NTI Advance and Gateway are registered trademarks of Invitrogen Corporation in the
United States and other countries. Logos of Invitrogen Corporation are also trademarks registered in the United States and may be registered in other countries. Other product and brand
names are trademarks of their respective owners.
Generated in the United States.
Invitrogen Corporation reserves the right to make and have made changes, without notice,
both to this publication and to the product it describes. Information concerning products not
manufactured or distributed by Invitrogen Corporation is provided without warranty or representation of any kind, and neither Invitrogen Corporation nor its affiliates will be liable for any
damages.
This version of the Vector NTI AdvanceTM 10 User’s Manual was published in September 2005.
Invitrogen's free technical support for Vector NTI software is available exclusively through the
web. For more information, check out the eSupport section of the Vector NTI user community at
http://www.invitrogen.com/vectorNTIcommunity.
To obtain personalized technical support by telephone or email, you must have an annual support contract. Academic and government users may purchase an Academic Vector NTI Support
Contract through the User Community. Commercial users may purchase an Advanced Support
Contract by contacting Invitrogen at [email protected] (for the Americas) or [email protected] (for European/Middle Eastern/African/Asian Pacific customers).
For paid support, use the following contacts:
United States
Phone: 240-379-4240 or 877-357-3114 (Toll-free, U.S.)
E-mail: [email protected]
Europe, Middle East, Africa, Asian Pacific
Phone: +44 (0) 141 814 6350
Email: [email protected]
The Invitrogen Technical Support team may request that you run the Vector NTI System Information utility and email them the resulting file. Vector NTI System Information is a utility application, which gathers data about the system on which Vector NTI is installed and consolidates that
information into one file. The system information file is helpful in the diagnosis and resolution of
system-related Vector NTI problems.
Table of Contents at a Glance
Chapter 1
Introduction to Vector NTI Advance ...............................................................................1
Chapter 2
Overview of Vector NTI Advance ....................................................................................5
Chapter 3
The Vector NTI User Interface .......................................................................................13
Chapter 4
Tutorial: Molecule Display Windows ............................................................................25
Chapter 5
Tutorial: Molecule Editing .............................................................................................37
Chapter 6
Tutorial: Formatting Molecule Graphics ......................................................................45
Chapter 7
Tutorial: Database Explorer ..........................................................................................55
Chapter 8
Tutorial: PCR Analysis and Primer Design .................................................................65
Chapter 9
Tutorial: Molecule Construction ...................................................................................77
Chapter 10
Tutorial: Molecule Design .............................................................................................85
Chapter 11
Tutorial: Advanced Molecule Design ...........................................................................93
Chapter 12
Tutorial: Gel Display Windows;
Restriction Digestion .....................................................................................................99
Chapter 13
Tutorial: Internet Connectivity and Tools ..................................................................107
i
Vector NTI Advance 10 User’s Manual
Chapter 14
Tutorial: AlignX ............................................................................................................ 115
Chapter 15
Tutorial: Bioannotator ................................................................................................. 125
Chapter 16
Tutorial: ContigExpress .............................................................................................. 131
Chapter 17
Database Explorer ....................................................................................................... 163
Chapter 18
Molecule Display Windows; Formatting Graphics ................................................... 203
Chapter 19
Editing Molecule Content ........................................................................................... 233
Chapter 20
Primer Design: PCR, Sequencing and Hybridization ............................................... 245
Chapter 21
Search and Analysis Tools ......................................................................................... 283
Chapter 22
Molecule Construction ................................................................................................ 305
Chapter 23
Gateway and TOPO Cloning ....................................................................................... 321
Chapter 24
Molecule Design .......................................................................................................... 349
Chapter 25
Gel Display Windows .................................................................................................. 365
Chapter 26
Report Generation ....................................................................................................... 375
Chapter 27
Shared Databases ....................................................................................................... 383
Chapter 28
AlignX ........................................................................................................................... 389
Chapter 29
BioAnnotator ............................................................................................................... 415
Chapter 30
ContigExpress: Project Explorer ............................................................................... 431
Chapter 31
ContigExpress: Fragment and Contig Windows ...................................................... 461
ii
Chapter 32
ContigExpress: Group Operations on Fragments ....................................................493
Chapter 33
GenomBench ................................................................................................................505
Chapter 34
Analysis Monitor - Advanced Analysis Tools ...........................................................559
Chapter 35
BLAST Search and BLAST Viewer .............................................................................575
Chapter 36
AlignX Blocks ...............................................................................................................593
Chapter 37
3D-Mol ...........................................................................................................................605
Chapter 38
Tools Manager ..............................................................................................................625
Chapter 39
Miscellaneous Vector NTI Tools .................................................................................631
Appendix A
Technical Support and Web Site ................................................................................. 659
Appendix B
References..................................................................................................................... 661
Appendix C
ASCII Format; IUB Codes (IUPAC CODES) ................................................................ 667
Appendix D
Parent-Descendant Relationships in Vector NTI ....................................................... 669
Appendix E
Tm Calculations in Vector NTI ..................................................................................... 675
Appendix F
Regular Expression Syntax ......................................................................................... 683
Appendix G
License Manager........................................................................................................... 687
Index............................................................................................................................... 695
iii
Vector NTI Advance 10 User’s Manual
iv
Table of Contents
Chapter 1
Introduction to Vector NTI Advance .............................................................. 1
Welcome ...................................................................................................................1
Getting Started with Vector NTI Advance ...............................................................1
The Vector NTI User ................................................................................................2
The Vector Advance 9.0 User’s Manual Format .....................................................2
Conventions Used in this Manual .............................................................................2
Chapter 2
Overview of Vector NTI Advance ................................................................... 5
Introduction ...............................................................................................................5
Vector NTI Database Explorer .................................................................................5
Organizing your Biological Objects .............................................................................................6
Database Search ............................................................................................................................6
Import/Export Functions ...............................................................................................................6
Archives - A Tool For Sharing Database Information .................................................................6
Features and Functions of Vector NTI ......................................................................7
Creating New Molecules ..............................................................................................................7
Creating New Enzymes, Oligos, and Gel Markers .......................................................................7
Oligos and Primers .......................................................................................................................7
Editing Database Objects ..............................................................................................................7
Parent-Descendant Connections ...................................................................................................7
Generating Restriction Maps ........................................................................................................7
Molecule Display ......................................................................................................8
Text Pane ......................................................................................................................................8
Graphics Pane ...............................................................................................................................8
Sequence Pane ..............................................................................................................................8
Creating Molecule Documents .....................................................................................................8
Gel Display Windows ...............................................................................................8
Creating Gel Display Windows ....................................................................................................8
Creating Gel Samples and Gel Markers .......................................................................................8
Running the Gel ............................................................................................................................9
Align X ......................................................................................................................9
BioAnnotator .............................................................................................................9
ContigExpress ...........................................................................................................9
v
Vector NTI Advance 10 User’s Manual
GenomBench ............................................................................................................9
Remote Services Tools ...........................................................................................10
BLAST Search/BLAST Viewer ................................................................................................ 10
PubMed/Entrez Search, Citation Viewer and Citation Table of Database Explorer ................. 10
Remote Database Sources Wizard ............................................................................................. 10
Miscellaneous Tools ...............................................................................................10
Analysis Monitor ....................................................................................................................... 10
GCG Converter .......................................................................................................................... 11
Matrix Editor .............................................................................................................................. 11
AlignX Blocks ........................................................................................................................... 11
3D-Mol ....................................................................................................................................... 11
Oligo Files Importer ................................................................................................................... 11
Tools Manager ........................................................................................................................... 11
License Manager ........................................................................................................................ 11
Vector NTI System Information ................................................................................................ 11
Chapter 3
The Vector NTI User Interface ......................................................................13
Introduction .............................................................................................................13
Launching Vector NTI ............................................................................................13
Online Help .............................................................................................................13
The Application Workspace ...................................................................................14
Viewer Display Window Description ........................................................................................ 14
Viewer Panes ............................................................................................................................. 15
Viewer Window Operations ...................................................................................................... 15
Viewer Display Panes ................................................................................................................ 16
Miscellaneous Interface Features ............................................................................18
Selection Techniques ................................................................................................................. 18
Copying Display Window Text, Graphics or Sequences Image To The Clipboard .................. 19
Printing from Display Windows ................................................................................................ 21
Exporting Molecule Data ........................................................................................................... 22
Pane Manager .........................................................................................................22
Chapter 4
Tutorial: Molecule Display Windows ...........................................................25
Introduction .............................................................................................................25
1. Launch Vector NTI .............................................................................................25
2. Inspect the Vector NTI Workspace and Database Explorer Windows ...............26
3. Create and Inspect a Molecule Display Window for pBR322 ............................26
4. Arrange the Display Window Conveniently .......................................................27
5. Select a Fragment or a Feature in the Graphics Pane .........................................28
Modifying the Selection ............................................................................................................. 28
Selecting Features ...................................................................................................................... 29
Selection Techniques Summary for the Graphics Pane ............................................................. 29
6. Examine pBR322’s Nucleotide Sequence ..........................................................29
7. Work with pBR322’s Text Description ..............................................................31
8. Link pBR322’s Text Pane to the Graphics and Sequence Panes ........................32
vi
9. Print pBR322’s Text Description, Graphical Map, and Sequence .....................33
10. Create a Display Window for 41BB_HUMAN ................................................33
11. Create a Display Window for 1B14_HUMAN .................................................35
12. Close the Display Windows and Exit Vector NTI ............................................36
Chapter 5
Tutorial: Molecule Editing ............................................................................ 37
Introduction .............................................................................................................37
1. Launch Vector NTI .............................................................................................37
2. Open a Display Window for pBR322 .................................................................37
3. Edit pBR322’s General Data .............................................................................38
4. Edit My pBR322’s Sequence ..............................................................................39
5. Revert to Database Version of My pBR322 .......................................................40
6. Insert a New Sequence Fragment .......................................................................40
7. Edit the TC(R) Signal .........................................................................................41
8. Delete the P2_P Signal and Add a New Signal ..................................................42
9. Change the Starting Coordinate of My pBR322 .................................................42
10. Close the Display Window and Exit Vector NTI .............................................43
Chapter 6
Tutorial: Formatting Molecule Graphics ..................................................... 45
Introduction .............................................................................................................45
1. Launch Vector NTI .............................................................................................45
2. Open pBR322 in a New Display Window ..........................................................45
3. Arrange the Display Window Conveniently .......................................................46
4. Change the Arrangement Setup ..........................................................................46
5. Change the Graphics Setup of CDS Signals .......................................................46
6. Turn on the Picture Editing Mode ......................................................................48
7. Turn the TC(R) Arrow to Blue Cross-Hatching .................................................48
8. Enlarge the TC(R) Arrow ...................................................................................49
9. Format TC(R)’s Label .........................................................................................50
10. Add a Text Annotation ......................................................................................50
11. Experiment with Styles .....................................................................................51
12. Save the pBR322 Molecule Display to a Molecule Document file ..................52
13. Use the Saved Style Sheet to Format Molecule Display Windows ..................52
14. Close the Display Window and Exit Vector NTI .............................................53
Chapter 7
Tutorial: Database Explorer ......................................................................... 55
Introduction .............................................................................................................55
1. Launch Vector NTI .............................................................................................55
2. Inspect the Database Explorer Window ..............................................................56
vii
Vector NTI Advance 10 User’s Manual
3. Experiment with View Options ..........................................................................57
4. Experiment with Selection and Menus and Edits ...............................................57
5. Learn About Subsets ...........................................................................................57
6. Search the Database ............................................................................................58
7. Examine Vector NTI’s User Field Manager ......................................................59
8. Define a New User Field ...................................................................................60
9. View the New Field in Database Explorer .........................................................61
10. Examine Vector NTI’s Contact Manager ........................................................63
11. Close the Molecule Display Windows and Exit Vector NTI ............................63
Chapter 8
Tutorial: PCR Analysis and Primer Design .................................................65
Introduction .............................................................................................................65
1. Launch Vector NTI and Open a Molecule Display Window .............................65
2. Select the Region of ColE1 .................................................................................65
3. Prepare for PCR Analysis ...................................................................................66
4. Perform PCR Analysis ........................................................................................71
5. Inspect the PCR Analysis Folder ........................................................................71
6. Perform Oligo Analysis on a PCR Sense Primer ................................................71
7. Order Custom Primers ........................................................................................72
8. Save a PCR Primer to the Database ....................................................................73
9. Add Restriction Enzyme Sites to the PCR Primers ............................................73
10. Inspect the New PCR Analysis Results ............................................................75
11. Save the PCR Product to the Database and Open a Display Window ..............75
12. Arrange the View of the Product ......................................................................75
13. Close Display Windows and Exit Vector NTI ..................................................76
Chapter 9
Tutorial: Molecule Construction ..................................................................77
Introduction .............................................................................................................77
1. Launch Vector NTI .............................................................................................78
2. Create Display Windows for pBR322 and pUC19 .............................................78
3. Arrange the Display Windows ............................................................................78
4. Define the First Fragment (from pUC19) ...........................................................78
5. Define the Second Fragment (from pBR322) .....................................................80
6. Inspect the Goal List ...........................................................................................81
7. Enter General Information About the New Molecule .........................................81
8. Attempt to Construct the New Molecule ............................................................82
9. Fill in the AvaI Site of the pBR322 Fragment to Make it Blunt ........................83
10. Inspect Your New Molecule .............................................................................84
11. Close the Display Windows and Exit Vector NTI ............................................84
viii
Chapter 10
Tutorial: Molecule Design ............................................................................ 85
Introduction .............................................................................................................85
1. Launch Vector NTI and Create Display Windows for pBR322 and pUC19 ......86
2. Arrange Display Windows ..................................................................................86
3. Define the Recipient Fragment (from pUC19) ...................................................86
4. Define the Donor Fragment (from pBR322) ......................................................87
5. Inspect the Goal Molecule Definition List ..........................................................87
6. Enter General Information for Your New Molecule ...........................................88
7. Prepare to Design the New Molecule .................................................................88
8. Set Your Preferences for Molecule Design ........................................................89
9. Design the New Molecule ...................................................................................89
10. Inspect the New Molecule ................................................................................90
11. Inspect the Design Plan .....................................................................................90
12. Print Out the Design Plan .................................................................................91
Chapter 11
Tutorial: Advanced Molecule Design .......................................................... 93
Introduction .............................................................................................................93
1. Launch Vector NTI, Open and Arrange Display Windows ................................93
First Design: Complicated Recipient ............................................................................ 94
2. Define the Recipient Fragment ...........................................................................94
3. Define the Donor Fragment ................................................................................94
4. Inspect the Goal Molecule Definition List ..........................................................95
5. Enter General Information for Your New Molecule ...........................................95
6. Prepare to Design the New Molecule .................................................................95
7. Set the Design Preferences ..................................................................................95
8. Design the New Molecule ...................................................................................96
9. Inspect the New Molecule ..................................................................................96
10. Inspect the Graphical Map and Text Description of Your New Molecule .......96
Second Design: Complex Donor Fragment .................................................................. 97
1. Define Recipient .................................................................................................97
2. Define Donor ......................................................................................................97
3. Inspect the Goal List ...........................................................................................98
4. Design the New Molecule ...................................................................................98
5. Inspect and Print the New Molecule ...................................................................98
Chapter 12
Tutorial: Gel Display Windows;
Restriction Digestion .................................................................................... 99
Introduction .............................................................................................................99
ix
Vector NTI Advance 10 User’s Manual
1. Launch Vector NTI .............................................................................................99
2. Create a New Gel and Open a Display Window .................................................99
3. Create a Sample and Add it to the Gel ..............................................................100
4. Add Gel Markers ..............................................................................................101
5. Arrange the Gel Display Window Conveniently ..............................................102
6. Inspect the Gel Display Window Text Pane .....................................................102
7. Change Display Color for a Fragment ..............................................................102
8. Run the Gel .......................................................................................................103
9. Gel Animation ...................................................................................................103
10. Optimize the Gel Display ...............................................................................103
11. Change to a Polyacrylamide Gel from the Electrophoresis Profile ................104
12. Estimate Fragment Separation Time ...............................................................104
13. Save the Gel Display Window to a Gel Document File .................................105
14. Close the Gel Display Window ......................................................................105
15. Calculate Restriction Fragments .....................................................................105
Chapter 13
Tutorial: Internet Connectivity and Tools .................................................107
Introduction ...........................................................................................................107
1. Launch Vector NTI and Open pBR322 in a New Display Window .................107
2. Select the Whole Sequence of pBR322 and Use the BLAST Search Tool ......107
3. Display the Result of the Query in a Molecule Display Window ...................109
4. Save (Send to) or Open the Result of the Query Using the Save Button .........110
5. Use Alignment and Analysis Tools ..................................................................110
6. Saving Search Results as Comments ................................................................112
7. Close the Molecule Display Windows and Exit Vector NTI ............................113
Chapter 14
Tutorial: AlignX ............................................................................................115
Introduction ...........................................................................................................115
1. Launch AlignX from the Database Explorer ....................................................115
2. Examine AlignX Display Window ...................................................................116
3. Add Molecule to Alignment .............................................................................118
4. Inspect the Guide Tree ......................................................................................118
5. Review the Alignment Parameters and Matrix .................................................118
6. Examine the Alignment Pane ...........................................................................119
7. Edit the Alignment ............................................................................................120
8. Generate Dot Matrix Plot ..................................................................................120
9. Export Alignment Molecules ............................................................................122
10. Copy and Print an AlignX Pane ......................................................................122
11. Save the Project and Close AlignX .................................................................122
x
Chapter 15
Tutorial: Bioannotator ................................................................................ 125
Introduction ...........................................................................................................125
1. In Vector NTI, Open a Molecule Display Window for pSV2-dhfr; Create a New Protein by
Translating a CDS ..............................................................................................125
2. Launch BioAnnotator from a Vector NTI Molecule Display Window ............126
3. Review the BioAnnotator Display Window .....................................................127
4. Examine and Modify Plot Properties ................................................................127
5. Modify Plot Layouts .........................................................................................128
6. Format the DHFR Sequence .............................................................................128
7. Open a DNA Project in BioAnnotator ..............................................................129
8. Add New Analyses to BioAnnotator ................................................................129
9. Copy, Paste, and Print BioAnnotator Panes ......................................................130
10. Close the Display Window and Exit Vector NTI ...........................................130
Chapter 16
Tutorial: ContigExpress ............................................................................. 131
Introduction ...........................................................................................................131
Session 1 Project Explorer .......................................................................................... 131
1. Open a ContigExpress Window ........................................................................131
2. Open a ContigExpress Project and Add a Fragment to the Project ..................132
3. Examine the ContigExpress Project Explorer Window ....................................133
4. Create Assemblies of Contigs ...........................................................................133
Start Assembling........................................................................................................................133
Assembly Setup .........................................................................................................................134
Examine Assemble Results........................................................................................................135
5. Review and Modify Viewing Options ..............................................................136
6. View Contents in the Tree and Content Panes ..................................................139
7. Manage Fragment Lists and Project Items ........................................................139
8. Save and Close a ContigExpress Project ..........................................................140
Session 2 Working in Fragment Viewer ..................................................................... 140
1. Open and Inspect the Fragment Window ..........................................................140
Text Pane ..................................................................................................................................141
Sequence Pane ..........................................................................................................................142
Chromatogram Pane .................................................................................................................143
2. Sequence Selection Techniques ........................................................................143
3. Display ORFs and Translate the Nucleotide Sequence ....................................144
Display ORFs for the Sequence ................................................................................................144
Translate the Nucleotide Sequence ...........................................................................................145
4. Edit the Nucleotide Sequence in the Sequence Pane ........................................146
5. Edit a Sequence in the Chromatogram Pane .....................................................149
6. Close the Fragment Window ............................................................................149
xi
Vector NTI Advance 10 User’s Manual
7. Exit ContigExpress ...........................................................................................149
Session 3 Working in the Contig Viewer ................................................................... 149
1. Open and Examine a Contig Window ..............................................................149
Text Pane ................................................................................................................................. 150
Graphics Pane .......................................................................................................................... 151
2. Review the Contig in Contig Alignment Pane ..................................................154
3. Edit a Fragment in the Alignment Pane ............................................................159
4. Exit ContigExpress ...........................................................................................161
Chapter 17
Database Explorer .......................................................................................163
Introduction ...........................................................................................................163
Opening Vector NTI Database Explorer ...............................................................164
Elements of Vector NTI Database Explorer .........................................................165
Database Tables ....................................................................................................165
Citation Table .......................................................................................................................... 165
Database Subsets ...................................................................................................167
Database Objects ...................................................................................................167
Database Object System Fields ................................................................................................ 168
User-defined Fields .................................................................................................................. 170
Database Search ....................................................................................................171
DNA/RNA and Protein Molecule Database Searches ............................................................. 172
Enzyme Database Search ......................................................................................................... 176
Oligo Database Search ............................................................................................................. 176
Gel Marker Database Search ................................................................................................... 177
Citation Database Search ......................................................................................................... 178
BLAST Results and Analysis Results Database Searches ....................................................... 178
Database Management Operations .......................................................................178
Backup, Restore and Cleanup .................................................................................................. 178
Selecting the Local Database ................................................................................................... 179
Operations on Subsets ...........................................................................................179
Creating a New Subset ............................................................................................................. 179
Editing a Subset ....................................................................................................................... 180
Rename Subset ......................................................................................................................... 181
Dismiss Subset ......................................................................................................................... 181
Clear Subset ............................................................................................................................. 181
Delete Contents ........................................................................................................................ 181
Subset Summary ...................................................................................................................... 181
Subset Properties ...................................................................................................................... 181
Import Molecules into a Subset ............................................................................................... 181
Import Enzymes into a Subset ................................................................................................. 182
Export Subset ........................................................................................................................... 184
Copy and Save or Print a List of the Objects in a Subset ........................................................ 184
Operations on Database Objects ...........................................................................185
DNA/RNA Molecule Operations ............................................................................................. 186
Protein Molecule Operations ................................................................................................... 186
Enzyme Operations .................................................................................................................. 186
xii
Oligo Operations .......................................................................................................................188
Gel Marker Operations .............................................................................................................189
Citation Operations ...................................................................................................................190
BLAST and Analysis Results Operations .................................................................................190
Drag and Drop ..........................................................................................................................191
Edit Menu Commands ..........................................................................................191
Copy/Paste ................................................................................................................................191
Explorer Display Options .....................................................................................192
Options Dialog Box ..................................................................................................................192
Modifying Database Object Column Widths ...........................................................................193
Sorting Objects in Database Explorer .......................................................................................193
Database Reports ..................................................................................................193
Explorer Shortcuts ................................................................................................194
Open/Save As Dialog Boxes .................................................................................195
Contact Manager ...................................................................................................195
Add New or Edit Contact Records ...........................................................................................196
User Field Manager ...............................................................................................197
Import/Export ...........................................................................................................................199
Set In/Clear In ...........................................................................................................................199
Editing User Fields in Individual Objects .............................................................200
User Fields Tab in the Edit Dialog Box ................................................................200
User Fields in Molecule Display Windows ..........................................................201
Chapter 18
Molecule Display Windows; Formatting Graphics .................................. 203
Introduction ...........................................................................................................203
Vector NTI Display Window Options Dialog Box ...............................................204
Opening Molecules in Molecule Display Windows .............................................204
Molecule Database Files ...........................................................................................................204
Molecule Document Files .........................................................................................................205
Elements of a Molecule Display Window ............................................................206
Menu Bar and Toolbars ............................................................................................................207
The Text Pane ...........................................................................................................................207
The Graphics Pane ....................................................................................................................208
The Sequence Pane ...................................................................................................................211
Molecule Display Setup ........................................................................................215
DNA/RNA Display Setup .........................................................................................................216
Protein Molecule Display Setup ...............................................................................................223
Picture Edit Mode: Formatting and Annotating Pictures ......................................226
Formatting Objects on the Graphical Map ...............................................................................226
Styles .....................................................................................................................229
Assigning Styles to Graphics Objects .......................................................................................223
Redefining a Style’s Format .....................................................................................................223
Copy and Paste Styles ...............................................................................................................223
Saving Styles ............................................................................................................................223
xiii
Vector NTI Advance 10 User’s Manual
Loading Styles ......................................................................................................................... 224
Saving Molecules ..................................................................................................231
Save in <Molecule> Database ................................................................................................. 230
Save as (Molecule Document) File .......................................................................................... 230
Creating A Molecule Shortcut File For A Database Molecule ................................................ 230
Molecule Export ...................................................................................................232
Exporting a Molecule to a GenBank/GenPept, EMBL/SWISS-PROT or FASTA file ........... 232
Chapter 19
Editing Molecule Content ...........................................................................233
Introduction ...........................................................................................................233
Edit Operations in a Molecule Display Window ..................................................233
Molecule Editing ...................................................................................................................... 233
Edit Operations in Molecule Editor ......................................................................237
The General Information Tab .................................................................................................. 238
The DNA/RNA Molecule Tab ................................................................................................. 239
The Sequence and Maps Tab (DNA/RNA) ............................................................................. 239
Sequence and Features Tab (Protein) ...................................................................................... 242
User Fields Tab ........................................................................................................................ 243
Comments Tab ......................................................................................................................... 243
Keywords Tab .......................................................................................................................... 244
Changing the Starting Coordinate of a DNA Molecule ........................................................... 244
Making the Reverse Complement of a DNA Molecule ........................................................... 244
Chapter 20
Primer Design: PCR, Sequencing and Hybridization ...............................245
Introduction ...........................................................................................................245
PCR Primers .........................................................................................................246
Saving and Loading PCR Settings ........................................................................................... 247
Find PCR Primers Dialog Box ................................................................................................. 247
Amplify Selection Dialog Box ................................................................................................ 255
Amplify Features Dialog Box .................................................................................................. 255
Long PCR Dialog Box ............................................................................................................. 258
Primer Tab ............................................................................................................259
PCR Using Existing Oligos Dialog Box .................................................................................. 259
Alignment PCR Analysis ......................................................................................................... 260
Multiplex PCR Analysis .......................................................................................................... 263
The PCR Analysis Folder ........................................................................................................ 271
Operations with PCR Products ................................................................................................ 272
Operations with PCR Primers .................................................................................................. 272
Saving, Viewing and Printing PCR Analysis Results .............................................................. 273
Sequencing Primers ..............................................................................................275
Sequencing Primers Dialog Box .............................................................................................. 275
Primer Similarity Dialog Box .................................................................................................. 276
Primer/Oligo Parameters Dialog Box ...................................................................................... 277
Primer/Oligo Quality Specifics Dialog Box ............................................................................ 278
The Sequencing Primers Folder ............................................................................................... 279
Hybridization Probes ............................................................................................279
xiv
Hybridization Probes Dialog Box .............................................................................................280
The Hybridization Probes Folder ..............................................................................................281
Chapter 21
Search and Analysis Tools ........................................................................ 283
Introduction ...........................................................................................................283
Oligonucleotide Analyses .....................................................................................283
The Oligo List ...........................................................................................................................283
Order Custom Primers ..............................................................................................................284
Oligo Editor Dialog Box ...........................................................................................................285
Thermodynamic Properties Analysis (Oligo Analysis) Dialog Box ........................................286
Dimers & Hairpin Loops Dialog Box .......................................................................................288
Oligo Duplexes Dialog Box ......................................................................................................289
ORFs and Motifs Search .......................................................................................290
ORFs Search Results ................................................................................................................290
Ultimate ORF Blast ..................................................................................................................290
Motifs Search Results ...............................................................................................................291
Mutagenesis ..........................................................................................................291
Translation ............................................................................................................292
Translating in the Sequence Pane .............................................................................................293
Translating into a New Protein Molecule .................................................................................293
Setting the Genetic Code for DNA/RNA Translations .............................................................294
Back Translation ...................................................................................................297
Opening the Back Translation Dialog Box ...............................................................................297
Codon Usage Tables .................................................................................................................298
Translation Tables and Codon Ambiguity ................................................................................299
Back Translation Copy Options ................................................................................................299
Restriction Analyses .............................................................................................300
Restriction Fragments/Restriction Sites ...................................................................................300
RFLP Analysis ..........................................................................................................................300
Finding Common Non-Cutter Restriction Enzymes .................................................................302
Restriction Report .....................................................................................................................304
Chapter 22
Molecule Construction ............................................................................... 305
Introduction ...........................................................................................................305
Molecule Types: Basic And Constructed .............................................................305
Methods of creating new DNA/RNA molecules ..................................................306
Creating New DNA/RNA or Protein Molecules Using Splicing ..........................307
Tools for Creating New Constructed and Designed DNA/RNA Molecules ........308
Describing Component Fragments in the Fragment Wizard ................................309
The Goal Molecule Definition List (Goal List) ....................................................311
Constructing a New Molecule ..............................................................................312
The Construct & Design Molecule Dialog Boxes ....................................................................312
Editing the Termini of Fragment of Molecule-type Component Fragments ............................317
The Control Fields and Commands ..........................................................................................318
Reconstructing a Molecule ...................................................................................319
xv
Vector NTI Advance 10 User’s Manual
Chapter 23
Gateway and TOPO Cloning .......................................................................321
Introduction to Gateway Cloning .........................................................................321
Creating Entry Clones ...........................................................................................323
Generate an Entry Clone by Recombining an Expression Clone by BP ................................. 323
Generate an Entry Clone by PCR Amplification and BP Recombination ............................... 324
Generate an Entry Clone by BP Recombination ..................................................................... 329
Generate an Entry Clone by PCR Amplification and Ligation into a pENTR Vector ............ 329
Obtaining a Functional Entry Clone from Invitrogen .............................................................. 331
Performing an LR Recombination ........................................................................331
Creating a New Destination Vector ......................................................................335
Introduction to TOPO Cloning ..............................................................................337
Creating a New Destination Vector ......................................................................335
High Throughput Operations .................................................................................344
Chapter 24
Molecule Design ..........................................................................................349
Introduction ...........................................................................................................349
Creating a New DNA Molecule Using Design .....................................................349
Describing the Goal Molecule ..............................................................................350
Defining the Recipient Using Fragment Wizard ..................................................................... 350
Defining the Donors Using Fragment Wizard ......................................................................... 353
The Goal Molecule Definition List (Goal List) ....................................................355
Starting the Design ................................................................................................355
The Component Fragments Field ............................................................................................ 356
Defining Design Fragments in Fragment Editor ...................................................356
Design Parameters ................................................................................................358
Design Preferences ...............................................................................................359
Other Preferences ..................................................................................................................... 360
Priorities ................................................................................................................................... 360
Advanced Design Preferences ..............................................................................360
The Design Process ...............................................................................................361
Returning to the Pre-Design State ........................................................................362
The Design Description Folder .............................................................................362
Cloning Step Subfolders .......................................................................................................... 362
Redesigning a Molecule ........................................................................................364
Chapter 25
Gel Display Windows ..................................................................................365
Introduction ...........................................................................................................365
Opening a Gel Display Window ...........................................................................365
Opening a New Gel Display Window ..................................................................................... 366
Opening a Gel Document File ................................................................................................. 367
Elements of a Gel Display Window .....................................................................367
xvi
Gel Samples and Gel Markers ..............................................................................367
Creating and Adding a Gel Sample to a Gel .............................................................................367
New Gel Marker Dialog Box ....................................................................................................368
Adding a Gel Marker to a Gel ..................................................................................................369
The Gel Sample List .............................................................................................369
Viewing the Gel Sample List ....................................................................................................370
Adding Fragments to the Gel Sample List ...............................................................................370
Loading Fragments from the Gel Sample List .........................................................................370
Panes in a Gel Display Window ...........................................................................370
Gel Display Window Text Pane ...............................................................................................371
The Gel Display Window Gel Pane ..........................................................................................371
Copying Gel Display Window Data .....................................................................373
Printing from Gel Display Windows ....................................................................374
Chapter 26
Report Generation ...................................................................................... 375
Introduction ...........................................................................................................375
Starting the Report Generation Wizard .................................................................375
The Report Generation Process: ...........................................................................376
Step 1: Opening the Report Generation Wizard Dialog Box ...................................................376
Step 2: Selecting General Options ............................................................................................376
Step 3: Adjusting Feature Map Information .............................................................................378
Step 4: Report Preview Window ..............................................................................................379
Print Preview and Print .........................................................................................379
Saving Report Templates ......................................................................................380
Relation Report .....................................................................................................380
Step 1 ........................................................................................................................................381
Step 2 ........................................................................................................................................381
Report Templates ..................................................................................................381
Chapter 27
Shared Databases ....................................................................................... 383
Introduction ...........................................................................................................383
Creating a New Shared Database ..........................................................................383
Connecting to a Shared Database .............................................................................................384
Finding the Location of an Existing Shared Database ..............................................................385
Editing Database Properties and User Accounts ......................................................................386
Saving the Connections in a Connection Profile ......................................................................386
Connecting to a Shared Database .............................................................................................386
Managing a Shared Database ................................................................................386
Exchanging Data with a Shared Database ............................................................387
Disconnecting from a Shared Database ................................................................387
Chapter 28
AlignX ........................................................................................................... 389
Introduction ...........................................................................................................389
xvii
Vector NTI Advance 10 User’s Manual
Launching Align X ...............................................................................................389
Features of the AlignX Workspace .......................................................................390
Text Pane ................................................................................................................................. 391
Guide Tree Pane ....................................................................................................................... 392
Graphics Pane .......................................................................................................................... 393
Alignment Pane ........................................................................................................................ 396
AlignX Projects .....................................................................................................401
Creating a New Project ............................................................................................................ 401
Opening An Existing Project ................................................................................................... 401
Adding Molecules to the Project ............................................................................................. 401
Alignment Import in MSF Format ........................................................................................... 402
Initiating an Alignment .........................................................................................402
Multiple Alignment .................................................................................................................. 402
Profile Alignment .................................................................................................................... 403
Adding a Molecule to an Alignment ........................................................................................ 403
Realigning a Selected Area of an Alignment ........................................................................... 403
Removing a Molecule from the Project ................................................................................... 403
Setting Alignment Parameters ..............................................................................403
Pairwise Alignment .................................................................................................................. 404
Multiple Alignment .................................................................................................................. 405
Protein Profile Alignment ........................................................................................................ 406
Guide Tree Construction Options ............................................................................................ 406
Score Matrix ............................................................................................................................ 407
Editing the Alignment .............................................................................................................. 408
Templates ..............................................................................................................409
Similarity Table Analysis .....................................................................................409
Dot Matrix Analysis ..............................................................................................410
Launching the Dot Matrix ........................................................................................................ 411
Dot Matrix Window ................................................................................................................. 411
Resizing the Dot Matrix ........................................................................................................... 412
Dot Matrix Setup ..................................................................................................................... 412
Other AlignX Features ..........................................................................................412
Alignment Algorithms ..........................................................................................413
Alignment PCR .....................................................................................................413
Chapter 29
BioAnnotator ...............................................................................................415
Introduction ...........................................................................................................415
Launching BioAnnotator ......................................................................................415
Features of the BioAnnotator Workspace .............................................................415
Elements of BioAnnotator Display Windows ......................................................................... 416
Copying a Raw Sequence ........................................................................................................ 422
BioAnnotator Projects ...........................................................................................422
Creating a New Project ............................................................................................................ 422
Opening an Existing Project .................................................................................................... 422
Analysis List Setup .................................................................................................................. 423
Analysis Properties .................................................................................................................. 424
xviii
Analysis Descriptions ...........................................................................................426
DNA/RNA Analyses ................................................................................................................426
Protein Analyses .......................................................................................................................426
ProtScale Algorithm .................................................................................................................427
Advanced Analyses: BLOCKS, ProSite, PFAM and Proteolytic Cleavage .........428
Adding Custom Protein Analyses .........................................................................428
Other BioAnnotator Features ................................................................................429
Chapter 30
ContigExpress: Project Explorer ............................................................... 431
Introduction ...........................................................................................................431
Launching ContigExpress .....................................................................................431
Features of the ContigExpress Workspace ...........................................................432
ContigExpress Project Explorer ............................................................................432
Elements of Project Explorer ....................................................................................................432
Tree Pane ...................................................................................................................................433
List Pane ....................................................................................................................................435
General Project Explorer Operations .....................................................................437
Opening or Creating a Project ...................................................................................................437
Importing Fragments to a Project ..............................................................................................438
Finding Fragments .....................................................................................................................440
Selection Techniques .................................................................................................................442
Assembling Selected Items........................................................................................................442
Loading and Saving Assembly Setup Settings ..........................................................................444
Assembly Tab ............................................................................................................................444
Clipping Tab ..............................................................................................................................445
Overlap Tab ...............................................................................................................................447
Contig Tab .................................................................................................................................448
Description Tab ........................................................................................................................449
Lite Settings Tab........................................................................................................................450
Registering Assembly Setup Changes .......................................................................................451
Viewing Project Item Properties................................................................................................452
Copying Selected Fragments or Contigs ...................................................................................459
Printing .....................................................................................................................................459
Exporting Items from the Project ..............................................................................................460
Saving and Closing a Project .....................................................................................................460
Exit Project Explorer .................................................................................................................460
Chapter 31
ContigExpress: Fragment and Contig Windows ..................................... 461
Introduction ...........................................................................................................461
Features of the ContigExpress Workspace ...........................................................461
Switching Between Panes .........................................................................................................462
Status Bar ..................................................................................................................................462
General User Actions ............................................................................................463
Finding a Feature in Other Panes ..............................................................................................463
Editing Fragment or Contig Properties .....................................................................................463
Saving a Current Window ........................................................................................................464
Closing a Current Window .......................................................................................................464
xix
Vector NTI Advance 10 User’s Manual
Closing All Windows ............................................................................................................... 464
Selecting All Data .................................................................................................................... 464
Deleting Data ........................................................................................................................... 464
External Tools Usage ............................................................................................464
Fragment Viewer ..................................................................................................465
Launching a Fragment Viewer ................................................................................................ 465
Features of a Fragment Viewer ................................................................................................ 465
Miscellaneous Operations in the Sequence Pane ..................................................................... 468
Fragment Viewer Operations ................................................................................................... 470
Window Viewing Options ....................................................................................................... 472
Contig Viewer .......................................................................................................473
Launching a Contig Viewer ..................................................................................................... 473
Features of a Contig Viewer .................................................................................................... 473
Common Operations in the Graphics and Contig Alignment Panes ....................485
Highlighting a Fragment .......................................................................................................... 485
Moving a Fragment .................................................................................................................. 485
Reverse Complement a Fragment or Contig............................................................................. 486
Declare a Reference Sequence.................................................................................................. 486
Use of a Reference Sequence.................................................................................................... 486
Window Viewing Options ....................................................................................................... 487
Copy and Camera Features ...................................................................................................... 490
Chapter 32
ContigExpress: Group Operations on Fragments ...................................493
Introduction ...........................................................................................................493
Fragment Trimming ..............................................................................................493
Fragment Ends and Vector Contamination Trimmer Dialog Boxes .....................493
Chapter 33
GenomBench ...............................................................................................505
Introduction ...........................................................................................................505
Launching GenomBench ......................................................................................506
Configuring Database Paths ..................................................................................................... 506
Opening a Sequence from a DAS Server or a Local Database ................................................ 509
Loading Features into the Feature Map Pane .......................................................................... 510
Features of the GenomBench Window .................................................................513
General Pane Operations ......................................................................................................... 513
Overview Pane ......................................................................................................................... 515
Feature Map Pane .................................................................................................................... 515
Information Pane ...................................................................................................................... 521
Undo and Redo Operations ...................................................................................529
Configuring GenomBench Parameters .................................................................530
Setting Feature Type Filters ..................................................................................................... 530
Editing Graphic Styles ............................................................................................................. 531
Editing Fragment Loading Configurations .............................................................................. 534
GenomBench Tools ..............................................................................................539
Feature Search Tool ................................................................................................................. 539
Pattern Search Tool .................................................................................................................. 540
xx
Sim4 and Spidey Alignment Tools ...........................................................................................542
Querying Public Databases .......................................................................................................544
Sending Fragments to Vector NTI ............................................................................................551
Saving Sequences ..................................................................................................552
Saving Fragments .....................................................................................................................552
Creating New Sequences ..........................................................................................................552
Importing and Exporting Sequences .....................................................................554
Importing Files into GenomBench ...........................................................................................554
Exporting Sequences to GenBank Files ...................................................................................556
Printing in GenomBench .......................................................................................556
Copying in GenomBench ......................................................................................557
Copying by Camera ..................................................................................................................557
Copying by the Copy Command ..............................................................................................558
Chapter 34
Analysis Monitor - Advanced Analysis Tools .......................................... 559
Introduction ...........................................................................................................559
PFAM, ProSite and BLOCKS Databases .................................................................................559
Launching Advanced Analyses .............................................................................560
Elements of the Analysis Monitor Workspace .....................................................561
Configuring Advanced Analysis Parameters ........................................................562
Sim4 ..........................................................................................................................................562
Spidey .......................................................................................................................................564
BLOCKS ...................................................................................................................................565
PFAM .......................................................................................................................................565
Proteolytic Cleavage .................................................................................................................566
ProSite .......................................................................................................................................568
BLAST Search in Analysis Monitor .........................................................................................569
Operations on Analyses ........................................................................................570
Starting an Analysis ..................................................................................................................570
Stopping an Analysis ................................................................................................................570
Editing, Copying and Deleting .................................................................................................570
Saving .......................................................................................................................................571
Sending to Other Vector NTI Advance Applications ...............................................................571
Viewing Analysis Results .....................................................................................571
Viewing Analysis Results in Vector NTI .................................................................................571
Viewing Analysis Results in GenomBench ..............................................................................572
Chapter 35
BLAST Search and BLAST Viewer ............................................................ 575
Introduction ...........................................................................................................575
BLAST Search Dialog Box ..................................................................................575
Database Selection Parameters .................................................................................................576
Sequence/Parameters Pane Tabs ...............................................................................................578
BLAST Options ........................................................................................................................582
BLAST Search Results .........................................................................................582
BLAST Viewer .....................................................................................................583
xxi
Vector NTI Advance 10 User’s Manual
Opening BLAST Viewer ......................................................................................................... 583
Elements of the BLAST Search Results Viewer ..................................................................... 583
BLAST Search Results ............................................................................................................ 584
Saving BLAST Search Results ................................................................................................ 589
Creating a New Database Subset for BLAST Search Results ................................................. 591
Other BLAST Viewer Features ............................................................................................... 591
Chapter 36
AlignX Blocks ..............................................................................................593
Introduction ...........................................................................................................593
Opening AlignX Blocks: ......................................................................................593
Features of the AlignX Blocks Workspace ...........................................................593
Text Pane ................................................................................................................................. 594
Block List Pane ........................................................................................................................ 595
Schematic Pane ........................................................................................................................ 597
Alignment Pane ........................................................................................................................ 597
AlignX Blocks Projects ........................................................................................598
Opening an Existing Project .................................................................................................... 598
Creating a New Project ............................................................................................................ 598
Adding Molecules to the Project ............................................................................................. 598
Block Search ............................................................................................................................ 598
Adding Sequences to Block Sequence Space. ......................................................................... 599
Defining a Block ...................................................................................................................... 599
Linking and Unlinking ............................................................................................................. 599
Color Setup .............................................................................................................................. 599
Block Editing ........................................................................................................................... 600
Deleting a Molecule ................................................................................................................. 601
AlignX Blocks Parameters ....................................................................................601
Parameters Tab: ....................................................................................................................... 601
Blocks’ Color Tab: ................................................................................................................... 601
Score Matrix Tab ..................................................................................................................... 602
Templates ..............................................................................................................602
Other AlignX Blocks Features ..............................................................................603
Chapter 37
3D-Mol ..........................................................................................................605
Introduction ...........................................................................................................605
3D-Mol Supported File Formats ...........................................................................605
Downloading 3D Structure Files ............................................................................................. 605
Opening 3D-Mol ...................................................................................................606
Elements of 3D-Mol .............................................................................................606
Project Pane ............................................................................................................................. 607
Structure Pane .......................................................................................................................... 609
Graphics Pane .......................................................................................................................... 610
Sequence Pane ......................................................................................................................... 611
Graphics Pane 3D Options Dialog Box ................................................................................... 616
Stereo Viewing Option ............................................................................................................ 620
Sequence Pane Viewing Options ..........................................................................620
3D-Mol Tools .......................................................................................................620
xxii
Aligning Chains ........................................................................................................................620
Calculating Protein Surfaces .....................................................................................................622
Exporting and Saving 3D-Mol Data .....................................................................623
Opening/Importing Structures from 3D-Mol in Vector NTI ....................................................623
Exporting Structures to a File ...................................................................................................624
Saving 3D-Mol Sessions ...........................................................................................................624
Chapter 38
Tools Manager ............................................................................................. 625
Introduction ...........................................................................................................625
Configuring Vector NTI Tools .............................................................................625
Sorting Tools in Tools Manager ...............................................................................................628
Adding a Web Link to the Tools List .......................................................................................628
Program- and Script-based Tools .............................................................................................628
Chapter 39
Miscellaneous Vector NTI Tools ................................................................ 631
Introduction ...........................................................................................................631
PubMed/Entrez Search ..........................................................................................631
Defining Search Conditions ......................................................................................................632
Reviewing Search Results ........................................................................................................633
Saving Search Results ...............................................................................................................634
Modifying the PubMed/Entrez Display Window .....................................................................634
Citation Viewer .....................................................................................................634
Opening Citation Viewer ..........................................................................................................634
Elements of Citation Viewer ....................................................................................................635
Remote Database Sources Wizard ........................................................................636
Configuring the Internet Connection ........................................................................................636
Creating Remote Database Links .............................................................................................637
Accessing LabShare Databases in Vector NTI .........................................................................639
GCG Converter .....................................................................................................643
Other GCG Converter Operations ............................................................................................645
Importing into Vector NTI Database Explorer .........................................................................645
Matrix Editor .........................................................................................................646
Oligo Importer ......................................................................................................648
License Manager ...................................................................................................650
Launching License Manager .....................................................................................................650
License Manager Dialog Box ...................................................................................................650
Vector NTI System Information ...........................................................................656
Appendix A
Invitrogen Customer Support and Web Site ............................................ 659
Information ...........................................................................................................659
Appendix B
References ................................................................................................... 661
3D-Mol ..................................................................................................................661
xxiii
Vector NTI Advance 10 User’s Manual
Connolly Surface Calculation .................................................................................................. 661
Varshney Surface Calculation ................................................................................................. 661
AlignX ..................................................................................................................661
Basic Alignment Algorithms .................................................................................................. 661
Substitution Matrices ............................................................................................................... 662
Phylogenetic Tree .................................................................................................................... 662
Alignments and Similarity ....................................................................................................... 662
BioAnnotator ........................................................................................................662
DNA/RNA Analyses Citations ................................................................................................ 662
Protein Analyses (ProtScale Analyses) .................................................................................... 663
Properties Plots ........................................................................................................................ 663
ContigExpress .......................................................................................................665
Contig Assembly ...................................................................................................................... 665
BLAST ..................................................................................................................665
Miscellaneous .......................................................................................................665
Molar Extinction Coefficient ................................................................................................... 665
Oligo Analysis ......................................................................................................................... 665
PCR Analysis ........................................................................................................................... 666
General Bioinformatics ............................................................................................................ 666
Biostatistics .............................................................................................................................. 666
REBASE .................................................................................................................................. 666
Appendix C
ASCII Format; IUB Codes (IUPAC CODES) ...............................................667
Format for ASCII Sequence Files .........................................................................667
IUB Formats recognized by Vector NTI ..............................................................667
Appendix D
Parent-Descendant Relationships in Vector NTI ......................................669
Overview of Parent-Descendant Relationships ....................................................669
Viewing Parent-Descendant Relationships ...........................................................670
Managing Parent-Descendant Relationships ........................................................671
Modifying a Descendant .......................................................................................................... 671
Modifying a Parent .................................................................................................................. 672
Deleting a Parent from the Database ....................................................................................... 673
Deleting a Descendant from the Database ............................................................................... 673
Appendix E
Tm Calculations in Vector NTI ...................................................................675
General Information ..............................................................................................675
Usefulness of Thermodynamic Tm Versus %GC Tm ............................................................. 675
Effects of Primer (Probe) and Salt Concentration on Tm Calculations ................................... 676
%GC Tm Calculation ............................................................................................676
Thermodynamic Tm Calculation ..........................................................................676
Oligos Containing IUB Ambiguity Characters ........................................................................ 679
RNA Oligos ............................................................................................................................. 679
Primer/Probe Tm, TaOpt and Similarity Calculations ..........................................680
xxiv
Primer/Probe Tm Values ..........................................................................................................680
TaOpt Values ............................................................................................................................680
Primer/Probe Similarity Values ................................................................................................680
References .............................................................................................................681
Appendix F
Regular Expression Syntax ....................................................................... 683
Introduction ...........................................................................................................683
Parts of a Regular Expression ...............................................................................683
Anchors .....................................................................................................................................684
Character Sets ...........................................................................................................................684
Modifiers ...................................................................................................................................684
Grouping and Pattern Memory .................................................................................................684
Metacharacter Reference ......................................................................................685
Appendix G
License Manager.......................................................................................... 687
Index.............................................................................................................. 695
xxv
Vector NTI Advance 10 User’s Manual
xxvi
License Agreement
COMMERCIAL USERS: IN ORDER TO ACCESS THE SOFTWARE YOU MUST ENTER INTO THE SOFTWARE PRODUCT LICENSE AGREEMENT IN SECTION I.
ACADEMIC OR NOT-FOR-PROFIT USERS : IN ORDER TO ACCESS THE SOFTWARE YOU MUST
ENTER INTO THE ACADEMIC OR NOT-FOR-PROFIT USER SOFTWARE LICENSE AGREEMENT IN SECTION II.
I.Software Product License Agreement Terms for Commercial Users
This is a legal agreement (“Agreement”) between you, the party purchasing a product license, and Invitrogen
Corporation, having offices at 1600 Faraday Avenue, Carlsbad California 92008 USA (“Licensor”). This Agreement is part of a package that includes one or more software products and certain electronic and/or written
materials. This Agreement covers your licensing of the Software (as the term is defined below). BY CLICKING
YOUR ACCEPTANCE OF THIS AGREEMENT, OR BY INSTALLING OR USING THE SOFTWARE OR ANY
OTHER COMPONENT OF THE PACKAGE, YOU ACKNOWLEDGE THAT YOU HAVE READ ALL OF THE
TERMS AND CONDITIONS OF THIS AGREEMENT, UNDERSTAND THEM, AND AGREE TO BE LEGALLY
BOUND BY THEM. If you do not agree to the terms of this Agreement, you may not install or use the Software.
As used in this Agreement: “Authorized Users” means, collectively, the personnel authorized by you to use
the Software, for whom you have purchased a License (as defined below) and paid the corresponding license
fees. Unless otherwise expressly allowed by this Agreement, Authorized Users may include only your employees having a need to know; Authorized Users may not be entities or persons in the business of licensing or otherwise providing products or services competitive with the Software; “Designated Site” means your facilities or
offices located at the postal address provided to Licensor for your billing and invoicing purposes, unless otherwise indicated in a license key provided to you; and “Software” means the software product(s) accompanying
this Agreement, including the associated user manuals, user documentation and application program interfaces, and license key(s) provided, and any patches, updates, upgrades, improvements, enhancements, fixes
and revised versions of any of the foregoing that may be provided to you from time to time, and any combination of the foregoing.
1. YOUR PAYMENT OBLIGATIONS. You agree to pay all amounts due or incurred by you, including any late payment fees, as are specified in this Agreement or in an invoice. If any authority imposes a duty, tax or similar amount (other than based on Licensor’s income), you agree to pay, or to promptly reimburse Licensor
for, all such amounts. You are also responsible for paying all shipping charges and Licensor’s other reasonable out-of-pocket expenses incurred in performing this Agreement. Unless otherwise indicated, all
invoices are payable thirty (30) days from the date of invoice. Overdue amounts are subject to a late payment charge, at the lower rate of (i) one and one-half percent (1.5%) per month, or (ii) the maximum legal
rate. You agree to promptly pay or reimburse Licensor for all costs and expenses, including all reasonable
attorneys’ fees, related to breach of your obligations under this Agreement or Licensor’s enforcement of
this Agreement. All shipments by Licensor or its designee are FCA point of shipment.
2. GRANT OF SOFTWARE LICENSE. Subject to the terms and conditions of this Agreement, Licensor grants to
you a non-exclusive, non-transferable license (the “License”) to use the Software for your internal operations and internal data processing purposes within and up to the Authorized Scope for which you have paid
xxvii
Vector NTI Advance 10 User’s Manual
the applicable fees (if any) and registered the Software for use. The term “Authorized Scope” means the
following, and any other capacity or use restrictions on the license granted to you:
z
If you have purchased a “Static” license, then, for each such license purchased you may install and
operate the Software on a designated computer located at the Designated Site. You may not network
the Software for use at any other location. Use of the Software is limited to the computer designated for
each Static license purchased.
z
If you have purchased a “Network” license, then you may install and operate the Software concurrently
on up to the number of workstations for which you have purchased a license. All workstations must be
at the Designated Site. You may not network the Software for use at any other location; neither may
you enable operation of concurrent “instances” of the Software beyond the scope of the Network
license purchased. For example, if you purchased a Network license permitting concurrent use on five
computers, you may enable the Software for concurrent use on up to five workstations at the Designated Site, regardless of whether such computers are networked.
z
If you have purchased a “Dynamic” license, then you may allow up to the number of users for which
you have purchased a license to operate the Software concurrently on any of the designated computers
for which you have purchased a “Dynamic license seat”. The computers must all be located at the
Designated Site. You may not network the Software for use at any other location, or for use on any
computers other than those for which you have purchased a Dynamic license seat.
z
If you have purchased a “Corporate” license, then you may install and operate the Software concurrently on all workstations at the Designated Site(s) for which you have purchased such license. You
may not network the Software for use at any other location; nor may you enable operation of concurrent
“instances” of the Software beyond the Authorized Scope of the Corporate license purchased. Corporate License Numbers are Confidential Information, and must be protected at a minimum to the extend
set out in Section 8 of this Agreement.
z
Any Software provided under an “Evaluation” or “Trial” license is provided for your internal evaluation
purposes only, pending your purchase of a commercial-use Software license and payment of the applicable license fees. Evaluation licenses may automatically be converted into commercial licenses (e.g.,
with Authorized Scope converted into Static, Network, or Dynamic license) upon payment of the applicable license fees to Licensor or issuance of the applicable license key (whichever occurs first). Upon
such conversion, this Agreement shall continue in full force and effect, subject to the restrictions applicable to the new Authorized Scope.
z
Any Software provided under a “Demonstration” license is provided for your internal demonstration
purposes only, and not for commercial or research purposes. You may not use the Software provided
under a Demonstration license to operate upon data other than the data provided to you under the
Demonstration license. You may not use any other software in conjunction with the Software provided
under a Demonstration license to operate upon data other than the data provided to you under the
Demonstration license.
z
If you have purchased a “Named User” license, then you may allow up to the number of named users
for which you have purchased a license to operate the Software. A named user is defined as one individual user identified with a unique user name and password. Each named user may operate no more
than one session from a single workstation at a time. The workstations must all be located at the designated site. Only named users may use the Software.
3. RESTRICTIONS ON USE. You acknowledge that you are receiving LICENSED RIGHTS only. The Software
may only be used internally, by you or your Authorized Users, with the license key provided, for your
copy(ies) of the Software. If any Software is provided on separate media (e.g., a CD-ROM), you may make
a reasonable number of copies solely for your internal backup purposes. You shall not directly or indirectly:
(i) sell, rent, lease, redistribute or transfer any of the Software or any rights in any of the Software, including
through “charge back” or any other reselling or redistribution within your organization of any usage capacity you have licensed, without the prior express written approval of Licensor, (ii) modify, translate, reverse
engineer (except to the limited extent permitted by law), decompile, disassemble, create, derivative works
based on, sublicense, or distribute any of the Software, (iii) use any Software for the benefit of any third
parties (e.g., in an ASP, outsourcing or service bureau relationship), or in any way other than in its intended
manner, (iv) remove any proprietary notice, labels, or marks on or in Software, or (v) disable or circumvent
xxviii
any access control or related device, process or procedure established with respect to the Software,
including the license key or any other part thereof. You are responsible for all use of the Software and for
compliance with this Agreement; any breach by you or any user of the Software provided to you shall be
deemed to have been incurred by you. Licensor reserves all rights not expressly granted. You agree and
acknowledge that you have been provided sufficient information such that you do not need to reverse engineer the Software in any way to permit other products to interoperate with the Software. Sharing of
accounts does not reduce the type or number of licenses you must purchase. For example, if you pool ten
(10) users through a single account, you must have a license authorizing use by at least ten (10) users. In
addition, “Multiplexing” or “pooling” of any Software or hardware (including through use of third party software products such as those made by Citrix Systems, Inc., or use of any terminal applications/emulators)
does not reduce the type or number of licenses you must purchase; the required number of licenses you
have must be greater than or equal to the number of distinct “inputs” to the multiplexing software or hardware “front end”.
4. NO SEPARATION OF COMPONENTS. The Software is licensed as a single product. Some Licensor software
products combine separately available components into a single product (e.g., a software suite product
may be comprised of multiple component products). When licensed as a combination product, the component parts may not be separated for use independently of the combination product. You must first purchase a license to each component of the combination product before you may use it independently of the
combination product.
5. CLASSROOM LICENSES. Certain Software may be licensed under Classroom License programs. Software
licensed under such programs is subject to the additional restrictions in this Section. Software licensed
under a “Classroom License” is restricted to use by students and teachers only in support of the classroom instruction of students and related class-work, such as the preparation of classroom materials, and
the review and grading of exams, papers and class-related projects. Students may use the Software for
class-related laboratory work and homework assignments. Use of Software licensed under such a program for any purposes other than as described in this Section, including for commercial or production purposes, or for non-classroom related research, is strictly prohibited.
6. ADDITIONAL PURCHASES. Purchase of additional or changed licenses or Authorized Scope is subject to
availability and current pricing. Licensor may, from time to time, update the available Authorized Scope
plans, and add or delete from available plans. To the extent you purchase an upgrade to your license by
expanding the Authorized Scope under a changed or additional plan, Licensor will provide you with the
additional license terms and conditions governing your use of Software under such plans; all other terms
and conditions of this Agreement shall remain in effect.
7. TERM AND TERMINATION. Unless otherwise agreed, the term (“Term”) of this Agreement shall continue until
it is terminated; however, if you are receiving an Evaluation or Demonstration license, the Term shall expire
thirty (30) days following the date you receive the Software. Licensor may terminate this Agreement (or
any License) upon fifteen (15) days prior written notice if you breach this Agreement and do not cure the
breach within fifteen (15) days following receipt of written notice of breach. Immediately upon any termination or expiration of this Agreement, you agree to: (i) pay all amounts owed to Licensor; (ii) cease use of
the Software for which your rights have been terminated; (iii) upon request, return to Licensor (or destroy)
all copies of the Software and any other Confidential Information or proprietary materials in your possession for which your rights have been terminated; and (iv) upon request, certify in writing your compliance
with (ii) and (iii), above.
8. CONFIDENTIALITY. You agree to protect Licensor’s Confidential Information with the same degree of care
used to protect your own Confidential Information (but in no event less than a reasonable standard of
care), and not to use or disclose any portion of such Confidential Information to third parties, except as
expressly authorized in this Agreement. You acknowledge that the Software, including its structure, organization and design constitute proprietary and valuable trade secrets (and other intellectual property rights)
of Licensor and/or its licensors. The term “Confidential Information” means, collectively, non-public
information that Licensor (and its licensors) provide and reasonably consider to be of a confidential, proprietary or trade secret nature, including but not limited to confidential elements of the Software and Licensor’s (and its licensors’) technology and know-how, whether in tangible or intangible form, and whether or
not stored, compiled or memorialized physically, electronically, graphically, photographically, or in writing.
xxix
Vector NTI Advance 10 User’s Manual
Confidential Information does not include any information which: (i) is, as of the time of its disclosure or
thereafter becomes part of the public domain through no fault of the receiving party; (ii) can be demonstrated by credible evidence: (x) as rightfully known to the receiving party prior to the time of its disclosure,
or (y) to have been independently developed by the receiving party; (iii) is subsequently learned from a
third party not under a confidentiality obligation; or (iv) is required to be disclosed pursuant to a duly authorized subpoena, court order, or government authority, provided that the receiving party has provided
prompt written notice and assistance to Licensor prior to such disclosure, so that Licensor may seek a protective order or other appropriate remedy to protect against disclosure.
9. WARRANTY AND DISCLAIMER. Licensor warrants that, for a period of thirty (30) days from the date of initial
delivery of Software to your designated shipping address (as indicated in the applicable invoice), the Software will, under normal use, substantially perform the functions described in its accompanying documentation. THE FOREGOING EXPRESS WARRANTY REPLACES AND IS IN LIEU OF ALL OTHER
WARRANTIES OR CONDITIONS BY LICENSOR, WHETHER EXPRESS, IMPLIED, OR STATUTORY,
INCLUDING BUT NOT LIMITED TO ANY IMPLIED OR OTHER WARRANTIES OF MERCHANTABILITY,
FITNESS FOR A PARTICULAR PURPOSE, TITLE, NON-INFRINGEMENT OR NON-MISAPPROPRIATION OF INTELLECTUAL PROPERTY RIGHTS OF A THIRD PARTY, CUSTOM, TRADE, QUIET
ENJOYMENT, ACCURACY OF INFORMATIONAL CONTENT, OR SYSTEM INTEGRATION. NO WARRANTY IS MADE THAT ANY SOFTWARE WILL OPERATE IN AN ERROR FREE, UNINTERRUPTED OR
COMPLETELY SECURE MANNER, OR IN COMBINATION WITH THIRD PARTY HARDWARE OR SOFTWARE PRODUCTS. YOU ACKNOWLEDGE THAT LICENSOR HAS NO CONTROL OVER THE SPECIFIC CONDITIONS UNDER WHICH YOU USE THE SOFTWARE. ACCORDINGLY, EXCEPT FOR THE
FOREGOING EXPRESS WARRANTY, LICENSOR CANNOT AND DOES NOT WARRANT THE PERFORMANCE OF THE SOFTWARE OR ANY PARTICULAR RESULTS THAT MAY BE OBTAINED BY THE
USE OF THE SOFTWARE. THE SOFTWARE DOES NOT REPLACE YOUR OBLIGATION TO EXERCISE YOUR INDEPENDENT JUDGMENT IN USING THE SOFTWARE. The warranty made by Licensor
may be voided by abuse or misuse.
10. EXCLUSIVE REMEDY. Licensor’s sole obligation and liability, and your sole and exclusive remedy under the
warranty set forth in Section 9 shall be for Licensor to use reasonable efforts to have the problem remedied, or have the defective product replaced, provided that Licensor is notified in writing of all warranty
problems during the applicable warranty period.
11. THIRD PARTY SOFTWARE AND DATABASES. You understand that third party products integrated into the Software or provided for use with the Software may be subject to additional terms and conditions and/or
license agreements from the applicable third party vendor, which shall govern over conflicting terms of this
Agreement for purposes of your relationship with the third party vendor. You agree not to use any such
third party product on a stand-alone basis independent of the Software, unless you have purchased the
appropriate license from the third party vendor for use of such products. NOTWITHSTANDING ANYTHING TO THE CONTRARY IN THIS AGREEMENT, ALL THIRD PARTY SOFTWARE, DATABASES AND
OTHER PROGRAMS AND SOFTWARE COMPONENTS ARE PROVIDED “AS IS” WITHOUT ANY WARRANTY WHATSOEVER FROM LICENSOR. ANY DATABASES OR OTHER INFORMATION PROVIDED
BY LICENSOR ARE DESIGNED TO SUPPLEMENT OTHER SOURCES OF INFORMATION, AND ARE
NOT INTENDED TO REPLACE YOUR PROFESSIONAL DISCRETION AND JUDGMENT. Licensor
agrees, upon request and as Licensor’s sole liability and obligation, to have passed through to you (to the
extent it may reasonably do so) any warranties and indemnifications provided by the applicable third party
vendor of any third party products provided to you. To the extent any problem or liability arises from a third
party product, you agree to seek recourse solely from the applicable third party vendor and not Licensor.
12. LICENSOR INDEMNIFICATION. Licensor agrees to indemnify and defend you against any claims, actions,
suits and proceedings by unaffiliated third parties arising from or related to a claim that the Software (other
than any third party components or elements) infringes upon such party’s copyright, and Licensor agrees
to pay all costs, losses, damages, and attorneys’ fees that a court finally awards, and all associated settlements; provided that, Licensor receives (i) prompt written notice of the claim; (ii) all necessary assistance,
information and authority necessary for Licensor to defend the claim and perform Licensor’s obligations
under this Section; and (iii) sole control of the defense of such claim and all associated negotiations. If
such a claim is made or appears likely to be made, you agree to permit Licensor to enable you to continue
to use the affected materials, or to have them modified them to make them non-infringing, or to have them
xxx
replaced with a substantially functional equivalent. If Licensor determines that none of these options is
reasonably available, then Licensor may terminate this Agreement in whole or with respect to the affected
product, and you may be entitled to a credit equal to the price paid for the affected product, less depreciation. THIS SECTION STATES LICENSOR’S AND ITS AFFILIATES’ ENTIRE OBLIGATION AND LIABILITY REGARDING INFRINGEMENT OR CLAIMS OF INFRINGEMENT. Licensor will have no responsibility
for (x) any use of any product after you have been notified to discontinue use, (y) alteration or combination
of any product with third party materials, or any misuse or unauthorized use, or (z) failure to use provided
updated or modified products to avoid a claim of infringement or misappropriation.
13. INDEMNIFICATION BY YOU. You agree to indemnify and defend Licensor, its licensors, and its affiliates,
against any third party claims arising from or related to your use or misuse of the Software or any breach of
the terms and conditions of this Agreement, and you agree to pay all costs, losses, damages, and attorneys’ fees that a court finally awards, and all associated settlements.
14. LIMITATION OF LIABILITY. EXCEPT TO THE EXTENT PROHIBITED BY APPLICABE LAW, IN NO EVENT
WILL LICENSOR’S OR ITS AFFILIATES’ TOTAL, AGGREGATE LIABILITY ARISING FROM OR
RELATED TO THIS AGREEMENT OR THE SOFTWARE (INCLUDING FOR NEGLIGENCE, STRICT LIABILITY, BREACH OF CONTRACT, MISREPRESENTATION, AND OTHER CONTRACT OR TORT
CLAIMS), EXCEED THE AMOUNT OF YOUR DIRECT DAMAGES ACTUALLY INCURRED, UP TO THE
AMOUNT OF FEES PAID TO LICENSOR UNDER THIS AGREEMENT FOR THE SOFTWARE THAT IS
THE SUBJECT OF THE CLAIM UNDERLYING THE DAMAGES.
15. EXCLUSION OF OTHER DAMAGES. EXCEPT TO THE EXTENT PROHIBITED BY APPLICABE LAW, UNDER
NO CIRCUMSTANCES SHALL LICENSOR, ITS AFFILIATES, OR ANY OF THEIR SUPPLIERS OR
LICENSORS BE LIABLE FOR ANY OF THE FOLLOWING: (I) THIRD PARTY CLAIMS, EXCEPT AS
PROVIDED IN SECTION 12, (II) LOSS OR DAMAGE TO ANY SYSTEMS, RECORDS OR DATA, OR (III)
INDIRECT, INCIDENTAL, SPECIAL, CONSEQUENTIAL, PUNITIVE, RELIANCE, OR COVER DAMAGES
(INCLUDING FOR LOST PROFITS, LOST SAVINGS AND DAMAGE TO ANY DATA OR SYSTEMS);
EVEN IF ADVISED OF THE POSSIBILITY OF SUCH DAMAGES. YOU ARE SOLELY RESPONSIBLE
AND LIABLE FOR VERIFYING THE ACCURACY AND ADEQUACY OF ANY OUTPUT FROM THE
SOFTWARE, AND FOR ANY RELIANCE THEREON.
16. VERIFICATION. Licensor shall have the right to have on-site audits periodically conducted of your use of the
Software. These audits will generally be conducted during regular business hours, and Licensor will use
its reasonable efforts not to interfere unduly with your regular business activities. Licensor may also
require you to accurately complete a self-audit questionnaire in a form Licensor may have provided. If an
audit reveals unauthorized use, you must promptly order sufficient licenses and Authorized Scope to permit all usage disclosed. If material unlicensed use is found (i.e., license shortage of 5% or more), you also
shall reimburse Licensor for its costs incurred in connection with the verification.
17. LEGAL COMPLIANCE; RESTRICTED RIGHTS. Software is provided solely for lawful purposes and use. You
shall be solely responsible for, and agree to comply with, all applicable laws, statutes, ordinances, and
other governmental authority, however designated. Without limiting the foregoing, you agree to comply
with all U.S. export laws and applicable export laws of your locality (if you are not in the United States), and
shall not export any Software or other materials provided by Licensor without first obtaining all required
authorizations or licenses. Products acquired for use within or for any United States federal agency are
provided with “LIMITED RIGHTS” and “RESTRICTED RIGHTS” as defined in DFARS 252.227-7013 and
FAR 52.227-19.
18. GOVERNING LAW; SEVERABILITY. This Agreement shall be governed in all respects by the laws of the State
of California, USA, without regard to choice-of-law rules or principles. Any dispute arising out of or related
to this Agreement shall be resolved only in the state or federal courts having jurisdiction in California. If
any provision of this Agreement is held to be illegal or unenforceable for any reason, then such provision
shall be deemed to be restated so as to be enforceable to the maximum extent permissible under law; the
remainder of this Agreement shall remain in full force and effect.
19. GENERAL. This Agreement, including any associated Licensor invoices (all of which are incorporated
herein), are collectively the parties’ complete agreement regarding its subject matter, superseding any
prior oral or written communications. You understand and agree that, to the extent Licensor permits you to
xxxi
Vector NTI Advance 10 User’s Manual
use a non-Licensor purchase order or other form to order Software, Licensor does so solely for your convenience. Any terms in any such forms that purport to vary or are in addition to any terms in this Agreement or in the applicable Licensor form covering your purchase shall be deemed to be void and of no
effect. Amendments or changes to this Agreement must be in mutually executed writings to be effective.
Sections 1, 3--8, 10--19, and all warranty disclaimers and use restrictions shall survive the termination or
expiration of this Agreement. The parties are independent contractors for all purposes under this Agreement. Neither party shall be liable for any delay or failure due to force majeure and other causes beyond
its reasonable control; this provision shall not apply to any of your payment obligations. Any notices under
this Agreement to Licensor must be personally delivered or sent by certified or registered mail, return
receipt requested, or by nationally recognized overnight express courier, to the address specified herein or
such other address as Licensor may specify in writing. Such notices will be effective upon receipt, which
may be shown by confirmation of delivery. All such notices shall be sent to the attention of General Counsel of Invitrogen Corporation (unless otherwise specified by Licensor). You may not assign or otherwise
transfer this Agreement without Licensor’s prior written consent. This Agreement shall be binding upon
and inure to the benefit of the parties’ successors and permitted assigns. You agree, at Licensor’s request
and reasonable expense, to provide reasonable assistance and cooperation to Licensor and its designees,
and to give testimony and execute documents and to take such further acts reasonably requested by the
other to acquire, transfer, maintain, perfect, and enforce Licensor’s intellectual property rights as described
in this Agreement. To the extent you fail to do so, you appoint Licensor’s or its affiliates’ officers as your
attorney in fact to execute documents on your (and your personnel's), successors’ and assigns’ behalf for
this limited purpose.
xxxii
II.Software Product License Agreement Terms for Academic and/or Not-For-Profit Users
This is a legal agreement (“Agreement”) between you, the academic or not-for-profit researcher receiving a product license, and Invitrogen Corporation, having offices at 1600 Faraday Avenue, Carlsbad
California 92008 USA (“Licensor”). This Agreement is part of a package that includes one or more software products and certain electronic and/or written materials. This Agreement covers your licensing
of the Software (as the term is defined below). BY CLICKING YOUR ACCEPTANCE OF THIS AGREEMENT, OR BY INSTALLING OR USING THE SOFTWARE OR ANY OTHER COMPONENT OF THE PACKAGE, YOU ACKNOWLEDGE AND REPRESENT THAT:
(1) YOU ARE AN ACADEMIC OR NOT-FOR-PROFIT RESEARCHER INTENDING TO USE THE
SOFTWARE ONLY FOR NOT-FOR-PROFIT AND/OR ACADEMIC RESEARCH PURPOSES; and
(2) YOU HAVE READ ALL OF THE TERMS AND CONDITIONS OF THIS AGREEMENT, UNDERSTAND THEM, AND AGREE TO BE LEGALLY BOUND BY THEM.
If you do not agree to the terms of this Agreement, you may not install or use the Software.
“Designated Site” means your facilities or offices located at the postal address provided by you, unless otherwise indicated in a license key provided to you; and “Software” means the software product(s) accompanying
this Agreement, including the associated user manuals, user documentation and application program interfaces, and license key(s) provided, and any patches, updates, upgrades, improvements, enhancements, fixes
and revised versions of any of the foregoing that may be provided to you from time to time, and any combination of the foregoing.
1. TAXES; SHIPPING. If any authority imposes a duty, tax or similar amount on the transfer of Software to you
(other than based on Licensor’s income), you agree to pay, or to promptly reimburse Licensor for, all such
amounts. All shipments by Licensor or its designee are FCA point of shipment.
2. GRANT OF SOFTWARE LICENSE. Subject to the terms and conditions of this Agreement, Licensor grants to
you a non-exclusive, non-transferable license (the “Academic Vector NTI License”) to use the Software
for your internal operations and internal data processing purposes within and up to the Authorized Scope
for which you have registered the Software for use. The term “Authorized Scope” means the following,
and any other capacity or use restrictions on the license granted to you: You have received a “Personal
Static” license. For each such license you may install and operate the Software on a designated computer
located at the Designated Site. You may not network the Software for use at any other location. Use of the
Software is limited to the computer designated for each Static license.
3. RESTRICTIONS ON USE. You acknowledge that you are receiving LICENSED RIGHTS only. The Software
may only be used internally, by you, with the license key provided, for your copy(ies) of the Software. If
any Software is provided on separate media (e.g., a CD-ROM), you may make a reasonable number of
copies solely for your internal backup purposes. You shall not directly or indirectly: (i) sell, rent, lease,
redistribute or transfer any of the Software or any rights in any of the Software, including through “charge
back” or any other reselling or redistribution within your organization of any usage capacity you have
licensed, without the prior express written approval of Licensor, (ii) modify, translate, reverse engineer
(except to the limited extent permitted by law), decompile, disassemble, create, derivative works based on,
sublicense, or distribute any of the Software, (iii) use any Software for the benefit of any third parties (e.g.,
in an ASP, outsourcing or service bureau relationship), or in any way other than in its intended manner, (iv)
remove any proprietary notice, labels, or marks on or in Software, or (v) disable or circumvent any access
control or related device, process or procedure established with respect to the Software, including the
license key or any other part thereof. You are responsible for all use of the Software and for compliance
with this Agreement; any breach by you or any user of the Software provided to you shall be deemed to
have been incurred by you. Licensor reserves all rights not expressly granted. You agree and acknowledge that you have been provided sufficient information such that you do not need to reverse engineer the
Software in any way to permit other products to interoperate with the Software.
4. NO SEPARATION OF COMPONENTS. The Software is licensed as a single product. Some Licensor software
products combine separately available components into a single product (e.g., a software suite product
may be comprised of multiple component products). When licensed as a combination product, the component parts may not be separated for use independently of the combination product. You must first pur-
xxxiii
Vector NTI Advance 10 User’s Manual
chase a license to each component of the combination product before you may use it independently of the
combination product.
5. TERM AND TERMINATION. Unless otherwise agreed, the term (“Term”) of this Agreement shall continue until
it is terminated. Licensor may terminate this Agreement (or any License) upon fifteen (15) days prior written notice if you breach this Agreement and do not cure the breach within fifteen (15) days following receipt
of written notice of breach. Immediately upon any termination or expiration of this Agreement, you agree
to: (i) cease use of the Software for which your rights have been terminated; (ii) upon request, return to
Licensor (or destroy) all copies of the Software and any other Confidential Information or proprietary materials in your possession for which your rights have been terminated; and (iii) upon request, certify in writing
your compliance with (i) and (ii), above.
6. CONFIDENTIALITY. You agree to protect Licensor’s Confidential Information with the same degree of care
used to protect your own Confidential Information (but in no event less than a reasonable standard of
care), and not to use or disclose any portion of such Confidential Information to third parties, except as
expressly authorized in this Agreement. You acknowledge that the Software, including its structure, organization and design constitute proprietary and valuable trade secrets (and other intellectual property rights)
of Licensor and/or its licensors. The term “Confidential Information” means, collectively, non-public
information that Licensor (and its licensors) provide and reasonably consider to be of a confidential, proprietary or trade secret nature, including but not limited to confidential elements of the Software and Licensor’s (and its licensors’) technology and know-how, whether in tangible or intangible form, and whether or
not stored, compiled or memorialized physically, electronically, graphically, photographically, or in writing.
Confidential Information does not include any information which: (i) is, as of the time of its disclosure or
thereafter becomes part of the public domain through no fault of the receiving party; (ii) can be demonstrated by credible evidence: (x) as rightfully known to the receiving party prior to the time of its disclosure,
or (y) to have been independently developed by the receiving party; (iii) is subsequently learned from a
third party not under a confidentiality obligation; or (iv) is required to be disclosed pursuant to a duly authorized subpoena, court order, or government authority, provided that the receiving party has provided
prompt written notice and assistance to Licensor prior to such disclosure, so that Licensor may seek a protective order or other appropriate remedy to protect against disclosure.
7. WARRANTY AND DISCLAIMER. Your use of the Software and its results is entirely at your own risk. Should
the Software prove defective, you assume the entire cost of all service, repair or correction. The Software
is made available to you “AS IS”, AND LICENSOR MAKES NO REPRESENTATION OR WARRANTY
REGARDING THE SOFTWARE, AND HEREBY DISCLAIMS ALL WARRANTIES, WHETHER EXPRESS,
IMPLIED, OR STATUTORY, INCLUDING BUT NOT LIMITED TO ANY IMPLIED OR OTHER WARRANTIES OF MERCHANTABILITY, FITNESS FOR A PARTICULAR PURPOSE, TITLE, NON-INFRINGEMENT OR NON-MISAPPROPRIATION OF INTELLECTUAL PROPERTY RIGHTS OF A THIRD PARTY,
CUSTOM, TRADE, QUIET ENJOYMENT, ACCURACY OF INFORMATIONAL CONTENT, OR SYSTEM
INTEGRATION. NO WARRANTY IS MADE THAT ANY SOFTWARE WILL OPERATE IN AN ERROR
FREE, UNINTERRUPTED OR COMPLETELY SECURE MANNER, OR IN COMBINATION WITH THIRD
PARTY HARDWARE OR SOFTWARE PRODUCTS. YOU ACKNOWLEDGE THAT LICENSOR HAS NO
CONTROL OVER THE SPECIFIC CONDITIONS UNDER WHICH YOU USE THE SOFTWARE.
ACCORDINGLY, EXCEPT FOR THE FOREGOING EXPRESS WARRANTY, LICENSOR CANNOT AND
DOES NOT WARRANT THE PERFORMANCE OF THE SOFTWARE OR ANY PARTICULAR RESULTS
THAT MAY BE OBTAINED BY THE USE OF THE SOFTWARE. THE SOFTWARE DOES NOT REPLACE
YOUR OBLIGATION TO EXERCISE YOUR INDEPENDENT JUDGMENT IN USING THE SOFTWARE.
The warranty made by Licensor may be voided by abuse or misuse. Licensor has no obligation to provide
any support, error corrections, updates, or any other services related to the Software (“Services”). ANY
SERVICES RELATED TO THE SOFTWARE ARE PROVIDED “AS IS”, AND LICENSOR MAKES NO
REPRESENTATION OR WARRANTY REGARDING SUCH SERVICES, AND HEREBY DISCLAIMS ALL
WARRANTIES, WHETHER EXPRESS, IMPLIED, OR STATUTORY, WITH RESPECT TO SUCH SERVICES.
8. THIRD PARTY SOFTWARE AND DATABASES. You understand that third party products integrated into the Software or provided for use with the Software may be subject to additional terms and conditions and/or
license agreements from the applicable third party vendor, which shall govern over conflicting terms of this
Agreement for purposes of your relationship with the third party vendor. You agree not to use any such
xxxiv
third party product on a stand-alone basis independent of the Software, unless you have purchased the
appropriate license from the third party vendor for use of such products. NOTWITHSTANDING ANYTHING TO THE CONTRARY IN THIS AGREEMENT, ALL THIRD PARTY SOFTWARE, DATABASES AND
OTHER PROGRAMS AND SOFTWARE COMPONENTS ARE PROVIDED “AS IS” WITHOUT ANY WARRANTY WHATSOEVER FROM LICENSOR. ANY DATABASES OR OTHER INFORMATION PROVIDED
BY LICENSOR ARE DESIGNED TO SUPPLEMENT OTHER SOURCES OF INFORMATION, AND ARE
NOT INTENDED TO REPLACE YOUR PROFESSIONAL DISCRETION AND JUDGMENT. Licensor
agrees, upon request and as Licensor’s sole liability and obligation, to have passed through to you (to the
extent it may reasonably do so) any warranties and indemnifications provided by the applicable third party
vendor of any third party products provided to you. To the extent any problem or liability arises from a third
party product, you agree to seek recourse solely from the applicable third party vendor and not Licensor.
9. INDEMNIFICATION BY YOU. You agree to indemnify and defend Licensor, its licensors, and its affiliates,
against any third party claims arising from or related to your use of the Software or any breach of the terms
and conditions of this Agreement, and you agree to pay all costs, losses, damages, and attorneys’ fees
that a court finally awards, and all associated settlements.
10. EXCLUSION OF OTHER DAMAGES. EXCEPT TO THE EXTENT PROHIBITED BY APPLICABLE LAW,
UNDER NO CIRCUMSTANCES SHALL LICENSOR, ITS AFFILIATES, OR ANY OF THEIR SUPPLIERS
OR LICENSORS BE LIABLE FOR ANY OF THE FOLLOWING: (I) THIRD PARTY CLAIMS (II) LOSS OR
DAMAGE TO ANY SYSTEMS, RECORDS OR DATA, OR (III) DIRECT, INDIRECT, INCIDENTAL, SPECIAL, CONSEQUENTIAL, PUNITIVE, RELIANCE, OR COVER DAMAGES (INCLUDING FOR LOST
PROFITS, LOST SAVINGS AND DAMAGE TO ANY DATA OR SYSTEMS); EVEN IF ADVISED OF THE
POSSIBILITY OF SUCH DAMAGES. YOU ARE SOLELY RESPONSIBLE AND LIABLE FOR VERIFYING
THE ACCURACY AND ADEQUACY OF ANY OUTPUT FROM THE SOFTWARE, AND FOR ANY RELIANCE THEREON.
11. LIMITATION OF LIABILITY. EXCEPT TO THE EXTENT PROHIBITED BY APPLICABLE LAW, IN NO EVENT
WILL LICENSOR’S OR ITS AFFILIATES’ TOTAL, AGGREGATE LIABILITY ARISING FROM OR
RELATED TO THIS AGREEMENT OR THE SOFTWARE (INCLUDING FOR NEGLIGENCE, STRICT LIABILITY, BREACH OF CONTRACT, MISREPRESENTATION, AND OTHER CONTRACT OR TORT
CLAIMS) EXCEED THE AMOUNT OF FEES PAID BY YOU TO LICENSOR UNDER THIS AGREEMENT
FOR THE SOFTWARE THAT IS THE SUBJECT OF THE CLAIM UNDERLYING THE DAMAGES, OR
ONE HUNDRED DOLLARS ($100.00), WHICHEVER IS LESS.
12. VERIFICATION. Licensor shall have the right to have on-site audits periodically conducted of your use of the
Software. These audits will generally be conducted during regular business hours, and Licensor will use
its reasonable efforts not to interfere unduly with your regular business activities. Licensor may also
require you to accurately complete a self-audit questionnaire in a form Licensor may have provided. If an
audit reveals unauthorized use, you must promptly order sufficient licenses and Authorized Scope to permit all usage disclosed. If material unlicensed use is found (i.e., license shortage of 5% or more), you also
shall reimburse Licensor for its costs incurred in connection with the verification.
13. LEGAL COMPLIANCE; RESTRICTED RIGHTS. Software is provided solely for lawful purposes and use. You
shall be solely responsible for, and agree to comply with, all applicable laws, statutes, ordinances, and
other governmental authority, however designated. Without limiting the foregoing, you agree to comply
with all U.S. export laws and applicable export laws of your locality (if you are not in the United States), and
shall not export any Software or other materials provided by Licensor without first obtaining all required
authorizations or licenses. Products acquired for use within or for any United States federal agency are
provided with “LIMITED RIGHTS” and “RESTRICTED RIGHTS” as defined in DFARS 252.227-7013 and
FAR 52.227-19.
14. GOVERNING LAW; SEVERABILITY. This Agreement shall be governed in all respects by the laws of the State
of California, USA, without regard to choice-of-law rules or principles. Any dispute arising out of or related
to this Agreement shall be resolved only in the state or federal courts having jurisdiction in California. If
any provision of this Agreement is held to be illegal or unenforceable for any reason, then such provision
shall be deemed to be restated so as to be enforceable to the maximum extent permissible under law; the
remainder of this Agreement shall remain in full force and effect.
xxxv
Vector NTI Advance 10 User’s Manual
15. GENERAL. This Agreement is the parties’ complete agreement regarding its subject matter, superseding
any prior oral or written communications. You understand and agree that, to the extent Licensor permits
you to use a non-Licensor purchase order or other form to order Software, Licensor does so solely for your
convenience. Any terms in any such forms that purport to vary or are in addition to any terms in this Agreement or in the applicable Licensor form covering your purchase shall be deemed to be void and of no
effect. Amendments or changes to this Agreement must be in mutually executed writings to be effective.
Sections 1, 3--8, 11--15, and all warranty disclaimers and use restrictions shall survive the termination or
expiration of this Agreement. The parties are independent contractors for all purposes under this Agreement. Neither party shall be liable for any delay or failure due to force majeure and other causes beyond
its reasonable control. Any notices under this Agreement to Licensor must be personally delivered or sent
by certified or registered mail, return receipt requested, or by nationally recognized overnight express courier, to the address specified herein or such other address as Licensor may specify in writing. Such notices
will be effective upon receipt, which may be shown by confirmation of delivery. All such notices shall be
sent to the attention of General Counsel of Invitrogen Corporation (unless otherwise specified by Licensor). You may not assign or otherwise transfer this Agreement without Licensor’s prior written consent.
This Agreement shall be binding upon and inure to the benefit of the parties’ successors and permitted
assigns. You agree, at Licensor’s request and reasonable expense, to provide reasonable assistance and
cooperation to Licensor and its designees, and to give testimony and execute documents and to take such
further acts reasonably requested by the other to acquire, transfer, maintain, perfect, and enforce Licensor’s intellectual property rights as described in this Agreement. To the extent you fail to do so, you appoint
Licensor’s or its affiliates’ officers as your attorney in fact to execute documents on your (and your personnel's), successors’ and assigns’ behalf for this limited purpose.
I HAVE READ AND AGREE TO BE BOUND BY THE ABOVE TERMS THAT APPLY TO
ME AS EITHER A COMMERCIAL USER (SECTION I) OR AN ACADEMIC USER (SECTION II), AS APPLICABLE.
xxxvi
C
H A P T E R
1
INTRODUCTION TO VECTOR NTI ADVANCE
Welcome
Welcome to Vector NTI AdvanceTM, part of a family of software packages developed by Invitrogen™, Carlsbad, Californa. Other life science applications developed by Invitrogen include Vector XpressionTM, Vector PathBlazerTM, LabShareTM for Vector NTI® and Vector NTI® for Mac
OS X.
Vector NTI Advance is made up of the following modules:
z
Vector NTITM
z
AlignX®
z
BioAnnotatorTM
z
ContigExpress®
z
GenomBenchTM
You may not have purchased licenses for all of the modules of Vector NTI Advance. If you would
like to do so, please contact Invitrogen at their website: www.invitrogen.com/bioinformatics for
more information.
Getting Started with Vector NTI Advance
z
To learn about the Vector NTI Advance 10 User’s Manual structure, review Chapter 1.
z
To read a brief overview of the Vector NTI Advance software, review Chapter 2.
z
To activate your license for Vector NTI Advance 10:
o
Refer to the Vector NTI Advance 10 Installation and Licensing Guide that you
received when purchasing Vector NTI Advance 10
or
o
Download the Vector NTI Advance 10 Installation and Licensing Guide from the Invitrogen website, www.invitrogen.com/bioinformatics.
1
Vector NTI Advance 10 User’s Manual
or
o
See the section on License Manager in Chapter 39, page 650 in this user’s manual.
z
To start Vector NTI Advance, refer to Launching Vector NTI on page 13.
z
To learn various methods of opening and using of Online Help, refer to Online Help on
page 13.
z
To learn independently how to use components of the Vector NTI software, walk through
the tutorials, Chapters 4 through 16.
z
To learn about the global features used in all Vector NTI Advance module viewers, periodically review Chapter 3.
z
To learn more about the automation features of Vector NTI, refer to the Invitrogen website: www.invitrogen.com/bioinformatics.
The Vector NTI User
As Vector NTI Advance uses a convenient graphical user interface (GUI), in using the software
you are expected to have some familiarity with window environments and web browsers.
The Vector Advance 10 User’s Manual Format
To be a useful and simple-to-use resource, the Vector NTI Advance User’s Manual contains:
z
Section I: Three introductory chapters, 1 through 3, covering Vector NTI basics.
z
Section II: Vector NTI Advance Tutorial chapters, chapters 4 through 16, enabling VNTI
users at any level to learn independently how to use components of the Vector NTI software.
z
Section III: Reference tools, chapters 17 through 27 organized around the functions and
features of Vector NTI.
z
Section IV: Vector NTI Advance Applications, chapters 28 through 39, covering additional components of Vector NTI Advance.
z
Section VI: Appendices
z
Section VII: A complete index
Use the manual index to easily look up and find descriptions of specific features and functions.
Electronic versions of the Vector NTI Advance 10 User’s Manual and the Vector NTI Advance
10 Installation and Licensing Guide are also available at the Invitrogen website: www.invitrogen.com/bioinformatics.
Conventions Used in this Manual
The following table uses various typefaces to differentiate between regular text and menu commands, keyboard keys, toolbar buttons, dialog box options and text that you type. The table
describes how conventions are represented in this manual.
Convention
Bold and Capitalized
Command
Capitalized command >
Capitalized command
Description
Menu command
Sequential Menu commands
Table 1.1 User Manual Conventions
2
Example
Database > Explore
Introduction to Vector NTI Advance Chapter 1
Convention
Description
Example
Keyboard key that you press
The Enter Key ENTER
Keys that you press together
Press SHIFT+ CTRL, then release
both.
TEXT IN SMALL CAPS followed by
TEXT IN SMALL CAPS
Keys that you press in
sequence
Press ENTER, followed by ENTER
Icon
Small picture on a toolbar button
that you press
Click the Zoom In button (
Boldface type
Options or tabs that you select
in dialog boxes, list boxes, or
drop-down menus
Buttons that you click
In the Restriction Enzymes dialog box,
select the enzyme(s) and press the
Add button.
Italic boldface type
Text that you type
In the New Molecule dialog box, enter
the molecule name, my pBR322.
Note:
Highlights a particular concept
or extends the current topic
Note: To calculate Separation Time, at
least two fragments must be selected.
Important:
Or
Warning!
Highlights information of which
you should be particularly aware
Important: Once parent-descendant
relationships have been disconnected,
they CANNOT be reconnected.
TEXT IN SMALL CAPS
TEXT IN SMALL CAPS
TEXT IN SMALL CAPS
+
) to
enlarge the image
Table 1.1 User Manual Conventions (continued)
3
Vector NTI Advance 10 User’s Manual
4
C
H A P T E R
2
OVERVIEW OF VECTOR NTI ADVANCE
Introduction
Vector NTI Advance, a suite of desktop applications, is a comprehensive set of sequence analysis software tools specifically designed for the molecular biologist to study, visualize, manipulate, construct and store biological molecules. With this system, you can:
z
Easily navigate and search the user-defined, password-protected molecule and enzyme
databases
z
Access molecules across a network with user-defined and password-protected databases
z
Generate recombinant strategies and protocols, and design and analyze PCR primers
and other oligos
z
Animate virtual gels for restriction fragment analysis
z
Analyze physiochemical properties of molecule sequences
z
Assemble contigs from text sequences or chromatograms
z
Create and customize publication-quality graphics
z
Take advantage of full Internet connectivity with more than 20 Internet sites for searching
and importing annotated molecules back into Vector NTI Advance
z
Automate common tasks such as batch BLAST, batch annotation, batch primer design,
etc. through the Application Programming Interfaces (APIs)
While all of the software components are fully capable of functioning independently of one
another, the program integrates data, analyses and presentations easily among the applications.
Vector NTI Database Explorer
The Vector NTI database provides storage and organization functions for molecules and other
objects used in cloning strategies, molecule manipulation and analysis, and sequence analysis.
Database objects include DNA/RNA and protein molecules, restriction enzymes, oligonucle-
5
Vector NTI Advance 10 User’s Manual
otides (including PCR primers, sequencing primers and hybridization probes), gel markers,
BLAST search results, and citations.
In the Database Explorer window, you can:
z
Create new objects
z
Edit and delete old objects
z
Perform database searches
z
Organize objects into convenient groups (subsets)
z
Import and export objects
z
Create Vector NTI “archives” of objects to share with other users
z
Format references according to bibliographic styles assigned to various professional
publications
General database functions let you make backup copies of the database in the specified subfolder of your hard drive or floppy disk, restore all database files from a backup and compress
the database by removing all unnecessary data from the data files and database tables.
Vector NTI also has two additional data managers:
z
Contact Manager to create, modify, and organize the address data of persons or organizations with which you frequently communicate.
z
User Field Manager to define data fields to describe your database objects.
Organizing your Biological Objects
Using the Vector NTI database, you can conveniently organize and effectively manage a large
amount of molecular biology data. Database objects can be organized into an arbitrary number
of subsets. The Database Explorer has convenient commands for creating and managing subsets of all database objects.
Description fields of database objects allow you to describe any object property in formal and
semiformal ways. Vector NTI serves as a global “organizer” for your biological data.
Database Search
Vector NTI lets you search for database objects using many types of data as search conditions.
These include, for example, form (circular, linear, Invitrogen), storage type (basic, constructed,
translated), size, description/comment/user fields text, and so forth.
Import/Export Functions
You can import molecules (including their feature tables) from GenBank/GenPept, EMBL/
SWISS-PROT and FASTA formats. You can also import nucleotide or amino acid sequences
from an ASCII file of flexible format, and Vector NTI will automatically create the new database
molecule and assign the sequence to the molecule.
Archives - A Tool For Sharing Database Information
Vector NTI lets you place your molecules, enzymes, oligonucleotides and gel markers into
archives that can be transferred to another computer (Mac or PC) and read by Vector NTI. This
allows you to share objects with colleagues, or to place them simultaneously on several computers. As molecules are archived, Vector NTI verifies the consistency of all information.
6
Overview of Vector NTI Advance Chapter 2
Features and Functions of Vector NTI
Creating New Molecules
There are five different ways of creating new DNA/RNA and protein molecules in Vector NTI:
1. Importing from GenBank/GenPept, EMBL/SWISS-PROT and FASTA formats, or from an
ASCII file of flexible format. The sequence and Feature map are converted from the file, and
the new molecule becomes part of the Vector NTI database.
2. Creating new molecules from user-defined nucleotide or amino acid sequences. These can
be manually entered or pasted from the clipboard and the sequence entered as a new molecule.
3. Translating a coding region of an existing DNA or RNA molecule to create new protein molecules.
4. Construction of new DNA/RNA molecules from user-defined compatible component fragments from other molecules.
5. Design of new DNA/RNA molecules from components in a user-defined fragment list, using
Vector NTI’s built-in biological knowledge to design the recombination process.
All new molecules are integrated into the database and can participate in all further operations
and analyses.
Creating New Enzymes, Oligos, and Gel Markers
Enzyme, oligonucleotide, and gel marker objects can be created “from scratch” using Vector
NTI’s editors or by importing them from a REBASE database.
Oligos and Primers
Vector NTI can design PCR primers, sequencing primers and hybridization probes and save
them to the database for future use. Using parameters you have defined, Vector NTI can analyze those primers and probes (or those you have defined yourself) to determine the best ones
for optimal experimental results, then link you to the InvitrogenTM website to order your custom
primers.
Editing Database Objects
Full molecule editing capabilities are available in Vector NTI, either from Database Explorer or
the Molecule Display window. In Molecule Display windows, you can edit molecules by inserting,
deleting and replacing sequence fragments and features. You can also modify a molecule’s display format and general data. When your editing is complete, you can save the molecule into
the database to make the changes permanent.
Parent-Descendant Connections
As you modify molecules, Vector NTI monitors and manages parent-descendant connections to
ensure data consistency through all the descendants (see Appendix D, page 669).
Generating Restriction Maps
Restriction maps of DNA/RNA molecules can be quickly generated in Vector NTI. For unsequenced molecule regions, you may enter the known positions of restriction sites. All the molecule descendants inherit these sites.
7
Vector NTI Advance 10 User’s Manual
Molecule Display
Molecule display windows are Vector NTI’s convenient graphical user interface (GUI) for
inspecting and editing text description, graphical maps and analyses, and sequences of DNA/
RNA and protein molecules. They are also powerful and convenient graphical tools for selecting
fragments for molecule construction and design and for preparing publication-quality images.
Molecule display windows consist of Text, Graphics and Sequence Panes.
Text Pane
Text Panes contain a general molecule description and folders describing a molecule’s features,
search results, cloning strategies and protocols, and biological data.
Graphics Pane
A molecule display window’s Graphics Pane contains a graphically displayed or linear molecule
map. In the Graphics Pane, you can visually select and “prepare” fragments for construction and
design of new molecules, search for probes and primers, or for restriction maps.
All graphics objects are movable, resizable and editable.
Sequence Pane
A molecule display window’s Sequence Pane contains the formatted nucleotide or amino acid
sequence of a molecule.
For DNA/RNA molecules, Vector NTI can show restriction sites, motifs, ORFs and functional
signals, and translated reading frames.
For protein molecules, Vector NTI can display protein features together with the amino acid
sequence.
You can print any molecule display window or you can save it to an external file or clipboard.
From the clipboard, you can insert maps, sequences and molecule descriptions directly into
word processing documents.
Creating Molecule Documents
You can save all the information from a molecule display window to permanent storage by creating a Molecule Document file. Since the Molecule Document format is based on GenBank/GenPept formats, not only Vector NTI, but any program able to import GenBank/GenPept files can
also import Vector NTI Molecule Documents.
Gel Display Windows
Gel Display windows can be created for different types of electrophoresis. The Gel Display window’s Graphics Pane replicates the results of an actual gel.
Creating Gel Display Windows
To create a new Gel Display window, you must define its parameters as to electrophoresis and
buffer types, electrophoresis conditions and display parameters.
You can modify the settings of a Gel Display window at any time after creation for better separation of the molecules’ fragments.
Creating Gel Samples and Gel Markers
In Vector NTI, a gel lane may contain either a Gel Sample or a Gel Marker, user-generated or
from the database. Gel Samples are created by “cutting” database molecules with restriction
8
Overview of Vector NTI Advance Chapter 2
enzymes. Gel Markers, sets of fragments of known lengths, can be loaded either from the database or can be user-generated.
Running the Gel
After a Gel Display window is created, and your samples and markers have been “added” to the
“lanes,” you can run a gel according to selected time increments or animation settings. You can
color-code specific fragments or define “separation distances” or time lengths to better visualize
fragment separation. Because of the simplicity of their generation, Gel Samples are created on
the spot for short-term use, but are not stored in the Vector NTI database.
Align X
AlignX is a multiple sequence alignment tool. In AlignX, you can:
z
Perform multiple sequence alignments on either proteins or nucleic acids without reformatting between applications and computer platforms.
z
In the alignment, link, localize and compare important domains in individual sequences
z
Generate plots of similarity and sequence complexity
AlignX features include multicolor presentation, alignment editing, sequence comparison dot
plots, guide trees, sequence and structure alignments, and similarity distribution plots. AlignX
reads all standard text formats such as FASTA, GenBank, EMBL, SWISS-PROT, GenPept, and
ASCII text.
BioAnnotator
BioAnnotator is a comprehensive set of protein and nucleic acid sequence analysis tools, offering over 50 different predefined protein scales linked with Feature maps and sequences. BioAnnotator also offers the following advanced search and analysis tools, which are run in the
Analysis Monitor (see below): ProSite, PFAM, BLOCKS and Proteolytic cleavage.
BioAnnotator is formatted so that plots can be filed, overlapped, scaled, moved and formatted to
fit your presentation needs. Sequence regions can be highlighted by changing font face, size,
and color, and the plots linked to a molecule feature table. The use of a standard text file format
in all programs eliminates the need to reformat data for use in any Vector NTI Advance modules.
ContigExpress
ContigExpress is a program for assembling many small fragments—either text sequences or
chromatograms from automated sequencers—into longer, contiguous sequences. You can
manage fragments and assemblies in an Explorer window, and open fragments and contigs in
display windows for further study and manipulation. The multi-pane windows link sequences
with their properties, chromatograms and graphic representations.
You can edit nucleic acid fragments directly with the chromatograms in full view. Changes are
tracked and an edit history is maintained. The contigs generated are then saved and managed
as GenBank, EMBL or FASTA files. No exporting or reformatting of proprietary file formats is
necessary. Just drag and drop into Vector NTI to map and analyze.
GenomBench
GenomBench is Vector NTI Advance’s genome project workhorse. GenomBench can retrieve
data from compatible DAS-compliant servers, such as UCSC and Ensembl. It provides an interface for browsing and querying such sites using keywords, flanking markers, and BLAT (UCSC
9
Vector NTI Advance 10 User’s Manual
public database) or SSAHA (Ensembl) similarity searches. GenomBench also provides a means
for mapping your data onto a genomic region using Sim4 or Spidey analyses.
As with other Vector NTI Advance applications, GenomBench has a multi-pane user interface
where you can view important text information in the project, and navigate, manipulate and
annotate a graphical representation of the genome. You can also perform sequence searches,
translations and alignments. In addition, GenomBench provides tools for querying public databases, copying and pasting sequence and graphics, performing feature searches, importing and
exporting annotated sequences and sending annotated sequence segments to Vector NTI.
Like Vector NTI, GenomBench has a Local database for storing your sequences and analysis
results.
Remote Services Tools
Vector NTI provides applications that allow you to use remote bio-services for analyzing your
data. You can store the results of such analyses in the Vector NTI Database and share them
with your colleagues. Vector NTI also provides a tool to help you configure links to the remote
servers used for analysis and data storage.
BLAST Search/BLAST Viewer
Vector NTI Advance provides you with a search engine for launching BLAST searches of the
GenBank databases at the National Center for Biotechnology Information website. Results are
listed in the BLAST Search dialog box from which they can be opened and reviewed in BLAST
Viewer, displaying a linear representation of aligned hit elements from the hit molecules. BLAST
results can be saved to the Vector NTI Database from the BLAST Viewer.
Note:
BLAST searches can also be launched from Analysis Monitor, described below.
PubMed/Entrez Search, Citation Viewer and Citation Table of Database Explorer
These tools work in tandem to provide a practical and efficient way to search public databases
for molecules or citations, and retrieve them, complete with molecule files or abstracts that can
be viewed and stored.
Remote Database Sources Wizard
The Remote Database Sources Wizard steps you through the process of creating links to
remote servers, which enable Vector NTI remote services tools to connect to external databases, such as Entrez and LabShare. Basic links for BLAST and PubMed/Entrez searches are
already created; you do not have to create them.
Miscellaneous Tools
Analysis Monitor
The Vector NTI Analysis Monitor provides a convenient interface for performing the following
advanced DNA/RNA and Protein molecule analyses included in BioAnnotator and GenomBench: PFAM, ProSite, Blocks and Proteolytic Cleavage, and Spidey and Sim4 analyses,
respectively. Analysis Monitor also provides an alternative interface for launching BLAST
searches.
Vector NTI functions as a viewer for analysis results retrieved by the Analysis Monitor. The Analysis Results data type enables you to store results from the Analysis Monitor application.
Analyses that are included with GenomBench or BioAnnotator licenses also become available
from the Vector NTI window when these products are licensed.
10
Overview of Vector NTI Advance Chapter 2
GCG Converter
GCG Converter is a tool in Vector NTI Advance that converts sequences in GCG file formats so
that they can be imported into the software.
Matrix Editor
Matrix Editor allows inspection of and editing of matrices. Matrices are used in two Vector NTI
Advance applications, AlignX and AlignX Blocks. Matrices can be viewed in either program in
the Alignment Setup dialog box, but editing can only take place in Matrix Editor.
AlignX Blocks
AlignX Blocks is a program for locating, analyzing and editing blocks of localized sequence similarity among multiple protein sequences and linking them into a composite multiple alignment.
3D-Mol
The 3D-Mol application of Vector NTI Advance allows you to visualize and manipulate 3-dimensional molecule structures described in a number of standard molecule structure files, including
PDB (Protein Data Bank). 3D-Mol also supports creation of user-defined structures and provides tools for aligning protein chains and calculating protein surfaces. Structures can be saved
to a 3D-Mol project and/or exported to PDB or M3D files, or to Vector NTI.
Oligo Files Importer
The Oligo File Importer utility allows you to import oligo lists into the Vector NTI database. The
oligo list to be imported must be in one of three file formats for use with the Oligo utility: Comma
delimited format (.csv format), Tab delimited format or Semicolon delimited format.
Tools Manager
Vector NTI is shipped with more than 20 tools providing connection to various Internet servers.
You can create your own tools connecting Vector NTI to local or remote programs using the configuration mechanism described in this chapter. All of the Vector NTI tools are organized and
managed using Tools Manager.
License Manager
Vector NTI supports three different types of licenses: static, dynamic and trial licenses. When
unlicensed, Vector NTI operates in Demo Mode for the purpose of demonstrating the basic features of the software. The various license types were developed to meet users’ needs. For
example, users in different industrial, scientific and educational environments require different
sharing and allotment privileges. These privileges are all administered through the License
Manager.
Vector NTI System Information
Vector NTI System Information is a utility application, which gathers data about the system on
which Vector NTI is installed and consolidates that information into one file. Invitrogen Customer
Support can use the System Information file to assist them in the diagnosis and resolution of
system-related Vector NTI problems.
APIs
In Vector NTI, you can automate common tasks such as batch BLAST, batch annotation, batch
primer design, etc. through Application Programming Interfaces. For more information, refer to
the Invitrogen website, www.invitrogen.com/bioinformatics and the API User’s Manual.
11
Vector NTI Advance 10 User’s Manual
12
C
H A P T E R
3
THE VECTOR NTI USER INTERFACE
Introduction
This chapter introduces you to the Vector NTI user interface and, in specific cases, to the Molecule Display Window, a powerful graphical tool for displaying and editing molecules. Included in
this chapter are global operations used routinely in many of the Vector NTI Advance applications.
Vector NTI Advance 10 runs on a number of Windows platforms. All window manipulation techniques standard for given platforms can be used with the programs, such as moving and sizing
windows, menus, toolbars, selecting objects and so forth.
This chapter assumes that you are familiar with Molecule Display windows and with basic display window techniques, such as maximizing windows, changing the sizes of text and gel
panes, switching between panes, etc.
Launching Vector NTI
To launch Vector NTI, go to the Start menu on your computer. Select Start > Programs > Invitrogen > Vector NTI Suite 10 > Vector NTI. By default, the Vector NTI workspace is launched
independently; however, the software allows you to configure the local Database Explorer to
open simultaneously with the display window. From a Molecule Display window, select Edit >
Options from the menu bar. On the General tab of the Options dialog box, select Open Local
Explorer At Startup.
Online Help
The Online Help has been written to help you master the software.
In Vector NTI Advance applications, there are ways to open Online Help:
z
Click the Help button (
help topic.
), then click on any toolbar button, opening the associated
13
Vector NTI Advance 10 User’s Manual
z
Click the Help button, then click on any command from the menu bar, opening the associated help topic.
z
Press F1 from an open dialog box, opening its associated help topic.
z
Select Help > Help Topics or Using Index from the menu bar of the application. In the
Online Help that opens, you can browse through the Table of Contents or the Index, or
launch a word search of the Online Help application.
If pressing F1 fails to open an Online Help topic, select Help > Help Topics, opening Online
Help. Proceed with a Browse through the Table of Contents or Index or do a word search. Your
topic may be in the Help files, but inadvertently not linked to its associated dialog box.Topics
may be titled by their function rather than the dialog box name. For example, the New Molecule
dialog box associated topic is named “Creating a New Molecule.”
The Application Workspace
A typical Vector NTI display window can include:
z
Text information, including object descriptions, features, recombinant strategies and
analysis results
z
Graphical features of a molecule, a gel, or a contig assembly
z
Analytical features of a molecule
z
A pairwise or multiple alignment
z
Appropriate sequences
From database or display windows:
z
Local databases can be searched
z
Public domain database searches can be launched through the Internet
z
Text descriptions, graphical maps and sequences are edited
z
Graphical representations may be formatted
z
DNA/RNA and protein molecules and search results are stored in a database
z
Preparation of publication-quality figures is supported.
Viewer Display Window Description
The display window title bar shows the name of the molecule on display or the name of the
folder being displayed.
Every display window has a menu bar. Options in the submenus vary according to the specific
application being used.
Shortcut menus associated with folders, molecules or objects from which they are opened provide many options for operations with those items. A shortcut menu is opened with a right click
with the cursor paused over the related item.
All display windows contain two or more toolbars and variants relative to the active display pane.
z
The Main Toolbar contains tools for major program functions, such as opening, saving,
and printing Display windows, undoing and re-doing actions, and launching major subsections of the program such as the Database Explorer, etc.
z
The Window Toolbar has several different variants according to the activated pane of the
topmost display window.
Many menu and toolbar options are consistent throughout the Vector NTI software. Toolbar
commands are often duplicated on the menu bar and shortcut menus, offering several means of
accomplishing the same objective.
14
The Vector NTI User Interface Chapter 3
Note:
Most toolbar buttons have associated tool tips that explain the button function. Hover the cursor
over the button to display the tool tip for that button.
When you launch Vector NTI, the empty workspace is displayed. Upon opening a molecule in
the Molecule display window, the following features can be viewed (see Figure 3.1)
Viewer Panes
Most display windows in Vector NTI Advance are divided into four sections, or panes:
z
A Text Pane holds folders containing text descriptions and analyses results for a molecule shown in the Display window.
z
A Graphics Pane displays a graphical depiction of a molecule. Features, restriction sites,
motifs, etc. are shown by labeled symbols.
z
An Analysis Pane allows certain types of DNA and protein sequence analysis properties
to be performed and the results to be viewed as linear graphics.
z
A Sequence Pane shows a nucleotide or amino acid sequence, and functional features
of a molecule.
Variations of this will be explained in appropriate chapters.
Main Menu
Main Toolbar
Pane Selection
Toolbar
Pane Toolbar
Text Pane
Graphics Pane
Sequence Pane
Figure 3.1 Molecule display window
Viewer Window Operations
The following global operations for viewer windows apply in general to Vector NTI Advance
applications. For details about operations specific to each application, refer to the appropriate
chapters.
Activating a Pane
Click anywhere in a pane to activate it or click on the pane buttons appearing at the left of the
lower toolbar.
Note:
Clicking in a pane sometimes selects an entire molecule. To avoid this, use the toolbar buttons
to activate the pane.
15
Vector NTI Advance 10 User’s Manual
Re-sizing Display Panes
Split bars separate the Text, Graphics, and Sequence Panes. Re-size the panes by dragging the
split bar that divides the panes. Position the cursor on the split bar until it changes to a twoheaded arrow. LEFT-CLICK and drag to reposition the split bar.
Scrolling the Text Pane
Scroll bars appear when the contents of a pane exceed the viewing area. Move the scroll bars
vertically or horizontally to reposition the pane contents for easier viewing. If the active pane is a
Text Pane, it can also be scrolled with the arrow keys on the keyboard.
Layout Options
Select View > Maximize Pane to expand the size of an activated pane to full screen size. Select
View > Restore Layout to return to the original pane layout.
Select View > Change Panes Layout to open the Pane Manager editor for modifying the
arrangement of the panes in the workspace. For more details, see Pane Manager on page 22.
Viewer Display Panes
Text Pane
Text Pane folders contain descriptions of molecules and other objects, their characteristics and
features, search results, methods and protocols.
Opening and Closing Folders
To open or close a folder, click the small square located to the left of the folder, double-click on
the folder or line, select View > Toggle Folder, or select the folder and press ENTER.
Opening or closing a folder does not affect its state.
Expanding and Collapsing Folders
Opening of a folder simultaneously with some or all of its subfolders is called expanding that
folder. Closing a folder simultaneously with some or all of its subfolders is called collapsing that
folder. A folder and its subfolders are called a branch.
The View menu (and the shortcut menu) has commands for expanding and collapsing folders
and subfolders in various combinations:
Command
Result
Expand One Level
Opens the focused folder; makes sure all subfolders are closed
Expand Branch
Opens the focused folder and all of its subfolders
Expand All
Opens every folder and subfolder in the text pane
Collapse Branch
Closes the focused folder and all of its subfolders
Collapse All
Closes every folder and subfolder in the text pane
Collapse Around
Closes all folders and subfolders, except any highlighted folders
and their parents
Table 3.1 View menu commands for expanding and collapsing folders and subfolders
Corresponding toolbar buttons: Expand Folder (
Branch (
16
)
), Expand Branch (
) and Collapse
The Vector NTI User Interface Chapter 3
Linking the Display window panes
Linking the panes of a display window gives the Text Pane control over the information displayed in the Graphics and Sequence Panes. When linked, information from any open folder in
the Text Pane is displayed in the Graphics and Sequence Panes, while information in closed
folders is not displayed. Certain minimum information is always displayed, however; a molecule
name and length in a Graphics Pane and the nucleotide or amino acid sequence in a Sequence
Pane.
To link panes, activate the Text Pane and click the Link Panes button (
bar.
) on the Window tool-
Linking panes reduces clutter, displaying only those objects that are important to your current
task and lets you display symbols hidden by Vector NTI’s Standard Arrangement of graphics
objects. The Standard Arrangement of DNA/RNA molecules’ graphics displays a maximum of
70 restriction sites plus 70 motifs, displayed to show as many different enzymes and motifs as
possible.
You can override this display by linking the panes and opening the text folders for the only signals whose every occurrence you want to display.
Use the linked panes to create attractive publication-quality figures without switching to the Picture Editing mode and editing the picture manually. With the panes linked, close all folders, then
open the folders of the signals you want to display, and then click the Standard Arrangement
button (
space.
). Symbols and labels will be redistributed to take maximum advantage of available
Finding Objects on Graphics and Sequence Panes
Some objects, described in the Text Pane, are also displayed in the Graphics and Sequence
Panes. To find the position of the object, select its line in the Text Pane and click the Find button
(
) in the window toolbar, select Edit > Find or press CTRL+ F. The object will be selected on
the Sequence and Graphics Panes. The Find command is disabled if the selected line does not
describe the object, displayed in two other panes.
Note:
Vector NTI finds only single objects like a restriction site, not multiple objects like all restriction
sites for a certain REN.
Graphics Pane
Zooming the Graphical Map In and Out
To enlarge a graphical map, activate the Graphics Pane and click the Zoom In button (
) on
the Window Toolbar or choose View > Zoom In. The keyboard shortcuts are ] and SHIFT + ]. To
zoom in by a small increments, SHIFT + CLICK the Zoom In button.
To zoom out from a graphical map (reduce it by 50%), click the Zoom Out button (
) on the
Window toolbar or choose View > Zoom Out. The keyboard shortcuts are [ and SHIFT + [.To
zoom out by a small increments, hold down the SHIFT key and click the Zoom Out button.
If the current display is linear, change the horizontal zoom factor only using CTRL + CLICK on the
Zoom In or Zoom Out button. Changing only the horizontal zoom factor changes the internal
aspect ratio of the graphical display; this ratio is saved when you save Display Setup and can be
applied to other Display windows as well.
17
Vector NTI Advance 10 User’s Manual
To fit a graphical map to the current size of the Graphics Pane, click the Fit to Window button
(
) on the Window toolbar or choose the equivalent command in the View menu.
To zoom into a selection on the graphics map, making the selection the current size of the
Graphics Pane, click the Fit Selection to Window button (
) on the toolbar or choose the
equivalent command in the View menu. In some display windows, you can select View > View
Selection or click the View Molecule Fragment button (
select View > View Whole Molecule.
). To return to the original view,
One button is specific to the Gel Display window. Click the True-Scale View button (
) to display the gel in an approximation of true scale. When you select this display option, Vector NTI
looks up the pixel size (dot pitch) of your monitor and displays the gel based on that value.
Sequence Pane
Formatting Sequence Text
To format sequence text, select it by click + dragging the mouse across the text. Because the
Sequence Pane is active, you can use any of the following buttons or keystrokes to format the
text.
Button
Keystroke
Description
CTRL
+B
Set or clear bold character(s) attribute
CTRL
+I
Set or clear italic character(s) attribute
CTRL
+U
Set or clear underline character(s) attribute
Font style drop-down menu
--
Select font name for character(s)
Font size drop-down menu
--
Select font size for character(s)
--
Select font color for character(s)
--
Select background color for character(s)
Table 3.2 Formatting sequence text
Miscellaneous Interface Features
Selection Techniques
General Selection Techniques
To select text in a Molecule Viewer display window’s Text Pane, click on the line you wish to
select. To select multiple lines in a Sequence or Text Pane, press the mouse button and drag
across the lines you wish to select.
To make a selection in a display window’s Graphics Pane, choose View > Edit Picture with an
active Graphics Pane or click the Edit Picture button (
) to enter the Picture Editing mode
and click on any object or label to select it. To select more than one object, click on each object
in turn while holding down the SHIFT key.
18
The Vector NTI User Interface Chapter 3
To select text in a Sequence Pane, click and drag the mouse across the text.
You can select an entire pane by making that pane the active pane and choosing Edit > Select
All.
Broadcasting a Selection
The Broadcast Selection feature of Vector NTI Advance allows you to select a region in the
sequence pane of an opened molecule in one Vector Advance application and then transfer that
selection to the same molecule that is currently open in other Vector NTI Advance applications.
The Broadcast Selection feature can be accessed from the shortcut menu visualized by right
clicking on a selection in the sequence pane of any of the Vector NTI Advance applications (Figure 3.2):
Figure 3.2 Broadcast Selection feature
Choose the Broadcast Selection entry from the shortcut menu to mark that sequence area in the
same molecule currently open in any other Vector NTI Advance application.
Copying Display Window Text, Graphics or Sequences Image To The Clipboard
Copying in Vector NTI can be done via several different methods:
Edit > Camera or Camera Button
The Camera feature copies the graphical representation, or “takes a picture” of the selection or
activated pane contents. The contents are copied to the clipboard from where they are pasted
into a new page or slide in other running applications.
Activate a pane or make a selection, then click the Camera button (
) or choose Edit > Camera. In the dialog box that opens, choose the range and destination for the copied pane.
Note:
z
Range – Specify the range of data to be copied. The selection option is unavailable if a
selection is not defined in the active pane.
z
Copy To – Specify the destination of the copy operation. If the File option is selected, the
Copy To dialog box opens where the name of the output file and file type can be specified.
If nothing is selected, the entire pane is copied. The format of this dialog box may vary slightly in
different applications/panes.
19
Vector NTI Advance 10 User’s Manual
Copying Sequence or Alignment Pane Data
In copying the contents of a Sequence or Alignment Pane to the clipboard, the Camera dialog
box offers two formats for the copy:
Note:
z
Metafile picture – only the snapshot of the Sequence or Alignment Pane will be copied
to the Clipboard
z
Text – you can further specify to print either the entire alignment or only the selected part
of it (if there is selection at the moment). Sequences may or may not be wrapped. It can
then be pasted into any text processor.
A double-stranded sequence copied from Vector NTI becomes single-stranded when it is
pasted.)
The Clipboard stores Vector NTI text, sequence, alignment and graphical representations in
both RTF (Rich Text Format preferred by word processors) and in plain text format (for e-mail
and other applications preferring plain text).
Note:
The RTF representation might not have exactly the same look as the sequence in the Sequence
Pane due to limitations of RTF.
Vector NTI graphics copied with the Camera to a file can be stored as either a Windows Metafile
(.wmf) or a Joint Photographic Experts Group (.jpg) file.
Edit > Copy or Copy Button
This copy feature transfers actual sequence and annotations, the molecule file, rather than just
the graphical representation. Molecules copied this way can be shared and used in other Vector
NTI Advance applications.
Text Pane data is copied as plain multilane text. Sequence data is copied as a plain text string.
All sequence formats recognized by Vector NTI can be pasted from the Clipboard. Graphics
Pane data is copied as a Windows Metafile.
Make the selection, then click the Copy button (
) or select Edit > Copy Sequence. The
data is copied to the Clipboard or to a file in text format. Preserves formatting and enables easy
data exchange with other applications.
Copying Raw Sequence
To copy real sequence data to the Clipboard, select a sequence region and choose Edit > Copy
Sequence. The sequence is copied in the plain text format without formatting or line numbering.
This “raw” format is suitable for pasting into other molecular biology software including programs
in Vector NTI Advance. The shortcut for the copy operation is CTRL + C.
Edit > Copy To Command
This copy command saves a whole molecule or selection of a molecule to the Clipboard or to a
file in various formats, including saving a DNA/RNA sequence to a protein translation. If the
whole sequence is chosen, you have a choice of saving to GenBank, EMBL, FASTA, plain
sequence or amino acid translation (for DNA molecules). For a selection, the file format choices
are FASTA, plain sequence or amino acid translation (for DNA selections).
Open a molecule, make a selection, if desired, and choose Edit > Copy To > File or Edit >
Copy To > Clipboard from the pull down menu. Choose the desired format type and storage
location on the hard drive, in the case of saving to a file. Choose Whole Molecule or Selection
and Direct or Complementary strand (for DNA selections).
The Edit > Copy To command is implemented in Vector NTI and the Vector NTI Database
Explorer.
20
The Vector NTI User Interface Chapter 3
Note:
In the Vector NTI Database Explorer, you can select multiple molecules and copy them to the
Clipboard in multiple GenBank, EMBL or FASTA format using the Copy To command.
Printing from Display Windows
Display windows are printed one pane at a time. To print a pane, activate it, then click the Print
button (
Note:
) on the main toolbar or choose File > Print.
Print copies are similar to the screen display, so adjust the picture on screen before printing.
Page Setup
Text and Sequence Panes are printed in a standard format. For the text and sequence, you can
change the content of what is printed, but not the layout. If a Text Pane is activated, any open
folder is printed.
Graphical maps can be printed out at any size and in various positions on the page.
To change the size and position of a graphical map’s printout, select File > Page Setup. In the
dialog box, set the margins (in inches) for your printout. Select File > Print Setup to specify the
page orientation and size. Click OK to print.
Header and Footer Formatting Codes
The default settings for header and footer displays can be changed by selecting File > Page
Setup. In the Page Setup dialog box, enter the appropriate formatting code in the header and
footer sections. Click OK. (Default header settings are &D&c and default footer settings are
&sPage&p&l.)
Formatting Code
Result
&f
Prints the file name
&D
Prints the document name (which is most cases is the molecule
name)
&p
Prints the page number
&t
Prints the time representation
&d
Prints the day of the month (as a decimal number)
&s
Prints the date in full format
&r
Aligns the text to the right side of the page
&c
Aligns the text in the center of the page
&l
Aligns the text to the left side of the page
&u
Draws a line at the top of the page
&L
Draws a line at the bottom of the page
&b
Places a box around the text
Figure 3.3 Formatting Codes
Print Preview
To see a preview on your screen of what the printout will look like, choose File > Print Preview
or click the Print Preview button (
).
If you want to print just a selection, use the camera option. Select the region, click the camera
on the Main Toolbar, paste the copied selection to a new application (such as word processing
21
Vector NTI Advance 10 User’s Manual
software) and print from there. (See previous section on Copying Display Window Text, Graphics or Sequences Image to the Clipboard.)
Exporting Molecule Data
Vector NTI Advance applications allow simple export of a molecule as GenBank (GenPept for
proteins), EMBL (SWISS-PROT for proteins), FASTA, or as text sequence. To export a molecule
to an external file, choose File > Save As. In the dialog box, select the Save As File tab and
designate the format type to be exported. Molecules and sequence information can also be
exported by selecting File > Operations > Molecule Export. Select the Save As File tab and
choose the file type you want to save and click OK in the standard File save dialog box.
Pane Manager
In most components of Vector NTI Advance, you can modify the layout of the display panes. To
open the Panes Layout Editor, sometimes called Pane Manager, where you can modify display
pane layout, select View > Change Panes Layout.
The main elements of the Pane Manager editor dialog box (Figure 3.4) are the hierarchy layout
tree, the preview panel, and the drop-down menu (with a list of predefined layouts).
Figure 3.4 Pane Manager editor dialog box
The hierarchy layout tree represents the current layout (always the last settings used), while the
node (Vertical, Horizontal, or Tabular) describes the relationship among the panes.
Options for modifying the pane layout appear on the shortcut menu, opened from the Vertical,
Horizontal and Tabular nodes or from the Text, Graph or Sequence Pane leaves. Shortcut menu
options are as follows:
z
Change Layout – For Vertical, Horizontal, or Tabular nodes, this operation changes the
relationship between underlying leaves (designated with green icons).
z
Dismiss – This operation does not affect the root node. It removes the selected node,
and shifts all of the underlying leaves to control of the root node. For example, if you dismissed Horizontal in the above graphic, the Text, Graph, and Sequence Panes would all
be displayed vertically.
z
New sublayout – This adds a new node in the designated area.
z
Up – This will move the node or leaf up in the tree.
z
Down – This will move the node or leaf down in the tree.
You can also change the parent node for any node or leaf. All you have to do is drag the node or
leaf and drop it to new parent node.
22
The Vector NTI User Interface Chapter 3
The Predefined Layouts drop-down menu contains a list of predefined pane layouts.
The preview panel of the editor shows the layout for the current state of the hierarchy tree and is
redrawn immediately when you change the layout. This panel is immediately redrawn after the
state of the hierarchy tree is changed. The Info Pane is generally known as the Text Pane in
most Vector NTI applications.
Click OK button after editing the layouts to apply your changes to the real panes or click Cancel
to discard your changes.
Notes:
z
You cannot add or delete a pane leaf. You can only move these leaves and configure
their output.
z
The Tabular selection places tabs at the bottom of each pane in the window.
z
The Predefined option Standard returns the layout to the original.
23
Vector NTI Advance 10 User’s Manual
24
C
H A P T E R
4
TUTORIAL: MOLECULE DISPLAY WINDOWS
Introduction
This tutorial chapter introduces you to the Vector NTI interface and Display windows, Vector NTI
Advance’s primary means for displaying and manipulating DNA/RNA and protein molecules,
gels, and other search and analysis features.
At the end of this tutorial session, you will be able to:
z
Create and become familiar with Molecule Display windows for DNA and proteins
z
Navigate the Vector NTI interface
z
Manipulate molecule graphics, sequences, and Text Panes
z
Review molecule data
z
Select and examine molecule fragments
z
Link molecule features for selective display in all panes
z
Display amino acid translations of the nucleotide sequence and open corresponding proteins
Follow the steps of the tutorial in the order shown. Figures show what your screen should look
like at various points along the way.
1. Launch Vector NTI
To launch Vector NTI, select Start > Programs > Invitrogen > Vector NTI Suite 10 > Vector
NTI.
The first time you enter Vector NTI after installation, the database is empty. Vector NTI asks permission to import an initial set of database objects from Vector NTI archives. Click the OK button
in the confirmation dialog boxes for the creation of all objects.
The DNA molecules, proteins, enzymes, oligos, and gel markers are imported to form the initial
Vector NTI database.
25
Vector NTI Advance 10 User’s Manual
2. Inspect the Vector NTI Workspace and Database Explorer Windows
Vector NTI first appears on the screen with an empty workspace.
Figure 4.1 Vector NTI Empty Workspace
To open a molecule, access the Database Explorer from the toolbar icon (
) or the Molecule
menu and select a DNA/RNA molecule or Protein from the database table. The Vector NTI database is a collection of molecules and laboratory data, organized for easy retrieval and management in Vector NTI’s Database Explorer.
The Explorer window can be closed without exiting Vector NTI. You can activate or reopen the
Database Explorer window at any time using the Local Database button (
bar of the Vector NTI workspace.
) on the main tool-
You will work extensively with the Database Explorer tutorial, Chapter 7, but for now close the
Explorer by clicking on the Close button (
Note:
).
By default, the Vector NTI workspace opens independently, however, it can be configured to
open the local Database Explorer simultaneously each time a Vector NTI session is initiated.
From a Molecule Display window, select Edit > Options from the menu bar. On the General tab
of the Options dialog box, select Open Local Explorer At Startup.
3. Create and Inspect a Molecule Display Window for pBR322
A Molecule Display window displays text information including a description of a molecule, features and a graphical map of the molecule and its sequence. Before proceeding any further
however, let’s open a molecule so that you can review the features as they are discussed.
On the Molecule Display main (upper) toolbar, click the Open Document button (
). In the
Open dialog box, select the Database DNA/RNAs tab. The DNA/RNA Molecules (MAIN) data-
26
Tutorial: Molecule Display Windows Chapter 4
base is selected in the drop-down menu. On the molecule list, scroll to pBR322 and double click
on it, opening its Molecule Display window.
Figure 4.2 Molecule Display window for pBR322
A Molecule Display window title bar displays the name of the open object.
The Molecule Display window is divided into three panes: a Text Pane (upper left) containing
folders with descriptions of a molecule and analysis results, a Graphics Pane (upper right) displaying a graphical depiction of the molecule map including labeled features and restriction
sites, and a Sequence Pane (lower) displaying the molecule’s nucleotide or amino acid
sequence.
All Vector NTI Advance windows have a Main Menu and toolbars where many different options
and operations can be initiated. While many toolbar buttons are consistent in all display windows, many toolbar buttons are context-sensitive. Most toolbar buttons have associated tool
tips that explain the button function. Hover the cursor over the button to display the tool tip for
that button.
4. Arrange the Display Window Conveniently
To modify the relative sizes of the display panes, you can move the vertical and horizontal split
bars. Move the cursor arrow to the split bar where it changes to a two-ended arrow. CLICK +
DRAG with the left mouse button to move the split bar. Additionally, each pane has its own scroll
bars when the pane content exceeds its display area.
To activate the different panes of the display window, click the Text Pane (
(
) or Sequence Pane (
), Graphics Pane
) buttons on the Window Toolbar. (You can also activate each
pane by clicking it.) Note how the Windows Toolbar changes, giving you different tools for each
pane.
Switch to the Graphics Pane. Move the horizontal and vertical split bars to enlarge the Graphics
Pane viewing area.
27
Vector NTI Advance 10 User’s Manual
Click on each of the following buttons to resize the graphical map:
z
The Zoom In button (
) enlarges the image
z
The Zoom Out button (
z
The Fit to Window button (
) reduces the image
) fits the image to the size of the window.
Now reduce or increase the map size in increments by holding down the SHIFT key and clicking
the Zoom buttons. Using the scroll button on your mouse while holding down the SHIFT key has
the same effect as clicking the Zoom buttons.
5. Select a Fragment or a Feature in the Graphics Pane
Now let’s study Vector NTI’s selection techniques.
Make sure the Graphics Pane is active. Choose Edit > Set Selection on the menu bar, opening
the Set Selection dialog box. Enter the range 100 bp – 1000 bp and click OK.
A selection wire-frame highlights the fragment on the molecule map (Figure 4.3), with a caret
(short darkened line perpendicular to the wire-frame) marking one end of the wire-frame.
The selection position is displayed in the status bar at the bottom of your screen. The caret position is also indicated on the status bar. The selection is simultaneously highlighted in the
Sequence Pane.
Figure 4.3 A selection wire-frame highlights the fragment on the molecule map
Modifying the Selection
Click on the status bar with the mouse, opening the Set Selection dialog box again. Change the
setting to 200 bp – 2000 bp.
You can reposition the 5’or 3’ ends with the mouse by “dragging and dropping”. Move the cursor
to the 5’ end, identified when the cursor changes shape to a crosshair with the 5’ mark (
).
Click and drag the 5’ caret to a new position near the start of the molecule (“12:00 o’clock”).
Hold the SHIFT key down and press the right or left keyboard arrows. This moves the cursor 1
nucleotide (NT) at a time. Follow this in the Status Bar. Move the 5’ end to “1 bp”.
28
Tutorial: Molecule Display Windows Chapter 4
Press the END key to move the caret to the 3’ end (or click the cursor on the 3’ end). Press and
hold the SHIFT key while moving the left or right arrows to modify the selection. Move the 3’ end
to 1250 bp.
Hold down the SHIFT + CTRL keys and press the right or left arrow several times. Note that the
caret now moves 10 NT at a time. Release the CTRL key, hold down SHIFT and press the left
arrow. The caret is moving 1 NT at a time again. If you hold down the arrow keys while holding
the SHIFT key, the caret moves rapidly through the sequence. Release the SHIFT key and press
HOME. The caret returns to the 5’ end.
To make a new selection, click anywhere in the blank area inside the molecule map, selecting
the entire map. Click on the caret and drag the wire-frame clockwise. Release the mouse.
Tip:
If you wish to deselect everything and are having problems doing so in the Graphics Pane, click
anywhere in the Sequence Pane.
Selecting Features
Locate the tetracycline resistance gene, TC(R), on the graphics map. Pause the cursor over the
functional segment or label for a moment. A pop-up message with details about the functional
signals appears under the cursor.
To simplify selection of a functional signal on a graphical map, the paused cursor changes to a
hand (
). Click once over the TC(R), selecting the gene. A wire-frame selecting the gene
appears and the selected signal changes color. The gene sequence is concurrently selected in
the Sequence Pane.
Selection Techniques Summary for the Graphics Pane
When making or altering fragment selections, there are several general points to remember:
Note:
z
Click and drag the mouse to select a region.
z
Click on a feature to select it.
z
Press SHIFT + right or left arrow to adjust an existing selection one nucleotide at a time.
z
Press CTRL + SHIFT + right or left arrows to move the caret 10 nucleotides at a time.
A selected fragment is simultaneously highlighted on the Sequence Pane. Vector NTI always
displays selection in both panes no matter where you make the selection.
6. Examine pBR322’s Nucleotide Sequence
Now let’s work with pBR322’s nucleotide sequence.
Drag the horizontal split bar up for better viewing of the nucleotide sequence. The nucleotides
are displayed in 10 NT blocks. Restriction sites appear by name above their recognition sites.
Motifs and ORFs also can be displayed by turning those options on the Molecule Display Setup,
to be discussed later in this chapter.
Click anywhere in the Sequence Pane to activate it. Any prior selection disappears and the
blinking caret is placed at the position where you placed the cursor.
29
Vector NTI Advance 10 User’s Manual
When the DNA/RNA Display Window opens, the displayed sequence is double stranded. Click
on the Show Both Strands (Double/Single Strand) button (
sequence display (Figure 4.4).
) to change to a single-stranded
Figure 4.4 Single-stranded sequence display
Scroll to the top of the sequence, using the scroll bar to the right of the sequence.
Select the first few lines of the sequence by clicking and dragging the mouse left to right along
the line and down through the sequence. The nucleotides are highlighted as you drag and their
coordinates are displayed in the selection box on the status bar. The selection also shows within
a wire-frame in the Graphics Pane. Release the mouse.
To translate the selected sequence into amino acids, click the Translate Direct (
) and
Translate Complementary (
) buttons. The corresponding amino acids appear above
(direct strand) and below (complementary strand) the highlighted sequence (Figure 4.5).
Numerals to the left of the sequence row indicate the phase of the translations. For the Direct
strand translation, phases are determined by the position of the first selected nucleotide relative
to the beginning of the molecule and are designated +1, +2, or +3. Complementary strand translation phases are determined by the position of the last selected nucleotide relative to the end of
the molecule and are designated -1, -2, or -3.
Figure 4.5 Selected double sequence strands translated into amino acids
30
Tutorial: Molecule Display Windows Chapter 4
To change from the 3-letter amino acid code to a 1-letter code, choose the Display Setup button (
) and select Display Setup on the drop-down menu.
Figure 4.6 Molecule Display Setup dialog box
In the Molecule Display Setup dialog box (Figure 4.6), choose the Sequence Set-up button and
then the 1-letter code radio button in the Sequence Setup dialog box. Click OK in both dialog
boxes. Inspect your selection. This dialog box is also used to modify or specify the display of
other features such as restriction sites, motifs and ORFs.
Click on the Erase Translations button (
) on the toolbar to erase the translations.
7. Work with pBR322’s Text Description
Click in the Text Pane or click the Text Pane button to activate the Text Pane. Drag the vertical
split bar to the right to enlarge the Text Pane.
The Text Pane is made up of folders that can be opened or closed by double clicking or clicking
on the ( ) to the left of the folder name. Open and review the contents of each of the folders.
Note particularly the following:
General Description Folder: This folder contains the molecule description. Close the folder by
clicking on it.
Feature Map Folder: Select this folder and click the Expand Branch button (
), opening all
of the Feature map subfolders. Move through the subfolders until you come to the TC(R) in a
subfolder of the CDS (Coding DNA Sequence) folder. Note the coordinates shown.
Select the TC(R) folder and click the Find button (
). This selects the gene in the Sequence
and Graphics Panes. Close the folders with a double click.
The Find button can also be used to locate ORFs, motifs and other objects. Select the appropriate folder in the Text Pane and press the Find button again. The keyboard equivalent is CTRL +
F.
Restriction Map Folder: Click on this folder to open it. Click on the Expand Branch button
(
) in the Window Toolbar, opening all restriction map subfolders.
Each subfolder contains a restriction site, listed alphabetically. Restriction sites that are present
at least once on pBR322 have active (colored) folders showing all of the site’s positions on the
31
Vector NTI Advance 10 User’s Manual
molecule and its recognition sequence. To the right of each enzyme’s name, its recognition
sequence and cleavage points are displayed. Inactive folders (grayed out) are for restriction
endonucleases with no sites on the molecule.
The set of restriction enzymes listed in the Text Pane and searched for on all DNA molecules
when you open them is defined in the Molecule Display Setup dialog box. To examine the list of
selected enzymes, click the Display Setup button (
) on the Window Toolbar and choose
Display Setup on the drop-down menu. Click the RMap Setup button, opening the Restriction
Map Setup dialog box (Figure 4.7).
Figure 4.7 Restriction Map Setup dialog box
In this dialog box, you can add (or remove) any enzymes you wish to be searched for on all
open DNA molecules. Do not change the default settings. Click Cancel in both dialog boxes to
return to the Display window.
Locate the ApaLI folder in the Text Pane. The folder is open, showing a list of all ApaLI sites on
the pBR322 molecule. Click on the first site line to select it and click the Find button (
) on
the Window Toolbar. The ApaLI site is selected on the Graphics Map and in the Sequence
Pane. Move to those panes to verify this, then return to the Text Pane. Close the Restriction
Map Folder with a double-click.
8. Link pBR322’s Text Pane to the Graphics and Sequence Panes
In Vector NTI’s Display Windows, you can link panes so that the Graphics and Sequence Panes
display only those objects whose folders are open in the Text Pane.
Click the Link Panes button (
) on the Window Toolbar. Most of the information disappears
from the graphical map, leaving only the molecule name and length. In the Text Pane, open the
Feature map folder and only the subfolders for the TC(R) gene (in the CDS subfolder) and the
Restriction Map folder with only the following enzyme folders open: ApaLI, AvaI, BamHI, EcoRI
and PstI. Because only open folders are now linked with the Graphics Pane, only those features
are illustrated in the Graphics Pane. (Make sure the folders are closed for any features you do
not want displayed.) Note that the sites and functional signals appear on the graphic map as you
open them in the Text Pane. The sequence fragments are also highlighted at the same time.
32
Tutorial: Molecule Display Windows Chapter 4
Activate the Graphics Pane and click the Standard Arrangement button on the Window Toolbar (
) to rearrange the restriction site labels for optimum display (Figure 4.8).
Figure 4.8 Standard arrangement of restriction site labels for optimum display
Turn off the text/graphics link by clicking the Link Panes button in the Window toolbar. Now the
graphics and Sequence Panes are complete and unaffected by opening or closing text folders.
9. Print pBR322’s Text Description, Graphical Map, and Sequence
To print the Text Pane contents, first make sure the Text Pane is active. Choose View > Expand
All from the menu bar. This opens all folder and subfolders.
Click on the Print Active Pane button (
Pane are printed.
). The contents of all open folders in pBR322’s Text
Print the graphics and Sequence Panes in the same manner, activating each pane first. The
pBR322’s sequence printout consists of five pages of a standard format.
10. Create a Display Window for 41BB_HUMAN
Click on the Local Database button (
) on the Main Toolbar to open Database Explorer.
In the Database Table drop-down menu in the upper left, click on the arrow and select the Protein Molecules table. Select the Protein Molecules (MAIN) subset in the All subsets window.
33
Vector NTI Advance 10 User’s Manual
Double-click on the 41BB_HUMAN molecule in the Database Protein Molecules list in the right
pane. A Molecule Display window opens for 41BB_HUMAN (Figure 4.9) containing its text
description, analysis results, graphical Feature map, and sequence:
Figure 4.9 Molecule Display window for 41BB_HUMAN
Double-click on the Analysis folder in the Text Pane, opening two tables showing the results of
the automatic protein analysis.
Select both tables by opening a shortcut menu with a right click on the Analysis Folder. Choose
the Select Folder command.
Click the Camera button (
) or choose Edit > Camera on the menu bar. In the Camera dialog
box, choose the range Selection and destination of your data Clipboard.
Click the Copy button, switch to a word processor program and paste the result into a new or
existing document. The results are displayed in a standard tabular form as shown here, (in a
truncated version):
Analysis
Entire Protein
Length
255 aa
Molecular Weight
27897.66 m.w.
1 microgram =
35.845 pMoles
Molar Extinction
coefficient
11250
1 A[280] corr. to
2.48 mg/ml
A[280] of 1 mg/ml
0.40 AU
Isoelectric Point
8.13
Charge at pH 7
3.72
Table 4.1 Results of an automatic protein analysis in a word processor program
34
Tutorial: Molecule Display Windows Chapter 4
Amino Acid(s)
Number Count
% by weight
% by frequency
Charged
(RKHYCDE)
83
36.68
32.55
Acidic (DE)
25
10.85
9.80
Basic (KR)
29
14.43
11.37
Polar (NCQSTY)
90
34.08
35.29
Hydrophobic
(AILFWV)
67
27.06
26.27
A Ala
11
3.02
4.31
C Cys
25
9.33
9.80
D Asp
11
4.51
4.31
E Glu
14
6.34
5.49
F Phe
16
8.14
6.27
Table 4.2 Results of an automatic protein analysis in a word processor program
11. Create a Display Window for 1B14_HUMAN
Return to the Database Explorer window, the Protein Molecules table and select the Protein
Molecules (MAIN) subset.
Double-click the 1B14_HUMAN protein in the molecules list, opening it in the Molecule Display
window. Arrange the panes conveniently.
Note that with a large Feature map, the Graphics Pane appears crowded. To make it more convenient to work with, use the “link mode” described above in Step 8 to display fewer features.
Alternatively, Vector NTI allows you to limit the view by choosing a fragment of the molecule for
closer inspection (Figure 4.10).
Select the region 231 aa –276 aa using the techniques described for DNA molecules.
Click on the View Molecule Fragment button (
) and choose View Selection (231 aa –276
aa) from the popup menu. All three views are rearranged to display only the selected fragment.
Figure 4.10 Viewing a molecule fragment
35
Vector NTI Advance 10 User’s Manual
Double-click on the Analysis folder in the Text Pane. Note that the analysis tables now show values for the selected fragment as well as for the entire protein.
Most of the other techniques for manipulating Protein Molecule Display windows are exactly the
same as for DNA/RNA Display windows.
12. Close the Display Windows and Exit Vector NTI
To complete your first session with Vector NTI, select File > Close on the menu bar, closing the
display windows.
To exit Vector NTI, select File > Exit.
36
C
H A P T E R
5
TUTORIAL: MOLECULE EDITING
Introduction
This chapter introduces you to operations of Molecule Display Windows that allow you to edit a
molecule’s Feature map and sequence. Although in this chapter you will work only with DNA
molecules, all operations are applicable to protein molecules as well.
At the end of this tutorial session, you will be able to:
z
Create a Molecule Display window for a molecule
z
Edit the general data, Feature map, and sequence for a DNA molecule
z
Rename, describe and save a molecule in the database
z
Alter starting coordinates for a DNA molecule
1. Launch Vector NTI
Launch Vector NTI by selecting Start > Programs > Invitrogen > Vector NTI Suite 10 > Vector
NTI.
2. Open a Display Window for pBR322
Open a Molecule Display window for pBR322 by selecting File > Open from the Main menu or
click on the Open Document (
) button. Select the Database DNA/RNAs tab in the Open
dialog box and scroll down to select pBR322 by double-clicking on the molecule name.
Alternatively, access the Database Explorer by clicking the Local Database (
) button and
choose the DNA/RNA molecules table from the pull-down menu. Select the DNA/RNA Molecules (MAIN) subset and double-click on the pBR322 molecule.
A display window opens in the workspace, containing pBR322’s text description, graphical features, and restriction maps, and sequence.
37
Vector NTI Advance 10 User’s Manual
3. Edit pBR322’s General Data
At the top of the Text Pane, double-click the pBR322 name. This opens the Edit pBR322 dialog
box (Figure 5.1):
Figure 5.1 Edit pBR322 dialog box (DNA/RNA Molecule tab shown)
First, let’s add a keyword to the list of pBR322’s keywords. Choose the Keywords tab and type
in My own plasmid in the New Keyword text entry box. Click the < Add button. Now the keyword list contains two keywords: “ATCC” and “My own plasmid”. Switch to the DNA/RNA Molecule tab, and change the Description of the molecule to “My pBR322.” Click the OK button.
Vector NTI updates the General Description folder in the Text Pane to show the new properties.
An asterisk now appears on the title bar, indicating that the molecule in a window is a modified
version of the pBR322 molecule stored in the Vector NTI database.
To save the modified pBR322 into the database under a new name, select File > Save As from
the menu bar and enter My pBR322 to the DNA/RNA text box. Click OK.
The modified molecule is stored under the new name and updated in the display window. The
title bar and both the text and Graphics Pane show the new name “My pBR322”. The title bar is
no longer marked as modified (asterisk) because the displayed molecule is exactly the same as
the database molecule “My pBR322”.
Open a Display window for pBR322 to make sure that the original molecule was not modified.
To do so, click the Open Document button (
) on the Main Toolbar and select pBR322 from
the Database DNAs/RNAs tab. To continue, close all extra Display windows except “My
pBR322”.
38
Tutorial: Molecule Editing Chapter 5
4. Edit My pBR322’s Sequence
Activate the Sequence Pane and select the fragment 21 bp–40 bp (Figure 5.2) using either the
drag and select method or the Set Selection dialog box described in the previous chapter. Note
that the selected sequence contains ClaI and HindIII sites.
Figure 5.2 Display window for pBR322 with selected fragment 21 bp–40 bp
Choose Edit > New > Replace Sequence 21 bp–40 bp from the menu bar. In the Replace
Sequence dialog box (Figure 5.3), use arrow keys to move the caret to the position “before 26
bp” (the caret position is displayed at the bottom of the dialog box). Press the Backspace key
twice to delete C and T to the left. Type A twice so that the resulting sequence is TCAAAGATAAGCTTTAATGC. The status line on the bottom of the dialog box displays “inserted 2,
deleted 2” message.
Figure 5.3 Replace Sequence dialog box
39
Vector NTI Advance 10 User’s Manual
Click the OK button to finish editing the fragment. In the updated Display window (Figure 5.4),
the ClaI site on the modified fragment has disappeared.
Figure 5.4 Display window with updated sequence
5. Revert to Database Version of My pBR322
The “My pBR322” molecule in the display window is now flagged (with an asterisk) as modified
because it differs from the version of “My pBR322” currently saved in the database.
To return to the database version, choose File > Revert To Saved from menu bar. Click OK in
the confirmation dialog box.
The molecule in the display window returns to its database state and the window is no longer
marked as modified (no asterisk). Notice that ClaI site returned to its place in the original
sequence.
6. Insert a New Sequence Fragment
In general, editing a molecule sequence requires the adjustment of its Feature map. In this step,
we will insert a new sequence fragment into our molecule and look at the resulting Feature map.
Before you start, notice that the current AP(R) position is 3293 bp–4156 bp; the TC(R) position
is 86 bp–1276 bp. To see the positions of the features, pause the mouse cursor over the feature
or its label on the graphics map. A popup label appears, displaying the name and position of the
feature under the cursor.
Place the caret at 200 bp using the mouse, arrow keys, or Edit > Set Caret Position. Choose
Edit > New > Insert Sequence at 200 bp from the menu bar, opening the Insert Sequence dialog box. Type in 10 Ts (the number of nucleotides you entered is shown at the bottom of the dialog box). Click OK to insert the sequence.
Vector NTI figures out that the modification you made requires an adjustment in the Feature
map. The dialog box appears with the message “CDS TC(R) is affected by sequence editing.”
Click the Keep button to leave the feature in a Feature map. Note that the inserted nucleotides
are highlighted in the sequence (Figure 5.5).
40
Tutorial: Molecule Editing Chapter 5
Place the mouse cursor over AP(R) again to determine its position. Note that AP(R) has been
moved 10 nucleotides clockwise and is now positioned at 3303 bp–4166 bp.
Figure 5.5 Inserted nucleotides are highlighted in the sequence
Vector NTI automatically moves all features located after the insertion but it does not move any
features before the insertion. If the insertion point is inside a feature and you decide to keep the
feature, Vector NTI automatically moves only the 3’ end of the feature. Observe that the 3’end
position of TC(R) was changed to 1286 bp.
7. Edit the TC(R) Signal
Double-click on the TC(R) signal or its name in the Graphics Pane. (The mouse cursor changes
to a hand over features and their names). Alternatively, click on the signal once and choose Edit
> Feature Properties from the menu bar or choose Feature Properties from TC(R)’s shortcut
menu. (To display a shortcut menu for any object, right click on the object. The shortcut menu
contains commands appropriate for the item to which you are pointing.)
In the Molecule Feature dialog box that opens, you can change the name, type or description of
the feature as well as its position on the molecule. Change the name of the signal to “Old TC(R)”
and its description to “10 bp fragment inserted”. Click the OK button. Vector NTI updates the
Display window to show the new name of the signal (Figure 5.6).
Figure 5.6 Display window showing new name of the signal
41
Vector NTI Advance 10 User’s Manual
8. Delete the P2_P Signal and Add a New Signal
Vector NTI allows you to easily add and delete features in a Feature map. To delete the P2_P
promoter from the Feature map, select it with a click on the label in the Graphics Pane and
choose Edit > Delete Feature From FMap from the menu bar. Alternatively, select P2_P and
choose Delete Feature From FMap from the shortcut menu. Click the OK button in the confirmation dialog. P2_P is deleted from the Feature map and disappears from the Display window.
Let’s add a new feature to the Feature map of My pBR322. First, select region 3000bp–3500 bp
and click the Add Feature button (
) on the Window toolbar. Alternatively, you can choose
Edit > New > Add Feature to FMap. In the Molecule Feature dialog box, Vector NTI puts the
currently selected region into the From and To fields. By default, the “Misc. Feature” type is
assigned to new DNA/RNA features in the Feature Type panel, but you may change the type to
any other type. Name the new feature New Feature and click the OK button. The new feature
appears in the text and Graphics Panes of the Display window (Figure 5.7).
Figure 5.7 New feature appears in the Graphics Pane
To save the modified My pBR322 into the database, choose File > Save As from the menu bar.
Click the OK button, then OK again to overwrite the version of My pBR322 currently stored in
the database.
9. Change the Starting Coordinate of My pBR322
The Molecule menu options control the operations that can be performed on a molecule as a
whole. Let’s change the starting coordinate of My pBR322 so that all features after the inserted
fragment have the same coordinates they have in the original pBR322 molecule. Choose File >
Molecule Operations > Advanced (DNA/RNA) > Change Starting Coordinate from the menu
bar. In the dialog box that opens, enter a new starting coordinate. Since the length of the
inserted fragment was 10 bp, the new starting coordinate should be 1 bp + 10 bp = 11 bp. Enter
11 into the New Start field and click the OK button. Click OK in the confirmation dialog. Vector
NTI recalculates the Feature map and updates the Display window. Verify that the new coordinates of AP(R) feature are the same as in the pBR322 (Figure 5.8): 3293 bp–4156 bp and “Old
TC(R)” is now at 76bp–1276bp.
Notice that the Display window is not marked as modified. For all commands from the Molecule
menu, Vector NTI always operates on the molecule in the database and updates the Display
window if required. If a molecule in a Display window was modified but not saved at the time you
42
Tutorial: Molecule Editing Chapter 5
chose a command, Vector NTI asks you to save the modified molecule into the database and
then repeat the command.
Figure 5.8 New coordinates of AP(R) feature
10. Close the Display Window and Exit Vector NTI
You have finished your session with Vector NTI. Close the Molecule Display window using the
Close command in the File menu. Quit Vector NTI with the File menu’s Exit command.
43
Vector NTI Advance 10 User’s Manual
44
C
H A P T E R
6
TUTORIAL: FORMATTING MOLECULE GRAPHICS
Introduction
In this chapter, you will learn to edit the representation of molecule graphics maps in a Molecule
Display window. Although here you work only with DNA molecules, all techniques described in
this chapter work equally well for protein molecules.
There are four ways to modify the text and graphics in the Graphics Pane. At the end of this
tutorial session, you will be able to:
Note:
z
Use the Arrangement Setup Palette to modify the standard display of a molecule
z
Modify the Graphical Display Setup for a DNA molecule and save the settings for use
with other molecule displays
z
Format object graphics and labels manually in Picture Editing mode
z
Define label and feature styles for a graphical image
z
Save the molecule’s graphical representation to a Molecule Document file.
The operations in this tutorial have no effect on the molecule itself, but only on its graphical display.
1. Launch Vector NTI
Launch Vector NTI by selecting Start > Programs > Invitrogen > Vector NTI Suite 10 > Vector
NTI.
2. Open pBR322 in a New Display Window
In the active workspace, click the Open Document button (
) on the Main Toolbar. In the
Open dialog box, select the Database DNAs/RNAs tab and the DNA/RNA Molecules (MAIN)
subset. Scroll to pBR322 and double click on it to open a new Molecule Display window.
45
Vector NTI Advance 10 User’s Manual
3. Arrange the Display Window Conveniently
Click the Graphics Pane button (
) to activate it. Use the split bars and scroll bars to get a
convenient display of pBR322’s graphics map. Now SHIFT + CLICK the Zoom In (
) and Zoom
Out (
) buttons on the window toolbar to resize the graphics map until its labels are easily
readable.
4. Change the Arrangement Setup
Vector NTI automatically rearranges the symbols and labels on the graphics map when you
change the set of restriction enzymes, edit the functional map of the molecule, etc. This is called
the Standard Arrangement.
To change the parameters of Standard Arrangement, press CTRL while you press the Standard
Arrangement button (
) on the Window Toolbar. The Arrangement Setup Palette appears,
where you can change the standard arrangement settings like size of labels and width of signals.
Experiment with the Standard Arrangement formatting by pressing several of these buttons. The
arrow buttons alter the molecule features display, while the “A” buttons modify the text display.
When you are satisfied with the arrangement results, click the Standard Arrangement button
again to close the palette.
5. Change the Graphics Setup of CDS Signals
Using the Graphics Display Setup dialog box, you can change the predefined display styles for
elements of feature and restriction maps. You can specify that newly defined styles be available
for all features or that they be dedicated to only a specific feature type.
To modify the way CDS (Coding DNA Sequence) signals are displayed, right click on one of the
CDS signals in the Graphics Pane and choose CDS Display Setup from the shortcut menu. In
the Graphics Display Setup dialog box, the CDS feature type is automatically selected. Here
you will specify that all features of the same type (CDS) are formatted in the same way.
Figure 6.1 CDS Display Setup
46
Tutorial: Formatting Molecule Graphics Chapter 6
Using the check boxes, you can even choose whether or not to display labels for a selected feature type. You can choose label styles including font color and text format, and symbol shapes
and styles.
Click the More button near the Label Style drop-down menu. In the Properties dialog box that
opens, click the Font button. In the Font dialog box, choose Bold font style, and scroll to the
blue color and select it. Press OK. Now choose the Line tab on the Properties dialog box and
select a shade of blue to match the font color. Click OK.
If this is the first time you have created a style profile, you are asked whether you want to create
a shared style to be used for all feature types or a specific style that would be used for CDS signals only. Press No to create a unique style named “CDS Label”. This means that this style is
available to format only CDS features. This is indicated now in the Label Style box by the term
CDS Label (Figure 6.2).
To change the symbol style, click the More button near the Symbol Style box and choose the
Fill tab. On the Fill tab, select a light blue color. Click OK to close the dialog box. When asked
what kind of style you want to create, choose Yes to create a shared style. Vector NTI assigns a
sequential number to the new style (Shape 5) and allows you to use this style to format not only
CDS signals but other features as well.
Figure 6.2 Creating a unique style named “CDS Label”
Press OK. This closes the Graphics Display Setup dialog box and automatically rearranges
pBR322’s Graphics Pane to show the new display style for CDS signals (Figure 6.3).
Figure 6.3 Graphics Pane shows new display style for CDS signals
The style modification you just made has no effect on the molecules displayed in other Display
windows. Vector NTI associates a style sheet with every Display window in the system. A style
sheet is a collection of different kinds of display settings such as Graphics display settings (like
those you just modified), sequence settings like 1-letter or 3-letter translations and Feature map
settings.
All settings in the current style sheet are accessible from the Molecule Display Setup dialog box
you examined in the previous tutorial.
To save your modified style sheet, making it easily available to use with other molecules, click
on the Display Setup button (
) on the Window toolbar and choose the “Save Settings As”
command from the popup menu. Type the name Blue in the Save As dialog box and click OK.
To save unused styles, click No.
47
Vector NTI Advance 10 User’s Manual
Close all display windows and reopen the pBR322 window. When first displayed, it uses the
Default style sheet. Click on the Display Setup button on the Window toolbar. The list of available style sheets in the drop-down menu now has both elements: “Default” and “Blue”. Choose
the “Blue” style sheet, applying the style you just defined to the Display window. CDS signals
are now shown in blue.
6. Turn on the Picture Editing Mode
If you prefer, you can format graphical maps manually and change the display style for individual
features and elements of other graphical maps.
The Vector NTI Graphics Pane can operate in two different editing modes:
z
Molecule Editing mode (the default) where you can modify a molecule itself, such as
adding functional features, restriction sites or inserting or deleting residues in a molecule. This was covered in Chapter 5.
z
Picture Editing mode where you can format individual labels, arrows and symbols of a
molecule’s graphical maps. Operations on the graphics in this mode do not modify the
molecule itself.
To switch the Graphics Pane into the Picture Editing mode, activate the Graphics Pane and click
the Edit Picture button (
) on the Window Toolbar.
Note: Vector NTI automatically reverts out of Picture Editing mode back to Molecule Editing
mode as soon as you select a sequence fragment in a Sequence Pane or perform some operation on a molecule.
7. Turn the TC(R) Arrow to Blue Cross-Hatching
Locate the arrow representing the TC(R) (tetracycline resistance gene) symbol on the graphics
map. Let’s change its current pattern to cross-hatching and its color to light blue, and then
enlarge the arrow.
Verify that the Picture Editing mode is on. (View > Edit Picture should display an enabled Picture Editing Mode button.) Point the cursor at TC(R) (the cursor changes shape to a pointing
hand) and double-click on the arrow. In the Properties dialog box, click on the Fill tab. On the
Fill tab, click in the pattern box. Select the crosshatched pattern in the scroll-down list, and click
on it (Figure 6.4).
Figure 6.4 Selecting the cross-hatched pattern in the Pattern field of the Properties dialog box
In the color selection box, choose light blue and click on OK. Immediately after the color
change, the arrow’s colors are inverted, showing that the signal is currently selected. Click in the
graphical map outside the TC(R) arrow, deselecting it. The new pattern and color are displayed.
48
Tutorial: Formatting Molecule Graphics Chapter 6
8. Enlarge the TC(R) Arrow
To enlarge the TC(R) arrow, click on it, selecting it. “Drag boxes” or “handles” now appear at its
corners. Note: If you do not see drag boxes after you click on the arrow, the pane is not in Picture Editing mode.
Figure 6.5 Making the arrow thicker and thinner by dragging the handles
Move the cursor to the drag boxes at the tail of the arrow where the cursor turns to a thin fourpointed arrow (
). Click and hold the left button on one of the drag boxes, and move the
mouse a bit. Practice making the arrow thicker and thinner by dragging the handles (Figure 6.5).
The drag boxes at the front of the arrow are for changing the shape of the arrowhead. Feel free
to experiment with them on your own.
To drag the arrow radially inwards or outwards on the map, move the cursor to the middle of the
TC(R) arrow where it changes to a thick white four-pointed arrow (
). Click and hold the left
button and drag mouse inward or outward. CTRL + SHIFT + left button-drag moves the arrow
around the circle.
Remember, although the functional symbol graphics may have changed position on the graphics map, the actual molecule remains unaffected because you are in Picture Editing Mode. The
double key combination has been designed with the drag to prevent you from moving functional
signals out of position on the graphical map by accident.
To undo any changes you make in the graphical map, click the Undo button on the main toolbar
(
), or press CTRL + Z.
49
Vector NTI Advance 10 User’s Manual
9. Format TC(R)’s Label
To change the formatting of the TC(R) label, double-click on it, opening the Properties dialog
box for the label (Figure 6.6).
Figure 6.6 Properties dialog box for the label
Select the Text tab and press the Font button. Set the font to 18-point bold italic in the Font dialog box (Figure 6.7). Click the OK buttons in both dialog boxes. Reposition the label using
LEFT-CLICK + drag. Practice selecting and dragging other labels around the screen.
Figure 6.7 Changing the formatting of the TC(R) label
Undo the reposition changes by clicking the Standard Arrangement button (
) on the toolbar. If the picture was modified, Vector NTI displays a confirmation dialog before proceeding.
10. Add a Text Annotation
To add a text note indicating that TC(R) is to be cloned into pUC19, click the Add Annotation
button (
) on the Window Toolbar. In the Annotation dialog box, enter the words Clone into
pUC19 in the Annotation Text Field and click OK. Your text appears, selected, just above the
center of the molecule. Drag the annotation directly under the TC(R) label (Figure 6.8). Doubleclick on the annotation and select Font in the Properties dialog box. Change the font to Arial 10
point bold. Click the OK buttons in both dialog boxes.
Figure 6.8 Adding a text annotation
50
Tutorial: Formatting Molecule Graphics Chapter 6
An annotation can be removed by selecting it and choosing Edit > Delete Annotation on the
menu bar. Select Yes to confirm the deletion.
11. Experiment with Styles
Styles allow us to assign a single format to many objects in a centralized, organized fashion.
They work much like styles do in word processing software.
The plasmid pBR322 has 3 CDSs; TC(R), AP(R) and ROP. On the graphical map, locate all
three CDSs and their labels. In Step 5, you defined the unique style “CDS Label” that can be
used to format all CDS labels. Then you modified the features and labels in the pBR322 Molecule Display window to reflect the new formatting. In Step 9, you modified the TC(R) label and
now its format attributes are different from those prescribed by the style “CDS Label” style. Vector NTI permits graphics objects to be formatted differently than prescribed by their styles. This
simplifies graphics map editing and allows one to change a style using the formatted object as a
template.
Click on the TC(R) label and open its associated shortcut menu with a right click. The Redefine
‘CDS Label’ Style by Example menu item is enabled because the format attributes of the
TC(R) label are different from those prescribed by its style. Click on the Redefine… command.
The CDS Label Style is changed and all three CDS labels automatically change format as well.
Note:
Although the style is changed, it still has not been saved to the Display Setup Profile. See Step
12.
A simple alternative way to redefine a new formatting style for labels or features in the same display window is to use the Copy/Paste feature. Right-click on the AP(R) signal and open the
Properties dialog box from the shortcut menu. Reformat the fill pattern and color on the Fill tab
and click OK. Now select the re-formatted object and select Copy Style from the shortcut menu.
Select the TC(R) arrow and select Paste Style (Figure 6.9) from a new shortcut menu. You can
redefine the set style by selecting the Redefine… option on the shortcut menu.
Figure 6.9 Using the Copy/Paste feature to redefine a new formatting style for labels
You can use styles for automatic formatting of functional symbols—arrows, blocks, etc.—as well
as for text. Styles for graphics objects store not only color and pattern attributes, but also geometrical characteristics such as width and arrowhead dimensions. This is a powerful feature for
creating publication-quality figures.
In spite of the fact that the graphical formatting of pBR322 in the Display Window was changed,
the molecule is not marked as modified (with an asterisk on the title bar). Graphical modifications of molecules are not stored in the database, but in a molecule document file. The actual
51
Vector NTI Advance 10 User’s Manual
molecule in the window was not changed; it remains in the Vector NTI database as it was originally.
12. Save the pBR322 Molecule Display to a Molecule Document file
You can save the contents of the pBR322 Display window with its graphical formatting changes
to a Molecule Document File (NOT the VNTI Database). Select File > Save As > Save as File
tab.
In the dialog box, name the file pBR322.gb and press OK. If Vector NTI was configured for Internet publishing, a confirmation dialog box appears asking your permission to create an HTML file
describing the molecule. Click Yes, and Vector NTI notifies you that an HTML file is created.
Note:
The Molecule Document file you created is completely independent of the Vector NTI database.
It contains all the molecule information and any results of molecule analyses and the graphical
representation of the molecule. Think of a Molecule Document as a self-contained “snapshot” of
your work with a molecule. You can exchange Molecule Documents with your colleagues, publish them on the Internet, send them through electronic mail, etc.
To close the pBR322 molecule window, select File > Close on the menu bar.
Vector NTI now detects that the style sheet associated with the pBR322 Display window has
changed (remember that you redefined the “CDS Label” style) and requests confirmation to
save them to the profile. Click Yes. In the Save Current Display Settings As dialog box that
opens, select Blue from the Settings Name drop-down menu, confirm, and click OK. Since you
already have a style sheet named Blue, choose Yes for Save Unused Styles. This overwrites
the original Blue style sheet with the modified one. Sometimes this option does not appear until
you try to close the molecule.
After the modified style sheet is saved, Vector NTI closes the pBR322’s Display window.
Now open the Molecule Document you created, with File > Open > Molecule File tab, and
select the name of the saved document file from the file list. Your Molecule Document opens
with all of your changes preserved.
Note:
Every style required by a document is saved within the Molecule Document itself. This means
that, unlike molecules opened from the VNTI Database, the pBR322 molecule document will
always look the way you formatted it when you saved it to a Molecule Document File.
Note that the window title now reflects the fact that the Molecule Display window displays the
molecule data from the document, NOT from the Vector NTI database. No matter how many
times you modify the molecule and save it back to the Molecule Document, pBR322 in the VNTI
Database remains unchanged.
Note:
Vector NTI does not support the whole range of molecule operations on the molecules in Molecule Documents. Sometimes, Vector NTI prompts you to save the molecule into the database
first and repeat the operation on the molecule saved in the database. The Demonstration version of Vector NTI has extra restrictions on the kind of operations you can perform on such
“external” molecules.
13. Use the Saved Style Sheet to Format Molecule Display Windows
Now we can use the saved settings to format other molecules as well. Close the pBR322 Display window. Click the Open Document button (
) on the main toolbar. In the Open dialog
box on the Database DNAs/RNAs tab, select the M13 molecule from the molecule list and click
OK. All CDS features and labels display the default settings. In the Molecule Display window,
click the Display Setup button. Select the Blue style sheet from the Setup Profile list on the
52
Tutorial: Formatting Molecule Graphics Chapter 6
drop-down menu and click OK. In the Molecule Display Window for the M13 molecule, note that
all CDS labels now have the formatting we defined in a “CDS Label” style (Figure 6.10).
Figure 6.10 Using a saved style sheet to format Molecule Display windows
You can define and give names to several independent Display Setup settings like Blue and use
them to reformat graphics representation of molecules in Molecule Display windows.
To switch to another style sheet, click on the Display Setup button in the Window toolbar, and
select the name of the style sheet in the popup menu. Vector NTI reformats the active display
window according to setting you choose.
14. Close the Display Window and Exit Vector NTI
To finish your session with Vector NTI, close the Molecule Display Window using File > Close
on the menu bar. Exit Vector NTI using File > Exit.
53
Vector NTI Advance 10 User’s Manual
54
C
H A P T E R
7
TUTORIAL: DATABASE EXPLORER
Introduction
This tutorial introduces you to Vector NTI’s Database Explorer, a simple and flexible interface for
managing and manipulating various kinds of objects in the Vector NTI database. The Explorer
format makes it relatively simple to store, sort, and manage information such as molecules created in your laboratory, enzymes stored in your freezer, molecules with particular antibiotic
resistance capabilities or oligonucleotides designed for PCR.
At the end of this tutorial session, you will be able to:
z
Navigate the VNTI Database Explorer
z
Use menu and toolbar commands
z
Alternate between database subsets
z
Select and edit listed subset objects
z
Search the database for objects with specified features
z
Create new subsets
z
Add new user-fields to database objects
z
Use User-Field Manager to display new user-field columns
z
Use Contact Manager to manage contact information
1. Launch Vector NTI
To launch the Vector NTI Database Explorer, select Start > Programs > Invitrogen > Vector
NTI Suite 10 > Vector NTI Explorer.
Alternatively, you can access the Database Explorer window by using the Local Database button (
) on the Main Toolbar of the Vector NTI workspace.
55
Vector NTI Advance 10 User’s Manual
Note:
By default, the Vector NTI Database Explorer launches independently of the Vector NTI worspace. However, it can be configured so the Database Explorer opens automatically with the
Vector NTI workspace each time a Vector NTI session is initiated. From a Molecule Display window, select Edit > Options from the menu bar. On the General tab of the Options dialog box,
select Open Local Explorer At Startup.
2. Inspect the Database Explorer Window
Maximize the Vector NTI Database Explorer window. This window displays the contents of local
and shared databases. The databases are organized into several tables containing subsets of
the respective type. Each Database Explorer window has two panes: the Subset Pane on the
left and the selected subset Database Objects Pane on the right.
Locate the database Table box in the upper left-hand corner of the screen and click on the dropdown menu arrow to view the various Database Tables. To alternate between database tables,
select a table from the drop-down menu or select from the Table menu on the menu bar.
Figure 7.1 A list of protein subsets is displayed in the Subset Pane
In the Database Table drop-down menu, select the Protein Molecules table. The list of protein
subsets is displayed in the Subset Pane, initially containing only one subset called Protein Molecules (MAIN) (Figure 7.1).
The subset contents are listed in the Database Objects Pane. This subset contains all of the
protein molecules in the database. The contents of each of the (MAIN) default subsets are maintained by Vector NTI similarly with all of the respective database objects for that table. Scroll
through the list of proteins to become familiar with the database format.
The Vector NTI Database Explorer window has a single toolbar containing the most frequently
used commands. Most commands can also be initiated from the menu bar.
56
Tutorial: Database Explorer Chapter 7
3. Experiment with View Options
Pull down the View menu to review the available viewing options. (Options are duplicated by
toolbar buttons.) You can view your molecules as large or small icons, a compact list and a tabular form with columns showing various object properties (the “details” mode).
By default, the Database Explorer shows proteins in the details mode. Click on each of four
mode buttons at the right of the toolbar to view the object list in each mode, and then switch
back to the details mode.
To sort database objects in ascending or descending order, select View > Arrange Icons or, if
you are in the details mode, click on the column headers. Click on the Length column header
several times to sort the molecules by length. Adjust the widths of the column by click + dragging the small lines separating the column headers.
4. Experiment with Selection and Menus and Edits
The Database Explorer window combines several standard selection techniques. Select multiple objects by:
z
z
z
+ CLICK to select all objects within a range
CTRL + CLICK to select non-contiguous objects in a list
SHIFT
“wire-frame” selection (press the mouse button somewhere outside item names / icons
and drag the selection rectangle)
Some menus are disabled when nothing is selected. Object and subsets have shortcut menus
listing various associated commands.
To rename both subsets and database objects, click on the name of the item to be renamed,
wait a second, then click on the same name again. Clicking two times in rapid succession is
interpreted as double-click, but waiting momentarily before the second click is interpreted as an
in-place editing request. An active edit text box opens on the item name, allowing you to edit the
name.
5. Learn About Subsets
In the Protein Molecules (MAIN) table, click on the Name column header (Database Objects
Pane) to sort the list by name in alphabetic order. Select the 41BB_HUMAN and 41BB_MOUSE
molecules and click the New Subset button (
) on the toolbar. Vector NTI creates a new subset called Group 1. Name the new subset 41BB in the active text box and press ENTER. The
new subset is selected in the left pane and its contents are listed in the right pane (Figure 7.2).
Figure 7.2 Creating a new subset
57
Vector NTI Advance 10 User’s Manual
You can easily add objects to subsets by drag-drop operations within the Database Explorer
window. Other subset operations are available from the Table menu or from the subset shortcut
menu.
Note:
The difference between Vector NTI’s subsets and Vector NTI’s file system’s folders is basic.
Because a subset is a set of objects grouped by a specified criteria, one object can exist in several different subsets at one time. On the other hand, one object cannot exist in several folders
at the same time, but you can make a copy of an object to place it in another folder. Note that
the 41BB_HUMAN and 41BB_MOUSE molecules were not moved out of the MAIN subset. You
just created another group (subset) based on their common features.
6. Search the Database
The Database Explorer has a sophisticated searching capability enabling you to search by different criteria and logically combine search results.
Let’s find all DNA molecules containing an ampicillin resistance gene, create a new subset for
them and add appropriate user fields. Open the DNA/RNA (MAIN) molecule database and press
the Search button (
) on the Database Explorer’s toolbar, opening the Molecule Database
Search dialog box (Figure 7.3):
Figure 7.3 Molecule Database Search dialog box
Check the Features Filter option and press the Features Setup button. In the Search Conditions: Features dialog box, click the < Add button, opening the Add Features dialog box (Figure
7.4) where you choose the feature for which to search. Select CDS in the Feature Type window.
Click the Add only features of this type… radio button. Browse through the list in the right
pane, locate the AP(R) and check its box.
Figure 7.4 Add Features dialog box
58
Tutorial: Database Explorer Chapter 7
Click OK, closing the box and adding the AP(R) feature to the Search Conditions: Features dialog box (Figure 7.5).
Figure 7.5 Adding a new feature to the Search Conditions: Features dialog box
Click OK to return to the Database Search dialog box.
Make sure that all filters except the Attributes and Feature Filters are unchecked and that the
“DNA/RNA (MAIN)” subset is selected in the “Look in” drop-down menu. Click the Start Search
button. Vector NTI scans the entire DNA/RNA table, locating all molecules with an ampicillin
resistance gene.
When the Insert Search Results dialog box opens to select a subset for the search results, enter
a new subset name, Ampicillin Resistance (Figure 7.6).
Figure 7.6 Insert Search Results dialog box with new subset name, Ampicillin Resistance
Click OK. Vector NTI informs you of the number of items in the result set.
The subset is created (you can see it in the All Subsets Pane), but the Search dialog box is not
closed. This is so that you could refine your search using the result set as an input set of a next
search. Click the Close button to close the Search dialog box.
7. Examine Vector NTI’s User Field Manager
Each of the columns in a subset Objects Pane is a user field displaying identifying characteristics of subset objects. A user field can contain any laboratory-specific and user-specific information necessary to provide an appropriate description of the object. For instance, you might
identify all of the enzymes that are stored in your laboratory so they can easily be sorted in a
59
Vector NTI Advance 10 User’s Manual
larger database. User Fields can be imported, exported, displayed, printed and managed just as
the regular database fields.
Click the new Ampicillin Resistance subset to open it and view its molecules, all of which presumably contain an ampicillin resistance gene. Now let’s add the ampicillin user field to the molecules so that feature will be displayed in a user field column. That will allow you to sort
molecules with that feature in the (MAIN) database.
Choose Database > User Field Manager from the menu bar, opening the User Fields Manager
dialog box (Figure 7.7):
Figure 7.7 User Fields Manager dialog box
This dialog box allows you to define new User Fields and to perform global operations on user
fields such as Edit, Rename, Delete as well as Import/Export operations. Importing and exporting allows you to exchange your list of field definitions with your colleagues.
Vector NTI maintains a local list of descriptions of “known” User Fields that are presented to the
user when he or she creates new database objects. This list can be viewed and modified using
the User Field Manager.
Note:
Field definitions and field values are stored and exported with database objects. When these
objects are imported, Vector NTI helps you to add the field definitions to the local User Field definitions list.
8. Define a New User Field
Click on the New button (
) in the upper left of the User Field Manager dialog box, opening
the User Field Definition dialog box.
60
Tutorial: Database Explorer Chapter 7
Enter Ampicillin Resistance in the Name box, and using the Type drop-down menu, select
One of Predefined Strings. In the Predefined Values text box, type Ampicillin Resistance and
click the < Add button (Figure 7.8).
Figure 7.8 User Field Definition dialog box
Click OK, closing the window. Your field description is added to the field list.
Figure 7.9 Assigning values to molecules listed in the Ampicillin Resistance subset
Now let’s assign this value to all molecules listed in the Ampicillin Resistance subset we just created. Back in the User Field Definitions box, in the large window (Field Definition List), select the
newly listed Ampicillin Resistance. Now in the box in the lower right corner, select [+] DNA/
RNA Main to open the DNA/RNA subsets; select the subset Ampicillin Resistance. In the Global Operations area, click the Set ‘Ampicillin Resistance’ in button (Figure 7.9). In the Ampicillin Resistance dialog box that opens, select the field value string Ampicillin Resistance and
click OK. Click OK to confirm your action to insert the field value. Vector NTI performs the operation and returns you back to the User Field Manager. Press Close.
9. View the New Field in Database Explorer
Now let’s customize the Database Explorer view to display the new field. Back in the DNA/RNA
(MAIN) Table Explorer window, in the Database Objects Pane, right click on a column heading.
61
Vector NTI Advance 10 User’s Manual
In the shortcut menu that opens, select Columns. The Columns dialog box allows you to control
the display and order of columns in the details view of the Explorer window.
Figure 7.10 Columns dialog box
In the Available Fields box, select Ampicillin Resistance and click the Forward button (
),
moving the field to the Displayed Fields box. Click the Move Up button several times to move
the Ampicillin Resistance column just below the Length column (Figure 7.10). The descending
order in the list is the left to right display order of the columns
Click the OK button, updating the Database Explorer to display the new field as a column in the
list pane. Return to the DNA/RNA subset by clicking on DNA/ RNA Molecules (MAIN) in the All
Subsets Pane or by selecting Table > DNA/RNA Molecules from the Main menu (Figure 7.11).
Figure 7.11 Updating the Database Explorer to display the new field as a column in the list pane
Scroll through the Objects Pane, noting that Ampicillin Resistance is noted for some of the
objects. Now click on the Ampicillin Resistance column heading, sorting the objects according to
this feature. Click again and note the sorting changes. While molecules in this subset can be
sorted according to this new user field, as you may expect, all DNA molecules in the Ampicillin
Resistance subset display “Ampicillin Resistance” in that column. You could create a column for
any feature by which you wish to sort molecules using these same steps.
62
Tutorial: Database Explorer Chapter 7
Sorting by the Ampicillin Resistance column takes longer than sorting by other columns like
Length. This is because the Ampicillin Resistance column is not cached in index tables and thus
is slower to access. Caching requires extra memory, but it usually makes sense to turn it on for
fields that are displayed as columns in the list pane.
To turn on caching of Ampicillin Resistance, open the User Field Manager dialog box again.
Double-click on the Ampicillin Resistance definition to edit it, check the Cache In Index Table
box and click OK. Vector NTI asks for confirmation and then rescans the database and rebuilds
the database indices. Close the User Field Manager dialog box and try again to sort the DNA
molecules by clicking on the Ampicillin Resistance column header. Sorting should work faster
now.
10. Examine Vector NTI’s Contact Manager
The Contact Manager is a tool for creating, updating, deleting and organizing contact records.
This list, to simplify tracking of database objects, is automatically updated when you import molecules or proteins created by your colleagues. You can enter any suitable information about
yourself; this information then is attached to your molecules and is automatically added to the
contact list of those colleagues who import your molecules.
Select Database > Contact Manager, opening the Contact Manager dialog box (Figure 7.12):
Figure 7.12 Contact Manager dialog box
This dialog box displays a list of all stored contact records. There are five operation buttons in
the upper left corner of the Contact Manager allowing you to perform various operations on the
contact records, including Add New, Edit, Rename and Delete.
11. Close the Molecule Display Windows and Exit Vector NTI
You have now taken a close look at Vector NTI’s Database Explorer capabilities. Close all Display windows and exit Vector NTI as you learned in previous tutorials.
63
Vector NTI Advance 10 User’s Manual
64
C
H A P T E R
8
TUTORIAL: PCR ANALYSIS AND PRIMER DESIGN
Introduction
This chapter introduces you to tools for designing and analyzing PCR primers and procedures.
At the end of this tutorial session, you will be able to:
z
Design and analyze PCR primers using Vector NTI’s primer design tool
z
Add restriction enzymes to PCR primers
z
Set parameters for optimum primer/target interactions and successful PCR
z
Save primers and PCR results in the database
z
Add primers to the Oligo List
z
View and analyze PCR results
z
Order Custom Primers from Invitrogen
Note: Press the F1 key to open Online Help for all of the dialog boxes in this tutorial.
1. Launch Vector NTI and Open a Molecule Display Window
z
Launch Vector NTI using techniques described in previous tutorials (Select Start > Programs > Invitrogen > Vector NTI Suite 10 > Vector NTI).
z
Using techniques learned in earlier tutorials, open a Molecule Display window containing
ColE I.
2. Select the Region of ColE1
z
Click the Graphics Pane button (
Pane.
) on the Window Toolbar to activate the Graphics
z
Select Edit > Set Selection. In the Set Selection dialog box, select the 5200–6400
region of ColE1, the target fragment for PCR.
65
Vector NTI Advance 10 User’s Manual
3. Prepare for PCR Analysis
To perform PCR analysis on the selected fragment, select Analyses > Primer Design > Find
PCR Primers on the menu bar. The Find PCR Primers dialog box appears (Figure 8.1):
Figure 8.1 Find PCR Primers dialog box
With this dialog box, you can direct Vector NTI to search for convenient sense and antisense
primers according to your specifications and to check primers’ uniqueness.
Click the More>> button on the lower right to enable a complete view of the Find Primers dialog
box (Figure 8.2):
Figure 8.2 Find Primers dialog box
The Primer tab allows you to designate basic parameters for the PCR reaction and the primers
that are generated. After clicking the More>> button, you can also define primers yourself and
attach short sequences at the 5’ and/or 3’ ends of the product. (If you want the PCR target
length to be the full extent of the selected target region, make sure that the Region of Analysis
and Product Length sections of the dialog box reflect your selections.)
66
Tutorial: PCR Analysis and Primer Design Chapter 8
Note:
The calculation for Tm is dependent on primer and salt concentrations; varying these concentrations can greatly affect the Tm for any given primer. Make sure to adjust these parameters
according to your reaction conditions when performing your own PCR analysis to ensure that
you obtain accurate Tm values.
For this tutorial, review the options on the Primer tab, but leave all the options unchanged.
Select the Amplicon tab (Figure 8.3). The options on this tab allow you to customize parameters relating to the resulting PCR product. %GC content for the product or a portion of the product next to the primer annealing site and allowed bases adjacent to the primer annealing site
can be specified.
Figure 8.3 The Amplicon tab allows you to customize parameters relating to the resulting PCR product
Review the options, but leave all the options unchanged.
Select the Structure tab (Figure 8.4). The options on this tab set acceptable limits for nucleotide
repeats, palindromes and hairpin loops for the primers. You can also check your primers/product
for a selected group of restriction sites from this tab.
Figure 8.4 The Structure tab sets limits for nucleotide repeats, palindromes and hairpin loops in primers
Inspect all options, leaving them unchanged.
67
Vector NTI Advance 10 User’s Manual
Select the Pairs tab (Figure 8.5). Options on this tab specify how closely parameters such as
Tm and %GC, etc. must match between two primers in a generated primer set.
Figure 8.5 The Pairs tab specifies how closely parameters must match between two primers in a primer set
Inspect all options, leaving them unchanged.
Select the Similarity tab (Figure 8.6). The options on this tab determine the similarity relationship between the primers and the target sequence.
Figure 8.6 The Similarity tab determines the similarity relationship between the primers and the target sequence
Inspect all options, leaving them unchanged.
68
Tutorial: PCR Analysis and Primer Design Chapter 8
Select the 3’ end tab (Figure 8.7). The options on this tab allow you to set specifications for the
3’ end of the primers generated by Vector NTI. Parameters such as dG and specific nucleotide
content for the 3’ end of both sense and antisense primers can be set here.
Figure 8.7 The 3’ end tab allows you to set specifications for the 3’ end of the primers generated by VNTI
Inspect all options, leaving them unchanged.
Select the Uniqueness tab (Figure 8.8). The options on this tab determine the uniqueness of
the primers generated with respect to the PCR product. These parameters can be used to help
ensure that generated primers bind to the desired template area with greater specificity than to
the rest of the PCR product.
Figure 8.8 The Uniqueness tab determines the uniqueness of the primers generated with respect to the PCR
product
Inspect all options, leaving them unchanged.
Select the Qualities tab (Figure 8.9). These parameters govern primer quality by determining
how much weight should be assigned to parameters specified on the other tabs of the Find
69
Vector NTI Advance 10 User’s Manual
Primers dialog box. These values affect scoring functions that evaluate the quality rating of the
primer sets generated.
Figure 8.9 The Qualities tab governs primer quality by determining how much weight should be assigned to
parameters specified on the tabs of the Find Primers dialog box
Inspect all options, leaving them unchanged.
Select the Filters tab (Figure 8.10). On this tab, you can select features that should either be
excluded or included as regions to be considered for primer design. For example, if your
sequence contains Repeat features, you may want to exclude them to obtain primers with
greater specificity. Features can be added or removed by pressing the + and – buttons.
Figure 8.10 The Filters tab selects features that should either be excluded or included as regions to be considered for primer design
Leave all the options unchanged as you inspect them.
Notice the Load and Save buttons on the lower left of each tab in the Find Primers dialog box.
These buttons allow you to save your PCR settings to a file and load the settings file in for subsequent analyses. This precludes having to reset the various parameters manually for frequently used PCR condition settings. You need only save/load the settings in one of the tabs
and the parameters for all the tabs in the Find Primers dialog box will be saved/loaded.
70
Tutorial: PCR Analysis and Primer Design Chapter 8
4. Perform PCR Analysis
In the Find Primers dialog box, press the OK button in the lower center, initiating the PCR analysis. When it is finished, a new folder is created, added and opened in the Text Pane of the
ColE1 Display window.
5. Inspect the PCR Analysis Folder
Move the split bars as necessary to optimize viewing in the Text Pane. In the open PCR Analysis folder, inspect the subfolders.
z
Each subfolder describes one possible set of primers for amplifying a fragment of the
length within the maximum and minimum lengths specified in the Find Primers dialog
box.
z
The subfolders are listed in order of decreasing primer set quality rating which is calculated based on the importance factors assigned in the Qualities tab in the Find Primers
dialog box. (Generally, maximum rating = 171.)
z
Each subfolder contains useful information for the PCR reaction such as product melting
temperature, optimum annealing temperature, sense and antisense primers with their
melting temperatures, free energies, etc.
The sense and antisense primers are indicated with the symbol “
” followed by their nucleotide sequences. (In Vector NTI, this same symbol is used to mark oligonucleotides created by
many of the program’s functions such as PCR analysis, molecule design, and hybridization. You
can perform oligo analysis on any nucleotide sequence marked by this symbol in the Text Pane
of a Molecule Display window.)
6. Perform Oligo Analysis on a PCR Sense Primer
To perform oligo analysis on the sense primer given in the first subfolder of the PCR Analysis
folder, scroll through the Text Pane and verify that the folder labeled “#1: Product of length
901” is open. (Open it by double-clicking it, if necessary.)
Inside this subfolder, position the cursor on top of the sense primer, represented by the line
ATTACTCTTTTGAATGGTACTCCTG. Open the corresponding shortcut menu by right clicking
on the primer sequence. Choose the Analyze command, opening the Oligo Analysis dialog box
(Figure 8.11):
Figure 8.11 Oligo Analysis dialog box
71
Vector NTI Advance 10 User’s Manual
In this dialog box you can set numerous parameters for oligonucleotide analysis. Leave the
default parameters unchanged and press the Analyze button.
Note:
The calculation for Tm is dependent on primer and salt concentrations; varying these concentrations can greatly affect the Tm for any given primer. Make sure to adjust these parameters
according to your reaction conditions when performing your own oligo analysis to ensure that
you obtain accurate Tm values.
The analysis results appear in the dialog box. Note the biochemical and structural parameters in
the Results column. Press the Dimers & Hairpin Loops button to inspect the dimers and hairpin loops that may form if this primer is used.
Press the F1 key to view Vector NTI’s on-line help information for this dialog box. Press the
Close button.
7. Order Custom Primers
In Vector NTI Advance 10, you can order custom primers that you have generated and analyzed
in the software. Custom primers are synthetic oligonucleotides made with your specified
sequence for use in a variety of applications from PCR and sequencing to probes for gene
detection. Custom modifications, such as standard deoxynucleotides, modified bases, 5´ modified nucleotides (including fluorescent dyes, enzyme conjugates), and S-oligos for antisense
studies can be designated. Specifications also include scale of synthesis, level of purity and 5’
or 3’ modifications.
To initiate the ordering process, inside the PCR Analysis folder, scroll through the Text Pane and
verify that the folder labeled “#1: Product of length 901” inside the subfolder is selected by
positioning the cursor on top of the sense primer, represented by the line
ATTACTCTTTTGAATGGTACTCCTG. Open the corresponding shortcut menu by right clicking
on the primer sequence. Choose the Add to Oligo List command, opening the New Oligo dialog box, with the General tab activated. Enter Sense primer - ColE1 in the name box and click
OK. Vector NTI verifies the oligo has been added.
Open the Oligo List dialog box by selecting List > Oligo List. Select the oligo named Sense
primer - ColE1 and click the Order button (
).
Figure 8.12 Oligo List dialog box
The Invitrogen webpage opens automatically, and your primer sequence is entered in the custom primer order form. If you in reality wanted to order the primers, at this point you would proceed to checkout. For this tutorial, however, simply inspect the Invitrogen Custom Order
webpage, then exit and return to the Vector NTI workspace.
72
Tutorial: PCR Analysis and Primer Design Chapter 8
8. Save a PCR Primer to the Database
Now let’s save the same primer to the database for future use. Right-click on the
ATTACTCTTTTGAATGGTACTCCTG line in the Text Pane, to open the corresponding shortcut
menu and select Save To Database. This opens the New Oligo dialog box, with the General tab
activated (Figure 8.13).
Figure 8.13 New Oligo dialog box with the General tab activated
Enter Sense primer - ColE1 in the name box and click on the Oligo tab. The oligo sequence
and description appear automatically in their respective text boxes.
Click on the Keywords tab. Click in the New Keyword entry box and enter PCR-ColE1. Press
the < Add button to add your new keyword to the keyword list. Then select the existing
SENSE_PRIMER keyword and add it to the keywords list, too.
Press the OK button. The primer is saved to the database under the name Sense primer ColE1.
9. Add Restriction Enzyme Sites to the PCR Primers
You will load the sense primer you just saved to the database and then attach sequences to the
5’ and 3’ ends of the product to allow convenient cloning. Vector NTI will then find an optimum
antisense primer.
Activate the Graphics Pane again and make sure the 5200–6400 region is still selected. (Check
the status bar.) Open the Find Primers dialog box again by selecting Analyses > Primer
Design > Find PCR Primers on the menu bar.
Locate the User-Defined Primers box in the Find Primers dialog box by pressing the More>>
button on the Primer tab. (Any previously selected restriction sites will appear in the Userdefined Primers Sense and Antisense text boxes by default. To continue with this tutorial, select
each and press the DELETE button so each text box is blank.) Press the Browse button ( ) to
the right of the Sense Primer box. In the dialog box that appears, showing oligonucleotides
saved in the database, select the “Sense primer - ColE1” oligo you just saved and click OK. The
“Sense primer - ColE1” oligo is loaded into the Sense Primer text box (Figure 8.14). Note that
you are not specifying the anti-sense primer, but leaving that up to Vector NTI.
73
Vector NTI Advance 10 User’s Manual
To attach a BamHI cloning site to the 5’ end of your sense primer, locate the Attach to 5’ Terminus of Sense Primer box and press its Browse ( ) button. In the Choose Database Enzyme
dialog box that opens, select the MAIN Enzymes subset. Scroll down to find and select BamHI.
Click OK. The BamHI recognition site is entered into the Attach to 5’ Terminus of Sense Primer
box.
To attach a HindIII cloning site to the 5’ end of the antisense primer, locate the Attach to 5’ Terminus of Antisense Primer box and press its Browse button. In the dialog box, select the MAIN
Enzyme subset and HindIII and click OK. The HindIII recognition site is entered into the Attach
to 5’ Terminus of Antisense Primer box.
Figure 8.14 The “Sense primer - ColE1” oligo is loaded into the Sense Primer text box; restriction enzymes are
designated for the sense primer terminus.
Locate and check the Check Primers for Restriction Sites From check box on the Structure tab,
directing Vector NTI to search for certain restriction sites in the PCR product-plus-primer fragment you are creating. The restriction sites searched for are listed in the Restriction Endonuclease subset shown in the Check Primers for Restriction Sites From drop-down menu. Choose
the Palindromes/Non-Ambiguous subset from the list (Figure 8.15).
Figure 8.15 Searching for certain restriction sites in the PCR product-plus-primer fragment on the Structure tab
74
Tutorial: PCR Analysis and Primer Design Chapter 8
Now press OK at the lower center of the Find Primers dialog box. Press OK when Vector NTI
shows the warning dialog box. Click OK to override the previous PCR analysis results.
A new PCR analysis is performed using the additional information you have entered.
10. Inspect the New PCR Analysis Results
Inspect the subfolders of the new PCR Analysis results in the Text Pane.
Note that this time, all of the new options use the same sense primer, “Sense primer - ColE1”,
and that the REN sequences have been attached at the 5’ ends of both primers. (They are separated from the primers by a space.) Only the antisense primers vary because they were not
defined in the last dialog box.
The RENs appearing beneath each primer indicate those from the selected Palindromes/NonAmbiguous subset whose recognition sequences are found within the generated fragment. The
number of times that a REN recognition sequence is found within the PCR product is indicated.
If no number is given after a REN’s name, then that REN is found only in the primer or the
attached sequence and not within the product.
11. Save the PCR Product to the Database and Open a Display Window
Place the mouse cursor on the folder labeled “#1: Product of length 919,” and open the shortcut
menu with a right click. Choose the Save to Database and Create Window command. In the
dialog box that opens, in the Name field, enter PCR Product 1, and click OK. Choose the Main
subset and click OK. The molecule is saved to the database, and a new Molecule Display Window is created containing the molecule.
12. Arrange the View of the Product
Arrange the new Molecule Display window to show your PCR product conveniently. Activate the
Text Pane, and click the Link Panes button (
) on the Window Toolbar. Most of the symbols
in the Graphics Pane disappear because most of the folders in the Text Pane are closed.
Place the cursor on the Feature map folder and open the shortcut menu. Choose the Expand
Branch button (
), opening the Feature map folder and all its subfolders. Now the signals are
displayed in the Graphics Pane.
Locate the Restriction Map folder and open it with a double-click. Open the BamHI and HindIII
folders by double-clicking them. These sites now appear in the Graphics Pane.
Activate the Graphics Pane and press the Standard Arrangement button. Arrange the graphics
to fit the window so that the restriction sites and primers can be seen. (Use the SHIFT + Zoom In
(
) and Zoom Out (
) buttons.) Use the CTRL + Zoom buttons to change only the horizon-
75
Vector NTI Advance 10 User’s Manual
tal dimensions of the graphical map. (You can enhance your picture further using picture editing
techniques described in Chapter 6.)
Figure 8.16 Standard Arrangement of restriction site and functional signal labels
13. Close Display Windows and Exit Vector NTI
This concludes the PCR analysis tutorial. Close all Molecule Display windows using the techniques described in previous tutorials: File > Close, then File > Exit.
76
C
H A P T E R
9
TUTORIAL: MOLECULE CONSTRUCTION
Introduction
This chapter introduces you to creation of a new DNA molecule by Construction. In Vector NTI
terminology, Construction means creating a DNA molecule from fragments that are completely
defined and made compatible by the user.
At the end of this tutorial session, you will be able to:
z
Use Fragment Wizard to define the needed fragments for the Goal Molecule Definition
List
z
Name and describe the new molecule in the Construct Molecule dialog box
z
Verify that the fragments are correctly defined
z
Direct Vector NTI to construct your new molecule
z
Modify the fragment termini biochemically, when necessary, to allow completion of the
Construction process
DNA molecules can be composed of fragments of existing DNA molecules, linkers, adapters,
dummy fragments and so forth. Most of the fragments you will use to create new molecules are
fragments of existing molecules, and most of the work involved in creating a new molecule is in
defining them. Fragments like linkers and adapters are much easier to describe.
The Fragment Wizard guides you through the process of describing a new molecule fragment.
In addition to using the Fragment Wizard, you can define fragments using the Fragment Editors
available from the Construct/Design Molecule dialog box. While they can describe fragments of
all types, Fragment Editors are most convenient for defining linkers, adapters, and so forth.
Molecules that you or Vector NTI create from fragments of existing molecules are called constructed molecules. Molecules that you import or describe by hand are called basic molecules
because they enter the database as complete units rather than being built in Vector NTI from
fragments.
For more information regarding other methods of adding new molecules to Vector NTI’s database, such as design, importing molecules, assembling a molecule from a sequence text file,
refer to Chapters 10 and 11.
77
Vector NTI Advance 10 User’s Manual
1. Launch Vector NTI
Launch Vector NTI using techniques you learned in previous tutorials.
2. Create Display Windows for pBR322 and pUC19
Using the techniques you learned in previous tutorials, click the Open button and open pBR322.
Then click the Open button again to open pUC19. Two display windows are now open, one for
each plasmid. Both molecules, pUC19 and pBR322, can be viewed by selecting Window >
Cascade from the Main menu (Figure 9.1), or you can move from one molecule to the other by
selecting the molecule in the drop-down Window menu.
Figure 9.1 Opening and Viewing two Display Windows using the Cascade option in the Window menu.
3. Arrange the Display Windows
Expand the working space for the Graphics and Sequence Panes by reducing the Text Pane in
each Display window. Adjust the graphical map for each plasmid so you can easily read the features and labels.
4. Define the First Fragment (from pUC19)
The first fragment of the goal molecule includes most of pUC19, with the 5’ end of the fragment
being the SmaI restriction site and the 3’ end being the EcoRI restriction site. The second fragment is from pBR322, the 5’ end being the EcoRl site and the 3’ terminus being the AvaI restriction site.
Activate the Graphics Pane of the pUC 19 Display window. Click the Add Fragment to Goal
List button (
78
) to open the Fragment Wizard (Figure 9.2).
Tutorial: Molecule Construction Chapter 9
This dialog box guides you through the process of fragment selection, with several sequential
screens describing the corresponding actions you should take. If you make a mistake you can
return to the previous step using the Back button.
Figure 9.2 The Fragment Wizard guides you through the process of fragment selection
z
First screen (Figure 9.2): Select the Construction Fragment option. Leave the Insert
Inverted option unchecked, and click the Next button to proceed.
Figure 9.3 The second screen of the Fragment Wizard determines the 5’ terminus
z
Second screen (Figure 9.3): Drag the dialog box out of the way (left-click with the cursor
on the blue title bar) so you can see the SmaI and EcoRI restriction sites on the molecule
graphical map. To determine the 5’ terminus of the new fragment, click on the SmaI
restriction site label in the Graphics Pane. The Set to a Restriction Site option is auto-
79
Vector NTI Advance 10 User’s Manual
matically checked and the name and position of the restriction site is displayed in the
Fragment Wizard. Click the Next button in the dialog box to proceed.
Figure 9.4 The third screen of the Fragment Wizard determines the 3’ terminus
z
Note:
Third screen (Figure 9.4): To define the 3’ terminus of a new fragment, hold the SHIFT
key and click on the EcoRI restriction site label in the Graphics Pane. The Set to a
Restriction Site option is automatically checked and the name and position of the 3’ end
are displayed.
If you do not hold down the SHIFT key when selecting the 3’ end, Fragment Wizard reverts to
choosing the 5’ site.
Both labels in the Graphics Pane are now highlighted. The selected fragment is indicated by the
wire-frame in the Graphics Pane. Click the Finish button in this screen to complete the definition
of the fragment.
Figure 9.5 Adding the first fragment to the Molecule Goal list
Check the description of the fragment in the New Fragment message box: 5’ SmaI, and 3’
EcoRI. If there is an error, press the Cancel button and return back to the Fragment Wizard.
Otherwise, press the Add to List button, adding the first fragment to the Molecule Goal list (Figure 9.5).
5. Define the Second Fragment (from pBR322)
On the toolbar, select Window > pBR322, which opens the corresponding Molecule Display
window. Activate the Graphics Pane. Click the Add Fragment to Goal List button (
) to display the Fragment Wizard dialog box again. Move the dialog box so that you can see the EcoRI
and the AvaI restriction sites on the graphical map.
80
Tutorial: Molecule Construction Chapter 9
z
First screen: Select the Construction Fragment option. Leave the Insert Inverted
option unchecked, and click the Next button to proceed.
z
Second screen: To determine the 5’ end of the new fragment, click on the EcoRI restriction site label in the Graphics Pane. The Set to a Restriction Site option is automatically checked, and the name and position of the restriction site are displayed. Click the
Next button to proceed.
z
Third screen: To define the 3’ terminus of the new fragment, hold down the SHIFT key
and click on the AvaI restriction site label in the Graphics Pane. The Set to a Restriction
Site option is automatically checked and the name and position of the restriction site are
displayed.
Click the Finish button to complete the definition of the fragment.
In the New Fragment message box, verify the fragment definition: 5’ EcoRl and 3’AvaI. If the
description of the fragment is correct, press the Add to List button. The second fragment is
added to the Molecule Goal list.
6. Inspect the Goal List
To verify that the fragments in the Goal Molecule Definition List are correct, click the Open Goal
List button (
) on the Main Toolbar. This opens the Lists dialog box (Figure 9.6), where the
two fragments are listed in the Fragments section.
Figure 9.6 Lists dialog box
7. Enter General Information About the New Molecule
Click the Run button. Click in the Name field text box in the Construct Molecule dialog box (Figure 9.7) and enter the name of the new molecule, TUTORIAL1.
Figure 9.7 Construct Molecule dialog box
The radio buttons on the bottom describe the choices for the new molecule start. The first fragment in the list of component fragments is always considered the “recipient” molecule. Click the
Recipient’s Start button to position the start of the new molecule at the same place where
pUC19 starts. (If you prefer, you can choose any nucleotide of any component fragment as the
81
Vector NTI Advance 10 User’s Manual
starting coordinate of the new molecule by checking the Position ... of Fragment # ... button.
By default, it’s the first nucleotide of the first fragment.
Click the General Info button, opening the General Data dialog box where you can specify general information about the new molecule (Figure 9.8).
Figure 9.8 General Data dialog box, where you can specify general information about the new molecule
z
Click in the Description field and type Tutorial molecule #1.
z
In the Extra-Chromosome Replication field, check Bacteria.
z
In the Replicon Type field, select Plasmid.
z
In the text entry box of the Key Word area, enter your last name. Press the << Add button to add your last name to the list of keywords for this molecule. Keywords are a convenient way to find molecules you created—just search Vector NTI’s database for all
molecules with your last name as a keyword.
z
Click OK to return to the Construct Molecule dialog box.
8. Attempt to Construct the New Molecule
Click the Construct button in the upper right corner of the Construct Molecule dialog box. In the
Insert Molecule into Main subset dialog box, name your subset Tutorial and confirm the creation of the subset. Click OK. Vector NTI attempts to construct your new molecule and save it
into the database. Vector NTI soon informs you that the left end of fragment #1 (the SmaI site) is
incompatible with the right end of fragment #2 (the AvaI site).
Vector NTI cannot process your molecule. You must figure out why your fragments are incompatible and modify them appropriately so they are compatible for ligation. If you check the fragment termini, you can see the problem. The blunt 5' end of the pUC19 fragment cannot link with
the cohesive 3' end of the pBR322 fragment. You need to modify these termini to make them
compatible.
Click OK in message dialog boxes to return to the Construct Molecule dialog box.
82
Tutorial: Molecule Construction Chapter 9
9. Fill in the AvaI Site of the pBR322 Fragment to Make it Blunt
Close the Construct Molecule dialog box to return to the Lists dialog box. In the Fragments section, click on the second fragment in the list (“Molfragment of pBR322”). As you make the selection, the Edit button becomes enabled (Figure 9.9).
Figure 9.9 Enabling the Edit button in the Lists dialog box
Click the Edit button, opening the Fragment Editor dialog box (Figure 9.10).
Figure 9.10 Fragment Editor dialog box
Click on the Right Terminus button, because you need to modify the AvaI site that makes up
this fragment’s right terminus. The Terminus Editor dialog box opens (Figure 9.11).
Figure 9.11 Terminus Editor dialog box
83
Vector NTI Advance 10 User’s Manual
Because you need to perform a biochemical “operation” on the ends of the fragment, in the Terminus Editor, look in the Biochemical Operations section in the lower left corner. Although Vector NTI can handle up to three sequential biochemical operations per terminus, you need to
perform only one, filling in the cohesive Aval site. Click in the first biochemical operations box.
From the list of allowable options, choose Completely Filled In. Then click OK in the Terminus
Editor and OK in the Fragment Editor, returning you to the List dialog box.
Click the Run button on the Lists dialog box to launch the Construct Molecule dialog box. Redefine the molecule’s name, Tutorial 1, if necessary. Press the Construct button. Select the “Tutorial” subset in the Insert DNA/RNA Molecule(s) into Subset dialog box and click OK. In the new
dialog box, click the Overwrite button to overwrite your previously saved TUTORIAL1. Vector
NTI analyzes your molecule and this time enters it into the database. Close the Lists dialog box.
10. Inspect Your New Molecule
After creating the new molecule and saving it to the database, a new Molecule Display window
opens with your new molecule. Find TC(R) on TUTORIAL1’s graphical map. The molecule’s
functional and restriction maps are created automatically. Vector NTI is able to create the maps
and nucleotide sequences for new molecules with complete accuracy, even in the most complicated cloning situations.
Figure 9.12 Inspecting the two fragments used to create your new molecule
In the Text Pane, open the folder called “Component Fragments”. The two fragments that you
used to make this molecule are listed (Figure 9.12). Their subfolders describe the left and right
termini of each fragment.
Congratulations, you have created your first new molecule with Vector NTI! You defined all
of the necessary restriction sites and biochemical operations to clone a fragment from pBR322
into pUC19 in the user-defined process called Construction. In Vector NTI’s Design mode,
described in the next chapter, the program itself determines the recombinant strategy.
11. Close the Display Windows and Exit Vector NTI
To finish your session with Vector NTI, close the Molecule Display windows and exit the program
using the methods you learned in previous tutorials.
84
C
H A P T E R
10
TUTORIAL: MOLECULE DESIGN
Introduction
This chapter introduces you to the creation of a new molecule by Design, Vector NTI’s term for
using its built-in biological knowledge for new molecule creation. In Design, the user defines the
molecule fragments, but the restriction sites, methods of terminus modification, etc., are left up
to Vector NTI. The Design process results in a construction plan that takes advantage of the
best possible restriction sites and recombinant strategy.
At the end of this tutorial session, you will be able to:
z
Define the recipient and donor fragments for Design, using the Fragment Wizard
z
Confirm the correct order of recipient and donor fragments in the Design Molecule dialog
box
z
Name and describe the new molecule
z
Specify Design parameters and preferences
z
Direct Vector NTI to design the new molecule
Fragments are described as they were for molecule construction. Fragments for Design, however, must consist of exactly one recipient fragment from the parent molecule, which must be
listed first in the Goal Molecule Definition List, and one or more donor fragments. Every nucleotide in the designated recipient fragment is included in the final molecule. Vector NTI searches
the parent molecule nucleotides outside of the recipient fragment to try to find convenient
restriction sites for inserting donor fragment(s).
You may want to indicate a specific restriction site at one or both ends of the recipient fragment.
If a terminus of the recipient fragment is a restriction site, then Vector NTI automatically uses
that restriction site in building the new molecule. You may request to save or lose such a specific
restriction site. If it is not specified that the site should be retained, then that site may disappear
from the final created molecule even if you did not specify that the site must be lost.
Fragments other than that listed first on the list are called donor fragments. Because the purpose of donor fragments is to carry functional signals into the recipient, you should describe a
donor fragment, not by its termini, but by the functional signals it contains. Thus when you define
85
Vector NTI Advance 10 User’s Manual
a donor fragment in a Molecule Display window, you should click on specific functional signals.
Every nucleotide of these specific functional signals is included in the goal molecule, but nucleotides outside these functional signals may or may not be included in the goal molecule. Without
at least one functional signal, a fragment cannot be treated as a donor fragment.
A donor fragment can contain flanking regions outside the functional signals. In describing a
donor fragment, if you drag the edges of the selection zone beyond the functional signals you
have targeted, the fragment will be defined as the functional signal(s) plus flanking nucleotides.
You have defined the maximum allowable flanking regions. Vector NTI tries to reduce the flanking regions of donor fragments to be as small as possible, but does not go outside of these
flanking regions when looking for restriction sites.
In this exercise, you will perform essentially the same cloning procedure as you did in the Construction tutorial. This time, however, you will simply define the fragments and allow Vector NTI
to design the rest.
Follow the steps of the tutorial in the order shown. Figures show what your screen should look
like at various points along the way.
1. Launch Vector NTI and Create Display Windows for pBR322 and pUC19
Launch Vector NTI using techniques you learned in previous tutorials. Open Molecule Display
windows containing the molecules pBR322 and pUC19.
2. Arrange Display Windows
In order to view both windows, select Window > Tile Vertical. The display screen for both molecules appears at the same time, making it easy to work with them side by side (Figure 10.1).
Activate either window (indicated by a dark blue title bar) with a left click. Using the split bars,
reduce the Text and Sequence Panes for each molecule to optimize viewing the molecule maps.
Use the SHIFT + Zoom buttons to arrange the panes so you can easily read the features and
labels.
Figure 10.1 Displaying two screens using Tile Vertical feature
3. Define the Recipient Fragment (from pUC19)
For the goal molecule, the recipient fragment is most of the pUC19 molecule. (Molecule pBR322
provides the donor fragment.) In the pUC19 Display window, activate the Graphics Pane. Click
86
Tutorial: Molecule Design Chapter 10
the Add Fragment to Goal List button (
), opening the Fragment Wizard. You learned in the
previous tutorial that Fragment Wizard guides you through the process of fragment selection.
z
First screen: Select the Design Recipient Fragment option and click Next.
z
Second screen: For the 5’ terminus of the new fragment, in the Set To a Position
option, enter 500 in the text box. Click Next.
z
Third screen: Enter 250 in the Set to a Position text box to define the 3’ terminus. Click
the Finish button to complete the definition of the recipient fragment.
Figure 10.2 New Fragment message box
In the New Fragment message box, check the description of the fragment (Figure 10.2). If correct, click the Add to List button, adding the recipient fragment to the Molecule Goal list.
In the Graphics Pane, the recipient fragment is marked with a wire-frame. Note that the
polylinker near the 2 o’clock position is outside the selection. If you included the polylinker in the
selection, Vector NTI would not be able to use those restriction sites because every nucleotide
included within the selection zone in the recipient fragment will be included in the final molecule.
4. Define the Donor Fragment (from pBR322)
In the pBR322 Display window, activate the Graphics Pane, then click the Add Fragment to
Goal List button (
) opening Fragment Wizard again.
z
First screen: Select the Design Donor Fragment radio button. Click Next.
Second screen: Move the cursor until it is over the TC(R) arrow or label in the Graphics
Pane. Drag the Fragment Wizard out of the way, if necessary. The cursor changes to a
hand (
), indicating that you are pointing directly at a functional signal. Click once to
select the entire TC(R) signal. The selection wire-frame appears, aligned directly with
the start and end of TC(R). The name of the signal is displayed in the Fragment Wizard.
Click the Finish button. The default values are used to complete the definition of the fragment.
Continuing with the Fragment Wizard allows specifications for more complicated design, to be
covered in the next chapter.
z
In the New Fragment message box, check the donor fragment description. Note that the 3’ and
5’ termini of the donor fragment are described (correctly) as “Undefined”. Click the Add to List
button, adding the donor fragment to the Molecule Goal list.
5. Inspect the Goal Molecule Definition List
Click the Open Goal List button (
) in the main toolbar, opening the Lists dialog box. Notice
that the Design button is selected, indicating that Vector NTI already has recognized that your
fragments are for Design and not Construction.
In the Goal Molecule Definition List appearing in the Fragments section of the dialog box,
inspect the two fragments you defined. For the recipient fragment (pUC 19, listed first), the termini are defined by nucleotide positions. For the donor fragment (pBR322, listed second), the
termini are not defined (NODEF), but the fragment must contain the TC(R) descriptor.
87
Vector NTI Advance 10 User’s Manual
Note: For Design to proceed correctly, recipient and donor fragments must be listed correctly. If
one is listed incorrectly, select it and use the Up and Down buttons to reposition it.
6. Enter General Information for Your New Molecule
Click the Run button. Although this box is almost identical to the Construct Molecule dialog box,
in the previous chapter, its name and operational mode have changed to Design Molecule. This
is a result of the molecule building process you designated in the Fragment Wizard.
In the Name text box, enter the name of the molecule, TUTORIAL2. Click the General Info button. In the General Data dialog box, in the Description field, enter Tutorial molecule #2.
Set the Extra-Chromosome Replication type to Bacteria and the Replicon Type to Plasmid. To
enter your last name as a keyword, select it from the existing keyword list in the drop-down
menu and click the << Add button.
Click OK to return to the Design Molecule dialog box (Figure 10.3).
Check the Recipient’s Start button in the radio button group on the bottom of the Design Molecule dialog box to position the start of the new molecule at the same place where the recipient
molecule (pUC19) starts.
Figure 10.3 Entering general information for your new molecule in the Design Molecule dialog box
7. Prepare to Design the New Molecule
Click the Design button in the upper right corner of the Design Molecule dialog box. When
asked, select the “Tutorial” subset you created in the last tutorial, and click OK to continue. The
Design Parameters dialog box opens (Figure 10.4).
Figure 10.4 Design Parameters dialog box
Here you can select the subsets of restriction endonucleases (RENs) that Vector NTI considers
when designing the new molecule. For example, you could create a subset listing the RENs you
88
Tutorial: Molecule Design Chapter 10
have on hand in the laboratory and tell Vector NTI to design the new molecule using only those
enzymes.
You can also indicate the transformation systems to be used in your experiments, as well as the
presence or lack of extra-chromosome replication capability of your molecule in those transformation systems. You can permit or forbid the use of dephosphorylation as a pre-selection
method, etc.
Make sure that the Palindromes/Non-Ambiguous REN subset is selected. For this tutorial, leave
all other parameters at their default values.
8. Set Your Preferences for Molecule Design
Now click on the Preferences button, opening the Design Preferences dialog box (Figure 10.5)
In this box, you can choose the parameters you prefer to create new molecules. You can designate which genetic engineering techniques are permissible and assign priorities for use of the
permissible techniques. You can set preferences in the categories of fragment isolation, fragment ligation, and terminus modification.
Figure 10.5 Design Preferences dialog box, where you can choose parameters to create new molecules
You may find it useful for Vector NTI to design the same goal molecule several times, changing
the design preferences each time. This gives you several alternatives for constructing your molecule.
Let’s change the preferences for fragment ligation. Turn off the check box for blunt-blunt ligation.
In a blunt-blunt ligation, both the donor and the recipient have only blunt termini. Since we are
deactivating this option, Vector NTI will make sure that all fragments have at least one cohesive
end.
Below the check boxes are priority lists specifying which of the techniques are preferable. Leave
these at their default values.
With the Advanced Preferences, accessible through the Design Preferences dialog box, you
could alter the way Vector NTI’s evaluates possible design paths. For this tutorial, ignore the
Advanced Design Settings.
Click the OK button, accepting the Design Preferences and returning to the Design Parameters
dialog box.
89
Vector NTI Advance 10 User’s Manual
9. Design the New Molecule
Click the Start Design button. Vector NTI generates many possible ways of cloning the donor
into the recipient and seeks the best solution using its biological knowledge and the preferences
you indicated. An optimum cloning method is quickly found and the goal molecule is created
based on that best option.
10. Inspect the New Molecule
When the design is complete, Vector NTI opens a new Molecule Display window containing the
molecule you have created (Figure 10.6).
Figure 10.6 Inspecting the new molecule you have created
Maximize and inspect the graphical map and text description of your new molecule. In the Text
Pane, the new Design Description folder contains instructions for creating TUTORIAL 2 at the
laboratory bench.
11. Inspect the Design Plan
To verify the restriction enzymes used in the design process, they must be specified in the
restriction enzyme display list. This is accomplished by clicking the Display Setup (
) button
on the Pane Selection toolbar.
In the Molecule Display Setup dialog box, check the Restriction Map checkbox and press the
RMap Setup button to specify the restriction sites to be displayed. The Restriction Map Setup
dialog box displays in the Use Enzymes column the restriction enzymes, whose sites are shown
by default. To include the enzymes from the design process in the display list, click the < Add
button.
In the Choose Database Enzymes dialog box, with the Palindromes/Non-ambiguous subset
selected in the Look in: pull -down menu at the top of the dialog box, select CfrJ4I and Ball from
the list of available restriction enzymes. Click OK. For more information, See Restriction Map
Setup on page 219.
In the Text Pane, open the Design Description folder and its subfolder labeled Step #1.
z
90
Vector NTI uses the CfrJ4I and EcoRI sites of the recipient, and the EcoRI and BalI sites
of the donor. The donor fragment has short flanking regions on either side of the func-
Tutorial: Molecule Design Chapter 10
tional signal TC(R). The sites chosen are compatible, so no biochemical operations are
necessary to modify the termini.
z
With the selected restriction sites, each fragment has one cohesive end and one blunt
end, so blunt-blunt ligation is avoided as requested. The selected cloning option gives
the required orientation of the cloned fragment in the recipient.
z
One of the recipient’s restriction sites—CfrJ4I—is lost after ligation. This allows preselection of ligated molecules using CfrJ4I before transformation. Because the recipient’s CfrJ4I site is lost in the successful cloning process, this prescreening eliminates
improperly ligated fragments. As only one transformation system (bacteria) was designated, Vector NTI suggests no alternatives. If you had permitted several transformation
systems, Vector NTI would have chosen the system that involves the least effort.
z
For clone analysis after transformation, Vector NTI suggests using the restriction
enzyme AaaI. Its recognition site is new in the recombinant molecule and does not exist
in the recipient.
z
For alternative methods of clone analysis, the system recommends an oligonucleotide
for colony hybridization and PCR primers to use in that technique.
z
Vector NTI lists restriction sites close to the cloned fragment that can be used to isolate
the cloned fragment from the recombinant molecule: EcoRI and BspAAII. Vector NTI has
only considered the restriction endonucleases in the REN subset selected in the Design
Parameters dialog box.
z
The Design Description folder shows what sites the recombinant lacks, and lists all
unique sites on the recombinant, divided into two groups, those inside the cloned fragment and those outside.
If the design were to consist of more than one cloning step, similar information would be given in
a separate folder for each stage of the process.
12. Print Out the Design Plan
To print the design plan generated for your new molecule, activate the Text Pane of the
TUTORIAL2 Display window. Close all of the folders, then open the Design Description folder
and the Step #1 subfolder. Click the Print Active Pane button (
) on the Window Toolbar,
and the open folders in the Text Pane are printed to your printer. You now have a hard copy of
the Design Plan for TUTORIAL 2.
91
Vector NTI Advance 10 User’s Manual
92
C
H A P T E R
11
TUTORIAL: ADVANCED MOLECULE DESIGN
Introduction
In the previous two tutorials, you were introduced to simple molecule creation using Vector NTI’s
Construction and Design tools. This chapter introduces you to more complex Design procedures. In the first scenario, you will assign some complex conditions to the recipient molecule,
leaving the donor fragment relatively simple. In the second, you will use a relatively simple recipient but make the donor fragment more complex. Since you are probably getting tired of pBR322
and pUC19, let’s change molecules. You will now use BPV1 and SV40.
At the end of this tutorial session, you will be able to:
z
Define the recipient and donor fragments for Design using Fragment Wizard, placing
complex requirements upon the recipient.
z
Define the recipient and donor fragments for Design using Fragment Wizard, placing
complex requirements upon the donor.
z
Describe the new molecule.
z
Design the new molecule.
Follow the steps in the order shown. Figures show what your screen should look like at various
points along the way.
1. Launch Vector NTI, Open and Arrange Display Windows
Launch Vector NTI using techniques you learned in previous tutorials.
Using techniques you learned in previous tutorials, open Molecule Display windows for molecules BPV1 and SV40. Select Window > Tile Vertical to work with the molecules side by side.
Since you will be working with the molecules’ graphical maps, arrange the display windows conveniently.
First Design: Complicated Recipient
In the first complex design, you will insert SV40’s LARGE_T gene into the second ApaLI site of
BPV1. You will direct Vector NTI to save the 5’ ApaLI site and prohibit blunt-blunt fragments. If
93
Vector NTI Advance 10 User’s Manual
the donor has ApaLI sites appropriate for cutting the cloned fragment, then the problem will be
simple. If not, the system must take a more complicated approach to perform the insertion.
2. Define the Recipient Fragment
In the BPV1 Display window, activate the Graphics Pane. Open the Fragment Wizard using the
Add Fragment to Goal List button (
) as you did in the previous tutorials, and follow these
steps:
z
First screen: Select the Design Recipient Fragment option. Click the Next button.
z
Second screen: To define 5’ terminus, click on the label of the ApaLI restriction site #2
in the Graphics Pane (nucleotide 7631, or about the 11 o’clock position). Click the Next
button to continue.
z
Third screen: Select Save Site to save the ApaLI site on 5’ end of the recipient fragment. Click the Next button.
z
Fourth screen: To define the 3’ terminus, press SHIFT + CLICK on the same ApaLI site.
The name and the position of the site are now displayed in the Fragment Wizard. Click
the Finish button to complete the definition of the recipient fragment.
Figure 11.1 New Fragment message box, with 3’ and 5’ termini of the recipient fragment set on the same ApaLI
site
In the New Fragment message box, inspect the recipient fragment. Note that the 3’ and 5’ termini of the recipient fragment are set on the same ApaLI site (Figure 11.1). Click the Add to List
button, adding the recipient fragment to the Molecule Goal list.
3. Define the Donor Fragment
Switch to the SV40 Display window and activate its Graphics Pane. Open the Fragment Wizard
again:
z
First screen: Select the Design Donor Fragment option on the first screen; click the
Next button.
z
Second screen: Click on the LARGE_T signal’s symbol or label in the Graphics Pane to
select it. Click the Finish button in the Fragment Wizard.
Inspect the donor fragment in the New Fragment message box, and click Add to List button.
(Figure 11.2) The donor fragment is added to the Molecule Goal List.
4. Inspect the Goal Molecule Definition List
Click the Open Goal List button (
) in the main toolbar, opening the Lists dialog box. The
Fragments section of the dialog box contains the Goal Molecule Definition List, listing the two
fragments you defined. The recipient fragment (BPVI) must be the first in the Goal Molecule
Definition List. (If it is not, select the fragment, then click the Up button to move it into the correct
position.)
94
Tutorial: Advanced Molecule Design Chapter 11
Highlight the SV40 fragment and click the Edit button, opening the Fragment Editor dialog box.
Click the Inverted check box to change LARGE_T’s direction to match the recipient’s direction
and click OK.
You could leave LARGE_T in its original orientation if you want to; the system will design your
new molecule either way. We have changed LARGE_T to Inverted only to demonstrate that
Vector NTI can clone fragments in different orientations.
5. Enter General Information for Your New Molecule
Click the Run button. Enter the name and description for you new molecule as you learned in
previous tutorials:
z
Name the molecule TUTORIAL 3.
z
Click the General Info button, opening the General data dialog box.
z
In the Description field, enter Tutorial molecule #3.
z
Set the Replicon Type to Plasmid.
z
Turn on the Bacteria Extra-Chromosome Replication option.
z
Enter your name as a keyword.
z
Click OK to return to the Design Molecule dialog box.
z
Check the Recipient’s Start button in the radio button group to position the new molecule start at the same place (if possible) where the recipient molecule (BPV1) starts.
6. Prepare to Design the New Molecule
Click the Design button in the upper right corner of the Design Molecule dialog box. When
asked for a subset name, select the Tutorial subset you created before; click OK to continue.
The Design Parameters dialog box appears. Leave all the settings at their default values and
move on to the next step.
7. Set the Design Preferences
Click on the Preferences button, opening the Design Preferences dialog box. Note that the
blunt-blunt ligation box is already turned off. Vector NTI remembers your previous design preferences so that you do not have to set them every time you design a new molecule.
Below the check boxes are priority lists specifying which of the techniques are preferable. Leave
these at their default values.
Click the OK button to accept the Design Preferences and return to the Design Parameters dialog box.
8. Design the New Molecule
Click the Start Design button. As before, an optimum cloning method is quickly found, and the
goal molecule is constructed based on that best option.
95
Vector NTI Advance 10 User’s Manual
9. Inspect the New Molecule
When the design is complete Vector NTI opens a new Molecule Display window containing the
molecule you have created (Figure 11.2).
Figure 11.2 Inspecting the new molecule you have created
10. Inspect the Graphical Map and Text Description of Your New Molecule
To verify the restriction enzymes used in the design process, they must be specified in the
restriction enzyme display list. This is accomplished by clicking the Display Setup (
) button
on the Pane Selection toolbar.
In the Molecule Display Setup dialog box, check the Restriction Map checkbox and press the
RMap Setup button to specify the restriction sites to be displayed. The Restriction Map Setup
dialog box displays in the Use Enzymes column the restriction enzymes, whose sites are shown
by default. To include the enzymes from the design process in the display list, click the < Add
button.
In the Choose Database Enzymes dialog box, with the Palindromes/Non-ambiguous subset
selected in the Look in: pull -down menu at the top of the dialog box, select AccEBI and
M.NgoAV from the list of available restriction enzymes. Click OK. For more information, See
Restriction Map Setup on page 219.
Activate the Text Pane, and open TUTORIAL 3’s Design Description folder and the Step #1 subfolder. Review the description of how to create TUTORIAL 3. In particular, note the following:
z
96
You defined a specific ApaLI site on the recipient molecule as the site into which the
donor fragment was to be cloned. You also requested that Vector NTI save this site in
the recombinant molecule. ApaLI was not a unique site, so Vector NTI had to use partial
digestion to isolate the recipient. Then the system had to find a way to insert the donor
fragment. There may not have been any good sites available on the donor fragment to fit
into the recipient’s ApaLI site; therefore, Vector NTI excised the donor fragment with convenient sites that did not require partial digestion and left short flank regions, AccEBI and
M.NgoAV. These termini were then filled in completely and ApaLI linkers were attached
to the blunt ends. This fragment was then cloned into the recipient.
Tutorial: Advanced Molecule Design Chapter 11
z
You can be sure the cloned fragment contains no ApaLI sites (Vector NTI checked this
when selecting a linker) and that there were no easier ways to perform this cloning.
z
The rest of TUTORIAL 3’s Design Description is similar to the Design Description of
TUTORIAL 2, designed in the previous tutorial. However, because the 5’ and 3’ termini
of the recipient for TUTORIAL 3 are identical, we need to know how to distinguish clones
with the proper orientation. Thus a new paragraph appears in TUTORIAL 3’s design
description, recommending that the AauI and ApaLI restriction sites would allow you to
distinguish between different insert orientations upon gel analysis.
You may print out this design plan if you wish, and then proceed to the next design task.
Second Design: Complex Donor Fragment
You will now design a second molecule based on BPV1 and SV40, this time making the donor
more complicated rather than the recipient.
1. Define Recipient
Return to the BPV1 Display window’s Graphics Pane and open the Fragment Wizard:
z
First screen: Select the Design Recipient Fragment option and click the Next button.
z
Second screen: Select the Set to a Position option and enter 5000 as the position of the
5’ terminus. Click the Next button.
z
Third screen: To define the 3’ terminus, select the Set to a Position option again; enter
2500. Click the Finish button.
Inspect the results in the message box, and click the Add to List button. The recipient fragment
is added to the Molecule Goal List.
2. Define Donor
Switch to the SV40 Display window’s Graphics Pane and open the Fragment Wizard.
z
First screen: Select the Design Donor Fragment option and click the Next button.
z
Second screen: Click on the LARGE_T signal’s symbol or label in the Graphics Pane to
select it. Click the Next button.
z
Third screen: The default option on the next screen is “Leave terminus Undefined.” Do
not change this option; click the Next button.
z
Fourth screen: On this flank region screen, you can specify the maximum size of the
flank region or let Vector NTI use all available space outside the selected signal. Select
the Use flank region no larger than option. You can either enter the maximum length in
the text box or select the fragment in the Graphics Pane. Move your cursor over the 5’
end of the selection wire-frame in the Graphics Pane (indicated by the
symbol). Click
and drag the 5’ end to the position at about nucleotide 2250. The current position is displayed in the status bar. (Remember you can use SHIFT + right and left arrow keys to
fine-tune the selection.) The edit box in the Fragment Wizard shows you the maximum
size of the flank region (it should be about 400 nucleotides). When you are finished, click
the Next button to go to the 3’ terminus screen.
z
Fifth screen: Specify here that Vector NTI should use the NcoI restriction site at nucleotide 38 to cut the 3’ terminus of the donor fragment. Select the Use specific site option,
SHIFT + CLICK on the NcoI restriction site at nucleotide 38. (Drag the Fragment Wizard out
of the way, if necessary). The name and the position of the restriction site appear in the
97
Vector NTI Advance 10 User’s Manual
Fragment wizard screen. Click the Finish button to complete the definition of the donor
fragment.
Figure 11.3 New Fragment message box
In the New Fragment message box, inspect the selected donor fragment. Note that the 5’ terminus is described as “Undefined,” with the specified maximum length of a flank region and the 3’
terminus is set to the NcoI site (Figure 11.3). Click the Add to List button, adding the donor
fragment to the Molecule Goal list.
3. Inspect the Goal List
Click the Open Goal List button to open the List dialog box and inspect the fragments you have
defined. The recipient fragment (BPV1) must be listed first in the Goal Molecule Definition List.
Select the donor fragment (SV40) and press the Edit button, opening the Fragment Editor. One
end of the donor is determined by a restriction site, while the other end has a flank region
defined. This makes the situation considerably more complicated than our previous cases,
where the donors were more simply defined. Click the Inverted check box and click OK.
4. Design the New Molecule
Click the Run button. Enter the name TUTORIAL 4 and enter the other necessary information
about the new molecule. Check the Recipient’s Start button to make the start of the new molecule at the same place (if possible) where the recipient molecule (BPV1) starts.
Click the Design button in the upper right corner of the dialog box. Select the “Tutorial” subset
for the molecule and click OK to continue. Leave the Design Preferences at their default settings
and click the Start Design button. After a few moments, Vector NTI produces a workable design
for the molecule you have requested.
5. Inspect and Print the New Molecule
To verify the restriction enzymes used in the design process, as mentioned in the previous tutorial, they must be specified in the restriction enzyme display list. Using the skills you learned
previously in this tutorial, add AccEBI to the restriction enzyme display list.
In the new Molecule Display window containing TUTORIAL 4, inspect the Step #1 subfolder of
the Design Description folder. In this case, despite the more complex conditions you specified,
Vector NTI found a simple and convenient design. Both donor and recipient can be isolated at
the NcoI and AccEBI sites, so the cloning is straightforward.
You specified a maximum flank region of about 400 nucleotides; Vector NTI found a good
AccEBI site, allowing the actual flank region to stay within the assigned limit.
If you wish, print out the design description and/or graphical map of TUTORIAL 4.
98
C
H A P T E R
12
TUTORIAL: GEL DISPLAY WINDOWS;
RESTRICTION DIGESTION
Introduction
This chapter introduces you to Vector NTI’s Gel Display windows, powerful tools for running and
analyzing Gel electrophoresis. Vector NTI predicts the results of actual Gel electrophoresis
experiments and displays them in text and graphics form.
At the end of this tutorial session, you will be able to:
z
Open a new Gel Display window
z
Create a gel marker (size standard)
z
Add samples and gel markers to a “virtual” gel
z
“Run” the gel and animate it
z
Calculate the time needed to separate a specific fragment
z
Manipulate gel graphics
Follow the steps in the order shown. Figures show what your screen should look like at various
points along the way.
1. Launch Vector NTI
Launch Vector NTI using techniques learned in previous tutorials. Open the Vector NTI workspace window and maximize it.
2. Create a New Gel and Open a Display Window
Click the New Gel button (
) on the Main Toolbar to create a new Gel. In the Gel Setup dialog
box that opens (Figure 12.1), you can define your own gel and electrophoresis parameters,
such as:
99
Vector NTI Advance 10 User’s Manual
z
gel type (agarose, polyacrylamide, ...)
z
gel concentration
z
gel dimensions
z
voltage
z
electric field type (steady, pulse)
Figure 12.1 Gel Setup dialog box, where you can define your own gel and electrophoresis parameters
Leave all of the default gel settings.
From the Electrophoresis Profile drop down menu, select the Examples of Agarose Gel and
click OK. Your new gel opens in the Gel Display window. Maximize the window.
3. Create a Sample and Add it to the Gel
The Display window that opens displays an empty gel ready to receive samples. Your sample
will consist of the SV40 molecule cut by the HaeIII and HindIII restriction endonucleases.
Click the Create Sample button (
) on the Window toolbar. In the Create Gel Sample dialog
box that opens (Figure 12.2), in the Molecules box, select SV40. In the Enzymes box, scroll to
select HaeIII and HindIII. As you select the molecule and RENs, their names appear in the
Selected for Gel Sample column on the right side of the dialog box.
100
Tutorial: Gel Display Windows; Restriction Digestion Chapter 12
In the Sample Name box near the bottom of the dialog box, enter Sample I. In the Description
box, enter SV40 cut by Haelll and Hindlll.
Figure 12.2 Create Gel Sample dialog box
Click the Add to Gel button in the upper left corner of the dialog box. Vector NTI cuts SV40 with
the two RENs and adds the resulting fragments to the gel shown in the active Gel Display window. Click the Close button to close the dialog box.
4. Add Gel Markers
Now let’s add three gel markers as size standards for the gel.
Click the Add Marker Lane button (
) on the Window toolbar. The dialog box that opens displays the gel markers currently stored in the database. Add the following gel markers:
z
Lane 2: Select the PBR322-Haelll gel marker; click OK.
z
Lane 3: Select SPP-EcoRI; click OK.
No lambda-HindIII size marker appears in the Vector NTI database. Because it’s a commonly
used size standard, let’s create our own. Select Gel > Create Gel Marker on the menu bar. In
the New Gel Marker dialog box, on the General tab, enter Lambda HindIII. On the Gel Marker
tab, enter each fragment size, then click the Add button: 23130, 9416, 6557, 4361, 2322, 2027,
560. Click OK.
z
Lane 4: Select Lambda HindIII, your newly created gel marker. Click OK.
101
Vector NTI Advance 10 User’s Manual
5. Arrange the Gel Display Window Conveniently
Using the split bars, scroll bars and Zoom buttons, arrange the Gel Display window to your liking
(Figure 12.3).
Figure 12.3 Arranging the Gel Display window
6. Inspect the Gel Display Window Text Pane
Activate the Text Pane of your Gel Display window by clicking the Text Pane button (
) and
inspect its contents. The General Description folder describes the electrophoresis parameters.
There is also a folder for each lane of the gel.
Open the folder “1. Sample 1” by double clicking on it or clicking on [+]. Open the folder representing the longest fragment in the sample, labeled 861. For this fragment, the source molecule
is SV40, and the ends of the fragment are the HindIII site found at position 4003 and the HaeIII
site found at position 4864. Note that the source of the fragment is described. There are also
subfolders for each fragment in decreasing order of length. Close the Sample 1 folder with a
double-click.
Double click the folder labeled “SPPI – EcoRl” the gel marker found in lane 3 of the gel, and
open the subfolder “8000”. Note that it is empty. The folder is empty because for gel marker
fragments, only the length is stored in the database.
7. Change Display Color for a Fragment
You can use the Text Pane to change the color and style for displaying fragments. Open the
SAMPLE1 folder again. Scroll down to a folder labeled “540 [length of fragment]” and open its
associated shortcut menu.
Choose Sample Fragment Properties. In the dialog box that opens, you can choose line style
and color for this fragment. Leave the line unchanged, but change the color to green.
As the gel runs, you can locate the 540-bp fragment by looking for the green color.
102
Tutorial: Gel Display Windows; Restriction Digestion Chapter 12
8. Run the Gel
To run the gel, activate the gel pane. Click the Fit To Window button (
play to fit exactly within the current window.
), causing the gel dis-
Click the Step Forward button ( ) in the Window Toolbar. The time indicator increases by fifteen minutes, and the fragments advance in the “gel”. Click the Step Forward button several
more times.
Click the Step Back button ( ) in the Window toolbar. The time indicator and gel display now
back up.
Now click once in the time indicator box to activate it. Enter 1:30 in the time indicator box, and
press Enter. The gel display is set for 1 hour and 30 minutes of elapsed time.
Figure 12.4 Running the gel
As the gel advances and retreats, note how the scale at the left of the gel keeps track of the
fragment sizes (Figure 12.4).
9. Gel Animation
Click the Animate button (
) on the window toolbar to view a continuous simulation of a Gel
electrophoresis. The gel now runs continuously at the speed specified in the Gel Setup dialog
box when you created the gel.
When the gel time indicator reaches three or four hours, click the Animate button again to stop
the run. The fragments are now well separated.
10. Optimize the Gel Display
Click the Zoom In button (
) several times until fuzzy gray bars appear around the lines representing the DNA fragments (Figure 12.5). Using the scroll bar, move down along the gel until
103
Vector NTI Advance 10 User’s Manual
your green fragment appears. The gray bars show the minimum distance by which fragments
must be separated so that you can distinguish them in the gel.
Note that the gray bars of many fragments touch each other. This indicates that you will not be
able to distinguish those fragments in the gel. The size of the gray bars is determined by the
Separation Distance parameter, defined in the Gel And Display Setup dialog box described in
step 2.
Figure 12.5 Optimizing the Gel Display
Click the True-Scale View button (
ratory.
Click the Fit To Window button (
within the current window.
), which sizes the gel to represent its true scale in a labo-
) again, and the graphical gel display is sized to fit exactly
11. Change to a Polyacrylamide Gel from the Electrophoresis Profile
Change the parameters of the gel by clicking on the Gel and Display Setup button (
) in the
Window Toolbar. In the Electrophoresis Profile drop-down menu in the dialog box, select Example of Polyacrylamide Gel and click OK. The electrophoresis parameters are changed. While
the contents of the lane have not changed, as you view your gel again, note that the positions of
the various fragments have been altered.
12. Estimate Fragment Separation Time
Some fragments in our gel are still too close together to distinguish. To estimate how long the
gel would have to run to separate them, use Vector NTI’s built in calculator as follows:
to run to separate them, use Vector NTI's built in calculator as follows:
z
Activate the Graphics Pane.
z
In the Time Indicator box of the Window Toolbar, type in 2 hours and 30 minutes (2:30).
z
Click ENTER.
Click the Fit to Window button (
button (
104
) to set the gel to its standard size and press the Zoom In
) three times to magnify the view of the gel.
Tutorial: Gel Display Windows; Restriction Digestion Chapter 12
Review the first lane of the gel, containing SAMPLE1. With the scroll bar, scroll down until you
find the section of the gel containing fragments with lengths between 500 and 700 bp. (You will
see three fragments just above the 500-bp mark.) The middle fragment (length 540 bp) is green,
because you set its display color in step 7 of this tutorial. The fragments’ gray borders overlap
with each other, indicating that these fragments are still too close together to be distinguishable
on the real gel.
Move the cursor to Lane 1, where it changes into a horizontal I-beam (
). Place the
mouse cursor above the three fragments. Left-click + drag the mouse (I-beam) downwards,
highlighting all three unseparated bands.
Click the Calculate Separation Time button (
) in the Window Toolbar. A message appears,
telling you that the gel would have to run for 5 hours and 30 minutes to separate the selected
fragments. This gives you a general idea of what to expect in an actual gel run. Click OK. The
gel moves immediately to the position at that time elapse. Scroll down so you can view the fragments.
Click anywhere in the gel pane to remove the selection.
13. Save the Gel Display Window to a Gel Document File
To save the data in the Gel Display window, including gel settings and fragments positions,
select Gel > Save as Document from the menu bar.
A dialog box appears, asking you for a filename. Name the file Tutorial.gd and click the Save
button. The gel is saved in a Gel Document file.
To close the Gel window, select Gel > Close.
Now open the saved Gel Document you created. Select Gel > Open Document, and select the
name of the saved document file from the file list. Your Gel Document opens, and all your fragments and settings have been preserved.
14. Close the Gel Display Window
You have now taken a first look at Vector NTI’s Gel Display windows and restriction digestion
features. Close the window using Gel > Close.
15. Calculate Restriction Fragments
One of the simple options in Vector NTI is creating restriction fragments of molecules.
Using techniques you have learned, open and maximize the pATH23 Molecule Display window.
Select Analyses > Restriction Analyses > Restriction Fragments on the menu bar. Deselect
all of the RENs listed. Then select ApaLI and EcoRI. Click OK.
Inspecting the Text Pane reveals that all of your resulting fragments are noted, with their size,
source, and the restriction sites producing those fragments.
Identify several of the restriction fragments on the molecule map by placing the cursor on the
appropriate line in the Restriction Fragments folder (Text Pane) and opening the shortcut menu.
Select Find Fragment. Clicking this option results in the selection of the fragment on the graphics map. Close the windows.
105
Vector NTI Advance 10 User’s Manual
106
C
H A P T E R
13
TUTORIAL: INTERNET CONNECTIVITY AND TOOLS
Introduction
This chapter introduces you to Vector NTI tools that provide connections to external programs
and Internet services.
At the end of this tutorial session, you will be able to:
z
Send data from Vector NTI to several public Internet servers
z
Perform a simple BLAST search, alignment and analysis
z
Save Internet search results as Comments in a database file
Follow the steps in the order shown. Figures show what your screen should look like at various
points along the way.
1. Launch Vector NTI and Open pBR322 in a New Display Window
Launch Vector NTI by selecting Start > Programs > Invitrogen > Vector NTI Suite 10 > Vector
NTI. Click the Open Document button (
) on the main toolbar. Open the Molecule Viewer for
pBR322 using the techniques you learned in previous tutorials.
2. Select the Whole Sequence of pBR322 and Use the BLAST Search Tool
Select Analyses > Web Analyses > Compare Against > Many databases using BLAST @
NCBI.
Alternatively, BLAST Searches can be launched in Analysis Monitor (page 569), or by selecting
Start > Programs > Invitrogen > Vector NTI Suite 10 > BLAST Search.
Note:
Some World Wide Web browsers require the Internet connection to be established before you
start the browser. If your TCP/IP stack or other Internet connection software cannot be started
“on the fly,” you need to connect before selecting any of Vector NTI’s Internet-related commands.
107
Vector NTI Advance 10 User’s Manual
In the Sequence Data dialog box of the BLAST viewer (Figure 13.1), choose the range and
strand of the sequence to be sent to the server: Whole Sequence/Direct Strand.
Figure 13.1 Sequence Data dialog box of the BLAST viewer
Click OK to continue. Your selected browser may open automatically or a list of available browsers may open.
If appropriate, select the name of your Internet browser from the list and click OK to continue.
This configures Vector NTI’s connection to the Internet for all subsequent connections.
Note:
The standard Vector NTI distribution contains support modules for many popular Internet browsers. If your Internet browser is not in the list, try selecting one of the “Autodetect” modules from
the displayed list. The latest additions to the list are available on the Vector NTI web page:
www.invitrogen.com/bioinformatics
Vector NTI opens the BLAST Search page in the Internet browser (Figure 13.2). (The page may
look only similar to this, depending on your browser).
Figure 13.2 NCBI Blast Search page
This page is Vector NTI’s gateway to the NCBI BLAST Search server and contains options that
can be used to change various BLAST search parameters.
The sequence of pBR322 is already entered in the Search field. In the Choose database section, select the nr database. Scroll to the bottom of the page. If your e-mail address appears in
the Send results by e-mail text box, delete it. Click the BLAST! button.
Note:
At this step, your Internet browser may display a dialog box or start a program to establish an
Internet connection. If this happens, enter the required parameters and continue.
Once an Internet connection with the NCBI server has been established, you should see the
NCBI formatting BLAST page. To proceed, click the Format! button on that page. The response
time for the BLAST results varies depending on the server load. If the server is busy, wait several minutes and resubmit the query.
108
Tutorial: Internet Connectivity and Tools Chapter 13
Note:
Since the interface of Internet servers changes from time to time, you may receive a message
that the requested resource is not found. This means that Vector NTI’s server gateway page is
obsolete.
When you receive the results from the BLAST server, click on the second molecule link (at the
time of this writing (9/2003), the first hit was pBR322 itself and second hit was U03501/YRP7).
Another page appears, containing the GenBank description of the molecule (Figure 13.3):
Figure 13.3 NCBI Web page containing the GenBank description of the molecule
3. Display the Result of the Query in a Molecule Display Window
To transfer the result of the query back to Vector NTI, highlight the GenBank text starting at the
word “LOCUS” and ending with the “//” at the end of the sequence. Select Edit > Copy from the
drop-down menu (or its analog) in your browser to copy the selected text to the Clipboard.
Switch back to the Vector NTI workspace and choose Edit > Open from Clipboard from the
Vector NTI Main menu (Figure 13.4).
Figure 13.4 Transferring the result of the query back to Vector NTI
109
Vector NTI Advance 10 User’s Manual
In the Open/Import from ‘Clipboard’ dialog box that opens, select GenBank file from the list of
file types and click the Open button (Figure 13.5).
Figure 13.5 Selecting the file type for the transferred query
Vector NTI opens your molecule in a new Molecule Viewing window, automatically generating
the restriction map and graphics representation of the molecule.
4. Save (Send to) or Open the Result of the Query Using the Save Button
An alternative way to transfer search results from the NCBI server to Vector NTI is to use the
Send to button on the query’s GenBank report. You can also use the Send to button to save the
query molecule to your hard drive as an independent file.
Switch back to the U03501/YRP7 GenBank report and locate the Send to button just above the
text of the GenBank report. Click the Send to button. In the drop-down menu that appears along
side the Send to button, make sure the File option is selected. The File Download dialog box
appears.
z
If you choose the Open option, your browser will try to load the document into the associated application. The Open With dialog box appears, scroll down the list of available
programs and select Vector NTI. Click OK. In the Open/Import dialog box, select GenBank file from the list of file types and click the Open button (Figure 13.5). If Vector NTI
was configured correctly, a new window should appear in its workspace showing the
U03501 molecule.
z
If you choose the Save option, you can specify a file name and a location to store the
U03501 molecule as a file on your hard drive.
5. Use Alignment and Analysis Tools
The standard distribution of Vector NTI has several tools to perform sequence alignment and
analysis. To perform the alignment, switch to the Database Explorer window using the Local
Database button (
). Select the Proteins table from the drop-down menu.
Vector NTI displays the list of proteins in the database CTRL + CLICK on 41BB_HUMAN and
41BB_MOUSE to select both. Choose Align > Web Alignment Tools > Multiple Alignments >
Multiple Alignment @ BCM Server from the Database Explorer menu bar. Vector NTI opens
110
Tutorial: Internet Connectivity and Tools Chapter 13
the browser and displays the BCM Search page containing the sequences of the selected proteins in FASTA format (Figure 13.6).
Figure 13.6 BCM Search page
Click the Submit button to start the ClustalW alignment (the default option). If the BCM server is
not too busy, you will receive the response in 5-10 seconds. Scroll through the screen to review
the text-based alignment results.
To analyze a protein using the PROSITE program on the ExPASy server in Switzerland, return
to the Database Explorer window and click on the 41BB_HUMAN protein again to select it.
Choose Analyses > Web Analyses > Protein Feature Search > Domain Database PROSITE
using ScanProsite @ ExPASy from the Database Explorer’s menu bar.
When you see the ScanProsite page containing the sequence of 41BB_HUMAN in the browser,
select and copy the sequence from the Scan a Protein for PROSITE matches text entry box by
right-clicking and opening a short-cut menu. From the task bar of the ScanProsite webpage,
select PROSITE. In the PROSITE: Database of Protein Families and Domains, scroll down to
the Tools for PROSITE section and paste the sequence into the text entry box by right-clicking
the mouse. Click the Quick Scan button. If the ExPASy server is not too busy, you will receive
the response in 2-5 seconds.
Searches are performed in PROSITE for biologically significant protein patterns and profiles for
known protein families and domains. When the search is complete, the results are displayed on
the ScanProsite webpage. Scroll the page to review the pattern matches listed in their numerical
111
Vector NTI Advance 10 User’s Manual
and graphical form. For details, click on the site ID links, such as PDOC00001 for the glycosylation site, opened and illustrated in Figure 13.7.
Figure 13.7 Site ID link for PDOC00001 (glycosylation site)
6. Saving Search Results as Comments
Vector NTI allows you to associate any text data with database objects in the form of comments.
Let’s save the search results to the database for future reference.
Select the resulting hits, starting with hit [1], by dragging the mouse across and down the page.
Do not include the sequence, which is already stored in the Vector NTI database.
Choose Edit > Copy or press CTRL-C to copy results to the Clipboard Return to Database
Explorer, and with 41_BB HUMAN still selected in the Database Explorer window, select Protein > Edit from the Explorer’s menu bar.
In the tabbed Edit dialog box that opens, you can edit various information associated with the
protein molecule (Figure 13.8). Click on the Comments tab, scroll to a point at the end of the
existing comment text and click to set the text cursor for insertion.
Figure 13.8 Edit dialog box, where you can edit information associated with the protein molecule
112
Tutorial: Internet Connectivity and Tools Chapter 13
Now press CTRL-V to paste the search results from the Clipboard.
Figure 13.9 Editing the resulting text
Edit the resulting text to your liking and click the OK button to save it to the database (Figure
13.9).
The search results are now saved in the database for later retrieval. To view the comments from
41_HUMAN’s Display window, double-click on the Comments line in the Text Pane of a Molecule Display window for 41_Human.
7. Close the Molecule Display Windows and Exit Vector NTI
You have now taken a first look at Vector NTI’s Tools for Internet connection. To close all display
windows, select File > Close; to exit the program, select File > Exit from the menu bar. If you
are not going to continue your work with the Internet, close the Internet browser and disconnect,
if necessary.
113
Vector NTI Advance 10 User’s Manual
114
C
H A P T E R
14
TUTORIAL: ALIGNX
Introduction
This chapter introduces you to operations of AlignX. The simultaneous alignment of many nucleotide or amino acid sequences is an essential tool in molecular biology. Multiple alignments are
used to find diagnostic patterns, characterize protein families, as well as to detect or demonstrate a similarity between new sequences and existing families of sequences. They are also
useful in predicting secondary and tertiary structures of new sequences, suggesting oligonucleotide primers for PCR and serving as an essential prelude to molecular evolutionary analysis.
At the end of this tutorial session, you will be able to:
z
Import molecules from other Vector NTI Advance applications into AlignX
z
Describe elements of the AlignX user interface
z
Create an alignment, and add molecules to an alignment
z
Modify alignment graphics and sequence
z
Edit an alignment
z
Create and interpret an AlignX Dot Matrix
z
Export molecules from AlignX into other Vector NTI applications
Follow the steps of the tutorial in the order shown. Figures show what your screen should look
like at various points along the way.
1. Launch AlignX from the Database Explorer
Using techniques you learned in previous tutorials, open the Vector NTI Database Explorer.
Now open AlignX from the Start menu by selecting Start > Program > Invitrogen > Vector NTI
Suite 10 > AlignX. Alternatively, you can open AlignX from the Database Explorer by selecting
Align > AlignX - Open New Alignment Window. In the Database Explorer, activate the Protein
table by selecting Table > Protein Molecules and select the Protein Molecules (MAIN) subset.
In the Database Objects List Pane, scroll to the molecules 5HIA for human, rat, and mouse.
115
Vector NTI Advance 10 User’s Manual
Click the cursor to the right of the bottom of the last of the three proteins, and drag a box around
all three molecules. This is a new way to select a group of objects in a subset list (Figure 14.1).
Figure 14.1 Selecting a group of objects in a subset list
Now position the Database Explorer window and the AlignX window side by side, and click and
drag the selected molecules into the AlignX viewer.
Next, in the Database Explorer protein list, select the 41_BB Human molecule and drag it into
AlignX.
An alternative method is to select the molecules in Database Explorer and select Align >
AlignX – Align Selected Molecules.
2. Examine AlignX Display Window
When you open AlignX, even after bringing molecules in, three of the panes are empty. After
you initiate the alignment, the alignment results will appear in the empty panes.
In the Text Pane, select the 5H1A molecules. Click the Align button (
) or choose Align >
Align Selected Sequences from the drop-down menu, initiating the alignment that now
appears in the display window.
Figure 14.2 AlignX Display window
116
Tutorial: AlignX Chapter 14
The AlignX Display window consists of a menu bar, three toolbars and context menus specific
for each pane (Figure 14.2). The AlignX Display window includes the Text Pane, the Guide Tree
Pane (still empty), the Analysis Pane and the Alignment Pane. The panes are divided by split
bars that can be moved to resize the panes.
Note:
Most toolbar buttons have associated tool tips that explain the button function. Hover the cursor
over the button to display the tool tip for that button.
As in the other Vector NTI Advance applications, to apply a command from the main menu in a
given pane (Print, Print Preview, Camera), that pane must be active. The active pane can be
toggled with the Switch Panes (
,
,
,
) buttons in the Pane Selection Toolbar or by
clicking anywhere in the pane you want to activate.
In the Text Pane, double click on a molecule folder to open and review it. Move the split bar at
the bottom of the pane and open some of the subfolders. A Text Pane folder and its subfolders
contain a thorough description of the molecule. Data includes molecule type and form, userdefined fields (from Vector NTI) and standard fields (such as GenBank), comments, references
and so forth.
The default Analysis Pane contains three graphical representations of alignment results. Move
the lower split bar and the split bars between the graphs and/or use the scroll bar to better view
them.
z
The first graph displays the alignment quality profile (Similarity). The specific values (in a
0-1 range) are assigned to each residue at a given alignment position in each aligned
sequenced depending on whether the residue is identical, similar or weakly similar to the
corresponding residue of the consensus sequence. The values for each residue at a
given position are added together and the number of the sequences in the alignment
normalizes the resulting value. The default values are 1, 0.5 and 0.2 for identical, similar
and weakly similar residues respectively.
z
The second graph displays the statistical significance profile (Absolute Complexity) of an
alignment. It is calculated as a sum of all pairwise residue substitution scores at a given
alignment position normalized by the number of pairs in the alignment. The scores are
taken from the residue substitution matrix used for alignment calculation.
z
The third graph displays the statistical significance (Absolute Complexity) of an alignment for a selected molecule to the consensus sequence. The graph is calculated in a
manner identical to the one in the second graph.
The Alignment Pane is described in step 4.
You can add additional analyses to the graphics pane by activating the Graphics Pane and
choosing View > List of Analyses from the drop down menu to open the Analysis List setup
dialog box (Figure 14.3):
Figure 14.3 Protein Alignment Analysis List setup dialog box
117
Vector NTI Advance 10 User’s Manual
The dialog box lists all of the analyses available for DNA or Protein, depending on the type of
aligned molecules. Currently displayed analyses are listed in the Selected Analyses box. To add
an analysis, select it in the Available Analyses list box and click the Add Analysis button (
)
to move it to the Selected Analyses list. Alternately, you can move an analysis to the lower list
by double clicking on it.
The plot display order is determined by the order the analyses are listed in the Analysis List
setup box. To modify the order, select an analysis and move it up by clicking the Move Up button
(
). Click OK to close the Analysis list setup dialog box and generate the new analyses.
3. Add Molecule to Alignment
To add a molecule to your alignment, select the 41_BB Human molecule in the Text Pane and
click the Add to Alignment button (
). You can add as many molecules as you like to the
alignment as long as they are listed in the Text Pane.
4. Inspect the Guide Tree
Note that now the Guide Tree Pane shows in its specific pane (Figure 14.4). Phylogenetic analysis is the means of studying presumed evolutionary relationships. An inferred evolutionary history is displayed in a treelike diagram suggesting the inherited relationships between the
molecules. In Vector NTI, a guide tree is only calculated when there are more than 3 molecules
in the alignment.
Figure 14.4 Guide Tree Pane
The guide tree, which resembles a phylogenetic tree, is built using the Neighbor Joining method
(NJ) of Saitou and Nei. The NJ method works on a matrix of distances between all pairs of
sequence to be analyzed. These distances are related to the degree of divergence between the
sequences. The guide tree is calculated after the sequences are aligned. AlignX displays the
calculated distance values in parenthesis following the molecule name.
5. Review the Alignment Parameters and Matrix
Click the Alignment Setup button (
) on the Viewer Toolbar to see how you can adjust different parameters for the alignment. Select each of the tabs in the dialog box to quickly review the
settings. Leave the last tab, Score Matrix selected.
All algorithms designed to evaluate pairwise sequence alignment are based on systems that
assign scores to aligned residues, detecting similarities between differing sequences. This page
displays the matrix, blosum 62mt2, used to generate your multiple alignment. Amino acids that
are identical or similar in alignment score higher than those less similar. The most common of
many different scoring systems are based on substitutions of amino acids in related proteins.
118
Tutorial: AlignX Chapter 14
BLOSUM matrices are calculated from local, ungapped alignments of distantly related
sequences. The matrix scores represent the minimum percent identity of the blocks used to
construct the matrix; greater numbers represent lesser distances.
In Vector NTI, you can modify matrices using the Matrix Editor. Customized matrices can also
be devised and stored in the database for shared or private use.
Leave the settings unchanged. It is a good idea when performing the various analyses in Vector
NTI applications to run them first using the default settings. Review the results, then change the
parameters as you like before running the analyses again.
6. Examine the Alignment Pane
Now move the split bars up to optimizing viewing of the Alignment Pane. Sequences of all the
molecules included in the alignment are displayed here, with their names listed at the left of the
corresponding sequence. Residues in the alignment are colored according to the following
scheme:
Alignment Color
Interpretation
black on window default
color
non-similar residues
blue on cyan
consensus residue derived from a block of similar residues at a given position
black on green
consensus residue derived from the occurrence of
greater than 50% of a single residue at a given position
red on yellow
consensus residue derived from a completely conserved residue at a given position
green on window default
color
residue weakly similar to consensus residue at given
position
Table 14.1 Alignment color scheme
Move the horizontal scroll bar at the bottom of the Alignment Pane. Drag the mouse across
some of the sequence, selecting it. Note that the corresponding region is selected in the Analysis Pane as you do so.
The sequence names remain stationary at the left of the Alignment Pane no matter how the
sequences are repositioned horizontally. If the list of molecules listed in the Alignment Pane is
longer than the size of the pane, a vertical scroll bar appears as well. Vertical scrolling affects
both sequences and their names but the consensus sequence remains visible at the bottom of
the pane.
119
Vector NTI Advance 10 User’s Manual
7. Edit the Alignment
After inspecting the alignment, click the Edit Alignment button (
) on the Viewer Toolbar to
open the Alignment Editor dialog box (Figure 14.5). This dialog box displays rows of selected
molecule names and sequences.
Figure 14.5 Alignment Editor dialog box, which displays rows of selected molecule names and sequences
Scroll the sequences to find the 3’ end of the 41_BB Human molecule. Click and drag to select
EEEGGCEL. Note that as you do so, two of the Move Selected Block buttons in the bottom of
the dialog box become enabled. The Move Selected Block text box indicates the number of
positions at a time to move, and defaults to one. Click the (
) button, which moves the
selected block one space to the right, as indicated in the Move Selected Block text box. (The
(
) button would move the block to the extreme right of the gap.) Because editing an alignment can only occur when selected residue(s) are shifted into an adjacent gap, the arrows are
only enabled when the selection block is next to a gap into which the selection may be shifted.
8. Generate Dot Matrix Plot
To perform a Dot Matrix analysis, select open a Dot Matrix window by clicking the Dot Matrix
(
) button on the main toolbar. A Dot Matrix window opens in a separate modal popup window (Figure 14.6). In the drop-down menu at the top of the screen, select 5H1A HUMAN (the
first selected molecule in the AlignX window.) In the second drop-down menu, select, 5H1A
mouse, launching the Dot Matrix.
Figure 14.6 Dot Matrix analysis
120
Tutorial: AlignX Chapter 14
The Dot Matrix analysis is primarily a method for finding all possible matches of residues
between two sequences. One sequence (A) is listed across the top of a page and the other
sequence (B) is listed down the left side.
The graphical representation of a Dot Matrix is a dashed rectangle in which any region of similar
sequence is revealed by a diagonal row of dots. The molecule selected first corresponds to the
horizontal axis, its name being shown in the right top corner of the Dot Matrix rectangle. The
second molecule corresponds to the vertical axis. Each axis has its own scale that initially displays the sequence positions.
When the Dot Matrix is first calculated, it is shown as a representation of the full length of a molecule. Because it is difficult to analyze specific molecule regions when several thousand residues are represented, click and hold the left mouse button within the Dot Matrix rectangle while
dragging the mouse, displaying the tracking dotted rectangle (Figure 14.7).
Figure 14.7 Selected region of the Dot Matrix
When the mouse button is released, the selected region is enlarged to the entire Dot Matrix rectangle (Figure 14.8).
Figure 14.8 Enlarged region of the Dot Matrix
Click Undo Zoom (
) to return to the previous screen. Close the Dot Matrix window.
121
Vector NTI Advance 10 User’s Manual
9. Export Alignment Molecules
AlignX is fully integrated with other components of Vector NTI Advance. As an example of
exporting a molecule from AlignX into other applications, select the molecule 5H1A_HUMAN in
the Text Pane and select Analyses > Back Translation. In the Sequence Data dialog box,
enter the Range (Whole Sequence or Selection Only). Click OK. The display window that opens
displays the original amino acid sequence in the upper pane, and the back translated sequence
in the lower pane. In Figure 14.9, that sequence displayed is the “most ambiguous” as shown by
the scale above the sequence.
Figure 14.9 Back translated sequence
Drag the scale button to the right, noting how the translation code is modified as you proceed.
Uncheck the “3 letters in translation” box at the bottom, changing the amino acid code to 1-letter
representation. Exit the Back Translation mode. (For more information on the Back Translation
function, see page 297.)
Now select Analyses > BioAnnotator >Analyze Selected Molecule. The BioAnnotator display
window opens, displaying physiochemical characteristics of the 5H1A_HUMAN protein. BioAnnotator will be discussed in the next tutorial. Close the BioAnnotator window.
10. Copy and Print an AlignX Pane
The Copy and Print features work the same in AlignX as in the other Vector NTI components. To
copy the contents of a pane and paste them exactly as they appear in AlignX, activate the pane
and click the Camera button (
word processing document.
). Paste the copied material in any other application, such as a
Print pane contents in the usual manner, by pressing the Print button (
).
11. Save the Project and Close AlignX
You can save your project if you choose by selecting Project > Save As and selecting your
project destination in the Save As dialog box. The next time you open Align X, the last several
opened projects are listed under the Project menu option. Selecting a project from that list
opens it.
122
Tutorial: AlignX Chapter 14
Close AlignX in the same way you close other applications of Vector NTI: select Project > Exit.
This ends your tutorial session with AlignX.
123
Vector NTI Advance 10 User’s Manual
124
C
H A P T E R
15
TUTORIAL: BIOANNOTATOR
Introduction
This chapter introduces you to the Vector NTI Advance application, BioAnnotator. BioAnnotator
performs certain types of DNA and protein sequence analyses and displays the results as linear
graphics. This allows you to visualize the physiochemical characteristics of a molecule, which
may be useful for inferring the potential structure/function of molecule regions.
At the end of this tutorial session, you will be able to:
z
Launch BioAnnotator for a molecule you create by translating DNA in Vector NTI.
z
Examine and modify plot properties
z
Modify plot layout
z
Format sequence text
z
Add new analyses to the display window
Follow the steps in the order shown. Figures show what your screen should look like at various
points along the way.
1. In Vector NTI, Open a Molecule Display Window for pSV2-dhfr; Create a New Protein by Translating a CDS
For the first part of this tutorial, you will create a new protein in Vector NTI by translating a coding DNA sequence (CDS) found by using the ORF tool in a Molecule Display window. When you
create the new protein, a new Molecule Display window opens from which you will then launch
BioAnnotator. BioAnnotator can also be launched from Database Explorer or from the Start
menu by selecting Start > Programs > Invitrogen > Vector NTI Suite 10 > Bioannotator.
Using techniques you learned in previous tutorials, in Vector NTI open a display window for
pSV2-dhfr. To launch the ORF Setup dialog box, select Analyses > ORF or choose View > Display Setup, check the ORF box and click the ORF Setup button. Review the ORF settings in
the ORF Setup dialog box and leave them as they appear. Click OK.
125
Vector NTI Advance 10 User’s Manual
The ORF tool finds all open reading frames on the molecule according to the parameters set in
the ORF Setup dialog box. ORFs are displayed in the graphics pane represented by arrows that
indicate whether the ORF is found on the direct or complementary strand of the DNA/RNA molecule’s sequence. ORFs on the direct strand point clockwise; ORFs on the complementary
strand point counter-clockwise.
Click on the arrow for the ORF that corresponds to the functional signal for the gene entitled
“DHFR” (dihydrofolate reductase). The amino acid sequence translation from the selected ORF
will form the basis for the new molecule.
Figure 15.1 Black arrows represent ORFs, which correspond to specific regions on the sequence
Translate the ORF DNA to protein by selecting File > Create New Sequence > Using Translation Procedure (Protein) > Direct Strand. A New Protein Molecule dialog box opens with a
default name of Translation of pSV2-dhfr for the new molecule. Change the name to DHFR
and click OK. A new Molecule Display window for the new protein opens.
2. Launch BioAnnotator from a Vector NTI Molecule Display Window
In the new Molecule Display window, select Analyses > BioAnnotator > Analyze Selected
Molecule. BioAnnotator opens featuring the new protein (Figure 15.2). If you had selected BioAnnotator > Open New Analyzer Window, BioAnnotator would have opened with empty
panes, waiting for you to create a new project. Maximize the window by clicking the Maximize
button (
).
Figure 15.2 BioAnnotator with the new protein
126
Tutorial: Bioannotator Chapter 15
3. Review the BioAnnotator Display Window
The BioAnnotator interface is similar to those of other Vector NTI Advance applications: it consists of a menu bar, three toolbars that are context sensitive, a Text Pane, a Plot Pane, and
Sequence Pane. Maximize the Display window and arrange its panes conveniently, using the
split bars and scroll bars as you have in other tutorials.
The Pane selection buttons (
Note:
), (
), and (
) are for quick navigation between panes.
Most toolbar buttons have associated tool tips that explain the button function. Hover the cursor
over the button to display the tool tip for that button.
In the Text Pane, open each of the folders with a double-click and review them. They contain
descriptions of the molecule being analyzed in BioAnnotator. You’ll note that dihydrofolate
reductase is a small protein, 188 amino acids. The General Description folder verifies that the
molecule was translated from a fragment of pSV2-dhfr.
Click in the Plots Pane to activate it. The Plot Pane displays visual results of physiochemical
analyses as plots that you can manipulate as you have done with graphics in other display windows.
Activate the Sequence Pane by clicking on the Sequence Pane button (
). If the sequence is
long enough, you can navigate through the Sequence Pane by moving the vertical scroll bar. As
in other Vector NTI applications, the cursor position in the Sequence Pane is noted on a pop-up
label when the cursor is paused or on the Status Bar when you click in a certain position.
4. Examine and Modify Plot Properties
Click in the Plots Pane to activate it, then click on the Zoom In button (
) two times, enlarging
the plot. Move the horizontal split bar down to increase the Plots Pane viewing area. A plot’s
vertical axis shows the minimal and maximal values of analysis results; the horizontal axis displays either numerical positions in the sequence or residues, if the scale of the plot is enlarged
sufficiently.
To review properties of any plot, click on it, then click the Properties button (
), opening the
Properties dialog box. Open this dialog box for the hydrophobicity plot. The Analysis tab displays the specific reference for this analysis, and the hydrophobicity index at pH 3.4 for each
residue in the protein. Select the Datagram tab (Figure 15.3) and change the color to bright red.
Click OK.
Figure 15.3 Datagram tab of the Properties dialog box
127
Vector NTI Advance 10 User’s Manual
5. Modify Plot Layouts
Click the Edit Layout button (
) on the toolbar. Click on the Enable Overlapping button
(
). Now plots can now be repositioned anywhere in the pane, even being superimposed
upon each other. Left-click on the hydrophobicity plot and drag it on top of the hydrophilicity
graph (Figure 15.4). Note how, in this case, the two graphs almost perfectly complement each
other.
Figure 15.4 Hydrophobicity plot superimposed on top of the hydrophilicity graph
Drag the hydrophobicity plot back to its original position. Now move the cursor to one of the
small black selection boxes at the bottom of the plot, where it changes to a vertical two-headed
arrow. Drag the box down, modifying the plot height.
Turn off the Enable Overlapping option by clicking on the button again. With only the Edit Layout button still on, a plot can be moved, but dropped only in specific positions. Click and drag the
lower plot to the top of the pane. When the cursor shape changes from
is allowed. When the cursor shape changes to
now repositions itself in the lower position.
to
,a
new position
, the new position is invalid. The upper pane
Click the Edit Layout button again to turn off that mode.
Select a region of the sequence on the plot using the click + drag technique. Note that the same
region is selected in the Sequence Pane. Increase the scale of the selected region in the Plots
Pane by clicking the Zoom to Selection button (
). Note that now you can read the individual
residues in the Plot Pane. To discern the plot data for a specific residue, pause the cursor over
the residue position and read the popup label. Return to the original scale by clicking the Fit to
Window button (
).
6. Format the DHFR Sequence
Reposition the horizontal split bar so you can easily work in the Sequence Pane and activate the
pane. Sequence text can be formatted in much the same way as you would in a word processor.
128
Tutorial: Bioannotator Chapter 15
Select aa #131-140. Click on the Format button (
be familiar with. Click on the Bold (
) and Italics (
), enabling the text format buttons you may
) buttons (Figure 15.5).
Figure 15.5 Formatting the DHFR sequence
To reverse these actions, with the text still highlighted, click on the Bold and Italics buttons
again. You can even change text color if you wish.
7. Open a DNA Project in BioAnnotator
You have launched BioAnnotator from a Vector NTI window with a protein molecule you created
by translating DNA. Now let’s open a BioAnnotator project containing a DNA molecule from the
Vector NTI DNA/RNA database.
In the BioAnnotator window, select File > Open. Browse for the Demo Projects folder in the
Open dialog box. Open the DemoProjects folder and click on DNA (or DNA.apf, if your computer
is set to show file extensions). Click Open and BioAnnotator reads the file format and opens the
display window for the DNA molecule, ColE1. Use the split bars to enlarge and optimize the display of the Plot Pane.
8. Add New Analyses to BioAnnotator
Since a DNA molecule is now open in BioAnnotator, the displayed default analyses have
changed. Since an important part of configuring BioAnnotator is the selection of analyses to perform for a molecule, let’s add some analysis to those already displayed. Click the Analysis List
button (
) to open the Analysis List setup dialog box (Figure 15.6).
Figure 15.6 Analysis List setup dialog box
The dialog box lists all of the analyses available for the molecule type open in BioAnnotator
(DNA). Currently displayed analyses are listed in the Selected Analyses box. In the Available
129
Vector NTI Advance 10 User’s Manual
Analyses list box, select Melting Temperature (GC content). Click the Add Analysis button
(
) to move it to the Selected Analyses list. Using an alternative method, move Nucleic Acid
Distribution to the lower list by double clicking on it.
The plot display order is determined by the order the analyses are listed in the Analysis List
setup box. To modify the order, select Nucleic Acid Distribution and move up by clicking the
Move Up button (
). Click OK to generate the new analyses.
9. Copy, Paste, and Print BioAnnotator Panes
As in other applications of Vector NTI Advance, you can copy display window contents to the
Clipboard or to a file. Make sure the Plot Pane is active. Position the plots for the display you
would like to copy. Click the Camera button (
) and select All and Clipboard in the dialog
box that opens. Open a new word processing document and paste the Clipboard contents to it.
The Camera feature copies and pastes pane contents exactly as you have specified and
selected, even the colors in the copied pane.
The contents of any BioAnnotator pane can be printed the same as you do in other Vector NTI
Advance Applications, by clicking the Print button (
Preview button (
). To see a preview first, click the Print
).
10. Close the Display Window and Exit Vector NTI
Close BioAnnotator by selecting File > Close, File > Exit. You have finished your session with
Vector NTI. Close the Molecule Display window using the Close command in the File menu. Quit
Vector NTI by selecting File > Exit.
130
C
H A P T E R
16
TUTORIAL: CONTIGEXPRESS
Introduction
ContigExpress is a program for assembling DNA fragments into longer contiguous sequences
commonly called “contigs.”
Work done in ContigExpress is saved as a ContigExpress Project, a file with a .cep extension in
which you can store fragments, their assemblies, assembly options, and descriptions related to
your project. In ContigExpress, fragments can be edited directly, with the chromatograms in full
view. Changes are tracked and a history is maintained. The contigs thus generated can then be
saved, exported into other applications of Vector NTI Advance or exported to third-party tools
available on the Internet.
This tutorial can be completed in one session or divided into three sessions as noted. At the end
of this tutorial, you will be able to:
z
Create a ContigExpress project
z
Navigate and manipulate the CE Project Explorer window
z
Assemble contigs
z
Trim or edit fragments in the Fragment Viewer
z
View and edit fragments and contigs in the Contig Viewer
Follow the steps of the tutorial in the order shown. Figures show what your screen should look
like at various points along the way.
Session 1 Project Explorer
1. Open a ContigExpress Window
Launch ContigExpress (CE) from the Start menu by selecting Start > Programs > Invitrogen >
Vector NTI Advance 10 > ContigExpress. You can also launch ContigExpress from the
Assemble menu in most other Vector NTI Advance applications. ContigExpress opens with an
empty Project Explorer.
131
Vector NTI Advance 10 User’s Manual
2. Open a ContigExpress Project and Add a Fragment to the Project
To open the project, in the Project Explorer window, select Project > Open Project. Browse to
C:\Program Files\Invitrogen\Vector NTI Advance 10 (if a default installation has been performed). Open the Demo Projects folder and double-click on DemoProject.cep to open the
project in the Project Explorer window. The ContigExpress DemoProject contains 13 fragments,
listed in the List Pane of the Project Explorer (Figure 16.1):
Figure 16.1 Fragments listed in the List Pane of the Project Explorer
Many files saved from an automatic sequencer have an .abi, .ab1 or .esd extension. Add one
.abi format fragment to the list by selecting Project > Add Fragments > From ABI file…
This option opens the Import Sequence From dialog box (Figure 16.2). Select Rb.abi and Sample 1303.abi and click Open.
Figure 16.2 Import Sequence from dialog for browsing in one or more sequence files
Often the names of the imported fragments registered within the fragment file do not directly correspond to their Windows file name designations. ContigExpress can either assign Windows file
names or fragment names that are found inside the imported files to the newly imported fragments. Upon pressing the Open button, ContigExpress asks you to specify your naming preference (Figure 16.3):
132
Tutorial: ContigExpress Chapter 16
Figure 16.3 Indicate the naming preference of imported sequence files
If you choose No, ContigExpress imports the fragment, naming it according to the Windows file
name, Rb and Sample1303. For this example, however, choose Yes. The files Rb.abi and
Sample1303.abi are imported and named according to their internal file names and are therefore listed as “RB 1” and “xb-control” in the ContigExpress List Pane.
After you specify your naming convention preference, a dialog box appears, confirming the
number of fragments imported and time elapsed during import.
3. Examine the ContigExpress Project Explorer Window
As noted, ContigExpress opens to an empty Project Explorer window to which you added a list
of molecules. The window is similar to other Vector NTI Advance windows with a title bar, menu
bar and tool bar (Figure 16.4). The Tree Pane on the left and the List Pane on the right are
divided by a movable split bar. A Status Bar at the screen bottom displays the Project Explorer
status.
Note:
Most toolbar buttons have associated tool tips that explain the button function. Hover the cursor
over the button to display the tool tip for that button.
4. Create Contigs
Start Assembling
To start an assembly, select all the fragments except an arbitrary one, say, xb-control, by SHIFT
+ CLICK on all the names on the list except that one (Figure 16.4). Click the Assemble
Selected button (
). This button is enabled only when two or more fragments are selected.
Figure 16.4 Selecting fragments for assembly
133
Vector NTI Advance 10 User’s Manual
Note:
If you want to select all the sequences in the Project window for assembly, right click on the first
sequence in the list and choose Select All from the shortcut menu.
An Assembly Progress dialog box allows you to monitor the assembly process or cancel the
assembly at any time. After the assembly process is finished, a summary dialog box displays,
showing the elapsed assembly time, the number of contigs assembled, and number of fragments used.
Assembly Setup
More than likely you would want to control the assembly through fine-tuning the assembly
parameters, rather than relying on the default settings. To see what assembly parameters are
available for control, choose Assemble > Assembly Setup from the menu or choose the
Assembly Setup button on the toolbar (
). The Assembly Setup dialog box (Figure 16.5)
appears (more detailed information about Assembly Setup can be found in Chapter 30). For
now, proceed with the assembly you created using default values. Click Cancel on the Assembly Setup dialog and return to the Project Explorer.
Figure 16.5 The Assembly Setup dialogs
Examine Assembly Results
Once you have performed the contig assembly, the Tree Pane in ContigExpress Project
Explorer shows the new assembly, Assembly 1 (Figure 16.6).
An assembly can be made up of one or more contigs. Click on Assembly 1 to select it. All of the
project fragments and contigs are listed in the List Pane. Assembly 1 includes two assembled
contigs, with Contig 1 made from eleven fragments and Contig 2 composed of two. Unassembled fragments are shown below the contigs. Assembly 1 includes one unassembled fragment,
RB 1, that was selected for assembly, but did not assemble (indicated by the grey arrow icon to
134
Tutorial: ContigExpress Chapter 16
the left of its name) and one fragment, xb-control, which was not selected for assembly (Figure
16.6). Note that many of the fragments that are included in contigs underwent trimming at their
5’ or 3’ ends or both. This results from the operation of the assembly algorithm, although it can
be turned off if so desired (Figure 16.6).
Figure 16.6 Results of assembling the demo set using default parameters
Let's create another assembly, a “child” of Assembly 1. For this, hold down the Shift key and
click on fragments ONE17KANR and ONE9KANR, thus selecting seven fragments in Contig 1:
ONE17KANR, ONE13KANR, ONE15KANF, ONE10KANF, ONE11KANR, ONE16KANF, and
ONE9KANR (Figure 16.7). Click the Assemble Selected button as before.
Figure 16.7 Selecting fragments in contig 1 for a “child” assembly
Another assembly derived from Assembly 1 is listed in the Tree Pane (Figure 16.8). The numbering system (Assembly 1.1) describes its relationship to the parent contig. Note that Contig 2
has been inherited unchanged from the parent assembly, Assembly 1, into Assembly 1.1. Also
note that in Assembly 1.1, the four unselected fragments, ONE2KANR, ONE3KANR,
135
Vector NTI Advance 10 User’s Manual
ONE6KANR and TWO11KANR, are “released” to the pool of unselected fragments as indicated
by the icon.
Figure 16.8 “Child” Assembly 1.1, derived from fragments in Contig 1 from Assembly 1
5. Review and Modify Viewing Options
By default, the Project Explorer is configured to display five columns listing the identification
code of each fragment, their original lengths, current lengths, and 5’ and 3’ trims. Let’s modify
the viewing options to display more information for each fragment. Select View > Options to
open the Options dialog box (Figure 16.9):
Figure 16.9 Options dialog box
This dialog box, similar to those in other Vector NTI Advance applications, has three tabs. The
Details View tab controls the information displayed in the List Pane of Project Explorer. The
Status Bar tab controls the information displayed on the Status Bar for a selected item in the
136
Tutorial: ContigExpress Chapter 16
Project Explorer. The Copy Fragment/Contig tab controls the copy format for fragments and
contigs.
On the Details View tab, the top to bottom order of the Displayed Fields corresponds to the left
to right order of columns in the List Pane. In the Available Fields pane, select Non-ambiguous
Bases and click the >> button to add it to the list of displayed fields. In the Displayed Fields
pane, select Non-ambiguous Bases and click the Move Up button to move it to the top of the
list.
Click OK. Note that Non-ambiguous Bases and Length now appear as columns to the immediate right of the Name column in the Project Explorer List Pane (Figure 16.10):
Figure 16.10 Non-ambiguous bases field is added to the List Pane display
On the toolbar, the List Format group of buttons control the list display (Figure 16.11). Click each
of these buttons and observe how the information display of the Project Explorer changes.
Leave the Details button (
) selected.
Figure 16.11 List Format group of buttons
The next group of buttons allows you to filter data displayed in the List Pane (Figure 16.12):
Show other fragments
Show unassembled fragments
Expand configs
Show config
Figure 16.12 Filter Data group of buttons
137
Vector NTI Advance 10 User’s Manual
By default all 4 toggle buttons, or viewing filters, are selected, showing the maximum amount of
information. To see how they work, make sure that Assembly 1.1 in the Tree Pane is selected.
Note that no matter how you display the list, all elements are still identified by one of the following icons:
z
Contigs (
)
z
Fragments included in the assembly (
z
Fragment not included in the assembly (
z
Fragments not considered for the assembly (
)
)
)
Now click the Show Contigs button (
), turning it “off”. Contigs 2 and 3 and their fragments
are no longer displayed in the List Pane (Figure 16.13):
Figure 16.13 Hide contigs control leaves only non-assembled fragments in display
Click this button again to restore the original display, then click Expand Contigs button (
),
turning it “off”. Now the fragments included in Contigs 2 and 3 are not displayed (the contigs are
not “expanded”).
Click the Expand Contigs buttons again to restore the original display. Click each of the remaining two buttons, turning them off then on again in turn: the Show Unassembled Fragments
button (
) and the Show Other Fragments button (
). Note which fragments are excluded
and which included in each display. Finish with all filters enabled (all buttons pushed) as it was
in the original display.
You can use any combination of enabled and disabled data filters for list display.
138
Tutorial: ContigExpress Chapter 16
6. View Contents in the Tree and Content Panes
The default enabled viewing mode in the Tree Pane is called the History View. It shows the historical relationship between the assemblies in a tree form. For a view with a different perspective, click the Content View button (
).
Figure 16.14 Project Explorer in Content View
The Content View (Figure 16.14) does not display the mutual relationships of the assemblies,
but it does enable you to open each assembly from the Tree Pane, displaying each assembly’s
contents in the List Pane. Click the History View button (
to return to History View, which
displays assembly relationships (trees), but not their contents, in the Tree Pane.
7. Manage Fragment Lists and Project Items
ContigExpress can use the Windows clipboard for standard copy and paste operations. Most
operations are accessible through the Edit and shortcut menus, or dedicated toolbar buttons.
Select fragment xb-control and click the Copy button (
in the List Pane). Click the Paste button (
Pane.
) (enabled when anything is selected
) and Copy of xb-control appears in the List
Project Explorer allows you to change the names of the project items and delete them from the
project. Select the fragment Copy of xb-control and click the Rename button (
), enabling
the text box (Figure 16.15). In the text box, change the name to 123 and press ENTER, renaming
the fragment.
Figure 16.15 Activating fragment name text box for renaming
Select 123 and click the Delete from Project button (
). Confirm the action. Fragment 123 is
deleted from the project and the Explorer is reset to the upper level of the project (Fragments
(MAIN).
139
Vector NTI Advance 10 User’s Manual
Select Assembly 1.1 and fragment ONE4KANR in Contig 2 of this assembly. Click the Delete
from Project (
) button. ContigExpress warns you that the selected fragment is included in
several assemblies and deleting this fragment will delete those assemblies as well (Figure
16.16).
Figure 16.16 Deletion of a fragment will dismiss assemblies in which the fragment is in a contig
Click No, and the deletion will not continue. Had you clicked Yes, all assemblies would have
been deleted.
8. Save and Close a ContigExpress Project
Even though you may wish to continue the tutorial, save and close the project and then open it
again to become familiar with these functions.
To save the project, select Project > Save As. Name the project Tutorial Project and select the
Demo Projects folder as the destination.
To close your project, select Project > Close Project. ContigExpress reverts to its initial state,
with an empty workspace. You can either start a new project by importing the fragments or open
an existing project from the disk.
Exit ContigExpress as you would close any other Windows application.
Session 2 Working in Fragment Viewer
1. Open and Inspect the Fragment Viewer
Open the Project Explorer and select Project on the menu bar. The name of the project you
worked with last is shown in the used projects list at the bottom of the drop down menu. Select
Tutorial Project, opening it in Project Explorer. Select the upper level of the project (Fragments
(MAIN)) and in the List Pane, double-click the fragment ONE8KANR to open it in a Fragment
140
Tutorial: ContigExpress Chapter 16
Viewer (Figure 16.17). Maximize the window and arrange the panes conveniently by dragging
the split bars with the mouse.
Figure 16.17 ContigExpress Fragment Viewer
The Fragment Display window consists of a title bar, a menu bar, three toolbars (Main Toolbar,
Window Toolbar, and Pane Toolbar) and three panes: a Text Pane, a Sequence Pane and a
Chromatogram Pane. The panes are divided by movable split bars.
Note:
Most toolbar buttons have associated tool tips that explain the button function. Hover the cursor
over the button to display the tool tip for that button.
Text Pane
Click the Text Pane button (
) to activate it. The Text Pane lists properties of the fragment,
such as its name, general description, some record of the chromatogram data, and feature
annotations on the fragment, if any.
Click the + to the left of the General Description line to open and view the folder contents. Double click on the folder icon to close it.
141
Vector NTI Advance 10 User’s Manual
Sequence Pane
Click the Sequence Pane button (
) to activate it. By default, only one strand of the sequence
is shown. Click the Show Two Strands button (
) from the toolbar or View menu. Now both
strands of the sequence are displayed (Figure 16.18).
Figure 16.18 Double- stranded sequence display
Scroll to the end of the sequence. Note that 2 bases (CA) were dropped down from their original
row, and replaced by down-pointing arrows. This is a result of clipping (default - on) performed
by the assembly process. Activate the Chromatogram Pane and scroll to the far right to see how
the clipped bases are represented in the chromatogram. Return to the Sequence Pane by clicking it.
To modify the number of sequence blocks displayed per line, click the Lane Width button (
)
and enter 15 in the Blocks per Line field of the Set New Number of Blocks dialog box. Click OK
and the number of blocks per line increases as directed (Figure 16.19).
Figure 16.19 Sequence Pane displayed as 15 blocks (5 bases each) per line
The same control is available via the View > Grouping > Set Number of Blocks menu.
Change the blocks display back to 10.
142
Tutorial: ContigExpress Chapter 16
Chromatogram Pane
Click the Chromatogram Pane
button to activate the pane (Figure 16.20). The vertical
scroll lever on the left side of the Chromatogram Pane can be used to resize chromatogram
peak height.
Figure 16.20 Fragment Viewer Chromatogram Pane
Individual base traces can be displayed or removed by clicking the corresponding Show Trace
toggle buttons (
) on the toolbar or by choosing View > Show Traces for the particular base
you want to show or hide. For example, to hide the chromatogram trace for Ts only, make sure
that the Show Trace -T button is not pressed, but that the Show Trace A, C and G buttons are
pressed. Press each button to see the effect on the Chromatogram Pane.
2. Sequence Selection Techniques
In ContigExpress, positioning the cursor in the Sequence Pane transforms it into a short, vertical, blinking I-beam called a caret ( ). When a sequence is selected and highlighted, one end
(the “active” end) is marked with a caret. The current position of the caret is always shown in the
Position Box on the status bar (Figure 16.21):
Position box
Selection box
Figure 16.21 Details of status bar on Fragment Viewer
143
Vector NTI Advance 10 User’s Manual
Click the position box to open a Set Caret Position dialog box that can be used to position the
caret anywhere in the sequence. Enter the nucleotide position number and click OK.
For setting a selection range, click on the Selection box on the Status Bar, opening the Set
Selection dialog box. Set the selection from 10 bp to 30 bp and press OK.
The selection is simultaneously highlighted in the Sequence and Chromatogram Panes and
shown in the Selection Box on the status bar (Figure 16.22) .
Figure 16.22 Highlighted selection in the Sequence and Chromatogram Panes
To modify the 5’ and 3’ ends with the mouse:
z
Click the 5’ end of the selection, moving the caret [note its change to a 5’ mark (
)] to
that position and activating the 5’ end. CLICK + DRAG the 5’ end to a position near the
start of the molecule. Observe the selection box as you drag. The caret remains with the
end of selection you are dragging.
z
The end of the selection marked with the caret can also be moved with arrow keys on
the keyboard. Hold the SHIFT + the left or right arrow keys to move the 5’ end of
selection one nucleotide at a time. (If you hold down CTRL + SHIFT + use the arrow
keys, the selection is changed 5 nucleotides at a time.) When the 5’ end is placed on the
start of the molecule (1 bp), release the SHIFT key.
z
To set a selection with the mouse, click anywhere inside the sequence and drag the
caret with the mouse, releasing when the selection is complete.
Note that the selected fragment is also displayed concurrently in the Chromatogram Pane. This
occurs no matter where the selection was made.
3. Display ORFs and Translate the Nucleotide Sequence
Display ORFs for the Sequence
In the Fragment Viewer Sequence Pane choose Show ORFs from the View menu or click the
Show ORFs button (
) on the toolbar. ORFs are displayed for the direct and complementary
strands (Figure 16.23). If single-stranded sequence is displayed, only the ORFs for that strand
144
Tutorial: ContigExpress Chapter 16
are shown. ORF finding criteria (e.g. minimum length, inclusion/exclusion of stop codon, etc.)
can be adjusted via the View Options dialog ORF tab from the View menu or toolbar button
(
).
Figure 16.23 ORF display in Sequence Pane
Translate the Nucleotide Sequence
Select the region from 127 to 138 bp. The Chromatogram Pane has also made the corresponding selection and has scrolled its graph to the selection. Click the Translate Selection button
(
) on the View menu or toolbar. ContigExpress shows the amino acid abbreviations above
the selected sequence (Figure 16.24).
Figure 16.24 Direct strand translation of a selection in Sequence Pane
145
Vector NTI Advance 10 User’s Manual
To translate the complementary strand of the selection, click theTranslate Complementary button (
) on the menu or toolbar. If the sequence is displayed as single-stranded, the pane
automatically switches to two-strand mode to show the complementary translation below the
selection (Figure 16.25):
Figure 16.25 Two-strand translation of a selection in Sequence Pane
To toggle between 1 and 3 letter codes in the translations click the Show 1-letter AA codes button (
) on the View menu or toolbar.
To delete all translations, click the Clear All Translation button (
on the View menu or tool-
bar. Click the Show Two Strands button (
) to return to 1-strand display. Notice that when
you return to single-strand sequence display, the ORF display changes to direct ORFs only.
Click on the Show ORFs button (
) to remove the ORFs display.
4. Edit the Nucleotide Sequence in the Sequence Pane
You may freely edit a fragment in the Fragment Viewer only if it is not part of a contig. A fragment that is part of a contig, as ONE8KANR currently is, opens in Read-only mode. To edit such
a fragment, you must open the contig in a Contig Viewer and edit the fragment there. (Any edits
made there will be saved to the fragment.) Otherwise, you must dissolve the contig before you
open and edit a fragment contained in it.
In Project Explorer, select Contig 1 from Assembly 1 and select Dissolve Contig from the shortcut menu. This discards Contig 1 and frees up member fragments for editing; repeat on Contig 3
of Assembly 1.1. Double-click the fragment, ONE17KANR to open it in Fragment Viewer. Fragment ONE8KANR remains in Read-Only mode and Contig 2 is unaffected, since they are not
descended from the dissolved contig.
146
Tutorial: ContigExpress Chapter 16
You will learn three ways to edit the fragment sequence. All are illustrated in the same screen
shot, Figure 16.26.
Figure 16.26 Editing a sequence in the Fragment Viewer
1. Nucleotide Deletion In the Sequence Pane, select nucleotides 316 through 319. Press the
Delete key on your keyboard. The selected symbols move under the row, with downward
pointing arrows (↓) taking their place.
2. Now move your attention to the Chromatogram Pane. There is a sequence above and one
below the graph. Before we started editing, they were identical. The sequence above the
graph reflects all your editing commands, the sequence below always remains in its original
form, thus giving you a useful reference to track and compare your changes. Note that the
deletion resulted in each deleted nucleotide being replaced by a dash (-) in this sequence.
3. Nucleotide Insertion Back in the Sequence Pane, move the caret in the Sequence Pane to
position 307 and type TTT. Three Ts with upward pointing arrows (↑) below them are
inserted at the caret position.
4. In this case, the arrows indicate that symbols were inserted in a sequence (“added to” the
sequence) into a position, not substituted for other nucleotides. The sequence above the
graph in the Chromatogram Pane also shows the insertion (in another color). Note that a
gap appeared in the graph because there is no data to build chromatograms for newly
inserted symbols.
5. Nucleotide Substitution Select nucleotide 303 and type G. The selected base is replaced by
G, and A is shown below G to help you track the change. The chromatogram does not
change because the G was not inserted; it just replaces the original base call. You can only
replace the bases one by one.
By default, peaks for deleted bases are still shown in the chromatogram. One important consequence is that although bases have been deleted, they are still considered part of the sequence
during translation. Deleted peaks can be removed using the Show Deleted Peaks feature,
allowing translation in the new/resulting reading frame. Press the Show Deleted Peaks (
)
button or choose View > Show Deleted Peaks to turn off the Show Deleted Peaks function.
When a message appears indicating the fragment will switch to read only mode, choose Yes.
Make a selection across the area where you have edited bases from 301 to 375 bp and trans-
147
Vector NTI Advance 10 User’s Manual
late the sequence using techniques previously described. Notice the translation considers the
deletions in the sequence and proceeds according to the new frame (Figure 16.27).
Figure 16.27 Translation reading frame ignores the 4 deleted bases
Click the Show Deleted Peaks button (
) again to reactivate the function. Notice the translation now includes the 4 deleted peaks, as if no deletions have been made (Figure 16.28). Consequently, the downstream translation is changed.
Figure 16.28 Translation reading frame includes the 4 deleted bases.
Erase your translation using techniques described earlier. You can use the Undo and Redo
commands to reverse or restore your editing actions. Click the Undo (
) Main toolbar button
several times, and watch your earlier edits disappear. Eventually it becomes disabled and both
Sequence and Chromatogram panes return to their original sequences.
148
Tutorial: ContigExpress Chapter 16
5. Edit a Sequence in the Chromatogram Pane
Activate the Chromatogram Pane by clicking the Chromatogram Pane (
) Toolbar button.
In the top, editable sequence in the Chromatogram Pane, select “T” at bp 11 and type C. As in
the Sequence Pane, T is replaced by C. Note that each of these actions is simultaneously
reflected in the Sequence Pane.
Play with editing in both panes to become familiar with all features, but do not be afraid to edit
too much. You can restore the original sequence by selecting Fragment > Revert to Saved.
Note that all editing operations are reflected in both the Sequence and Chromatogram Panes.
They can be summarized as follows (NTs = nucleotides):
Action
Delete
Insert
How to Perform
Sequence Pane Result
Chromatogram Pane
Result
Select
Replaces NT with (↓);
(- - - -) Appear in
residues;
original NT moves
upper, editable
press Delete
below strand
sequence
Place caret;
(↑) appears below new
A break appears in
type new NTs
NTs; new NTs are
the chromatogram
colored
Replace
Select existing
New NT appear in
New NT appears in
NTs and type
sequence; replaced
upper sequence; no
new NTs one
NTs moved below
break or change in
by one
strand
chromatogram
Table 16.1 Editing operations for Sequence and Chromatogram Panes
6. Close the Fragment Viewer
Select Fragment > Close or click the close box to close the Fragment Viewer. If asked, confirm
the operation.
7. Exit ContigExpress
Close ContigExpress by selecting Project > Close Project. When asked whether to save the
changes, click No so you can continue to use the project with the assemblies and contigs created (and dismissed during this session) in the first part of this tutorial.
Session 3 Working in the Contig Viewer
When you are in a ContigExpress project, selecting and opening a fragment brings up Fragment
Viewer. Selecting and opening a contig opens a Contig Viewer.
1. Open and Examine a Contig Viewer
Re-open ContigExpress as you have done before. Load the Tutorial Project that you created in
Session 1 by selecting Project > Tutorial Project.cep. In the Project Explorer window, select
Assembly 1 and double-click on Contig 1 in the List Pane, opening the Contig Viewer (Figure
16.29). Maximize the window.
149
Vector NTI Advance 10 User’s Manual
Contig Viewer has many elements similar to the Fragment Viewer: a title bar, three toolbars and
three panes: a Text Pane, a Graphics Pane and an Alignment Pane. Arrange the panes conveniently by dragging the split bars with a mouse. A Status Bar at the screen bottom displays the
Project Explorer status.
Note:
Most toolbar buttons have associated tool tips that explain the button function. Hover the cursor
over the button to display the tool tip for that button.
Figure 16.29 ContigExpress Contig Viewer
Text Pane
To activate the Text Pane, click on the Text Pane button (
). The Text Pane is similar to other
Text Panes with its folders containing various properties of the fragment.
Open the Fragments Folder and select fragment ONE11KANR. When you click on it, this fragment is located in the remaining two panes: in the Graphics Pane it is highlighted in blue, and in
the Alignment Pane, its name is highlighted (Figure 16.30).
Figure 16.30 Fragment selection in Contig Viewer is synchronized in all 3 panes
150
Tutorial: ContigExpress Chapter 16
It is possible to perform additional assemblies from the Text Pane without returning to the
Project Explorer. Assemble Selected Fragments becomes accessible from the Assemble
menu or a toolbar button (
)when two or more sequences are selected. The Assemble Not
Selected (
) button (toolbar only) becomes available when there are at least two unselected
sequences and one selected sequence in the Text Pane. The Assemble Not Selected command is similar to Assemble Selected Fragments, except that it excludes the selected fragment(s) when attempting to assemble a Contig.
When either of these commands is executed, the new assembly is performed and added to the
project as a child assembly of the assembly that the current Contig is a part of. For example, if
the Contig is part of Assembly 1, the new assembly will be called Assembly 1.1.
Graphics Pane
Click the Contig Graph button (
) in the Window toolbar to activate the Graphics Pane.
By default, the data in this pane is drawn in Fit to screen mode. The Graphics Pane contains
horizontal arrows representing the relative positions of the fragments forming the contig. The
arrowheads indicate the direct or complementary placement in the contig of the respective fragment.
Below the fragment arrows are a Coverage Map and a scale, or Weight Graph, with position
markers for this contig. The Coverage Map summarizes the depth of coverage and directionality
of the fragments. The Weight Graph displays the quality of the assembly. Click the Zoom In button until a horizontal scroll bar appears below the weight graph and position markers are shown
every 50 bases . Move the scroll bar on the Weight Graph so that you can view the region at
about position 1235. Note the green vertical line there. Position the cursor at that site and click
the Zoom In button (
) several times to enlarge the graph. You may need to scroll the horizontal scroll bar to keep the site you marked in view as you enlarge the area. When the maximal
zoom is reached, the Zoom In button becomes disabled.
Figure 16.31 Using the Weight Graph to identify positions of poor consensus
The negative peak in the Weight Graph line (Figure 16.31) indicates a position where the consensus is poor. In the Alignment Pane, look at the symbols at the same position. The nucleotide
at bp 1235 appears to be unresolved. Instead of having to thoroughly examine all nucleotides
151
Vector NTI Advance 10 User’s Manual
sequences throughout the contig, you can see the “bad” points with just one glance at the
Weight Graph.
For details regarding the weight calculation, refer to Chapter 31.
Click Fit to Screen from the View or shortcut menu, or toolbar button (
dard sizing.
) to return to the stan-
You can make selections in the Contig Viewer using techniques you have already learned.
Select nucleotides from 2000 to 2077 bp by dragging the mouse on the Graphics Pane. Note
that the selection is concurrently scrolled to in the Alignment pane, with blue vertical lines at the
start and end coordinates of this selection (Figure 16.32).
Figure 16.32 Sequence selection in the Contig Viewer
ORFs can be displayed in the Graphics Pane of the Contig Viewer by activating the Graphics
Pane and either choosing View > Show ORFs from the menu or clicking the Show ORFs button (
) on the toolbar. Click the Show ORFs button. The ORFs display area appears below
the fragment display in the Graphics Pane (Figure 16.33). Green bars in the ORFs display area
represent individual ORFs. Click on a green bar to highlight the ORF in the Graphics Pane. The
152
Tutorial: ContigExpress Chapter 16
selected ORF is also scrolled to in the Sequence Pane; note the blue vertical line at the end
coordinate of this selection.
Figure 16.33 Display and selection of an ORF in the Contig Viewer
Gaps that appear in the contig consensus are ignored during ORF calculation, i.e., they are
skipped over. Additional parameters for the ORFs search can be configured in the Contig View
Options dialog box. Choose View > View Options from the menu in the Contig Viewer or click
the Viewing Options button (
) on the toolbar to launch the dialog box. Select the ORF tab
on the Contig View Options dialog box (Figure 16.34).
Figure 16.34 Configurable ORF parameters for Contig Viewer
Acceptable start and stop codons can be designated here. Minimum ORF size for the search
can also be set, as well as the option to show nested ORFs. Close the Contig View Options dia-
153
Vector NTI Advance 10 User’s Manual
log box by clicking on the Cancel button. Click the Show ORFs button to remove the ORFs
from the Graphics Pane display.
Activate the Graphics Pane and choose View > Show Contig Coverage from the menu or click
the Show Contig Coverage button (
). The graphical representation of how the assembled
fragments cover Contig 1 is removed from the Graphics Pane. Click the Show Contig Coverage button again to return the graphic to the display.
2. Review the Contig in Contig Alignment Pane
Click the Alignment button (
) in the Toolbar to activate the Contig Alignment Pane (Figure
16.35). The Alignment Pane displays the nucleotide sequences of the contig consensus as well
as those of the fragments forming the contig and their positions. In the standard configuration of
this Viewer, positions/columns in the consensus where the fragments do not completely agree
are highlighted in yellow. The particular bases at such positions that disagree with the consensus appear in red.
Figure 16.35 Contig Viewer – Alignment Pane with ambiguous positions highlighted
154
Tutorial: ContigExpress Chapter 16
Let’s study the elements of the Alignment Pane (Figure 16.36):
FRAGMENT CURRENT POSITION
FRAGMENT NAME LIST
FRAGMENT SEQUENCES
SCALE
CONSENSUS SEQUENCE
(SYMBOL FORMAT)
CONSENSUS SEQUENCE
(NUCLEOTIDE FORMAT)
Figure 16.36 Elements of the Alignment Pane
z
The fragments name list on the left contains all fragments used in this contig. Reorder
fragments in this list by selecting and dragging vertically.
z
The scale gives a reference for all fragments and the consensus shown in the alignment.
z
The fragment current position is the relative (counted from the fragment start) position
of the currently shown left end of the respective fragment.
z
The fragment sequences, with the option of showing chromatograms, if available.
Some fragment ends were clipped as part of the assembly process; hovering the mouse
alongside such a fragment end will display the trimmed sequence in a tooltip.
z
The consensus sequence (nucleotide format) shows the nucleotide consensus for
the assembly.
z
The consensus sequence (symbol format) shows the symbol consensus for the
assembly. In the symbol consensus, blank spaces indicate identical residues, dots (•)
indicate positions with an IUPAC ambiguity symbol in a fragment, and plus symbols (+)
indicate ambiguous positions containing specific base disagreements and/or gaps. The
two consensus sequence tracks, nucleotide and symbol, may be repositioned at the top
of the Alignment Pane, using the Alignment on Top command from the shortcut menu.
You may navigate easily among ambiguous positions using Find Next/Previous
Ambiguous from the View menu or toolbar button (
).
There are two Find features in the Contig Viewer: Find Fragment and Find Sequence. Find
Fragment can be be activated from the Edit menu in any pane. In the dialog (Figure 16.37),
enter the name of a fragment and click Find. Wild cards (*) are permitted in the search name
155
Vector NTI Advance 10 User’s Manual
(e.g. *16*). If a result is returned, double-click on it and the Viewer will jump to that fragment in
the Text and Graphics panes.
Figure 16.37 Find Fragment dialog
Find can be used to find a specific sequence in the Alignment Pane. Click on the ONE6KANR
fragment name in the Alignment Pane list to select it. Place the cursor at the beginning of the
sequence. Launch the Find sequence dialog box either by choosing Edit > Find from the menu
or by clicking the Find button (
) on the toolbar. When Find dialog box appears, type in the
sequence “gagactccatt” (Figure 16.38). Click the Complementary Search checkbox.
Figure 16.38 Find (sequence) dialog
Click the Find Next button. The Alignment Pane jumps to and highlights contig positions 2470
to 2480 where the complementary sequence has been found (Figure 16.39). The Set Selection
box on the Status bar also reports the position of the found sequence using the fragment coordi-
156
Tutorial: ContigExpress Chapter 16
nates (128-138). The search is case-insensitive and can operate on the consensus as well as
individual fragments. Click Cancel to close the Find dialog box.
Figure 16.39 Find a sequence in the Alignment Pane
Click on the ONE6KANR fragment name in the Alignment Pane. Right-click anywhere in the
Alignment Pane, opening the shortcut menu. Select Show Chromatogram for ONE6KANR.
The chromatogram for the selected fragment is shown below its sequence, the same as it was
in the Chromatogram Pane of the Fragment Viewer (Figure 16.40).
Figure 16.40 Chromatogram display in Alignment Pane
157
Vector NTI Advance 10 User’s Manual
Right-click anywhere in the Alignment Pane. Select Show All Chromatograms from the shortcut menu. Now the chromatograms for all four fragments at this position are displayed (Figure
16.41):
Figure 16.41 All chromatograms displayed in Alignment Pane
Right-click anywhere in the Alignment Pane and choose Hide All Chromatograms from the
shortcut menu. Chromatograms in the Alignment Pane are no longer displayed.
The contig consensus sequence can be translated in the Alignment pane in any one or all of the
three direct frames. Translate the contig sequence in the first frame by activating the Alignment
Pane and choosing View > Consensus Translation > 1st frame from the menu or by pressing
the Consensus Translation 1st Frame button ( ) on the toolbar. Translate the contig
sequence in the second and third frames by choosing their respective menu commands or toolbar buttons (Figure 16.42). Gaps in the consensus are ignored in the translation, with the result
being that the introduction of gaps does not result in frameshift. Toggle between viewing transla-
158
Tutorial: ContigExpress Chapter 16
tions in single-letter or three-letter codes using the Show 1-letter AA codes button on the toolbar.
Figure 16.42 Amino acid translations of the contig consensus
Translations can be removed by clicking the Consensus Translation buttons again or by deselecting the translation options from the View > Consensus Translation menu.
3. Edit a Fragment in the Alignment Pane
Fragments can be edited in the Alignment pane of the Contig Viewer. Highlight the fragment
name ONE9KANR in the Alignment Pane and open the Set Selection box on the Status bar.
Enter coordinates 100 to 110 and check Fragment radio button and click OK. This jumps the
Alignment Pane to a sequence TGTAAAATCCC at positions 1923-1933 in the contig. The fragment coordinates, read 5’ to 3’, are 611-621, as you can read on the status bar. (Coordinates
100-110 refer to the coordinates as the original fragment is positioned in the contig – in this
case, a complementary positioning.)
Click on the “Use Enhanced Edit Mode” button ( ) on on the toolbar to allow editing. Choose
Edit > Delete Sequence from 611 to 621 bp from the menu. Because this fragment is a part of
a contig in Assembly 1.1, in addition to the current assembly, the following message appears
(Figure 16.43):
Figure 16.43 Approval for fragment editing that may dissolve other contigs
Click Yes to accept the changes. When you proceed with the deletion, the bases are deleted
from the chromatogram and the resulting gap is closed. A vertical red bar appears in the
sequence marking the position where the deletion was made (Figure 16.44). The consensus
159
Vector NTI Advance 10 User’s Manual
and the alignment are changed radically because sequence originally to the right in ONE9KANR
is shifted left, and is out of alignment with the other fragments in this region.
Vertical red bar
Figure 16.44 Deleting a fragment sequence in the Contig Viewer Alignment Pane
If you save the edited contig and open the edited fragment in the Fragment Viewer, the editing
changes are reflected in the fragment sequence.
Undo/Redo functions can be used to revert or repeat the changes you make. Click the Undo
button until it becomes disabled, and the fragment and the consensus return to their original
state.
Highlight fragment ONE13KANR, select bp 208 G and type T. If asked to confirm the edit, click
the Yes button. The G is replaced in the fragment and the contig consensus is updated (Figure
16.45). In the fragment, the new base is colored teal to indicate it is a replacement.
Figure 16.45 Replacing a fragment sequence in the Contig Viewer Alignment Pane
Additional editing operations in the Alignment Pane include sliding entire fragments into place
manually and sliding a block within a fragment into an adjacent gap. Use the Move Fragment
buttons (
) and Move block to the left/right buttons (
select appropriate fragments/regions and try them.
160
), respectively. Find and
Tutorial: ContigExpress Chapter 16
The only limitation of fragment editing in the Contig Viewer is that if it affects contigs in other
assemblies containing the newly edited fragment, those contigs must be dismissed.
Fragment in-place editing and update of the consensus on the fly makes the Contig Alignment
pane a convenient tool for working with contigs after their initial assembly. Remember that after
editing is performed in the Contig Viewer, fragments can be realigned as needed by reassembly
after selecting the appropriate fragments in the Text Pane.
At any time, before or after editing, you can generate a Difference Report comparing any two
fragments, or a fragment and the consensus. Select ONE13KANR in the fragment name list and
check Compare To from the View or shortcut menus. In the dialog, accept the default comparison to the consensus and click Compare. The resulting report (Figure 16.46) may be saved as
a .txt file to your computer.
Figure 16.46 Difference Report between a fragment and the contig consensus
When editing has been performed in a Fragment/Contig Viewer, separate prompts will appear
upon closing both the Fragment/Contig Viewer AND the ContigExpress Project Explorer requiring approval for the edits to be saved.
4. Exit ContigExpress
You have finished the ContigExpress tutorial. Close ContigExpress as you would close any
other Windows application.
161
Vector NTI Advance 10 User’s Manual
162
C
H A P T E R
17
DATABASE EXPLORER
Introduction
The Vector NTI database is a collection of molecules and laboratory data, organized for easy
retrieval and management in Vector NTI’s Database Explorer. Eight different types of objects are
stored and organized in databases and subsets in Database Explorer:
z
DNA/RNA molecules are annotated with Feature maps. Upon import from other sources,
molecule data is parsed and stored in an internal format. Users can add molecules to the
database through import or creating basic or constructed molecules.
z
Protein molecules are also annotated with Feature maps. Like DNA molecules, upon
import from other sources, protein molecule data is parsed and stored in an internal format. Users can add molecules to the database through import or creating basic molecules.
z
Restriction enzymes are imported from the REBASE database; data for the enzymes in
the Vector NTI database is parsed and stored in an internal format. Users can add other
restriction enzymes from the REBASE file included in the Vector NTI software.
z
Oligonucleotides in the database are user-defined except for several included in the Vector NTI software for demonstration purposes.
z
Gel markers commonly used in molecular biology laboratories are included initially in the
Vector NTI software, but new gel markers can be created by the user.
z
Citations for physiochemical analysis of molecules in BioAnnotator and other Vector NTI
analyses are stored in the Vector NTI Database Explorer.
z
BLAST results can be stored independent of molecules in a BLAST Results database.
z
Analysis results performed on DNA/RNA and Protein Molecules, such as PCR analysis,
PFAM analyses, etc. can be stored in the Vector NTI Database.
Very similar in functionality to the Windows 95/98/Windows NT interface, Database Explorer
supports intuitive browsing of local and shared Vector NTI databases, clipboard data exchange,
drag and drop operations and other functions typical of window-based database management.
163
Vector NTI Advance 10 User’s Manual
From the Exploring Database window, you can perform the following:
z
Create new molecules
z
Sort, Edit and delete molecules
z
Search the database for text sequence, motifs, feature types, keywords etc.
z
Organize our data into convenient groups (subsets)
z
Import and export data (this is inactive in the demo version)
z
Open the other applications of Vector NTI Advance—AlignX, BioAnnotator and ContigExpress
z
Copy and save or print a list of the objects in a subset.
Parent-Descendant relationships (to keep track of your constructs), user fields, comments, keywords etc., are kept for all molecules in the database
All database molecules and other objects can be placed into “archives”—data files of special format—that can be transferred to another computer (Mac or PC) and read by Vector NTI there.
Through archives, you can share molecules, constructs, or other objects with your colleagues,
or use them simultaneously on several computers (for instance, at work and at home).
In the Vector NTI archives:
z
All DNA/RNA molecule information is written to and read from an archive file. This
includes molecule component fragments (if the molecule is constructed from other molecules) and parent-descendant connections between molecules.
z
Vector NTI automatically checks the consistency of molecule archive information adding
necessary parents (including DNA parents of translated protein molecules) or disconnecting them if you have neglected to transfer them to the archives.
z
When the archive is loaded into a new database, Vector NTI checks the information consistency on any of database molecules and recalculates them if necessary.
Opening Vector NTI Database Explorer
The Vector NTI Database Explorer can be opened from several sources:
z
Vector NTI Database Explorer can be opened and used independently by selecting Vector NTI Explorer in the Vector NTI Advance options under Start > Programs on your
computer. Select Start > Programs > Invitrogen > Vector NTI Suite 10 > Vector NTI
Explorer.
z
From a Molecule Display window, select File > Local Database or click the Local Database button (
) to open Database Explorer.
z
The Vector NTI Database Explorer can also be configured to open automatically in the
Vector NTI workspace each time a Vector NTI session is initiated. From a Molecule Display window, select Edit > Options from the menu bar. On the General tab of the
Options dialog box, select Open Local Explorer At Startup.
In this User’s Manual, the term “Explorer” refers to Vector NTI Explorer, not to Windows
Explorer.
164
Database Explorer Chapter 17
Elements of Vector NTI Database Explorer
The Vector NTI Database Explorer window consists of a menu bar, a toolbar, Table drop-down
menu in the upper left corner, a Subset Pane on the left and a Database <Object > Pane on the
right of the window (Figure 17.1).
Figure 17.1 Elements of Vector NTI Database Explorer
Database Tables
The Vector NTI Database consists of the following eight tables:
z
Note:
DNA/RNA Molecule Table – Stores DNA and RNA Molecules, including constructed
and designed molecules. Three types of DNA/RNA molecules can exist in the Local Vector NTI Database Explorer:
o
Circular (
o
Linear (
o
Invitrogen (
) DNA Molecules
) DNA/RNA Molecules
) Proprietary Molecules
z
Among the different types of molecules present in the Vector NTI Database are InvitrogenTM proprietary molecules. Over one hundred of the most commonly used, fully annotated, Invitrogen vectors are available in the database. When working with these specific
molecules, included in a Molecule Viewer Text Pane is a hyperlink to the Invitrogen website providing you with relevant information about reagents specific to the annotated features of that molecule.
z
Protein Molecules Table – Stores Protein Molecules.
z
Enzymes Table – Stores restriction enzymes.
z
Oligos Table – Stores oligonucleotides up to 1000 bases in length.
z
Gel Markers Table – Stores gel markers that can be used in Vector NTI’s gel simulation
function.
z
Citations Table – Stores citations retrieved through the Vector NTI PubMed Search
engine, from the NCBI website or from other searches. In addition, the Citation Table
section of Database Explorer provides complete bibliographic conversion features
described in the Citation Table section below.
165
Vector NTI Advance 10 User’s Manual
z
BLAST Results Table – Stores BLAST results retrieved using the BLAST Search module. BLAST Results can be opened in the BLAST Viewer module and saved to the Vector NTI Database from there.
z
Analysis Results Table – Stores various analyses performed in Vector NTI and Analysis Monitor (see page 559), such as PCR analysis, PFAM, etc. When a saved analysis is
opened from the Vector NTI Database, the associated molecule opens with the analysis
information displayed in the Text, Graphics and Sequence Panes. (The Analyses display
option must be turned on. See page 221).
The Vector NTI Database Explorer window displays the contents of one table at a time. You can
alternate between tables by selecting a table from the Table menu or the Table drop-down list in
the top left corner of the Explorer window.
Citation Table
One of the most convenient features of the Citation Table is its ability to generate citations and
bibliographies for theses, dissertations and other publications. Bibliographies are generated
according to the rule of scientific journals.
Formatting Bibliographic References
To format each bibliography record, you must insert a tag in the document where the reference
is to be cited. In Database Explorer Citation Table, select the desired reference. From its associated shortcut menu, select the Copy Tag command. Then go to your word processor document
and paste it. For example, the tag at this point might read [Smith, J. 1994 #213].
After finishing the writing, save your document as Rich Text Format (*.rtf) file.
When you are ready to prepare your manuscript, select the Citations Table in Database
Explorer. Open a shortcut menu in the subsets pane and select Format Manuscript. In the dialog box that opens (Figure 17.2), browse for the RTF file you want to format.
In the Format Reference For drop-down menu, select a journal name. Click the Start button.
The tagged document will be formatted into the document with properly formatted citations and
bibliographies.
Figure 17.2 Format Manuscript dialog box
To place selected citations onto the Clipboard formatted according to the rules of specific journal, select the citation(s) and open the shortcut menu in the Database Objects pane. Select
166
Database Explorer Chapter 17
Copy Bibliography. In the dialog box that opens (Figure 17.3), select the journal whose formatting the bibliography should follow. Click OK.
Figure 17.3 Copy Bibliography dialog box
Then proceed to your word processing document and paste the citations. They will be in the format for the journal you selected.
Note:
In the Database Explorer, one cannot edit citations downloaded from NCBI.
Database Subsets
Each database table contains a list of subsets, groups of objects (molecules, enzymes, etc.)
organized into logical categories. You might have one subset for each of your molecule families,
one for each taxonomic group, etc.
Subset separators are used to group subsets into logical categories by providing a visual separator or division between subsets in the Subset Pane. For example, you may create separators
to divide subsets containing molecules used for different projects. You can add separators by
right-clicking in the Subset Pane and choosing Add Separator from the shortcut menu. Once
you have created a separator, you can change its position in the Subset Pane by clicking and
dragging it to a new location in the Subset Pane.
z
The principal subset is called Main and all database objects are always included in Main.
Other subsets are merely windows into Main, showing a subset of the contents of Main;
they do not serve as containers for molecules. Because of this, a database object can be
included in any number of subsets without increasing the amount of disk storage the
object occupies.
z
Subsets are created, edited and deleted through the Database Explorer.
z
When you select a subset in the left pane, Explorer lists the subset contents in the right
pane and displays table- and subset-related commands on the menu bar and toolbar
buttons on the toolbar. When you select one or more database objects in the right pane
(activating the Object Pane), the menu bar displays object-related menu options and
toolbar buttons.
z
To alternate between panes, click on a pane to activate it or use the F6 keyboard shortcut. To open context-sensitive shortcut menus, click on subsets or database objects with
a right click. The shortcut menu displays commands appropriate for the object under the
cursor.
Database Objects
Each database object is described by a set of fields, describing various object data. Each object
type defines its own set of fields. System fields are common for all database objects; other fields
are specific for a particular object type. A user may also define additional user fields.
167
Vector NTI Advance 10 User’s Manual
Database Object System Fields
Most of the object system fields, assigned names by Vector NTI, are accessible from various
parts of the program’s user interface. Some of them, however, are only visible in specialized
object type-specific dialog boxes or display windows.
The following is the full list of named system fields displayed by Vector NTI:l
Field name
Description
Name
Name of an object
NPEOGCU
Local/Foreign
Object’s ‘ownership’ status in the local database
NPEOG
(local DB only)
Original Author
Original author (creator) of an object
NPEOG
Created
Date of an object’s creation (See Date and Time section
following)
NPEOG
Author
Author of the last modification to an object (see following
section)
NPEOG
Modified
Date of the last modification to an object
NPEOG
Submitted by
The name of a Vector NTI user who submitted the object
NPEOG
(shared DB only)
Description
Description string
NPEOGU
Form
Circular or Linear
N
Storage Type
Basic, Designed or Constructed
NP
Fully Processed?
Molecule’s construction status
N
Length
Length of a molecule/oligo/enzyme’s recognition string in
bp
NPOE
DNA/RNA
Nucleic acid type
NO
Degenerate?
Is an oligo degenerate?
O
Oligo
Sequence
Oligo’s nucleotide sequence
O
Recognition
String
Enzyme’s recognition string
E
Terminus Type
Enzyme’s terminus type
E
Palindromic?
Is an enzyme palindromic?
E
Ambiguous?
Is an enzyme ambiguous?
E
Number of
Fragments
Number of fragments in a gel marker
G
Longest Fragment
Length of the longest fragment in a gel marker
G
Table 17.1 Named system fields displayed by Vector NTI
168
Used in:
N(DNA/RNAs)
P(proteins)
E(enzymes)
O(oligos)
G(gel markers)
C(contacts)
U(user field defs)
Database Explorer Chapter 17
Field name
Used in:
N(DNA/RNAs)
P(proteins)
E(enzymes)
O(oligos)
G(gel markers)
C(contacts)
U(user field defs)
Description
Shortest Fragment
Length of the shortest fragment in a gel marker
G
Telephone
Phone part of the Contact info
C
E-mail
E-mail part of the Contact info
C
Field Type
User field type
U
Indexed?
Is user field cached/indexed?
U
Default
Default value of a user field
U
List of Predefined Values
List of predefined values of a user field
U
Record #
Database record ID number
NPEOG
Table 17.1 Named system fields displayed by Vector NTI (continued)
In addition to the system fields named above, every database object has comments and keywords associated with it. These fields are accessible from within specialized object editors and
Display windows.
Note:
All automatically updated fields, user-defined fields and comments are searchable. Using the
database search interface described later in this chapter, you can perform string context
searches through any of the fields above for any database objects.
Of the general system fields data itemized in the above table, only Author and Date and Time
display features are independent of object types. Their sources and modification options are
summarized below.
Author Information
Information regarding authors and times of creation and modification for all database objects is
stored in the following named System Fields:
z
Original Author: name of Vector NTI user who created the object,
z
Author: name of Vector NTI user who last modified the object,
z
Creation Date: date and time when the object was created,
z
Modification Date: date and time when the object was last modified in the local Vector
NTI database.
When you start Vector NTI for the first time, in the Author Information dialog box you can identify
yourself as Vector NTI user and author of all modifications and new objects you create in the
local database. By default, it presents the name given to the Vector NTI Installation program.
This information is automatically attached to all database objects you create and/or modify when
you export them, copy to shared databases etc.
Note:
Changes you might make later to Author Information do not affect information stored in database objects you submitted to shared databases earlier.
z
An object you create in your database is marked as a “Local Object” naming you as both
the author and the original author. While author information is not displayed on local
169
Vector NTI Advance 10 User’s Manual
objects while you view or edit them, the data does follow the object and is displayed
when exported or viewed by another VNTI user.
z
When you import an object or transfer it from a VNTI Shared Database into your local
database, if you are the author the object is still marked as Local. If the author is someone else, then the object is marked as “Foreign” and the author information is always
displayed when you are viewing or editing the object.
z
The original author (creator) of an object, either “Local” or “Foreign”, never changes. If
you modify a “Foreign” object, however, it becomes “Local” and you become its new
“immediate” author.
z
If you are importing an object in which author or original author information is not stored
in your contact database, VNTI lets you update the contact and author data in your database.
To review or edit author data, select View > Author Info… opening the Author Information dialog box where you can do that.
Date/Time Display
To change the date/time display format, select Edit > Options on the menu bar of the main Vector NTI’s window (Molecule Display Window). On the General tab of the Options dialog box,
select the standard US date format (for example, 03/20/96 04:20PM) or a regional date/time format, the default format recognized by your computer. Change this format using the Windows
Control Panel/Regional (or International) dialog box. (For more information regarding formatting,
see Chapter 3.)
Authors, original authors, and times of creation and modification for all database objects are
updated automatically by Vector NTI and should not, in normal circumstances, be modified manually. If such a need occurs, use the <database object > > Set System Attributes command
for setting values of these fields in the Vector NTI Database Explorer.
User-defined Fields
For information management functions, user-defined fields are associated with any database
object (molecules, oligos, etc.). A User Field containing laboratory-specific and user-specific
descriptions can be imported, exported, displayed, printed and managed just as the regular
database fields.
While previously defined User Fields are maintained and presented when you create new database objects, imported objects may contain fields not described on the local list. Vector NTI
helps you to add their descriptions to the list whenever you try to edit the information contained
in these fields. Vector NTI also allows you to import and export User Field Definitions across
several VNTI databases.
The “User Field Manager” section on page 197 of this chapter contains the detailed description
of all User Fields-related operations. For a detailed example of how to use the User Fields Manager, walk through the Tutorial: Database Explorer in Chapter 7.
Comments
Each database object can contain a text comment of unlimited length. Vector NTI automatically
converts stored comments when importing or exporting molecules from/to GenBank/GenPept
and EMBLSWISS-PROT files.
Comments can be edited in the Comments tabs of the objects’ editors or immediately in the Molecule Display window (for molecules only). In a Molecule Display window, double click on the
Comment line or click on the Comment icon to open the Comment Editor containing the molecule comment.
170
Database Explorer Chapter 17
Keywords
Each database object can contain a list of associated keywords that are very useful for database searches. Keywords can be edited in the Keywords tabs of the object’s editors.
To enter keywords, in the keywords text box, type a new word or select an item from the list of
existing keywords. Click the < Add button to move the keyword into the keyword list. To remove
an item from the list of keywords, select the item(s) you want to remove and click the > Remove
button.
Database Search
You can perform a database search to locate any type of object stored in the database. In general, search procedures launched from Database Explorer follow these basic steps:
1. Select the appropriate Database Table type and select Database > Search on
Explorer’s menu bar or click the Search button (
) on the toolbar.
2. In the <Object > Database Search dialog box, verify the Database Table type.
3. In the Search dialog box, (Figure 17.4) check the boxes for the filters to be included in
the search. Press the enable filter buttons to open dialog boxes.
4. In the Conditions Filter dialog boxes that open, define additional search parameters.
(See detailed descriptions of filters below.) Only those molecules that satisfy all the conditions you define are found in the search. Click OK in each to return to the Search dialog box.
5. When you are satisfied with the search setup, click the Start Search button.
6. If Vector NTI finds any objects by a database search, the appropriate Subset Name dialog box appears. Enter a name of new subset or choose a subset name from those
listed. All objects found will be placed in the specified subset overwriting the existing
subset content (if any).
Notes:
z
If the specified subset already exists, Vector NTI empties it before adding found objects.
You can refine your search by using the resulting subset to limit the search space of the
next search.
z
If you check multiple Filters in the Molecule Database Search dialog box, a search that
satisfies all the checked criteria (an AND search) is performed. If you want to search
according to only one filter criterion, remember to leave all other filters, except the one of
interest, unchecked.
Database search filter parameters specific to particular database objects are outlined below.
Specific settings are not discussed unless they need clarification.
171
Vector NTI Advance 10 User’s Manual
DNA/RNA and Protein Molecule Database Searches
The Molecule Database Search dialog box (Figure 17.4) for DNA/RNA and protein molecules
are identical except for the database shown in the Look In drop-down menu. Differences in the
specific filter setup dialog boxes are specified in the discussion for each.
Figure 17.4 Molecule Database Search dialog box
To set the conditions for a particular search filter, check the appropriate filter checkbox and
press the corresponding filter button. For example, if you want to set the parameters for a Text
Search, check the Text Filter checkbox and then click the Text Search Setup button.
Searching by Object Name in the Vector NTI Database
Database Search Name Filter
To perform a Name search, check the Name checkbox and type the name you want to search
for in the textbox in the Name section of the Molecule Database Search dialog box. If you want
the search to match the case of the entered name, check the Match Case checkbox.
The wildcard characters * and ? are allowed in a name search and have the following significance:
z
* = any number of characters (including no characters)
z
? = any single character
Alternate Name Search Method
You can perform a quick name search in the Database Exploring window by performing the following steps:
1. Open the Exploring – Local Vector NTI Database window.
2. Navigate to the database table of interest by choosing it from the Database Table dropdown list.
3. Sort the objects alphabetically according to name (if not already sorted by name) by clicking
on the Name column heading.
4. Highlight the first name on the list.
5. Using the keyboard, type the first letter (or first few letters, quickly) of the desired object
name. The list scrolls to that area on the list.
172
Database Explorer Chapter 17
Attributes Search Conditions Box (DNA)
Figure 17.5 Attributes Setup dialog box (DNA)
Attributes Search Conditions Dialog Box (Protein)
Figure 17.6 Attributes Setup dialog box (Protein)
If all conditions in a group are checked, or if all conditions in a group are blank, that group has
no effect on the search.
Text Search Conditions Dialog Box (DNA and Protein)
Figure 17.7 Text Setup dialog box
To add a new substring, enter the text and click the < Add button (Figure 17.7). To remove a
substring, highlight it and click the > Remove button. Check the fields to be searched for the text
substrings. Check Match Case for case-sensitive text substrings.
173
Vector NTI Advance 10 User’s Manual
Keywords Search Conditions Dialog Box (DNA and Protein)
Figure 17.8 Keywords Setup dialog box
Click the < Add button to select from the list of existing keywords (Figure 17.8). To remove a
keyword from the box, select it and click the > Remove button. To clear the Keywords box, click
the >> Remove All button.
Note:
You cannot add keywords in this dialog box.
Ancestors Search Conditions Dialog Box (DNA and Protein)
Figure 17.9 Ancestors Setup dialog box
Molecules that have as a direct ancestor any one of the molecules shown in this dialog box will
be found by the search. Ancestors for proteins in this context are DNA molecules.
To add a molecule to this box, click < Add. Select from the database molecules list and click
OK. To remove a molecule from the ancestors list, select the molecule in the dialog box and
click > Remove, or to clear the list, click >> Remove All.
174
Database Explorer Chapter 17
Oligo & Peptides Search Conditions Dialog Box (DNA and Protein)
Figure 17.10 Oligo & Peptides Setup dialog box
Click the Add Oligos button to add an oligonucleotide for similarity search. In the Oligonucleotides dialog box that opens, you can select the oligo(s) from the Vector NTI Database or create
new oligo(s) for the search.
To add a peptide for similarity search, click the Add Peptide button. In the Peptide dialog box
that opens, enter the peptide name and query sequence, and description, if desired.
To remove a search condition from the list box, select the condition and click Delete. To clear
the Oligonucleotides/Peptides box, click Clear.
Select the genetic code you want to use for the search from the Genetic Code drop-down box.
Feature Search Conditions Dialog Box (DNA and Protein)
Figure 17.11 Feature Setup dialog box
To add a feature to the search conditions, click the < Add button (Figure 17.11). In the dialog
box that opens (Figure 17.12), define restrictions for the molecule search. Feature types differ
for DNA/RNA searches and protein searches.
Figure 17.12 Add Features dialog box
175
Vector NTI Advance 10 User’s Manual
Select a feature type in the left pane and optionally, using the radio button, one or more feature
names. If you define a type of feature but no specific feature names, the search condition is
defined as any feature of that type.
To remove a search condition from the Features list, select the condition and click > Remove.
To clear the Features list, click >> Remove All.
Enzyme Database Search
When you launch an enzyme search, the following Search dialog box opens (Figure 17.13):
Figure 17.13 Enzyme Database Search dialog box
z
Recognition String Filter: Enter a nucleotide string that must be found in the recognition site of the desired enzyme.
z
Attributes Filter: Specify enzyme attributes necessary for the search. “Ambiguous” recognition site means the site containing any nucleotide besides A, T, G, or C.
z
Text Filter: Check the Text Filter button to filter search results based on text inside various object fields. Refer to page 173 for a description of the Text Filter Condition.
z
Keywords Filter: Refer to page 174 for a description of the Keywords filter. Note: You
cannot add new keywords in this dialog box.
Oligo Database Search
When you launch an Oligo database search, the following dialog box opens (Figure 17.14):
Figure 17.14 Oligo Database Search dialog box
176
Database Explorer Chapter 17
z
Nucleotide String Filter: Enter a Nucleotide String filter that must be found in the
sequence of the desired enzyme and select the strand to search, direct or complementary.
z
Attributes Filter: Check to limit the search space to DNAs only or RNAs only. If both are
checked or unchecked, the filter has no effect.
z
Text Filter: Check the Text Filter button to filter search results based on text inside various object fields. Refer to page 173 for a description of the Text Filter Condition.
z
Keywords Filter: Refer to page 174 for a description of the Keywords filter. Note: You
cannot add keywords in this dialog box.
Gel Marker Database Search
When you launch a search in the Gel Marker Database, the following dialog box opens (Figure
17.15):
Figure 17.15 Gel Marker Database Search dialog box
z
Attributes Filter: Check to limit the search space to gel markers with specified length of
the longest fragment. If all are checked or unchecked, the filter has no effect.
z
Text Filter: Check the Text Filter button to filter search results based on text inside various object fields. Refer to page 173 for a description of the Text Filter Condition.
z
Keywords Filter: Refer to page 174 for a description of the Keywords filter. Note: You
cannot add keywords in this dialog box.
177
Vector NTI Advance 10 User’s Manual
Citation Database Search
When a Citations Database Search is launched, the following dialog box appears, allowing you
to search by Citation, Text and/or Keywords
Figure 17.16 Citations Database Search dialog box
BLAST Results and Analysis Results Database Searches
When a BLAST Results or Analysis Results Database Search is launched, the following dialog
box appears, allowing you to search by Attributes, Text and/or Keywords:
Figure 17.17 BLAST Database Search dialog box
Database Management Operations
Backup, Restore and Cleanup
Three general functions (all initiated by choosing options under the Database menu of Database
Explorer) relate to the entire database:
178
Database Explorer Chapter 17
Important:
z
Database Backup makes a copy of your database in a specified directory or folder. For
instance, you may back up the data to removable storage to make a permanent, safe
record of your database. Making such a backup is the only way to be sure your data is
safe in the case of hard drive failure.
z
Database Restore restores all database files from the last backup. Your database is
restored from a specified directory or folder, overwriting all current database files.
z
Database Cleanup removes from the data files and database tables all the “garbage”
data that may accumulate when you extensively create and delete database objects.
This also serves as a recover function when files or tables are lost or damaged. Although
these data do not affect Vector NTI functionality, it is wise to perform Database Cleanup
once a week.
Vector NTI Database Backups are NOT cross-platform compatible (i.e. the Vector NTI Database
on a PC cannot be restored using a VNTI Database Backup made from Vector NTI on a Macintosh, and vice versa. If you want to move the VNTI Database from PC to Macintosh (or vice
versa), you must do so using VNTI Archive files. For more information on importing and exporting VNTI Database objects as Archives, see page 181 and page 184, respectively.
Selecting the Local Database
The Select Local Database command in Database Explorer allows you to direct Vector NTI to
the local Vector NTI database of interest, in the case where you have created multiple local
databases. For example, you may create additional Vector NTI databases by copying the existing local database to a different location on your hard drive. In this case, you can use the Select
Local Database command to alternate Vector NTI’s focus to the different local databases.
Note:
Vector NTI/Database Explorer can only view one database at a time.
To point Database Explorer to a different Vector NTI local database, choose Database > Select
Local Database from the Database Explorer menu, navigate to the Vector NTI database of
interest in the Choose Local Database Directory dialog box that opens, highlight the database
folder and click the OK button. The selected Vector NTI database now appears in the Database
Exploring window.
Note:
You must have all other Vector NTI Advance programs closed, except Database Explorer, when
executing the Select Local Database command.
Operations on Subsets
To initiate any of the following operations on a subset, select the subset name in the left pane of
Database Explorer. Press the toolbar buttons as described or choose Table or Edit or corresponding shortcut menu commands. Descriptions of each operation are included below.
Creating a New Subset
To create a new subset and/or add objects to it, perform one of the following options:
z
Select Table > New > Subset or click the New Subset button (
) to create a new
(empty) subset with a default name, Group 1. You can edit this name in the enabled text
box; press ENTER to confirm.
z
Select Table > New > Subset (Using Subset Editor) to create a new subset and select
its contents using the Edit Subset dialog box described below under Editing a Subset.
z
A simple way to add new molecule or other object to a subset is to open the source subset in the Subset Pane. Select and drag selected objects from the list to the new subset.
The objects are now listed in the original subset and the new subset.
179
Vector NTI Advance 10 User’s Manual
z
To create a new subset and place objects in it at the same time, select objects for the
new subset in the Database Objects Pane and click the New Subset button (
).
Editing a Subset
In the Subset Pane, select a subset to be edited and select Table > Edit Subset. This option is
not available for subsets where the content is maintained automatically. This opens the Edit
Subset dialog box (Figure 17.18):
Figure 17.18 Edit Subset dialog box
z
The Source Subsets column shows all of the subsets in your Vector NTI database table
except the one you are editing. The buttons below this column control how subset
objects in subsets selected in the Source Subsets column are displayed in the Source
Content column:
o
Intersection: Each molecule that is present in all highlighted subsets is displayed in
the Source Content column. Molecules not included in all selected subsets are thus
excluded.
o
Difference: Each unique molecule from selected subsets, in other words, a molecule
present in only one of the highlighted subsets is displayed. Molecules that occur in
more than one subset are thus excluded.
o
Union: All molecules that is present in any of the selected subsets is displayed.
If only one subset is highlighted, the Intersection, Difference, and Union buttons are disabled,
and all the objects in that subset are shown in the Source Content column.
z
The Source Content column shows combinations of objects present in the subsets highlighted in the Source Subsets column. See descriptions under the previous bullet.
z
The Resulting Content column shows the contents of the subset you are editing.
To add objects to a subset, highlight one or more subsets in the Source Subsets Column. In the
Source Content column, highlight the object names or use the Select All and Unselect All buttons in that column to highlight or deselect all objects at once. When the objects you want are
highlighted, click the Add >> button to add them to the Resulting Content column. Click OK to
exit the dialog box. The objects are now listed in the original subset and the new subset.
Removing Molecules from a Subset
In the Subset Pane, select the subset to be edited. Select Table > Edit Subset or Edit from the
shortcut menu. The Resulting Content column in the Edit Subset dialog box (Figure 17.18)
shows the current contents of the subset you are editing. To remove objects from the subset,
180
Database Explorer Chapter 17
highlight their names in the Resulting Content column and click the << Remove button. Select
All and Unselect All buttons below the Resulting Content column allow you to highlight or deselect all objects in the column. Click OK to exit the dialog box. Database objects that are removed
continue to exist in the database and other subsets where they were included before this operation.
For alternative ways of removing objects from a subset, see Operations on Database Objects on
page 185.
Rename Subset
Select Table > Rename Subset or click the Rename button (
). In the enabled text box, edit
the name. This operation does not affect the subset contents or database objects. This option is
not available for subsets where the content is maintained automatically.
Dismiss Subset
Select Table > Dismiss Subset or click the Dismiss Subset button (
). This operation
removes a selected subset, but does not affect the database objects. They are still stored in the
database and exist in other subsets where they were included before this operation. To empty
the subset first, use the Clear Subset operation.
Clear Subset
Select Table > Clear Subset to exclude all objects from the selected subset. The subset itself is
emptied but not removed. This operation does not affect database objects; they are still stored
in the database and included in all other subsets where they were included before this operation. This option is not available for subsets where the content is maintained automatically.
Delete Contents
Select Table > Delete Contents from Database to physically delete from the database all
objects of the specified subset. If you choose OK in the confirmation dialog box, the objects in
the subset are permanently deleted from the Vector NTI database, and the subset itself is
removed.
Subset Summary
Select Table > Subset Summary to create a text file containing a summary of the specified
subset. In the Write Summary To dialog box that opens, indicate the directory or folder and file
name where the summary will be stored. Click the Save button and Vector NTI creates the summary.
Subset Properties
Select Table > Properties or the Properties button (
subset.
) to display properties for the selected
Import Molecules into a Subset
To import molecules into a subset using drag and drop, use one of the following techniques:
z
Import Molecule(s) or Sequence(s) From Text File(s): Highlight the molecule file
name(s) in Windows Explorer (Note: molecule files must be in accepted formats, see
below). Drag and drop the highlighted name(s) onto the desired subset in the VNTI Database Exploring window.
z
Import Directory of Files: For a folder containing multiple molecule files (in accepted
formats, see below), drag and drop the folder onto the desired subset in the Exploring
181
Vector NTI Advance 10 User’s Manual
Local VNTI Database window. All the molecules in the folder are imported into the subset.
To import molecules into a subset using menu options, select Table > Import, then one of the
following options:
z
Import Molecule From Text File imports DNA/RNA or protein molecule data from a
GenBank/GenPept, EMBL/SWISS-PROT, or FASTA file. Vector NTI imports all molecule
data including feature table (if any).
z
In the Import Molecule dialog box, choose the appropriate import file format—GenBank,
EMBL, or FASTA for DNA/RNA molecules and GenPept, SWISS-PROT or FASTA for
proteins and click OK. In the Import dialog box, browse for the source and file to be
imported and click Open. Vector NTI reads the file, checks all data, creates the new molecule, and displays its data in the Molecule Editor dialog box. After entering or editing the
data, press OK. Vector NTI saves the new molecule in the database.
z
Import Sequence From Text File imports a nucleotide or amino acid sequence text file,
creating a new DNA/RNA or protein molecule with the sequence. This must be in ASCII
format. In Import dialog box, browse for the source and file to be imported and click
Open. Vector NTI reads the file, checks all data, creates the new molecule, and displays
its data in the Molecule Editor dialog box. After reviewing or editing the data, click OK,
saving the new molecule in the database.
o
For ASCII format details, see Appendix C.
z
Import Molecules From Archive imports objects from a Vector NTI archive. In the
Import dialog box, browse for the source and archive file to be imported and click Open.
z
Import Molecules From Directory of Text Files, (option for molecules and oligos only),
imports molecules and oligonucleotides from text files that must be in the GenBank format (DNA/RNA molecules), GenPept format (protein molecules) or Vector NTI’s oligo
text format (oligonucleotides). In the Import dialog box, browse for the List File and open.
When Vector NTI exports the objects into a directory of text files (see below), it automatically creates the appropriate List File.
o
Notes on Molecule Import.
o
In Vector NTI versions prior to 6.0, import and export functions could be performed
from the Molecule Display window. In version 7.0, they can be performed only
through Database Explorer.
o
GenBank, GenPept and EMBL feature tables usually do not contain names for features. When importing, Vector NTI assigns “artificial” names for the features so that
they will be recognizable on a graphics map. You can change features’ names after
import using Vector NTI’s Molecule Editor, or assign names to features before import,
by adding “label=<name > ” descriptors in the flatfile for any desired features.
Here is a sample GenBank/EMBL feature description with a defined feature name:
CDS 86..1276
/label=TC(R)
o
For more information about GenBank/GenPept /EMBL Feature Table descriptors,
see GenBank/GenPept /EMBL documentation.
Import Enzymes into a Subset
Restriction endonucleases can be imported into Vector NTI from the REBASE database, which
is available through anonymous ftp site, ftp.neb.com. To obtain further information, refer to the
website: http://rebase.neb.com/rebase/rebase.html. For a recent review of the REBASE database see Nucleic Acids Research 22: 3628-3639, 1994.
Each REBASE release contains several data files in different formats. Vector NTI uses bairoch
format, so you can download the bairoch.### file where ### indicates the current version (for
182
Database Explorer Chapter 17
example, 506 indicates June 1995). Distributive version of Vector NTI contains the last release
of the REBASE bairoch.### file in the Vector NTI working directory.
To import restriction endonucleases into the Enzymes Table, select Table > Import, then one of
the following options:
z
Enzymes From Archive: Browse for the Archive file and open.
z
From REBASE Database: Browse for Vector NTI Suite > bairoch.###file (see above)
and select it in the Read REBASE Enzymes dialog box (Figure 17.19). Click Open. In
the dialog box that opens, select the subset or name a new subset where objects will be
inserted. This file includes all enzymes in the bairoch file.
Figure 17.19 Read REBASE Enzymes dialog box
z
New Enzymes From REBASE Database: Browse for Vector NTI Suite > bairoch.###file and select it in the Read REBASE Enzymes dialog box (Figure 17.19) and
click Open. In the dialog box that opens, select the subset where objects will be inserted.
This file includes only enzymes in the bairoch file not currently included in the Vector NTI
Enzymes database.
Vector NTI reads the file and checks the data it contains. If Vector NTI detects any inconsistencies between Commercial Source designations/codes in the VNTI Restriction
Enzyme Database and those designated in the bairoch file, the Commercial Sources
Import dialog box appears (Figure 17.20).
Note:
For a Commercial Sources codes key, see the REBASE text file.
Figure 17.20 Commercial Sources Import dialog box
Your are given the choice to 1) merge the Commercial Source codes in the imported file with the
current codes in the Database, 2) overwrite the current codes with the incoming codes, or 3)
decline importing Commercial Sources data. Choose the appropriate option and click the OK
button.
183
Vector NTI Advance 10 User’s Manual
Vector NTI then loads the REBASE enzymes in the file into the REBASE Enzymes dialog box
(Figure 17.21):
Figure 17.21 REBASE Enzymes dialog box
To filter the enzymes in the Source Enzymes/Selected columns, check on or off the appropriate
boxes in the Use REBASE Subset group in the lower right corner of the dialog box and click the
Hide Others button. This is particularly convenient when you wish to identify restriction
enzymes based on certain criteria.
When all the desired enzymes are in the Selected list, click the Import Selected button to
import them into Vector NTI.
Export Subset
Export Subset Into Vector NTI Archive
Select Table > Export > Subset into Archive to export all objects of the specified subset to a
VNTI archive. In the Write To dialog box, indicate the directory or folder, and file name for
archive storage. Click the Save button.
Export All Subset Objects Into Directory of Text Files (molecules and oligos only)
Select Table > Export > Subset to Directory of Text Files to export all objects of the specified
subset into a directory of text files in GenBank (DNA/RNA molecules), GenPept (protein molecules) or Vector NTI’s oligo text format (oligonucleotides). In the dialog box, browse for the location and enter the file name under which the subset is to be stored.
Copy and Save or Print a List of the Objects in a Subset
You can copy and save/print a list of the objects in a subset, including the object names and
other desired column information by performing the following steps:
1. Open the Exploring Local Vector NTI Database window.
2. Navigate to the database table of interest by selecting it from the Database Table drop-down
box.
3. Right-click on the column headings in the Database <Object> Pane (right-hand pane) and
choose Columns… to launch the Columns dialog box.
4. Add or remove columns to customize the information showing in the Database <Object>
Pane according to what you want to print/save.
5. Close the Columns dialog box.
6. Create a subset and add to it the objects you want to print/save or navigate to the desired
subset, if already created. (Alternately, highlight the particular objects of interest, instead of
creating a subset.)
184
Database Explorer Chapter 17
7. With the Database <Object> Pane activated, click the Camera button on the toolbar or
choose Edit > Camera from the menu to launch the Camera dialog box.
8. Select the desired Range (Selection or All) and Clipboard as the Copy To location.
9. Open Microsoft Word or Excel and paste the data from the Clipboard.
10. Print and/or save the data from Word/Excel.
Operations on Database Objects
To perform various operations on an individual database object or group of objects selected in
the Object Pane of the Database Explorer, select menu options from the left-most menu option
that correspond to the currently displayed table type. For example, when the DNA/RNA Molecule table is selected, the left-most menu option is DNA/RNA Molecules, when the Citations
table is selected, the left-most menu option is Citations.
Notes
about
object
operations
:
Most of the following options appear with all database objects.
Most commands are also available from the objects’ shortcut menu, opened with a right click.
When available from toolbar buttons, they are shown.
Menu commands specific for certain objects are discussed after the following bulleted list.
z
Open: opens display windows for selected objects; available only for DNA/RNA and protein molecules.
z
Edit: includes editing options for an object selected in the Database Objects Pane, such
as user fields, comments, keywords, etc. This command is enabled only with a single
selected object. You can also use the Edit button (
).
z
New: includes options for creating a new subset for selected object(s) or creating a new
molecule or object. For specific details, refer to creating new <specific object > in the
index.
z
Import…: operations are described in the previous section.
z
Export: operations are described in the previous section.
z
Exclude from Subset Tree Pane History view excludes selected objects from the current subset. Objects are still stored in the database and are included in all other subsets
where they were included before this operation.
z
Delete from Database: Physically deletes a selected object from the database. (Confirmation is requested before deleting the object.) If a DNA molecule is deleted, Vector NTI
scans all its descendants and disconnects them from the deleted molecule. You can also
use the Delete button (
).
z
Rename: renames the selected object. If a DNA molecule is renamed, Vector NTI scans
all its descendants and also changes molecule’s name in all component fragment
descriptions of all the molecule’s descendants. You can also use the Rename button
(
).
z
Duplicate: makes copies of the selected database objects. The replicas of selected
objects are created in the database and included in the current subset. The replica of an
object named ‘x’ will be called ‘Copy of x’. Note: Copies of objects are not related to original objects. Thus, “copies” do not track further changes you may make to the originals.
z
Properties: displays the properties of the selected object(s). If one object is selected, all
the named object fields with their values are displayed. Some object data (like sequence
and comments) are not stored in named fields and are not displayed in the properties
dialog box. For molecules, the property dialog box has two extra tabs: Parents and
Descendants, displaying Parent and Descendant trees for the selected molecule. You
can also use the Properties button (
).
185
Vector NTI Advance 10 User’s Manual
z
Set System Attributes: Allows manual modification of the automatically updated fields
of the selected objects - Author, Original Author and Creation Date in the Set System
Attributes dialog box. If checked, the drop-down menu (edit box in case of Creation
Date) below the check box is activated for setting the value of the appropriate field.
The Author and the Original Author fields can be set only with the names of contacts already
stored in the contact database. The Creation Date field must be set with a date and time in the
USA format: “MM/DD/YY H:MIN AM (or PM)” where H is from 1 to 12. For more information,
refer to page 169.
DNA/RNA Molecule Operations
These operations are applicable to DNA/RNA molecules:
z
Table > New > Molecule (Using Sequence Editor) creates a new DNA/RNA molecule,
entering the nucleotide sequence manually using Sequence Editor. The Molecule Editor
dialog box is described in Chapter 19 (see page 237).
z
DNA/RNA > Gateway Cloning is an InvitrogenTM technology that functions as a universal cloning system with rapid and efficient routes to protein expression, functional analysis and cloning/subcloning of DNA segments. This menu option launches a Vector NTI 9
feature that provides an interlocking set of computational tools for planning a Gateway
cloning experiment from beginning to end. (This option is also available from the shortcut
menu opened with a right click when a DNA or RNA molecule is selected in the Database Objects Pane. For more information, see GATEWAY and TOPO Cloning, Chapter
23).
z
DNA/RNA > Delete with Descendants from Database physically deletes the selected
DNA molecule together with its descendants (DNA/RNA and protein molecules) from the
Database. Confirmation is requested before deletion.
Protein Molecule Operations
This operation is applicable to protein molecules:
z
Table > New > Molecule (Using Sequence Editor) lets you create a new protein molecule, entering the amino acid sequence manually using Sequence Editor. The Molecule
Editor dialog box is described in Chapter 19 (see page 237).
Enzyme Operations
These operations are applicable to RENs (restriction endonucleases) only.
z
Table > New > Enzyme opens the Enzyme Editor tabbed dialog box where you can create a new database enzyme in the Enzyme Editor (Figure 17.22):
Figure 17.22 Enzyme Editor dialog box, Enzyme/Methylase tab
186
Database Explorer Chapter 17
Enter information about the new REN as follows:
z
General Tab: Enter the name of the REN in the Name text box.
z
Enzyme Tab:
o
Recognition String – Enter the enzyme’s recognition string in the Recognition String
text box
o
Cleavage Point/Methylation Base – In the Cleavage Point/Methylation Base field
on the Enzyme tab, enter the number of the nucleotide immediately after the directstrand cleavage point. The following figure demonstrates how cleavage points of palindromic sites are defined.
Cleavage Point = 2
A A T A T T
1
2
3
4
5
6
T T A T A A
o
Cleavage Point on Complementary Strand – If the REN has a non-palindromic recognition site, the Cleavage Point on Complementary Strand field will be enabled. In this
field, enter the number of the nucleotide immediately after the complementary-strand
cleavage point.
The following figure demonstrates how cleavage points are defined for non-palindromic sites on both direct and complementary strands:
Cleavage Point on Complementary Strand = 10
Cleavage Point = 8
A A G T N N N N N N
1
2
3
4
5
6
7
8
9
10
T T C A N N N N N N
Cleavage Point on Complementary Strand = -4
Cleavage Point = -2
N N N N N N N A A G T
-7
-6
-5
-4
-3
-2
-1
1
2
3
4
N N N N N N N T T C A
The preview box on the Enzyme tab helps you to enter cleavage points.
o
Restriction Enzyme/Methylase – Select the enzyme type, regular REN or Methylase. Note: The enzyme type can be displayed in a field in the Database (Figure
17.23) by adding the Enzyme Type column to the Enzyme Database columns display
187
Vector NTI Advance 10 User’s Manual
(for more information on adding columns to the Database Explorer display, see
Options dialog box Details View Tab on page 192):
Figure 17.23 Enzyme Type field added to Enzyme Database display
o
Note:
Type of Methylation – If Methylase is selected for the enzyme type, the Type of
Methylation field becomes enabled. Enter the methylation type.
The enzyme type and methylation type, if applicable are indicated in the Restriction/Methylation Map folder in the Text Pane of the Molecule Viewing window for displayed cutters
(Figure 17.24):
Figure 17.24 Restriction/Methylation Map showing methylation position and type
o
Description – In the Description box on the Enzyme tab, enter the REN’s description.
z
User Fields tab: Add custom data in a form of fields. For details, refer to page 200.
z
Comments tab: Enter text comments.
z
Keywords tab: Enter key words for the REN, following the directions on page 171.
When all data is correct, choose OK to save the enzyme and return to the Database Explorer.
Oligo Operations
These operations are applicable to oligonucleotides only.
188
Database Explorer Chapter 17
z
Table > New > Oligo opens the New Oligo dialog box where you can create a new database oligo (Figure 17.25). The New Oligo and Edit Oligo dialog boxes are the same.
Figure 17.25 New Oligo dialog box
Enter information about the new (or to-be-edited) oligo as follows:
z
General Tab: Enter the name of the oligo.
z
Oligo Tab:
o
Nucleotide Sequence: Enter or edit the oligo’s nucleotide sequence. Valid characters:
ATUCG.
o
Select the oligo type.
o
Complementary box: Check to replace the oligo sequence with the complementary
one
o
Description box: Enter or edit the oligo’s description.
z
User Fields Tab: Add custom data in a form of fields. For details, refer to page 200.
z
Comments Tab: Enter text comments.
z
Keywords Tab: Enter keywords for the oligo. For details, see page 171.
When all data is correct, choose OK to save the oligo and return to the Database Explorer.
Analyze Oligo: With an oligo highlighted in the Database Objects pane, select Analyses >
Oligo Analyses > Thermodynamic Properties or Oligo Duplexes to open corresponding dialog boxes. These dialog boxes are both described in Chapter 21.
Gel Marker Operations
These operations are applicable to gel markers only.
189
Vector NTI Advance 10 User’s Manual
z
Table > New > Gel Marker opens the Gel Marker Editor tabbed dialog box (Figure
17.26) where you can enter (or edit data) for a gel marker.
Figure 17.26 Gel Marker Editor tabbed dialog box
You may enter information about the new (or edited) gel marker as follows:
z
General Tab: Enter the name of the gel marker.
z
Gel Marker Tab:
o
Fragments list box: Lists by length all the fragments making up the marker. To add a
fragment to the marker, enter its length in bp in the New Fragment box and click Add.
The fragment is added to the fragment list. To remove a fragment from the marker,
select it in the Fragments box and click the Delete button.
o
Description box: Enter the gel marker’s description.
z
User Fields Tab: Add custom data in a form of fields. For details, refer to page 200.
z
Comments Tab: Enter text comments.
z
Keywords Tab: Enter keywords for the gel marker. For details, refer to page 171.
When the information is correct, choose OK to save the Gel Marker and return to the Database
Explorer.
Citation Operations
The New/Edit Properties dialog box for Citation objects has the following standard object tabs:
General, User Fields, Comments and Keywords. For information about these tabs, refer to the
above sections.
The Edit Properties dialog box for Citation objects has the following unique tabs:
z
Citation Tab – Contains information about the citation, such as title, authors and reference lookup information.
z
Abstract Tab – Contains the abstract for the citation.
z
MeSH Tab – MeSH is the National Library of Medicine’s controlled vocabulary thesaurus. The MeSH entries on this tab are terms or subject headings found in the selected
citation. These terms can be reviewed, but not edited.
BLAST and Analysis Results Operations
The Edit Properties dialog boxes for BLAST and Analysis Results objects have the following
standard object tabs: General, User Fields, Comments and Keywords. For information about
these tabs, refer to the above sections.
190
Database Explorer Chapter 17
Drag and Drop
You can transfer objects by selecting them and using the LEFT-CLICK + DRAG technique to move
them to another location. The result of drag/drop is equivalent to copy/paste operations, except
that drag/drop leaves the Clipboard contents unchanged.
If you RIGHT-CLICK + DRAG, when you drop, you have the option to Copy [Here] or Cancel the
operation. In case of transfer between subsets of the same database, a third option, Move
Here, allows you to combine two operations: add selected objects to another subset and
exclude them from the current subset. The Move operation is not available if the source subset
has its contents maintained automatically.
Edit Menu Commands
The menu options under Edit are available for all database objects and are typical of other Windows Explorer applications. They are described as follows:
Copy/Paste
z
Copy copies selected database objects and places them in subsets of the same database, local and shared databases, and databases and the file system. Selected objects,
their source and names are copied to the Clipboard. You can also use the Copy button
button (
). This mode of Copy copies meaningful biological data to be pasted into
other biological analysis/management applications.
Notes about Copy:
z
Copy using the Camera button (
), copies data to the Clipboard as it appears on the
computer screen. This is useful for pasting into a word processor during the preparation
of publication documents, etc.
z
Because only one copy can exist on the Clipboard at one time, the Copy command
replaces previous Clipboard contents.
z
Paste pastes copied data in one of four possible locations: (You can also use the Paste
button (
).
z
The same subset of the same database where they were copied. This is an alternative
way to duplicate copied objects.
z
Into another subset of the same database where they were copied.
z
Into another database such as a shared database. The resulting actions create a temporary archive for selected objects1 and import it into the target database.
z
To a file system or vice versa. If you paste copied objects to the Windows 95/98 or Windows NT Explorer, Vector NTI Explorer automatically creates an archive file containing
copied objects2. If you paste files from the Windows Explorer to Vector NTI Explorer, the
files are imported into the target database. Vector NTI Explorer is usually able to recognize the types of the pasted files automatically and take appropriate actions. When it
cannot determine the type of imported files, it allows you to select the type or cancel the
operation.
1. In case the transfer of molecules, the archive may also contain parents of the selected molecules. See the Explorer Options section for details.
2. For molecules, the type of the created file depends on the Explorer settings. See the Explorer
Options section for details.
191
Vector NTI Advance 10 User’s Manual
Note:
If database objects are renamed or modified AFTER you have copied them to the Clipboard,
when you paste the object(s), the changes subsequent to copying are not reflected. Remember
that the actual data is collected when you copy it, not when you paste it.
Explorer Display Options
The Explorer’s database object pane can work in one of four view modes, selected under the
View menu or by clicking on the View Mode button arrow, displayed at the right end of the toolbar (Figure 17.27): Icons, Small Icons, List and Details. By default, the Database Explorer
shows objects in the Details mode.
Figure 17.27 Display options
In the first three modes, only object icons and names are displayed. The Details view displays
object icons, names and the values of object fields displayed in columns.
Options Dialog Box
To view or modify options related to the current database table display in Vector NTI Database
Explorer, select View > Options to open the Options dialog box (Figure 17.28). To set options
for a table other than the active one, switch to that table first. All of your settings are preserved
between Vector NTI sessions
Figure 17.28 VNTI DB Explorer Options dialog box
Details View Tab
On the Details View tab, you can select the fields to be displayed (in columns) for each object
type, change the order of columns and the text alignment of each column.
Currently displayed columns are listed in the Displayed Fields list box. To customize the displayed columns, in the Available Fields list box, select fields to be displayed and click the (
)
button. To remove fields, select them in the Displayed Fields list, and click the (
) button. To
modify the alignment of displayed data, select among the Alignment radio buttons. The
192
Database Explorer Chapter 17
descending order in the list is the left to right display order of the columns. To modify that, select
fields and use the Move Up and Move Down buttons. Click OK to apply the settings.
This page can also be opened with a right click on any column heading in Database Explorer.
When opened from that source, it is called the Columns page.
Status Bar Tab
This tab allows you to choose the type of information displayed on the Status Bar for a single
selected object in the object pane. The default selection, Description, describes the item
selected. If you select one of the fields, that value for the selected object is displayed. The 1
item selected option simply describes the selection.
Tips Tab
When you pause the mouse pointer over an object in the list pane of the Explorer, a popup message (tip) appears containing information about the object under the mouse pointer. On the Tips
Tab, you can configure what is displayed.
Archives Tab
This tab allows you to choose what should happen to parent molecules when they are not
included in a list of selected molecules to copy from the database to another location. In the
Archives tab, you can choose to expand the set of molecules to include all missing selected molecules’ parents, copy each molecule independently (losing all links to its parents), copy each
molecule while maintaining parental lines via “open” links imported into a database, or copy
sequences of selected molecules to a FASTA file.
Copy Molecule(s) Tabs (DNA/RNA or Proteins Molecules Table)
These two tabs let you select the preferred file format for a single molecule or a set of molecules
export (either via copy/paste or drag/drop to the file system or other programs). Each tab
includes detailed explanations of the available options.
Note:
‘Parents’ for proteins are ‘DNA parents’.
Click OK to apply your settings to database display. All of the settings in the Database Options
dialog box are preserved between Vector NTI sessions.
Modifying Database Object Column Widths
Column width settings can be changed directly. Move the cursor to the divider between columns
where it changes to a two-headed arrow. Drag the divider right or left with the cursor until the
column is the desired width.
Sorting Objects in Database Explorer
If you are in the Details View Mode, click on the column header to sort column contents. Clicking
on the same column header for a second time reverses the sorting order.
To select descending or ascending sorting order for columns, or sort database objects by name
or any of the displayed fields in any view mode, select View > Arrange Icons.
Database Reports
Reports on Database Explorer’s contents, suitable for word processing and spreadsheet programs, can be generated. The Database Objects Pane should contain all objects you would like
to include in the report. If you do not have a subset containing all objects you need, select them
and create a new subset or generate the report on selected objects only.
To prepare a report:
193
Vector NTI Advance 10 User’s Manual
1. Select a database table and object subset. Make sure Explorer is in the Details View mode.
2. To select the objects’ fields to be displayed, right click on a column heading, select Columns, opening the Columns display dialog box. Move the fields between the Fields columns, as described above in the Display View Tab section. Click OK to apply the settings.
3. Sort your objects by clicking on column’s headers.
4. Select Edit > Camera or press the Camera button (
) on the Explorer’s toolbar. In the
Camera dialog box, select the objects to be included in the report its destination.
5. Switch to a word processor, spreadsheet or database application and paste/import the
report data there.
6. Vector NTI copies the report data in one of two different formats, depending on the copy
location:
o
Plain text format with the TAB character used as column separator and the newline
character as a row separator (sometimes called the “CSV” format) when copying to
the Clipboard.
o
Rich Text format (RTF) when copying to a file.
Explorer Shortcuts
Database Explorer offers many shortcuts to make your work more productive:
z
Drag one or more molecules from the local database Explorer window onto the main
Vector NTI window or into other Vector NTI Advance applications
z
Drag molecules or other database objects into subsets
z
Open Windows Notepad and drag/drop a molecule on its window. The molecule is displayed in the text format you chose for file system export. See Copy Molecule(s) Tabs
(DNA/RNA or Proteins Molecules Table) on page 193.
The following is the list of useful Vector NTI Explorer keyboard shortcuts:
Shortcut
Action
F2
Rename
F3
Search
F4
Select table
F5
Refresh
F6 or TAB
Switch to another pane
ENTER
Open selected object
CTRL+ENTER
Show Properties
Table 17.2 Vector NTI Explorer keyboard shortcuts
194
Database Explorer Chapter 17
Open/Save As Dialog Boxes
Figure 17.29 Open and Save As dialog boxes
Many features of Vector NTI Explorer are available in the Open and Save As dialog boxes (Figure 17.29) appearing in many situations such as when you open a Molecule Display window or
save a modified molecule to the database. These dialog boxes display object lists in the same
way the Explorer does. You can:
z
select between Small Icons, List and Details view modes
z
choose object fields to be displayed in the Details mode
z
sort by any one of displayed fields
z
display the Object Properties dialog box for selected objects.
Select the view modes with the buttons on the upper right or from the shortcut menu. Since
there are no menu bars, select Properties (with an object selected), Options or Columns from a
shortcut menu from an object or column header (in the Details view). You can also use the
Properties button (
). The Columns page is managed as described under Details View Tab
on page 192.
Contact Manager
Vector NTI is increasingly used as a communication tool for exchanging information between
researchers. Contact Manager is a tool for creating, updating, deleting and organizing contact
records.
195
Vector NTI Advance 10 User’s Manual
To launch Contact Manager, select Database > Contact Manager:
Figure 17.30 Contact Manager dialog box
The Contact Manager dialog box displays a list of all stored contact records (Figure 17.30).
Many user interface features of the Contact Manager are similar to those of the Open/Save As
dialog boxes described above. You can choose record properties to be displayed, sort by any
one of the displayed properties and display the record properties dialog for selected objects. For
operations on the Contact List, press one of the following buttons:
Add New or Edit Contact Records
z
Click the New (
) or Edit buttons (
) to open the Contact Information dialog box
(Figure 17.31), where you can enter new data or edit the data for a current contact. Only
the Name box is mandatory for the new contact record. All other fields may be left empty
and edited later if you don’t know the appropriate data.
Figure 17.31 Contact Information dialog box
Choose OK to save the contact record and return to the Contact Manager.
z
Delete (
) deletes the selected contact record from the list. Confirmation is requested
before the contact record is deleted.
z
196
Rename (
) changes the name of the selected contact record in an edit box.
Database Explorer Chapter 17
z
Properties (
) displays the properties of the selected contact record. Only indexed
contact fields—Telephone and E-mail—are displayed in the Properties dialog box. Use
the Edit operation to view/edit the entire contact record.
User Field Manager
The User Field Manager dialog box maintains a list of user field definitions necessary to provide
an appropriate description of the object. Some interface features of the User Field Manager are
similar to those of the Contact Manager just described. You can add User Field Definitions,
select properties to be displayed, sort by displayed properties and modify User Field Definition
properties.
Tip:
To walk through a detailed exercise using the User Field Manager to create a new field definition
and apply its values to a group of database objects, see Tutorial: Database Explorer in Chapter
7.
Select Database > User Field Manager, opening the User Field Manager dialog box (Figure
17.32):
Figure 17.32 User Field Manager dialog box
The operation buttons in the upper left corner perform various operations, described below, on
the User Field Definitions. Select the User Field Definition in the list, then press the appropriate
button. The add New operation does not require any items to be selected.
Note:
You cannot use the exact name of a system field (see the System Fields Table on page 168) as
the name of a new User Field you define. Vector NTI field names are case-sensitive. If you
really want to name your field ‘Default’, you could use ‘default’ or ‘DEFAULT.’
z
Add New (
) or Edit (
) (with a field selected) opens the User Field Definition dia-
log box (Figure 17.33) where you can create or edit User Field Definitions.
197
Vector NTI Advance 10 User’s Manual
Figure 17.33 User Field Definition dialog box, where you can create or edit User Field Definitions
z
Name: In the text box, enter (or edit) the name of the new user field. The user field will
appear under this name in the descriptions of database objects and in the Database.
z
Type: Select the data type that the user field will accommodate from the data type
choices listed in the drop-down menu:
z
o
String - arbitrary text string, including numbers and symbols (e.g. a word, sentence or
description)
o
Yes/No - binary field which may be set only to “Yes” or “No”
o
List of Strings - list of arbitrary text strings of any length
o
One of Predefined Strings - field which may be set only to one of predefined text
strings from a user-defined list
o
List of Predefined Strings - field which may be set only to any subset of predefined
text strings from a user-defined list
o
List of URLs – list of web addresses.
Cached Fields: Any User Field can be indexed and “cached” in the database tables.
Cached fields are stored in a special memory subsystem from which they can be more
quickly recalled. To cache a User Field, check Cache in the Index Table. Because
cached fields occupy more RAM in your computer, we recommend caching only frequently used fields, for instance, those displayed in the Database Explorer in the Details
mode of the Vector NTI Explorer or in the Open/Save As dialog boxes.
If Vector NTI Explorer slows down when displaying an object’s fields in the Details View mode,
open User Field Manager, select the field, press the Edit button and cache the field. Because
cached and ordinary fields have no functional differences, you can turn this option on or off any
time you need it.
198
z
Default Values: Any User Field may have a default value or values that are displayed
when you attempt to fill the previously blank field of the database object. To change the
default, click the Change button.
z
Predefined Values: This section is enabled only for fields of the One of Predefined
Strings and List of Predefined Strings types. For those fields, enter one or more value
strings to choose from. These values are displayed as a list of available options when
you try to fill or change the actual object’s fields. Use the text box and the < Add and >
Delete buttons to define the predefined values for the User Field.
z
Description: Enter a description of the field to help you fill or edit the value of the field in
a database object. The description entered here is displayed in the field value dialog box
Database Explorer Chapter 17
for this field as well as the popup label displayed whenever you pause the cursor on the
field name in the User Field’s tab of object editors (see below).
Note:
To save space on your computer’s screen and still allow you to see which predefined values are
selected, you may define these values using the ‘abbreviated’ format: abbrev=full form as
shown below (these are some of predefined values for a sample “Commercial Sources” field for
enzymes):
A=Amersham Life Sciences-USB
B=Life Technologies Inc, Gibco-BRL
C=Minotech Molecular Biology Products
D=Angewandte Gentechnologie Systeme
Vector NTI displays only abbreviated form (for example A, B, D) in the Explorer windows and
other places, but you will see the full forms in value-editing dialogs.
Click OK to return to the User Field Manager.
When you have edited data, Vector NTI automatically rebuilds the database indices.
Back in the User Field Manager:
z
Rename (
) lets you change the name of a selected User Field. In the enabled text
box, change the field name. After renaming a User Field, Vector NTI automatically
rebuilds the database indices.
z
Delete (
) deletes a selected User Field Definition from the Field Definitions list and,
optionally, to delete field values from database objects. Confirmation is requested before
deletion.
z
You are also asked to confirm whether to delete the appropriate User Field values from
all database objects. Deleting only the User Field Definition does not affect consistency
of the database information. When you delete the Field Definition from the list, Vector
NTI no longer prompts you to fill this field in new objects and existing objects where it
was blank. However, unless you delete the field value from database objects, Vector NTI
still stores and displays the existing field data in the database objects. If you try to edit
the existing value of that “unlisted” field in any database object, Vector NTI will ask you to
add the definition of the field back to the User Field Definition List before proceeding.
z
Properties (
) display the properties of the selected User Field Description. These
properties can be also displayed in the User Field Manager dialog box by opening the
shortcut menu from the list headings and selecting Columns.
Import/Export
To simplify the maintenance and sharing of User Fields across several databases and/or several
computers, you can save your User Field Definitions as “archives.”
To export User Field Definitions to the archives, click the Export button. In the dialog box that
opens, select the definitions to be exported and click OK. In the Export User Field Definitions To
dialog box, locate the directory and archive file name for storing the exported definitions. Click
Save to create the archive.
To import User Field Definitions from the archive, click the Import button. In the dialog box,
locate the directory and archive file to be read. Click the Open button, initiating the import. After
importing, Vector NTI automatically rebuilds the database indices.
Set In/Clear In
In the User Field Manager, you can assign or “set” a value or clear all values for a particular
User Field in a group of database objects.
z
To set a value for a user field:
199
Vector NTI Advance 10 User’s Manual
Select the user field in Field Definition List (large window). In the database tree in the lower right
corner, select a subset of database objects that the field would pertain to. You may choose all
database objects regardless of their type or a particular subset for database objects of a particular type (molecules, enzymes, oligos or gel markers). If you don’t want to overwrite existing values of the User Field in the selected group of objects, check the Do not overwrite... box.
In the Global Operations section, click the Set <user field > In button. In the dialog box that
opens, specify the field value string to be set and click OK. Vector NTI shows a description of
the action about to be performed, asks for your confirmation, then inserts the specified value
into the appropriate objects in the subset you selected.
z
To clear all values of a user field:
Select the user field. Choose a subset of database objects in the database tree. You can choose
all database objects regardless of their type or a particular subset for database objects of a particular type (molecules, enzymes, etc.)
Click the Clear <user field > In button. Vector NTI warns you of the action about to be performed. If you confirm the operation, it clears the values of the specified user field in the specified objects.
To set or clear fields in a set of individual objects not currently represented by an existing subset, close the User Field Manager, create the required subset in Database Explorer and return
to the User Field Manager. Alternatively, you may change field values in individual objects by
editing them in the Explorer one by one as described below.
Editing User Fields in Individual Objects
When a User Field is defined in the User Field Manager, you can edit it for any database object
using the User Fields tab in the Edit <object name > dialog box (Figure 17.34). To open the Edit
dialog box from Database Explorer, select the object in the Object Pane and click the Edit button (
) or select Edit > <Object Name > or the corresponding command from the shortcut
menu.
User Fields Tab in the Edit Dialog Box
Figure 17.34 User Fields Tab in the Edit dialog box
200
Database Explorer Chapter 17
All of the tabs of this dialog box except the User Fields tab are discussed in the section Operations on Database Objects in this chapter. User Fields shows a list of all User Fields currently
applied to the object being edited and the list of blank fields defined in the local User Field Definition list but not yet specified for the current object.
To set or edit any field, double-click the field name or select the field name and press the
Change Value button. If the field you want to edit is not listed in the local User Field Definition
list, enter the field definition first. When added, the appropriate field value dialog box is displayed. To quickly clear any User Field of the object, select the name of the field and press the
Remove Value button.
User Fields in Molecule Display Windows
You can view and edit User Fields tab from Molecule Display windows. To open the Edit dialog
box, select Edit > <object > Properties or in the Text Pane, select Molecule Properties on the
shortcut menu opened from the topmost folder <Object Name > or click on the (
) box to the
left of the <Object Name > folder.
201
Vector NTI Advance 10 User’s Manual
202
C
H A P T E R
18
MOLECULE DISPLAY WINDOWS; FORMATTING GRAPHICS
Introduction
A Molecule Display window displays text information, including a description of a molecule, features and a graphical map of the molecule and its sequence. For DNA/RNA molecules you can
also see restriction sites, ORFs, motifs, PCR analysis, etc. The Molecule Display window
includes powerful graphical tools allowing you to:
z
manipulate and analyze DNA/RNA and protein molecules
z
visually select fragments of DNA molecules for recombination
z
prepare publication-quality figures
A Molecule Display window enables editing in two modes:
z
Molecule Editing mode: you can modify a molecule’s functional features and restriction
map and sequence. Molecule editing is covered in Chapter 6.
z
Picture Editing mode: you can modify the graphical formatting of the molecule’s image,
allowing you to create publication-quality illustrations.
Molecules can be saved in the Vector NTI Database or as Molecule Documents. Molecule Document files contain all the information from Molecule Display windows, including the molecule
analyses results, as well as graphics display settings you may have formatted or modified for
that particular molecule. Molecules in the database maintain consistency in their internal files
and graphical representation.
203
Vector NTI Advance 10 User’s Manual
Vector NTI Display Window Options Dialog Box
To view or modify Vector NTI display window options, select Edit > Options in the Vector NTI
main workspace or Molecule Viewing window. This opens the Options dialog box (Figure 18.1):
Figure 18.1 Vector NTI Options dialog box
The Options dialog box has five different tabs for setting various Vector NTI parameters:
z
Note:
General – sets Vector NTI start-up/exit, date/time format and molecule display profile
opening options
The Vector NTI Database Explorer can be configured to open automatically with the Vector NTI
main workspace or Molecule Viewing window each time a Vector NTI session is initiated. On the
General tab of the Options dialog box, select Open Local Explorer At Startup.
z
Undo/Redo – sets Graphics and Sequence Pane tracking and undo buffer size parameters
z
Molecule Graphics – sets graphics, font and label formatting options
z
Sequence Editor – sets block format in the Molecule Sequence Editor dialog box
z
Internet – sets Vector NTI HTML pages creation parameters
All settings saved in the Vector NTI Options dialog box are preserved between Vector NTI sessions.
Opening Molecules in Molecule Display Windows
The display window can open for a molecule from the Vector NTI database, from a Molecule
Document File or from a file in a public format recognized by Vector NTI: GenBank/GenPept,
EMBL/SWISS-PROT, BLAST, and FASTA.
Molecule Database Files
Molecules are stored in the Vector NTI database as GenBank/GenPept, EMBL/SWISS-PROT,
BLAST, or FASTA files.
204
Molecule Display Windows; Formatting Graphics Chapter 18
Molecule Document Files
Molecule Document files saved in Vector NTI contain all the information contained in a Molecule
Display window such as graphical representation and molecule analysis results as well as the
molecule itself in a portable format suitable for information exchange. Because the Molecule
Document format is based on GenBank/GenProt, any other program able to import GenBank/
GenProt files could import Molecule Documents.
All molecule document files, imported and even those created within Vector NTI, are considered
external files. Vector NTI restricts the set of operations you can perform on molecules opened
from external files. To be able to perform all molecule operations on a molecule from a Molecule
Document, you will be prompted to first save the molecule in the Vector NTI database.
When opening a molecule from an external file, you can view it in a Molecule Display window
before saving it into the Vector NTI database. You still need to save the molecule in the database to analyze it, construct other molecules from it, etc.
Opening a Molecule from the Database
z
From Vector NTI’s Database Explorer:
Select the molecule table and subset in the upper left corner. In the Database Objects Pane,
scroll to the molecule and select <molecule type > > Open on the Main Menu bar or doubleclick on the molecule name in the list.
z
From the Vector NTI workspace or a Molecule Display window:
Click the Open Document button(
) on the main toolbar or choose File > Open. In the Open
dialog box (Figure 18.2), select either the Database DNAs/RNAs or Database Proteins tab.
Figure 18.2 Database DNAs/RNAs tab of the Open dialog box
From the Look In drop-down menu, select the subset where your molecule is located, scroll to
the molecule, select it and double-click on it or click OK.
The Properties button (
) in the Open dialog box is to modify the default set of parameters
used to create the Molecule Display window contents. See page 215 for details on Molecule
Display Setup.
Note:
The number of data fields displayed for objects in the Open dialog box can be modified. Select
Options from the shortcut menu associated with this dialog box. In the Options dialog box that
opens, select fields from the Available Fields list, press the(
) button to move them to the Dis-
205
Vector NTI Advance 10 User’s Manual
played Fields list. For more information on using this dialog box, refer to page 192 in Chapter
17.
Opening a Molecule from a Molecule Document File
To open a molecule from a Molecule Document file, click the Open Document button(
) on
the main toolbar or choose File > Open. In the Open dialog box, select the Molecule Files tab.
Browse to the location of the molecule file, select it and click OK.
Opening a Molecule from a Molecule Shortcut File
Molecule Shortcut files contain the names of database molecules along with the Display Setup
parameters. When you open a database molecule via the Shortcut file, Vector NTI uses the Display Setup parameters stored in the file.
To open a database molecule via a Shortcut file, choose File > Open Shortcut. Select the
name of the Shortcut file from the file list. To set up a Molecule Shortcut file, see page 232.
Elements of a Molecule Display Window
Figure 18.3 Molecule Display window
A Molecule Display window is divided into three panes: a Text Pane (upper left), a Graphics
Pane (upper right) and a Sequence Pane (bottom) (Figure 18.3).
The Molecule Display window title bar shows the name of the open molecule. Vertical and horizontal split bars separating the panes can be moved using the click and drag technique to resize
the viewing areas.
Each pane has scroll bars when the pane contents exceed the viewing area. These allow vertical and horizontal movement through the pane.
The Text Pane has folders containing descriptions and analyses of the molecule currently open.
The Graphics Pane displays a graphical depiction of the molecule map. Features, restriction
sites, motifs, etc. are shown by symbols. Each symbol typically has a label connected to it by a
dropline.
206
Molecule Display Windows; Formatting Graphics Chapter 18
The Sequence Pane of a DNA/RNA molecule depicts the nucleotide sequence with selected
functional signals, restriction sites, motifs, ORFs, and protein translations. The Sequence Pane
of a protein molecule displays the amino acid sequence and selected features.
Menu Bar and Toolbars
The menu options for the Molecule Display window are discussed when corresponding operations are described. Many menu options have corresponding toolbar buttons and shortcut menu
commands.
Many objects and features have associated shortcut menus opened with a right click on the
item.
The Main Toolbar remains fairly consistent through Vector NTI Advance, while other toolbars
vary according to the display window and the active pane. Because Vector NTI has many toolbars corresponding to different display windows, active panes and applications. Most toolbar
buttons have associated tool tips that explain the button function. Hover the cursor over the button to display the tool tip for that button.
The Text Pane
The Text Pane of a Molecule Display window contains a thorough description of the molecule,
including common database information, Feature map, and results of analyses as well as molecule type-specific information such as restriction maps, ORFs, motifs for DNA/RNA molecules
and physiochemical analyses. The content of the Text Pane depends on a specific Display
Setup.
Folders
The Text Pane is divided into a hierarchy of folders and subfolders. A folder and its subfolders
are called a branch. Text Pane can contain the following folders:
Folder
Contents
General Description
Molecule name, length, notes, etc.
Standard Fields
All standard field descriptions in the molecule’s file: for example, keywords, original source, public database IDs.
Component Fragments (DNA/
RNA)
Describes the fragments from which the molecule is constructed
Design Description (DNA/RNA)
Design plan determined by Vector NTI’s built-in biological
knowledge
References
Literature references applying to the molecule
Feature map
Feature map of the molecule
Restriction Map/Methylation Map
(DNA/RNA)
Restriction enzyme cutting and methylation site information for
the molecule for those enzymes chosen for display
Open Reading Frames (DNA/
RNA)
ORFs found on the molecule
Motifs (DNA/RNA)
Motifs found on the molecule
PCR Analysis (DNA/RNA)
Results of PCR analysis
Sequencing Primers (DNA/RNA)
Results of sequencing primer search
Hybridization Probes (DNA/RNA)
Results of hybridization probes analysis
Table 18.1 Text Pane folders on the Molecule Display window
207
Vector NTI Advance 10 User’s Manual
Folder
Contents
Protein Analysis (Proteins)
Results of common physiochemical analyses
Annotations
Text annotations added by the user
Table 18.1 Text Pane folders on the Molecule Display window (Continued)
Note:
Among the different types of molecules present in the Vector NTI Database are InvitrogenTM
(
) Proprietary Molecules. One hundred of the most commonly used, fully annotated, Invitrogen vectors are available in the database. When working with these specific molecules,
included in the Text Pane is a hyperlink to the Invitrogen website providing you with relevant
information, annotated features and related reagents pertaining to that molecule.
Opening and Closing Text Pane Folders
The general rules for opening and closing Text Pane folders and subfolders are summarized as
follows:
z
Click on the + at the left of the folder name to open it; click on the – to close it.
z
Double click on a folder name to open it; double click again to close it.
z
Click on the Expand Branch button (
) to open it; select View > Expand All to open
a folder and all of its subfolders. Click on the Collapse Branch button (
related folders.
) to close all
Finding Molecule Features on Graphics and Sequence Panes
To display molecule features described in the Text Pane in the corresponding region of the molecule in the Graphics and Sequence Panes, open the folder containing the feature and select
the feature by clicking on its name. Click the Find button (
). The corresponding region is
marked with a wire-frame in the Graphics Pane and highlighted in the Sequence Pane.
The Graphics Pane
The Graphics Pane graphically displays molecule maps, including features, restriction sites, and
motifs, and user annotations. Features represented as clockwise arrows appear on the direct
DNA strand; counter-clockwise arrows represent features on the complementary DNA strand.
Circular and Linear Displays
Circular DNA molecules can be displayed in either circular (Figure 18.4) or linear form (Figure
18.5). Linear DNA/RNA molecules and proteins can only be viewed in linear form.
208
Molecule Display Windows; Formatting Graphics Chapter 18
Choose circular/linear display format with the Circular Display(
) or Linear Display(
)
buttons on the toolbar of the Graphics Pane or with the equivalent commands in the View menu.
Figure 18.4 DNA molecule displayed in circular form
Figure 18.5 DNA molecule displayed in linear form
Standard Arrangement
Standard Arrangement sets all symbols to standard sizes, sets labels to a standard font size,
and arranges text to prevent or to minimize overlap. When a display window opens, it appears in
its default Standard Arrangement settings. After modifying graphics formats, you can return a
Graphics Pane to its Standard Arrangement by clicking the Standard Arrangement button
(
) on the Graphics Pane Window toolbar or choosing View > Standard Arrangement.
While certain changes you have made to the layout in the Picture Editing mode such as label
repositioning are lost, many object attributes such as colors, patterns, and font as well as relative symbol sizes are unaffected. Hidden objects remain hidden and the way objects overlap is
not affected.
209
Vector NTI Advance 10 User’s Manual
Setting up the Standard Arrangement
To change the sizes of symbols and labels in the Standard Arrangement, press CTRL + the Standard Arrangement button (
ette:
) on the Viewer toolbar, opening the Arrangement Setup Pal-
The palette has three sets of buttons:
z
Stretch Symbols(
) and Shrink Symbols(
) buttons respectively increase and
decrease the standard thickness of symbols by ~15%. Hold down the SHIFT key while
pressing a button to change thickness in small increments.
z
Stretch Labels(
) and Shrink Labels(
) buttons respectively increase and
decrease the standard size of labels by ~15%. Hold down the SHIFT key while pressing a
button to change size in small increments.
z
Spread Labels (
) and Condense Labels (
) buttons respectively spread out and
compress labels on the linear layout. Hold down the SHIFT key while pressing a button to
move labels in small increments.
Click the Standard Arrangement button again to close the palette.
Selecting Signals and Sites
In the Graphics Pane, elements of the functional and restriction maps, ORFs, and motifs can be
selected, enlarged or reduced and have various operations performed on them. In brief, to
select regions or sites, use the left click + drag method, or click on the feature or its label.
Selected regions are marked with a wire-frame.
Note:
For detailed instructions on selection and viewing options, refer to Chapter 3.
Viewing a Selected Molecule Region
Although a display window always shows an entire molecule, the window can be configured to
show only a fragment of an opened molecule. This is useful for manipulating a small region of a
larger molecule.
To view only a selected region, activate a Graphics or Sequence Pane and select the targeted
region. Click on the View Molecule Fragment button (
) or select View > View Selection.
Only the selected region of the molecule is now displayed in the Graphics and the Sequence
Panes. The list of functional signals, restriction sites and motifs in the Text Pane now reflects
only those objects located inside the selected region.
To return to the view of the entire molecule, click on the View Molecule Fragment button again
or choose View Whole Molecule from the drop-down menu.
Multi-component Features Display
A multi-component feature is a feature that contains introns and exons. The example shown in
Figure 18.6 has two exons and one intron, shown graphically on a molecule. The ordinary feature is shown as a wide arrow on the Graphics Pane. Coding sequences, or exons, are shown
210
Molecule Display Windows; Formatting Graphics Chapter 18
as filled parts of the arrow, while the intervening sequence, or intron, is shown as a gap within
the arrow.
Figure 18.6 Multi-component feature with two exons and one intron
Selecting and Translating Exons
When a DNA molecule containing a non-contiguous multi-component CDS is open in a molecule display window, the user can translate the exons three ways. Click on any of the exons to
select the entire CDS. Translate commands are enabled on the shortcut menu.
The first two options create a new protein. The last simply displays the translation of the
selected area in the Sequence Pane.
z
Translate Feature into New Protein
This command translates the entire feature into a new protein molecule. Because reading frames may be shifted in translating intron/exon features in this method, the resulting
amino acid sequence may not match the valid protein sequence for intron/exon features
translated in this manner.
In the above case, a new molecule display window opens featuring the new protein.
z
Translate Feature in Sequence Pane
This command displays the translation of the selected feature in the Sequence Pane of
the Molecule Viewing window. A new protein molecule is NOT created.
For more information on Translation, see Translation, page 292. For information on creating a
new molecules by splicing together the exons of a multi-component feature, see Creating New
DNA/RNA or Protein Molecules Using Splicing, page 307.
Changing the Settings for Graphics Pane
For changing Graphics Pane settings, see Display Setup later in this chapter. For editing a molecule or modifying its graphical format in the Graphics Pane itself, refer to Molecule Editing in
Chapter 20.
The Sequence Pane
A Sequence Pane displays a molecule’s nucleotide or amino acid sequence as well as selected
features.
Features
Display
Position on Sequence
Functional features
(labeled)
deep red serrated lines
Above—direct strand; protein
Below—complementary
RENs (labeled)
blue wavy lines
Above only
Motifs (labeled)
deep red serrated lines
Above—direct
Below—complementary
Table 18.2 Selected features of Sequence Pane
211
Vector NTI Advance 10 User’s Manual
Features
ORFs
Display
dark blue arrows
Position on Sequence
Above—direct
Below—complementary
Phase indicators in left margin
Table 18.2 Selected features of Sequence Pane (Continued)
Selective display of these features is defined by corresponding commands under the Analyses
menu option. They can also be defined in Display Setup, discussed later in this chapter.
Changing the Settings for Sequence Display
To change the settings for sequence display, select parameters in the Display Setup dialog box,
discussed in detail on page 215.
Setting an Internal Start Point in the Sequence Pane
By default, Vector NTI numbers the molecule sequence in the Sequence Pane starting with the
number 1, which coincides with the origin of the molecule.
You can create an additional, secondary numbering system in the Sequence Pane display
(DNA/RNA Molecules only) by setting an internal start point. The sequence is numbered starting
with 1 at the internal start point, with increasing numbers to the right of the start point and
decreasing numbers (negative numbers) to left of the start point.
To set an internal start point, choose View > Internal Start Point from the drop-down menu in a
DNA/RNA Molecule Viewing window. The Internal Numbering dialog box displays (Figure 18.7):
Figure 18.7 Internal Numbering dialog box
Enter the number of the base where you want to set the internal start point or press the Current
button to set the number to the current cursor position and then press the OK button. Internal
Start Point numbering is displayed in the Sequence Pane:
Figure 18.8 Internal Start Point numbering in the Sequence Pane. Internal start point is circled.
Note:
Internal start point numbering is considered a form of molecule editing and can, therefore, be
saved as part of the molecule.
Navigating the Sequence
In the Sequence Pane, the cursor becomes an I-beam that you can move with the mouse or the
arrow keys. Pause the cursor over a sequence position for a few seconds, and a pop-up label
identifies its exact position on the sequence.
212
Molecule Display Windows; Formatting Graphics Chapter 18
Selecting Regions of the Sequence
There are several methods for selecting a sequence in the Sequence Pane:
z
Use the LEFT-CLICK + DRAG technique, dragging the cursor across the nucleotides.
z
Select Edit > Set Selection. Enter the residue range in the dialog box that opens.
z
Click on the Set Selection box on the Status Bar, opening the Set Selection dialog box.
Enter the residue range in the dialog box.
The selection range is always display in the Set Selection box on the Status Bar.
The general rule for modifying sequence selections is to hold the SHIFT key (to alter the selection
by small increments) or the SHIFT + CTRL keys (to alter the selection by large increments) as
you press the left and right arrows.
A selected fragment in the Sequence Pane is marked simultaneously with a wire-frame in the
Graphics Pane.
A fragment selected in the Sequence Pane is marked simultaneously with a wire-frame in the
Graphics Pane.
Translations
Translating in the Sequence Pane
Select the region you wish to translate.
To translate in the selected frame in the Sequence Pane, press the Translate Direct
Strand(
) or Translate Complementary Strand(
) buttons in the Window toolbar, or
choose the corresponding commands from the Shortcut menu.
If ORFs are displayed, you can translate ORFs in the Sequence Pane by choosing Translate
ORFs from the Shortcut menu.
Notes:
z
Translations of the direct strand appear above the sequence; translations of the complementary strand appear below the sequence.
z
You can select three- or one-letter amino acid codes through the Display Setup dialog
box, discussed on page 215 in this chapter.
To clear Sequence Pane translations, do one of the following:
z
click the Erase Translations button (
)
z
choose View > Clear All Translations from the drop-down menu
A variety of Sequence Pane translation options, including those mentioned above are available
under the Analyses drop down menu by choosing Analyses > Translation > In Sequence
Pane > <translation option>. For more information on these options, see Translating in the
Sequence Pane, page 293.
Translating into a New Protein Molecule
You can also translate a DNA/RNA molecule Sequence Pane selection into a new Protein molecule stored in the Vector NTI Database. The selected portion of a DNA/RNA molecule can be
translated (direct or complementary strand) and saved in the Vector NTI Database by choosing
the File > Create New Sequence > Using Translation Procedure (Protein) > <strand
option> from the drop-down menu in the Vector NTI Molecule Viewing window.
Other options for translating DNA/RNA selections into new protein molecules are available
under the Analyses drop-down menu by choosing Analyses > Translation > Into New Protein
213
Vector NTI Advance 10 User’s Manual
> <translation option>. For more information on these options, see Translating into a New Protein Molecule, page 293.
Setting the Genetic Code
In Vector NTI, Standard genetic code is used for translations by default. However, you can
choose from among a list of alternate genetic codes or create your own custom genetic code to
use for translations. For instructions on setting the genetic code, see Setting the Genetic Code
for DNA/RNA Translations, page 294.
Phase Indicators for ORFs and Protein Translations
Phase indicators in the left margin of the Sequence Pane show the phases of ORFs and protein
translations. For translations of the direct strand, the phase is determined by the position of the
first selected nucleotide relative to the beginning of the molecule. For the complementary
strand, the phase is determined by the position of the last selected nucleotide relative to the end
of the molecule.
Finding DNA/RNA Sequence Fragments
To quickly find a defined fragment on a sequence, in the Sequence (or Graphics) Pane, click the
Find button (
), select Edit > Find Sequence or press CTRL + F. In the Find Sequence dialog
box (Figure 18.9), enter the desired sequence, indicate the strand to search, choose exact or
degenerate matching and set the acceptable mismatch tolerance. The sequence can contain
any standard IUPAC symbols for nucleotide sequences. (See Appendix C.)
Figure 18.9 Find Sequence dialog box (DNA)
Press the Find Next button. The search begins from the current caret position or the current
selection. A located fragment is automatically selected in the Sequence Pane. If none are found,
the caret does not move from its current position.
Finding Protein Sequence Fragments
To quickly find a defined fragment on a sequence, in the Sequence (or Graphics) Pane, click the
Find button (
), select Edit > Find Sequence or press CTRL + F. In the Find Sequence dialog box (Figure 18.10), enter the desired sequence and set the acceptable mismatch tolerance.
214
Molecule Display Windows; Formatting Graphics Chapter 18
The sequence can contain any standard IUPAC symbols for amino acid sequences. (See
Appendix C.)
Figure 18.10 Find Sequence dialog box (Protein)
Click the Find Next button. The search begins from the current caret position or the current
selection. A located fragment is automatically selected in the Sequence Pane. If none are found,
the caret does not move from its current position.
Change Text Character Display Attributes
Character display attributes in the Sequence Pane can be changed in a manner as you would in
a word processor program. To change the font name, font size, font color and font attributes
(bold, italic, underline) for any character in a nucleotide sequence, highlight these characters
and click the corresponding buttons on the toolbar. For further information, refer to Chapter 3.
To preserve text formatting between sessions, save the Vector NTI molecule as a Molecule Document.
Cut, Copy and Paste
To Cut, Copy, or Delete a region of the molecule’s sequence, select the region and choose the
appropriate command from the Edit menu. If a region to be deleted overlaps with features, a
confirmation dialog box opens, allowing you to keep or remove affected features. All the features inside the deleted region will be removed without confirmation; positions of other features
will be adjusted accordingly.
A copied sequence is placed on the Clipboard in the standard text format, so you can freely
exchange the sequence data between Vector NTI and other applications. All sequence formats
recognized by Vector NTI can be pasted from the Clipboard. Sequence formats are described in
detail in Chapter 14 (Import section).
To paste a sequence from the clipboard, set the cursor to the insert position. Choose Edit >
Paste Sequence, opening and displaying the sequence in the Insert Sequence dialog box.
Click the OK button, and the sequence is inserted at the cursor position. If the insertion point is
within a feature, a confirmation dialog box opens, to let you keep or remove the affected features. The positions of all features surrounding the insertion point are updated automatically.
Insert a new sequence fragment manually by setting the cursor at the insertion point; choose
Edit > New > Insert Sequence. In the Insert Sequence dialog box, enter the sequence to be
inserted. For more information on editing a sequence, see Chapter 19.
Editing a Molecule Sequence
Instructions for editing a molecule sequence and its text attributes are found under Molecule
Editing in Chapter 19.
Molecule Display Setup
Vector NTI uses Display Setup parameters to create the Molecule Display window contents. You
can edit Display Setup before or after a display window is created, assign names to different settings and store them as a Setup profile, and change the default Setup settings.
215
Vector NTI Advance 10 User’s Manual
To open the Display Setup dialog box, click the Display Setup button (
bar. Select Display Setup from the drop-down menu.
) on the Window tool-
The Display Setup dialog box has two forms, one for DNA/RNA molecules and another for proteins. The type of Molecule Display Setup dialog box that opens corresponds to the type of molecule display window from which it was launched (i.e. If you launch the Display Setup dialog box
from a DNA/RNA Molecule Viewing window, the DNA/RNA Molecule Display Setup dialog box
opens; if you launch the Display Setup dialog box from a Protein Molecule Viewing window, the
Protein Molecule Display Setup dialog box opens.
DNA/RNA Display Setup
The following figure (Figure 18.11) is the Display Setup dialog box for DNA/RNA Molecules:
Figure 18.11 Display Setup dialog box for DNA/RNA molecules
To apply a previously saved Setup Profile to a current display window, select the Profile in the
Setup Profile drop-down menu. Click OK.
Use the check boxes to indicate the information to be displayed in the Molecule Display window.
Click on the Setup buttons (described below) to open corresponding dialog boxes where you
can specify in more detail what information should be displayed for each category. Click OK in
each to return to Display Setup.
Feature Map Setup
Check the Feature Map check box and click the FMap Setup button to select the types of features to be displayed in the Display window’s Sequence Pane. Some features appear by default
in the Text and Graphics Panes. The Feature Map Setup dialog box appears (Figure 18.12):
Figure 18.12 Feature Map Setup dialog box
216
Molecule Display Windows; Formatting Graphics Chapter 18
Click the < Add button to select one or more of available feature types. Click the > Remove button to remove previously selected feature types or >> Remove All empties the entire list.
You can limit the features shown in the Sequence Pane according to feature length. To set a
feature length limit, enter the maximum feature length in bases in the textbox in the lower left of
the FMap Setup dialog box. Leave the textbox blank for no limit.
Motifs Setup
Check the Motifs checkbox and press the Motifs Setup button to open the Motifs Setup dialog
box (Figure 18.13) that controls the motifs map display.
Figure 18.13 Motifs Setup dialog box
The list box in the upper part of the dialog box contains motifs already chosen for a search.
z
Add New – Adds new motifs and Edit lets you edit a highlighted motif. Both of these
operations take place in the Oligo Editor dialog box.
z
Oligo Database – Uses the Vector NTI oligo database as a source for motifs to be
searched for.
z
Oligo List – Loads oligos from the Oligo List.
z
Remove – Removes selected motifs.
z
Remove All – Removes all listed motifs.
z
Save To Database – Saves the selected motif to the oligo database.
z
Edit – Allows you to edit the selected motif.
z
Analyze – Initiates an analysis of a highlighted motif.
z
Find Sites – Press the Similarity button to specify the similarity between motif and molecule sequence for the motif’s site to be accepted. In the Find Motif Locations dialog box
(Figure 18.14) that opens, choosee the method for calculating the similarity and the similarity requirements.
Figure 18.14 Find Motif Locations dialog box
217
Vector NTI Advance 10 User’s Manual
z
With Best Similarity Only selects only those motif sites that received the best relative
score
z
With Similarity >= Similarity Threshold displays all motif sites that have a similarity
more than or equal to the similarity you specified in the Similarity Threshold box.
z
To filter out all the motif sites that do not meet the specific requirement for 3’ end similarity, check the Last box and enter the number of nucleotides on 3’ end that should have
100% similarity.
Any motifs that have more sites than specified in the Maximum Number Of Sites box in the
Motifs Setup dialog box (Figure 18.13) are displayed as grayed-out folders in the Text Pane;
they are not displayed at all in graphics or Sequence Panes.
Similarity Between Ambiguous Nucleotides specifies acceptable similarity between ambiguous nucleotides (if any). The Average, Minimum, and Maximum buttons indicate that the average, minimum, and maximum possible similarity will be calculated respectively for any
nucleotide pair. For instance, if you are calculating similarity between N and A, then the average
similarity is 25%, the minimum similarity is 0%, and the maximum similarity is 100%. In case of
R and A they are 50%, 0%, and 100%; in case of R and T—0%, 0%, and 0%. For clarification of
these IUB nucleotide symbols, see Appendix C.
N-N
N-R
N-A
R-W
R-A
R-T
Maximum
100
100
100
100
100
0
Average
25
25
25
25
50
0
Minimum
0
0
0
0
0
0
Table 18.3 Average, minimum, and maximum possible similarity
Click OK to return to the Motifs Setup dialog box.
218
z
Sorted By Select the motifs sorting procedure to be used for the Motifs folder. Choose
the Motif String radio button to sort motifs alphabetically or the Number of (Recognition) Sites radio button to sort motifs by their number of sites on the molecule.
z
Strands to Search Turn these boxes on or off to specify the strand(s) to be searched.
z
Ignore Outside / Ignore Inside Enter these regions to specify additional limitations on
the motif sites to be displayed. Specify the Ignore Motifs With Sites Outside Region to
display only those motifs located inside the region. Specify the Ignore Motifs With Sites
Inside Region to display only those motifs located outside the region.
Molecule Display Windows; Formatting Graphics Chapter 18
Sequence Setup
Check the Sequence checkbox and press the Sequence Setup button to indicate how the
sequence should be displayed in the Display window’s Sequence Pane. The Sequence Setup
dialog box appears (Figure 18.15):
Figure 18.15 Sequence Setup dialog box
Set the number of nucleotides per block in the sequence display (10 is default), the number of
blocks per line (5 is default) and whether protein translations should be shown in one- or threeletter code (three is default). Check the Prefer Single-Stranded Display box if you prefer the molecule sequence displayed as single-stranded in the Sequence pane. Set the default font name,
size, color and effect characteristics.
Restriction Map Setup
Check the Restriction Map checkbox and press the RMap Setup button to specify the restriction sites to be displayed. The Restriction Map Setup dialog box (Figure 18.16) displays in the
Use Enzymes column the restriction enzymes, also called RENs, whose sites are shown by
default.
To remove enzymes from the display list, select the enzyme and click > Remove. The >>
Remove All button clears the list. Click the < Add button to select database enzymes to be
added.
After clicking the < Add button, to quickly move to the vicinity of the enzyme of interest in the
Choose Database Enzymes dialog box enzyme list, highlight the first enzyme name on the list
and, using the keyboard, type the first letter (or first few letters, quickly) of the name of the
enzyme of interest. The enzyme list scrolls to the vicinity of that enzyme (Note: For this technique to work, the enzyme list must be sorted alphabetically by enzyme name. To sort the list
219
Vector NTI Advance 10 User’s Manual
alphabetically by enzyme name, click on the Name column header in the Choose Database
Enzymes dialog box.).
Figure 18.16 Restriction Map Setup dialog box
z
The Sort Site… radio buttons determine how the restriction sites are displayed in the
Text Pane. Enzyme Name sorts the RENs alphabetically. By Number of Recognition
Sites sorts the RENs by the number of their sites on the molecule.
z
Permitted Terminus Types check boxes filter the types of RENs displayed.
z
Ignore RENs Having Less Than/More Than … Sites removes from the restriction map
RENs that do not fall with in the specified cut site range. Such RENs will be listed but
grayed out in the Restriction Map folder in the Text Pane. They will not be displayed at all
in the graphics and Sequence Panes.
z
Ignore RENs Cutting Outside Region causes only those enzymes with sites inside the
region to be displayed.
z
Ignore RENs Cutting Inside Region causes only those enzymes with sites outside the
region to be displayed.
Picture Type Checkbox
If you check the Prefer Linear checkbox in Display Setup, Vector NTI uses linear display for
both circular and linear molecules.
ORF Setup
Check the ORFs checkbox and press the ORF Setup button to open the ORFs Setup dialog
box (Figure 18.17) for specifying how open reading frames are displayed.
Figure 18.17 ORFs Setup dialog box
220
Molecule Display Windows; Formatting Graphics Chapter 18
z
In the Minimum ORF Size field, enter the minimum ORF size in codons.
z
Check the Nested ORF check box to look for nested ORFs (ORFs that have the same
stop codon but different start codons.)
z
In Start and Stop Codons fields, enter start and stop codons for the new viewer’s
ORFs. Press the Default Start & Stop button to set the start and stop codons to the following conventional values: Start codons—ATG, GTG; Stop codons—TAA, TGA, TAG.
z
Check the Include Stop Codon in ORF box if you want the stop codon to be considered
part of the ORF. Otherwise, the stop codon is not considered part of the ORF and is not
included.
Incomplete ORFs
Note:
z
Undefined Start/Undefined Stop: Check the appropriate box, depending on whether
you want to search for ORFs with undefined starts, stops or both.
z
Minimum Size: Specify the minimum size in base pairs for the incomplete ORF to be
displayed.
Incomplete ORFs are displayed as a dashed arrow in both the Graphics and the Sequence
Pane. Complete ORFs are displayed as solid arrows.
ORF Names
z
Old Style: ORF# (sequential)
z
New Style: Nucleotide position of ORF start, direct or complementary, sequential #
Analyses Setup
Check the Analyses checkbox and press the Analyses Setup button to open the Analyses
Setup dialog box (Figure 18.18). In the Analyses Setup dialog box you can specify the analyses
to be shown in the Sequence and Graphics Panes and in the External Analyses folder in the
Text Pane.
Figure 18.18 Analyses Setup dialog box
From the Available Subsets drop-down box, choose the Vector NTI Database subset of saved
analyses you want to display. Click the >> button to move the selected subset into the Load
Analyses Results from Subset section. All analyses listed in this subset are shown in the Molecule Viewing window.
221
Vector NTI Advance 10 User’s Manual
Graphics Display Settings
You can edit the graphical styles for graphical map elements directly from the Display Setup dialog box or in the Graphics Pane in Picture Editing mode. Click the Edit button in the Graphics
Display Settings group, opening the Graphics Display Setup dialog box (Figure 18.19).
Figure 18.19 Graphics Display Setup dialog box
Select the graphical map element type and define the shape and style for a particular symbol
picture as well as the style for a label attached to the symbol picture. Add new styles by clicking
the More buttons (one button adds label styles, another adds symbol styles). When the styles
are defined, click OK.
Note:
You can also edit existing styles directly in the Graphics Pane of a Molecule Display window as
described later in this chapter.
Save To File/Load From File
Display settings configured in the Molecule Display dialog box can be saved to and loaded from
external files on your hard drive. To save the current Display Setup profile to an external file,
click the Save To File button and enter a name and storage location for the new Molecule Setup
file. To load a previously saved Display Setup file, click the Load From File button and navigate
to the location of the file on your hard drive. Select the Setup Profile from the dialog box; the
selected settings are applied to the current Molecule Display window.
Setup Profile
The upper part of the Display Setup dialog box contains a list of saved setup settings called
Setup Profile. Add your newly defined settings to the Profile list by clicking the Save Settings
As button. Enter a name for these settings and click OK. In the future, you can apply at once all
of the settings saved in a Profile to a new molecule opened in a Molecule Display Window. Open
a saved setting by selecting the Profile name in this list or View > Display Profile.
Vector NTI always uses the default Display Setup when you open a molecule from the database
in a new Molecule Display window, with two exceptions:
1. As you open a molecule from the Vector NTI workspace window, you can specify the Display Setup for the new display window. To do this, choose File > Open from the Vector NTI
window, select the Database tab for the type of molecule you want to open (DNA/RNA or
Protein) and click the Display Setup button. In the Molecule Display Setup dialog box that
opens, select the Settings Profile you want from the list of saved profiles.
2. If you open a molecule from the database via a Molecule Shortcut file, the settings stored in
the shortcut file are used instead of the (Default) entry in the Setup Profile.
222
Molecule Display Windows; Formatting Graphics Chapter 18
Protein Molecule Display Setup
The options in the Display Setup dialog box (Figure 18.20) for a protein differ slightly from that
for nucleic acid molecules.
Figure 18.20 Display Setup dialog box for a protein
Feature Map Setup
With a protein in the Molecule Display window, press the FMap Setup button to select the types
of features to be displayed in the Display window’s Sequence Pane. (Many features appear by
default in the text and Graphics Panes.) The Feature Map Setup dialog box for proteins differs
from that for DNA/RNA only in the features listed. The functionality of the dialog box is identical
to the DNA/RNA Feature Map Setup box. See page 216.
Click the < Add button to select one or more of available feature types. Click the > Remove button to remove previously selected feature types. Click the >> Remove All button to delete the
list.
Motifs Setup
Click the Motifs Setup button to open the Protein Motifs Setup dialog box (Figure 18.21) that
controls the protein motifs map display:
Figure 18.21 Protein Motifs Setup dialog box
Note:
The list box in the upper part of the dialog box contains motifs already chosen for a search.
Features of the Protein Motifs Setup dialog box (Figure 18.21) their associated subdialog boxes
are described in the following bullets:
223
Vector NTI Advance 10 User’s Manual
z
Add – Launches the All Protein Motifs dialog box (Figure 18.22).
Figure 18.22 All Protein Motifs dialog box
In the All Protein Motifs dialog box, highlight the motifs for which you wish to search and click
the OK button to enter the selected motifs into the Protein Motifs Setup dialog box (Figure
18.21).
In the All Protein Motifs dialog box, you can also create new motifs and add them to the motifs
list by clicking the Add New button. You can edit an existing motif by highlighting the motif and
clicking the Edit button. Clicking either the Add New or Edit buttons in the all Protein Motifs dialog box launches the Protein Motif Properties dialog box (Figure 18.23):
In the Protein Motifs Properties dialog box, you can create and edit motif patterns.
Figure 18.23 Protein Motif Properties dialog box
To define a new pattern, type the pattern in the New Pattern String box. Click the Add to Patterns button to add the new pattern to the current list of patterns. To remove a pattern from the
list, click the Remove button. To remove all patterns from the list, click the Remove All button.
z
Remove – Removes selected motifs.
z
Remove All – Removes all listed motifs.
z
Find Sites – Specify the similarity between motif and molecule sequence for the motif’s
site to be accepted. Select the method for calculating the similarity and the similarity
requirements.
z
224
o
Find Best Fit – Finds only those motif sites that have the best relative similarity.
o
With Similarities Not Less Than – Finds motif sites with similarity equal to or
greater than the specified percent similarity. Number of sites found is limited by the
Maximum Number of Sites value specified.
Similarity for Ambiguous AA – Specifies the acceptable similarity between ambiguous
amino acids, based on the Minimum, Average or Maximum similarity for any amino acid
Molecule Display Windows; Formatting Graphics Chapter 18
pair. For an example of similarity calculations, see the Similarity Between Ambiguous
Nucleotides bullet of the DNA Motifs Setup section on page 217.
z
Sorted By – Select the motifs sorting procedure to be used for the Motifs folder in the
Text Pane. Choose the Motif Name radio button to sort motifs alphabetically or the
Number of Sites radio button to sort motifs by their number of sites on the molecule.
z
Ignore Outside / Ignore Inside Enter these regions to specify additional limitations on
the motif sites to be displayed. Specify the Ignore Motifs With Sites Outside Region to
display only those motifs located inside the region. Specify the Ignore Motifs With Sites
Inside Region to display only those motifs located outside the region.
Sequence Setup
Click the Sequence Setup button to open the Sequence Setup dialog box (Figure 18.24):
Figure 18.24 Sequence Setup dialog box
In this dialog box, set the number of amino acids per block in the sequence display and the
number of blocks per line. Set the default font name, size, color and effect characteristics. A
sample of the designated configuration appears in the lower text box.
Picture Type
Ordinarily, if you select a protein fragment and click the View Selected Fragment button for
closer inspection, the selected region “expands” to fill the entire Graphics Pane. If the Prefer
Constant Horizontal Resolution check box is checked in the Protein Display Setup dialog box,
the current protein display is “not scalable,” meaning that the current visual length of graphics
features is retained instead of stretching the picture to fit in the window.
Analyses Setup
The Display Setup Analyses settings for proteins are managed as explained on page 221.
Graphics Display Settings
The Display Setup Graphical Map settings for proteins are managed as explained on page 222.
Save To File/Load From File
Display settings configured in the Molecule Display dialog box can be saved to and loaded from
external files on your hard drive. To save the current Display Setup profile to an external file,
click the Save To File button and enter a name and storage location for the new Molecule Setup
file. To load a previously saved Display Setup file, click the Load From File button and navigate
to the location of the file on your hard drive. Select the Setup Profile from the dialog box; the
selected settings are applied to the current Molecule Display window.
225
Vector NTI Advance 10 User’s Manual
Setup Profile
See setup Profile in the DNA/RNA Display Setup section on page 226.
Picture Edit Mode: Formatting and Annotating Pictures
Vector NTI has two modes of operation in Graphics Panes.
z
Molecule Editing mode (default) in which the Graphics Pane serves as a visual environment for viewing and editing the content of a molecule itself. In molecule editing, you are
changing the nature of the molecule map and sequence. Selecting DNA molecule fragments for Construction and Design also take place in Molecule Editing mode. See Chapter 21 and Chapter 22 for details about Construction and Design. Molecule Editing mode
is discussed in Chapter 19, Editing Molecule Content.
z
Picture Editing mode where you can edit the graphical representation of an image such
as format and arrange individual graphics symbols and labels. This mode is useful for
preparing publication-quality figures of the molecule.
When in Picture Editing mode, Vector NTI changes the way it selects objects in the Graphics
Pane: the elementary units of selection are graphics objects like labels and symbols, not elements of the molecule content. In Picture Editing mode, you can reposition and reformat labels
and symbols, hide objects to prevent them from being displayed, and format multiple objects at
once using centralized style sheets.
Notes about Picture Editing Mode:
z
If you intend to edit the molecule itself, it is recommended that you perform that first
before you format molecule graphics.
z
Picture editing changes are not saved in database, but in a Molecule Document file.
To activate Picture Editing Mode, in an active Graphics Pane, click the Edit Picture button
(
) on the toolbar. When the Graphics Pane is in the Picture Editing mode, the button is
shown in depressed state and View > Edit Picture is checked.
All of the following operations are performed in Picture Editing mode.
Formatting Objects on the Graphical Map
To format an object in the Graphics Pane, select the object by clicking on it or its label. Review
selection techniques in Chapter 3. To format more than one graphics object at a time, HOLD
SHIFT + CLICK on each.
Selected objects in Picture Edit mode are displayed with selection boxes or handles at each corner. If this is not the case, check to make sure the Edit Picture button is depressed.
When the graphics objects to be formatted are selected, choose Edit > Properties, press ALT +
ENTER or select Properties from the associated shortcut menu.
In the Properties dialog box, select Line, Fill, or Text attributes (if a label is selected). If a single
symbol is selected, you may also change its Shape.
On the Properties tabs, select the pattern and color for Lines and Fill for selected graphics
objects. On the Shape tab, click the down arrow for selections. Click OK.
Note the following about formatting objects:
226
z
Lines associated with symbols are the lines that surround the main symbol. Lines associated with labels are the droplines connecting the labels to its corresponding symbol.
z
Fill refers to the pattern and color with which the selected symbols are filled. Changing a
symbol’s filling does not affect the formatting of the line around that symbol.
Molecule Display Windows; Formatting Graphics Chapter 18
z
The Default Shape option forces Vector NTI to assign the default shape to the given
symbol. You can edit the association between the element type and the default shape/
style in the Graphics Display Setup dialog box accessible from the Display Setup dialog
box. Note: You cannot undo the Shape formatting.
If you have selected label(s), the Properties dialog box includes a Text field (Figure 18.25).
Figure 18.25 Properties dialog box
In the text box, enter ordinary text or choose from a variety of special codes that are converted
into information about the symbol to which the label is attached. To insert a substitution code,
choose the code from the Substitutions box and click the Insert button. The code is inserted at
the current caret position.
This substitution model allows assignment of a single text “style” to all labels of a certain kind.
For example, if the text attribute for all restriction sites is “@N (@S)” then the actual label for a
SmaI site 5354 bp will look like “SmaI (5354)” with the REN name and site position substituted
for @N and @S. You might want to experiment with the different substitution models.
Using the Font button on this tab, choose the font, font style, font size, effects, and display color
attributes of labels you selected. Attributes of currently selected font are displayed to the right of
the Font button.
Note:
The font size you choose is not necessarily equal to the font size on the screen or on the printed
output. Displayed objects are stretched and shrunk as the picture magnification is changed.
Annotations
To insert a text annotation on a graphical map, click the Add Annotation button(
) in the
Window toolbar or choose Edit > New > Add Annotation. In the Annotation dialog box, enter
the text of a new annotation label. Click OK to return to the Molecule Display window where the
annotation is highlighted and selected with handles. Click and drag it to the location you choose
in the Graphics Pane.
You can move annotations and change their font and formatting using the label formatting techniques described above.
Note:
Annotations are elements of the graphical representation of the molecule only and are not
stored in the database. To save an annotation, you need to save the display window as a Molecule Document. To associate text information with a molecule itself, not its temporary graphical
representation, use the Comments or User Fields described in Chapter 17.
Deleting Annotations
To delete an annotation, select it in the Graphics Pane, and choose Edit > Delete Annotation,
or to delete an annotation from a Text Pane, click the annotation subfolder to select its line, and
227
Vector NTI Advance 10 User’s Manual
click the Delete Annotation button (
tation.
) in the Window toolbar or choose Edit > Delete Anno-
To delete annotations from the Graphics Pane, select them in the Picture Editing mode and
choosing Edit > Delete Annotation.
Note:
Annotation subfolders are the only folders of the Text Pane that can be deleted.
Undo and Redo
You can undo/redo movement and formatting of graphics objects, redefinition of styles, etc.
Undo/Redo also works in the Sequence Pane. The list of actions, tracked by undo/redo as well
as the size of the undo buffer can be changed in the Undo/Redo tab, accessed from Edit >
Options.
z
To undo an action, click the Undo button(
Undo <Formatting>.
z
To redo an action, click the Redo button(
<Formatting>.
) in the main toolbar or choose Edit >
) in the main toolbar or choose Edit > Redo
Changing the Sizes And Shapes of Symbols
To change the size or shape of a symbol, click the Edit Picture button(
); you cannot modify
a graphic unless the Graphics Pane is in Edit Picture mode. Next, select the object to be
changed with a mouse click. Black drag boxes will appear at its corners. Move the cursor to any
drag box, changing it to a thin four-headed arrow (
). Click and drag the black box, causing
the symbol to change shape and/or size (Figure 18.26). Release the mouse when the symbol
has the new shape you want.
Figure 18.26 Changing a symbol’s shape and/or size
Moving Objects on the Graphical Map
To move a graphics object around the Graphics Pane, select the symbol or label. When the cursor placed in the middle of the selected object turns into a four-headed arrow (
drag the object to the new location.
), click and
As labels are dragged, their droplines follow, tracking the connection to the object to which they
refer.
Most symbols representing features, restriction sites, etc., do not move completely freely around
the graphical map. They do move freely perpendicular to the “sequence” bar/ring, but Vector
NTI prevents them from moving parallel to the sequence bar without your permission. This is to
keep the objects in the places corresponding to their actual locations in the nucleotide or amino
acid sequence.
To move a symbol parallel to the sequence bar of a graphical map, press and hold CTRL+ SHIFT
and drag the object.
228
Molecule Display Windows; Formatting Graphics Chapter 18
Note:
This does not change the coordinates of the feature in the Feature map. To change the coordinates you need to edit the feature in the Molecule Editing mode described in Chapter 19.
Changing the Display Order Of Overlapping Graphics Objects
To change the display order of overlapping graphics objects, select them; choose View > Picture Element > Bring To Front or Send To Back or the corresponding commands from the
shortcut menu. To make these changes, the Graphics Pane must be in Edit Picture mode.
The following image demonstrates the results of bringing the DNA ring to the front of a circular
molecule display (Figure 18.27):
Figure 18.27 Bringing the DNA ring to the front of a circular molecule display
Hiding Graphics Objects
To hide an object, select it and choose Edit > Hide. If you hide symbols, their labels remain visible unless you hide them specifically. The Hide feature is useful if you don’t want objects to
appear on a final picture or if you want to have more room for better layout of important picture
elements.
Restoring Hidden Graphics Objects
To restore hidden graphics objects to the Graphics Pane’s display, click the Undo button(
)
or Edit > Undo. You can also activate the Text Pane, link the text and Graphics Panes, and
open the folder(s) containing the hidden graphics objects.
Styles
A style is a named set of formatting attributes for graphics objects. Styles in Vector NTI work
much the same as they do in most word processing programs. Styles provide a convenient and
powerful way to organize the formatting of graphical maps.
Each style contains one or more of the following attributes: line, fill, text, and shape.
Although Vector NTI has standard styles for symbols and labels, you can also define your own.
Once created, styles can be saved together with other parameters in the Display Setup Profile
or in Vector NTI Setup files.
To learn what style a graphics object has, turn on the Picture Editing mode, select the object and
select View > Picture Element > Style or Style from the shortcut menu. The style box in the
Picture Element Style dialog box shows the style of the selected object. If more than one object
is selected, the style box shows the style of the last object selected. The last selected object is
displayed with small squares around it.
229
Vector NTI Advance 10 User’s Manual
Assigning Styles to Graphics Objects
To assign an existing style to a graphics object, select the object(s) to which you want to assign
a style and choose View > Picture Element > Style or Style from the shortcut menu. In the
Style box in the Picture Element Style dialog box, choose an existing style from the pull-down
list, or type a name, and click the OK button.
If you select an existing style or type its name, that style is assigned to the selected graphics
object(s), and the object(s) assume its format.
If you type a name that is not in the style list, a new style with the format of the currently selected
object(s) is created. If the selection includes more than one graphics object, a newly created
style contains only those attributes that are the same for all selected objects.
A style is the base format for a graphics object. You may make additional formatting changes to
graphics objects using the methods described in preceding sections.
Redefining a Style’s Format
To redefine the style of a graphic object, select the object, open the Properties dialog box,
opened from the shortcut menu and make the desired changes for the object. Click OK. Select
View > Picture Element > Style or select Style from the shortcut menu. In the Style drop-down
menu, the name of the current style is displayed. Click OK, signaling that you wish to apply the
new format to an existing style. In the Reapply Style dialog box (Figure 18.28) that opens,
choose the redefine operation you wish to occur and click OK:
Figure 18.28 Reapply Style dialog box
To accomplish the same end, you could select View > Picture Element > Redefine <name>
Style by Example or the corresponding command from the shortcut menu.
If you have chosen the Redefine Style option, any objects (even unselected ones) that currently
have that style will automatically change format to reflect the style’s new settings.
If you have chosen the Return Formatting to Style option, then the selected objects’ format is
restored to that Style’s format. Edit > Undo or the Undo button restores the former style.
Copy and Paste Styles
Once you have modified a symbol or label with a new format, you can easily reformat other
objects with the same format. Select the modified object, and select Copy Style from the shortcut menu associated with the modified object. Move the cursor to another feature or label, and
select Paste Style from the shortcut menu.
Saving Styles
The set of the styles and Standard Arrangement parameters appearing in the Molecule Display
Window are a part of the Display Setup settings.
To save a display window’s current styles, choose the Edit > Display Setup or click the Display
Setup button(
) n the Window toolbar and choose Display Setup from the drop-down menu.
In the Display Setup dialog box, there are two options for saving styles:
230
Molecule Display Windows; Formatting Graphics Chapter 18
Save Settings As saves all the settings in Display Setup. The settings are given a name that is
then listed in the Display Setup drop-down menu. Properly saved Setup Profiles are easily
retrieved and applied to display windows. Click this button and enter the name you want to
assign to the current settings.
Save To File saves current graphics display settings that you have defined. They are not as
easily retrieved as when you use the Save Settings As option. This option could be used, as an
example, when you are focused on preparing graphics for publications and wish to transfer formatting instructions from one display window to another. In the standard File Save dialog box,
choose a file name for current styles and Standard Arrangement information.
Loading Styles
To apply a saved Display Profile to a Molecule Display window, choose a profile entry name
from the list in the Display Setup drop-down menu or in the Settings Profile drop-down menu
in the Display Setup dialog box. When you make the selection, Vector NTI loads the styles as
well as other settings from the profile but does not apply them to the active window until you
click the OK button. Modify the settings further, if you like; click the OK button to accept the new
setup or click the Cancel button to leave the current window’s settings unchanged.
To retrieve styles saved in a separate setup file, press the Load From File button in the Graphics Display Settings box of the Display Setup dialog box. Choose a setup file from the standard
File Open dialog box. Click the OK button in the Display Setup dialog box to apply new setup to
the active Display window.
Saving Molecules
Vector NTI allows for two kinds of permanent storage for molecules:
z
In the Vector NTI’s database.
The database supports parent-descendant connections between molecules. It saves automatic tracking of modifications, search, and many other operations on the set of molecules
as a whole.
z
In a Vector NTI Molecule Document file.
Molecule Documents save all the information contained in a Molecule Display window such as
graphical representation and molecule analysis results. In this format, the molecule itself is in a
portable format suitable for information exchange between different Vector NTI users. Since the
Vector NTI Molecule Document format is based on GenBank/GenPept format, other programs
that are able to import GenBank/GenPept files can import Molecule Documents as well.
A Molecule Document for a constructed molecule does not contain or track the molecule’s parents and thus, unlike the database, it is not suitable for storing related molecules.
231
Vector NTI Advance 10 User’s Manual
To save a molecule, click the Save As button(
As dialog box (Figure 18.29):
) or select File > Save As, opening the Save
Figure 18.29 Save As dialog box
Select the appropriate destination tab for the storage of your molecule.
Save in <Molecule> Database
Select the subset where the molecule is to be stored. Enter (or modify) the molecule name in the
text box at the bottom of the dialog box and click OK.
Save as (Molecule Document) File
On the Save as File tab, browse for the destination where the document is to be saved. Enter a
file name and click OK.
If Vector NTI is configured for Internet publishing, you will see a subsequent dialog box asking
your permission to create an HTML file for the molecule. This HTML file will contain a brief
description of the molecule and a hypertext link to the Molecule Document file.
Creating A Molecule Shortcut File For A Database Molecule
Molecule Shortcut files contain the name of a database molecule along with the Display Setup
parameters. When you open a database molecule via the Shortcut file, Vector NTI uses the Display Setup parameters stored in the shortcut file.
To create a shortcut file, open the molecule in a Display window, set the desired Display Setup
parameters and select File > Create Shortcut. In the standard File Save dialog box, enter a file
name and location for the new Shortcut file.
Molecule Export
Exporting a Molecule to a GenBank/GenPept, EMBL/SWISS-PROT or FASTA file
Vector NTI allows you to easily export a molecule opened in a Molecule Display window to GenBank/GenPept, EMBL/SWISS-PROT, or FASTA file. For details about using Vector NTI’s complete export capabilities, refer to the Database Explorer, described in detail in Chapter 17.
To export a molecule to an external file, choose File > Molecule Operations > Export. Select
the type and name of the file in the standard File Save dialog box.
232
C
H A P T E R
19
EDITING MOLECULE CONTENT
Introduction
DNA/RNA and protein molecules can be edited in two environments:
z
A Molecule Display window Graphics Pane, allowing editing of the molecule content in
the graphics-oriented environment.
Molecule Display windows give you immediate visual feedback and more automatic processing (that is, automatic adjustment of functional signal coordinates on sequence
insertions and deletions).
z
Molecule Editor, a text-based dialog box opened from a Molecule Display window of
either molecule type.
o
Editing a molecule in the Molecule Editor is more convenient if you want, for example,
to delete ten functional signals from the functional map.
o
Molecule Editor is the only way to create a molecule from scratch. (Molecule Display
windows cannot show molecules of zero length).
Edit Operations in a Molecule Display Window
Molecule Editing
Vector NTI has two modes of editing operations in Graphics Panes.
z
Molecule Editing mode (default) in which the Graphics Pane serves as a visual environment for viewing and editing a molecule map and sequence and for selecting DNA molecule fragments for construction and design. In Molecule Editing mode, the molecule itself
can be modified. Molecule Editing mode is the subject of this chapter.
z
Picture Editing mode where the graphical display of an image such as the format and
arrangement of individual graphics objects is edited. This mode is useful for preparing
publication-quality figures of the molecule. Picture Editing mode is discussed in Chapter
18 on page 226.
233
Vector NTI Advance 10 User’s Manual
Note:
The Vector NTI Database Explorer can be configured to launch independently or simultaneously
with the Vector NTI workspace each time a Vector NTI session is initiated. From a Molecule Display window, select Edit > Options from the menu bar. On the General tab of the Options dialog box, clear the Open Local Explorer At Startup checkbox.
A Molecule Display window opens in Molecule Editing mode by default. Molecule Editing mode
is used for viewing and editing graphical maps of a molecule, viewing ORFs and motifs (for DNA
molecules), and editing molecule’s sequence. This mode is also used to select DNA molecule
fragments for construction and design.
If the display window is in Picture Editing mode, the Edit Picture button (
depressed state and View > Edit Picture is checked.
) is shown in
Selection Techniques on the Graphical Map
The following techniques can be used for making selections in Molecule Editing mode:
z
On the Graphics Map, point the cursor at a symbol or label. If pointing at a restriction site
or motif, the cursor becomes a crosshair with a word “site” (
). With the cursor
paused at the site, a pop-up label appears, giving the type and site position. If pointing at
a functional feature or an ORF, the cursor becomes a hand (
) and upon pausing, it
displays a message telling you the type, name, and location of the feature or ORF. Click
on the symbol, site or its label to select it.
z
Choose Edit > Set Selection. In the Set Selection dialog box, enter the coordinates of
the region to be selected. Both start and end nucleotides are included in the selection, so
to select the nucleotides or amino acids 50 through 60 you should enter From: 50, To:
60. Press OK. The coordinates of the selection are shown in the Selection Box on the
status bar at the bottom of the screen.
z
Click on the Set Selection box on the Status bar, opening the Set Selection dialog box.
Enter the region coordinates in the Set Selection box. Click OK.
A selected region is marked with a selection wire-frame on the Graphics Pane (Figure 19.1).
Concurrently the selection is highlighted in the Sequence Pane.
Figure 19.1 Wire-frame selection on the Graphics Pane
234
Editing Molecule Content Chapter 19
A caret (heavy black marker) appears at the “active” end on the wire-frame and the sequence at
either the 5’ or 3’ end (a or c end for proteins). The caret position is also shown in the caret position box on the status bar.
The caret makes it easy to modify the ends of the selection in the Graphics Pane:
Note:
z
To activate an end of the selection, click on it with the mouse or click on the HOME or
END key.
z
Hold the cursor over the active end; it changes shape to a cross-hair with the 5’ (
) (or
3’, or a/c mark), click the mouse button and drag the end to the desired position (watch
the selection box on the status bar while you are dragging it). Drag the 3’ end of the
selection in the same way.
z
To move the active end of the selection one residue at a time, hold the SHIFT + LEFT or
RIGHT ARROW key to move the active end of selection one nucleotide/amino acid at a
time.
z
To move the caret 10 residues at a time, hold down the CTRL key (do not release the
SHIFT key) with arrow keys. When the CTRL + SHIFT + LEFT OR RIGHT ARROW key.
If you release your hold on the CTRL + SHIFT keys, you will lose your current selection.
Setting The Caret Position On The Graphical Map
To set the caret to a position of the molecule, choose Edit > Set Caret Position or click on the
Set Caret box on the Status Bar. In the Set Caret Position dialog box, enter the coordinate of the
nucleotide/amino acid following the caret. The coordinates start from 1; so to set the caret
before the first nucleotide of the molecule you should enter 1. Click OK. The position of the caret
appears on the Graphics and Sequence Panes and in the caret position box on the status bar.
Note:
Setting a coordinate in a Set Selection or Set Caret Position dialog box replaces any previous
selection.
Selection Techniques for Choosing DNA Fragments for Recombination
The simplest way to select DNA fragments for recombination is to use the Fragment Wizard,
discussed in detail in Chapter 22 and Chapter 24. However, if you wish, you may select regions
as described above.
To select more than one functional signal at a time, click on each while holding down the SHIFT
key. The wire-frame will include all selected signals (plus intervening nucleotides). Press the
TAB key to move the selection ends to the next gap between selected functional signals; press
SHIFT + TAB moves the selection ends to the previous gap between selected functional signals.
If you prefer to select features without intervening nucleotides, select the fragments one by one
and add them to the Goal List individually.
To set a 3’ or 5’ end of the selection to a restriction site, press HOME or END to move the caret to
the desired end of the selection and hold down the SHIFT key while clicking on the label of the
restriction site. If an end of the selection zone is set to a restriction site, an @ symbol appears in
front of that end’s coordinate in the status bar.
After the fragment is defined, click on the Add Fragment to Goal List button (
role in construction or design the fragment will play, and press Finish.
), identify the
Editing the Molecule Map
The elements of a molecule map can be divided into two categories.
235
Vector NTI Advance 10 User’s Manual
1. Items explicitly described in the molecule data (features on DNA/RNA and protein molecules and restriction sites on un-sequenced regions of a DNA molecule). These CAN be
edited.
2. Items calculated automatically from the DNA molecule’s nucleotide sequence (ORFs,
motifs, and restriction sites on sequenced regions of the molecule) each time the molecule
is displayed. These are not stored with the molecule; these CANNOT be edited.
Editing operations are as follows:
Notes
about
molecule
editing:
z
To edit a feature of the graphics map, double-click on it or select it and choose Edit >
Feature Properties, select Feature Properties from the shortcut menu or press ALT +
ENTER. The Molecule Feature dialog box opens, where you can edit the properties of
the selected object. The Molecule Feature dialog box for automatic objects does not contain editable fields.
z
To add a feature to a molecule, select the corresponding region of the molecule and
choose Edit > New > Add Feature To FMap. In the Molecule Feature dialog box, you
can describe the new feature.
z
To add an ORF to a DNA molecule’s Feature map, select the ORF you want to add and
choose Edit > New > Add ORF to FMap. In the Molecule Feature dialog box, you can
name the feature (all fields are initialized with the information taken from the selected
ORF).
z
To add restriction sites to unsequenced regions of a DNA molecule, move the caret to
the desired position and choose Edit > New > Add REN Site to RMap. In the Restriction
Sites dialog box, the Site Positions field shows the current caret position. You can enter
more than one site position separated by space. Select the name of the enzyme and
press OK. Vector NTI adds the sites modifying the nucleotide sequence accordingly.
z
To delete a feature from the molecule map, select the feature. Choose Edit > Delete
Feature from FMAp, select Delete Feature from FMap from the shortcut menu or
press DELETE on the keyboard. To remove “automatic” objects from the graphics map
display, you must change the parameters in Display Setup.
z
If you have chosen an automatic feature to delete, a window appears reminding you that
this feature cannot be deleted.
z
You can rescind all molecule content edits by selecting File > Revert to Saved.
Editing the Sequence from the Sequence Pane
Sequence editing operations in the Sequence Pane are similar to those in the Graphics Pane.
Three editing operations make use of the standard Clipboard (Cut, Copy, and Paste) operations.
Others allow you to insert literal fragments or modify existing fragments.
The copied sequence on the Clipboard is in the standard text format, for free exchange of the
sequence data between Vector NTI and other applications.
To Paste (“insert”) a cut or copied sequence, set the cursor, which in the Sequence Pane
becomes a vertical I-beam (
> Paste Sequence.
), to the insert position. Paste with a toolbar button or select Edit
To insert a new sequence fragment manually, click the I-beam at the insertion position; choose
the Edit > New > Insert Sequence. In the Insert Sequence dialog box, enter the sequence to
be inserted. Click OK. If the inserted sequence will affect a feature, you are given the option to
delete the feature (Delete or Delete All) or keep it (Keep or Keep All) in its modified form.
Once the sequence is inserted, you can delete it manually or select File > Revert to Saved Molecule in Database to return to the unedited version.
236
Editing Molecule Content Chapter 19
Edit Operations in Molecule Editor
This section explains the Vector NTI Sequence Editor, which can be used for creating new molecules from scratch (raw sequence), as well as for editing existing molecules.
To open the Molecule Editor dialog box:
From the Vector NTI Workspace/Molecule Display window:
z
File > Create New Sequence > Using Sequence Editor (DNA/RNA) or > Using
Sequence Editor (Protein) opens Molecule Editor for creating a new molecule
from
raw sequence
z
Edit > <Molecule> Properties opens Molecule Editor for the open molecule (Figure
19.2)
From Database Explorer:
z
Select the DNA/RNA or Protein subset in the drop-down menu, select a molecule in
Objects list and click on the Edit button (
) or <Molecule type >> Edit on the Menu
Bar.
The figure shows the DNA/RNA Molecule tab of the Molecule Editor opened from Database
Explorer (Figure 19.2):
Figure 19.2 DNA/RNA Molecule tab of the Molecule Editor
The Molecule Editor contains information for one molecule at a time. Note these points about
the Molecule Editor:
z
Most tabs for protein or DNA/RNA are basically the same. Any variations are mentioned
below.
z
Molecule Editor opened from Database Explorer has one additional tab for sequence
and feature editing. Sequence editing of an open molecule must be performed in the
Sequence Pane of the Molecule Display window itself.
z
To be edited with the Molecule Editor, a molecule must be fully processed. For instance,
when you are trying to construct a DNA molecule from incompatible component fragments, Vector NTI saves the entered molecule’s data but does not process the molecule
completely. It allows you to load molecule data from the database into the Construct/
237
Vector NTI Advance 10 User’s Manual
Design Molecule dialog box, edit its component fragments, and reconstruct the molecule. But you cannot load a molecule into the Molecule Editor until it’s fully processed.
z
Note:
You must enter a new molecule’s nucleotide sequence using the Sequence Editor (Figure
19.6) to be able to save the new molecule. If the new DNA molecule is unsequenced, it is
easier to construct it first from one DUMMY fragment using Construct/Design Molecule dialog box, and then enter its functional and restriction maps loading the molecule from the
database into the Molecule Editor.
z
Note:
The Molecule Editor can be used to describe a new molecule from scratch. The Molecule Editor is almost identical for New Molecule (creating a new molecule from scratch)
or for Edit Molecule. The New Molecule mode lets you enter all data including a
sequence.
If you have made any changes to a molecule in the Molecule Editor, you must press the
Molecule Editor’s OK button to enter the new information into the database.
When a molecule is created during the design or construction process, its nucleotide
sequence and functional map are generated automatically from its parents. You may add
new functional signals to the map or delete or edit automatically-generated functional signals or edit an automatically generated nucleotide sequence. In that case, the system disconnects the molecule from its parents to avoid data inconsistency. The system prompts
you if such a situation occurs.
Each of the tabs of DNA/RNA and protein Molecule Editors are discussed below.
The General Information Tab
Figure 19.3 The General Information tab displays general object data
The General Information tab has the same format for all database objects (Figure 19.3). For
existing molecules or other database objects, this tab allows you to only review object properties. For new objects only, you can enter a name for the new object in the active text box. Figure
19.3 displays the tab that opens with the Molecule Properties command for an existing molecule, thus there is no text box.
238
Editing Molecule Content Chapter 19
The DNA/RNA Molecule Tab
Figure 19.4 DNA/RNA Molecule tab
z
Molecule type: Circular/linear and DNA/RNA
z
Extra-Chromosome Replication: Transformation systems in which the molecule is
capable of extra-chromosome replication.
z
Replicon Type: The source of the replication origin for the molecule
z
Description: single-line description of the molecule.
The information in these fields appears in the General Description folder when the molecule
is loaded into a Display window.
The Protein tab contains a one-line molecule description.
The Sequence and Maps Tab (DNA/RNA)
This tab appears only when the Edit <molecule > dialog box is opened from Database Explorer
(Figure 19.5).
Figure 19.5 Sequence and Maps Tab (DNA/RNA)
239
Vector NTI Advance 10 User’s Manual
Editing Sequence
From the Sequence and Maps tab, click the Edit Sequence button to open the Sequence Editor
to edit the sequence of the molecule (Figure 19.6).
Figure 19.6 Using the Sequence Editor to edit the sequence of the molecule
Edit the sequence using standard text editing techniques, Cut, Copy, and Paste through the
Clipboard.
Click the Find button to specify a string to find in the sequence and the search direction (up or
down). Click Find Next to launch the search and Cancel to leave the Find dialog box.
Click the OK button to save any changes you made in the sequence and to return to the
Sequence and Maps tab of the Molecule Editor.
Editing the Feature Map
To add an item to a molecule’s Feature map, click the Add button in the Feature map pane of
the Sequence and Maps tab. (This dialog box can also be accessed by: Select Edit > New >
Add Feature to FMap or right-click on a feature in the Graphics Pane. Select Feature Properties from the shortcut menu.) The Molecule Feature dialog box appears (Figure 19.7):
Figure 19.7 Molecule Feature dialog box
To add a feature, select a particular Feature Type in the classification tree on the left. Enter the
specific name of the feature in the Feature Name field. To see a list of specific names for each
240
Editing Molecule Content Chapter 19
feature type, press the Browse button (
) next to the Feature Name field, opening the Feature
Name dialog box, which lists the specific names available for that feature type (Figure 19.8):
Figure 19.8 Feature Name dialog box, which lists the specific names available for that feature type
After selecting a feature signal name, click OK.
Back in the Molecule Feature dialog box, select feature positions by using one of two formats:
z
Simple: In the From and To fields, enter the starting and ending coordinates of the functional signal you are adding.
Check Complementary if the signal is located on the complementary strand.
Note:
Vector NTI uses the currently accepted convention for the coordinates of complementary features. All coordinates are given as if on the direct strand, from the leftmost to the rightmost
nucleotide of a signal, as shown in Figure 19.9:
Figure 19.9 Defining feature position coordinates
z
GenBank/EMBL format: Set a complex location string that describes the positions of
the exons and location of the features. The full description of location string format can
be found in the GenBank or EMBL sources. For your convenience, you can always see
the original location string of the feature.
In the Description text box, enter notes about the feature you are adding.
Click OK to add your feature and return to the Sequence and Maps tab.
To edit a feature: Double-click or highlight the feature in the Feature map pane and press
Edit. The Molecule Feature dialog box (Figure 19.7) opens loaded with the feature you
selected. Make any changes you want, and click OK to apply your changes or click Cancel.
To remove a feature from a molecule’s Feature map: Highlight the feature in the Feature
map pane and click Delete.
241
Vector NTI Advance 10 User’s Manual
Editing the Restriction Map
To add a restriction site to the molecule’s restriction map: Click the Add button in the Restriction
Map group of the Sequence and Maps tab (Figure 19.5), opening the Restriction Sites dialog
box (Figure 19.10). (You can also access this dialog box by selecting Edit > New > Add REN
Site to RMap.)
Figure 19.10 Restriction Sites dialog box
In the Enzyme Name field, enter the name of the restriction endonuclease or click the Browse
button (
) to see a list of RENs in the Vector NTI database.
In the Site Positions field, enter the nucleotide position numbers where the sites of the enzyme
you have chosen are found, separated by spaces.
To edit a restriction site: Double-click it or highlight the item you want to edit and click Edit. The
Restriction Sites dialog box appears, loaded with the site you selected. Make any changes you
want. and click OK to register your changes or the Cancel. Vector NTI returns you to the Molecule Editor.
To remove an item from the restriction map: Highlight the item and click the Delete button in the
Restriction Map group. Sometimes Vector NTI does not allow removal of a restriction site if it is
not entered manually.
Sequence and Features Tab (Protein)
Figure 19.11 Sequence and Features tab (Protein)
This tab’s functionality is the same as that of the Sequence and Maps tab of the DNA/RNA Molecule Editor, however, only sequence and Feature map editing are supported.
242
Editing Molecule Content Chapter 19
User Fields Tab
Figure 19.12 User Fields tab
The User Fields tab (Figure 19.12), used for adding custom data for a molecule in the form of
fields, has the same format for all database molecules. It contains a list of all User Fields currently applied to the object being edited as well as the list of blank fields defined in the local User
Field Definition list but are not yet applied to that object.
z
To fill or edit any field, double-click on the field name or select the field name and click
the Change Value button. If the field you want to edit is not listed in the local User Field
Definition list, Vector NTI asks you to enter the field’s definition first. When the field definition is added to the local definition list, Vector NTI displays the appropriate field value
dialog box.
z
To clear any User Field for the object, select the field and click the Remove Value button.
z
Refer to Chapter 17 for more user field details.
Comments Tab
The Comments tab (Figure 19.13) has the same format for all database objects. Enter text comments of unlimited length about the molecule.
Figure 19.13 Comments tab
243
Vector NTI Advance 10 User’s Manual
Keywords Tab
The Keywords tab (Figure 19.14) has the same format for all database objects. This tab lets you
enter keywords useful for database search.
To add a keyword for the molecule, type a new word or select an item in the list of existing keywords. Click the < Add button to move the keyword into the keyword list.
To remove an item from the keyword list, select item(s) click the > Remove button.
Figure 19.14 Keywords tab
Changing the Starting Coordinate of a DNA Molecule
You can change the starting coordinate of a molecule by choosing File > Molecule Operations
> Advanced (DNA/RNA) > Change Starting Coordinate from the drop-down menu in a DNA/
RNA Molecule’s Display window. Upon choosing this command, the Change Starting Coordinate dialog box appears, allowing you to designate the current molecule position that you want
to define as the new starting coordinate:
Figure 19.15 Change Starting Coordinate dialog box
Click the OK button to accept the new start position. Vector NTI redraws the molecule, setting
the New Start position as position 1. All features, restriction sites, etc. remain in the same positions relative to each other, but they are shifted in the display accordingly.
Note:
When the starting coordinate of a molecule is changed, the change takes effect immediately.
You are not asked to re-save the molecule to the database to register the change.
Making the Reverse Complement of a DNA Molecule
To make the reverse complement of a DNA/RNA molecule, open the molecule in a Molecule
Viewing window in Vector NTI. With any pane activated, choose File > Make Reverse Complement from the drop-down menu. The Choose New DNA/RNA Molecule Name dialog box
appears, allowing you to save the reverse complement.
244
C
H A P T E R
20
PRIMER DESIGN: PCR, SEQUENCING AND HYBRIDIZATION
Introduction
This chapter describes Vector NTI’s oligonucleotide analysis functions: the design, execution
and analysis results for PCR primers, sequencing primers, and hybridization probes. The chapter also covers “silent mutation” analysis, ORFs and motif searches, calculation of restriction
fragments, back translating and RFLP analysis.
The following table summarizes the various dialog boxes that open as you proceed through
PCR, Sequencing and Hybridization Probe design:
Analysis/Dialog Box
Purpose
Find PCR Primers
Specify limits for PCR primer search such as length of target sequence,
output options, attach restriction sites, etc.
Amplify Selection
Similar to Find PCR Primers except that primer hybridization domains
upstream and downstream from the target sequence can be specified.
Primers will be generated anywhere within the designated upstream
and downstream domains.
Amplify Features
Similar to Find PCR Primers except that multiple features of a specific
type can be selected for amplification. Use this dialog box when you
need to amplify multiple features from a single molecule.
Long PCR
Similar to Find PCR Primers, but allows you to design primers for the
amplification of regions that exceed 20 KB in length. Creates primers
for a set of overlapped PCR products that cover the amplification
region.
PCR Using Existing Oligos
Similar to Find PCR Primers, but, for the selected amplification region,
allows you to search for suitable PCR primers from among those
selected from the Vector NTI Oligo Database.
Table 20.1 Primer, oligo and probe dialog boxes
245
Vector NTI Advance 10 User’s Manual
Analysis/Dialog Box
Purpose
Multiplex PCR
Allows you to design PCR primers for amplifying several target
sequence regions in one reaction.
Alignment PCR
Allows you to design PCR primers for amplifying a region of aligned
DNA molecules.
Sequencing primers
Set parameters for sequencing and primer regions and primer; analyze
primers.
Similarity of <technique>
primers
Determine relationship of complementarity between primers and target
sequence. Therefore, the number of nucleotides on 3’ end required to
have 100% complementarity with target.
Primer/Oligo Parameters
Set acceptable limits for primer/probe interaction with target sequence.
Also relates to formation of secondary structures between the oligos
themselves.
Primer/Oligo Quality Specifics
Assigns “importance factors” to different primer parameters. Importance
factors are integers between 1 to 10, all relating to parameters specified
in other dialog boxes, such as %GC, Tm, and so forth. These parameters determine how much weight should be given to each of the named
specifications. For minimal importance, enter 1; maximal, enter 10.
Hybridization Probes
Set parameters for target region, output options; analyze probes.
Table 20.1 Primer, oligo and probe dialog boxes (continued)
PCR Primers
Vector NTI locates primers for performing PCR analysis on a DNA molecule fragment selected
in the Graphics Pane of a Molecule Display window. (Vector NTI can also evaluate user-defined
primers.) After selecting the target sequence for primer design, the maximum and minimum
product length and primer parameters are determined. Vector NTI evaluates, rates and sorts
several primer options. You can further fine-tune the primers and annealing parameters if you
wish, generate and display a PCR product in a Molecule Display window, save the primers (or
product) in the database, order custom primers from Invitrogen, or use the product in recombinant cloning strategies.
Vector NTI provides seven different modes of PCR amplification:
z
Find PCR Primers - Finds primers for a DNA selection within the selected region.
z
Amplify Selection - Defines allowed regions upstream and downstream of the selected
area for primer design.
z
Amplify Features - Amplifies one or more selected features in a molecule.
z
Long PCR - Designs primers for the amplification of regions that exceed 20 KB in
length.
z
PCR Using Existing Oligos - Searches for suitable PCR primers from among those
selected from the Vector NTI Oligo Database.
z
Alignment PCR - Design PCR primers for amplifying a region of aligned DNA molecules.
z
Multiplex PCR - Designs PCR primers for amplifying several target sequence regions in
one reaction.
This section covers preparation for PCR analysis, saving and loading PCR settings, the various
PCR Primers dialog boxes, the results of PCR analysis presented in PCR Analysis folders, and
operations with PCR primers and PCR products.
246
Primer Design: PCR, Sequencing and Hybridization Chapter 20
Open a Display window for the DNA molecule selected for PCR analysis. Select the target
region of the molecule and choose Analyses > Primer Design > <PCR amplification
method>, depending on the type of PCR analysis you want to perform. (These commands are
disabled if an appropriate target is not defined.) This opens the corresponding PCR Analysis
dialog box.
Saving and Loading PCR Settings
As you review the Find Primers, Amplify Selection, Amplify Features, Long PCR and PCR Using
Existing Oligos dialog boxes, notice the Load and Save buttons on the lower left of each tab.
These buttons allow you to save your PCR settings to a file and load the settings file in for subsequent analyses. This precludes having to reset the various parameters manually for frequently used PCR condition settings. You need only save/load the settings in one of the tabs
and the parameters for all the tabs in the Find Primers dialog box will be saved/loaded.
Important:
If you have made changes to the settings in a PCR Primers dialog box and want to save the settings to a file before running the analysis, you must first click the Apply button to register the
changes before saving to a file. If the new settings are not applied, the preexisting settings are
saved.
Find PCR Primers Dialog Box
The Find Primers dialog box (Figure 20.1) allows you to search for convenient sense and antisense primers according to your specifications and to check primers’ uniqueness. Clicking the
More>> button on the Primer tab enables complete view of the Find Primers dialog box.
Figure 20.1 Find Primers dialog box allows you to search for convenient sense and antisense primers
247
Vector NTI Advance 10 User’s Manual
Primer Tab
The options in the Primer tab allow you to set parameters for PCR primer search and define
primers and/or primer attachments, if desired:
Primer Tab Parameters – Find Primers Dialog Box
Region of Analysis
Enter the start and end coordinates of molecule’s target region.
Product Length
Enter the maximum and minimum lengths of the molecule target region.
Note: Unless you specify differently here, the minimum amplicon length
may be less than the target sequence you selected.
Maximum Number of
Output Options
Enter the number of sense-antisense primer pairs to be found. The actual
result may contain fewer than this number if there are not enough possible
primers.
Salt Concentration
Enter the PCR reaction salt concentration in mMol, if known.
Probe Concentration
Enter the value of probe concentration in pMol, if known.
dG Temperature
Enter the temperature in degrees Celsius to be used for calculating free
energy values.
Tm
Enter limits in degrees Celsius for primer melting temperature (Tm) (temperature at which 50% of primer is a duplex) and the difference between Tm
for sense and antisense primers.
%GC
Enter the limits of G/C percentage in the primer and the difference between
GC percentages for sense and antisense primers.
Length
Enter primer length limits. Note: Nucleotide sequences such as RENs
attached to a primer’s 5’ end are included when calculating primer length.
DNA/RNA radio button
Select the type of target nucleotide sequence.
More>> and Less<<
buttons
Extend or contract the lower portion of the Primers tab, which contains the
user-defined primer and primer attachment fields.
User-Defined Primers
Enter user-defined primer sequences or a primer from the oligo database.
The search engine checks the compatibility of the primers according to
primer parameters.
Attach to 5’ Terminus of
(Anti)Sense Primer
Enter a short (=/<18 bp) nucleotide sequence (if any) to be attached to the
5’ end of either primer, or choose from recognition sites of database RENs.
(To select RENs to add, click the Browse button (
).) This sequence,
while considered in primer parameters, does not affect the calculation of
complementarity between primer and molecule. A sequence can be
attached to the primer whether or not the primers are user-defined or
designed by Vector NTI.
Table 20.2 Primer tab parameters – Find Primers dialog box
Note:
248
The calculation for Tm is dependent on primer and salt concentrations; varying these concentrations can greatly affect the Tm for any given primer. Make sure to adjust these parameters
according to your reaction conditions when performing your PCR analysis to ensure that you
obtain accurate Tm values.
Primer Design: PCR, Sequencing and Hybridization Chapter 20
Amplicon Tab
Click the Amplicon tab (Figure 20.2). The options on this tab allow you to customize parameters relating to the resulting PCR product. %GC content for the product or a portion of the product and allowed bases adjacent to the primer annealing site can be specified.
Figure 20.2 Amplicon tab on Find Primers dialog box
Amplicon Tab Parameters – Find Primers Dialog Box
Amplicon %GC
Enter the minimum and maximum for the desired %GC content in the PCR
product.
Next to Primer
Annealing Site
Choose accepted bases for the four successive bases adjacent to the primer
annealing site. Set minimum and maximum %GC range for a specified length
of the amplicon adjacent to the primer annealing site.
Table 20.3 Amplicon tab parameters – Find Primers dialog box
Structure Tab
Click the Structure tab (Figure 20.3). The options on this tab set acceptable limits for nucleotide
repeats, palindromes and hairpin loops for the primers. You can also check your primers/product
for a selected group of restriction sites from this tab.
Figure 20.3 Structure tab on Find Primers dialog box
249
Vector NTI Advance 10 User’s Manual
Structure Tab Parameters – Find Primers Dialog Box
Nucleotide
Repeats
Enter the maximum permitted length of nucleotide repeats in primers.
Palindromes
Enter the maximum permitted length of palindromes in primers.
Hairpin Loops
Stem Length: Enter the minimum number of base pairs in a hairpin stem.
(This value is also used as a minimum stacking length for primer-primer complementarity and primer-primer 3’ end complementarity.) Permitted with dG:
Check the Permitted box for hairpin loops; enter the minimum permitted
value for free energy of hairpin loops. Primers with hairpin loops which have
free energy values > /= to this number will be accepted.
Check Hairpin
Loops, Palindromes, Nucleotide
Repeats and
Dimers Only Within
3’ Region of ...
Check this box and enter the length of a 3’ region if all of a primer’s features
(repeats, palindromes, hairpin loops, dimers) should be checked only within
that 3’ region.(If this box is empty, the whole primer will be evaluated.)
Check Primers For
Restriction Sites
From
Check to find possible cloning sites inside primers and attached nucleotide
sequences (if any). In the drop-down menu, specify the REN subset.
Enzymes will be checked for the presence of their sites in the primers and
attached sequences, and within the PCR product.
Table 20.4 Structure tab parameters – Find Primers dialog box
Pairs Tab
Click the Pairs tab (Figure 20.4). Options on this tab specify how closely parameters such as
Tm and %GC, etc. must match between two primers in a generated primer set.
Figure 20.4 Pairs tab on Find Primers dialog box
Pairs Tab Parameters – Find Primers Dialog Box
Tm Difference
Enter difference in degrees Celsius between Tm for sense and antisense
primers.
%GC
Enter the difference between GC percentages for sense and antisense
primers.
Table 20.5 Pairs tab parameters – Find Primers dialog box
250
Primer Design: PCR, Sequencing and Hybridization Chapter 20
Pairs Tab Parameters – Find Primers Dialog Box
Primer-Primer Complementarity
Check the Permitted box for primer-primer complementarity; enter the
minimum permitted value for duplex free energy.
Primer-Primer 3’ End
Complementarity
Check the Permitted box for primer-primer 3’ end complementarity; enter
the minimum permitted value for duplex free energy.
Table 20.5 Pairs tab parameters – Find Primers dialog box (continued)
Similarity Tab
Click the Similarity tab (Figure 20.5). The options on this tab determine the similarity relationship between the primers and the target sequence.
Figure 20.5 Similarity tab on Find Primers dialog box
Similarity Tab Parameters – Find Primers Dialog Box
Best Fit
Check this button to specify the search for site(s) with
maximum similarity with no set threshold.
With Similarities > = Similarity Threshold
Check this button to indicate similarity site search above
the specified similarity threshold.
Similarity Threshold
Enter the percentage of minimally acceptable similarity.
Last ... Nucleotides Must Have 100%
Similarity
Check and specify the number of nucleotides necessary to
have 100% complementarity with the target sequence at
the 3’ end.
Similarity Between Ambiguous Nucleotides
The Average, Minimum, and Maximum buttons specify
the acceptable similarity between an ambiguous nucleotide pair. For instance, if you are calculating similarity
between N and A, the average similarity is 25%, the minimum similarity is 0%, and the maximum similarity is 100%.
In case of R and A they are 50%, 0%, and 100%; in case
of R and T - 0%, 0%, and 0%.
See similarity chart on page 218.
Table 20.6 Similarity tab parameters – Find Primers dialog box
251
Vector NTI Advance 10 User’s Manual
3’ End Tab
Click the 3’ end tab (Figure 20.6). The options on this tab allow you to set specifications for the
3’ end of the primers generated by Vector NTI. Parameters such as dG and specific nucleotide
content for the 3’ end of both sense and antisense primers can be set here.
Figure 20.6 3’End tab on Find Primers dialog box
3’ End Tab Parameters – Find Primers Dialog Box
dG <=
Specify the maximum permitted value of 3’ end free energy.
Length for Analysis
Enter the length of the primer’s 3’ region that should be analyzed.
Sense Primer 3’ Nucleotides
Check the nucleotide boxes to specify permitted last primer
nucleotides for the sense primer.
Antisense Primer 3’ Nucleotides
Check the nucleotide boxes to specify permitted last primer
nucleotides for the antisense primer.
Table 20.7 3’ End tab parameters – Find Primers dialog box
Uniqueness Tab
Click the Uniqueness tab (Figure 20.7). The options on this tab determine the uniqueness of
the primers generated with respect to the PCR product. These parameters can be used to help
252
Primer Design: PCR, Sequencing and Hybridization Chapter 20
ensure that generated primers bind to the desired template area with greater specificity than to
the rest of the PCR product.
Figure 20.7 Uniqueness tab on Find Primers dialog box
Uniqueness Tab Parameters – Find Primers Dialog Box
Uniqueness Checks for
Choose the area of the molecule to check for primer
uniqueness. Either the entire molecule or the Amplicon
only can be selected for the uniqueness check.
Max Allowed Similarity
Check this box and enter the similarity threshold to check
primer uniqueness on the molecule. Primers which have
parasitic hybridization with similarity > /= this threshold will
be rejected. Note: this similarity threshold must be </= the
minimum similarity required for hybridization of userdefined primers (if any).
Max Consecutive Match for Entire
Primer
Check this box and enter the maximum acceptable match
of consecutive bases for the entire primer and the Amplicon.
Primer 3’ End
Check the first box and enter the number of consecutive 3’
bases that must match the amplicon with 100% similarity.
Check the second box and specify the maximum acceptable % match between the Amplicon and the designated
number of bases on the 3’ end of the primer.
Table 20.8 Uniqueness tab parameters – Find Primers dialog box
Qualities Tab
Click the Qualities tab (Figure 20.8). These parameters govern primer quality by determining
how much weight should be assigned parameters specified on the other tabs of the Find Prim-
253
Vector NTI Advance 10 User’s Manual
ers dialog box. These values affect scoring functions that evaluate the quality rating of the
primer sets generated.
Figure 20.8 Qualities tab on Find Primers dialog box
The importance factors are integers between 1 and 10 used in calculating the score evaluating
primer/oligo quality. The lower the factor, the less weight given in the calculation. For example,
for minimal importance, enter 1 in the appropriate box. For maximum importance, enter 10.
Filters Tab
Click the Filters tab (Figure 20.9). On this tab, you can select features that should either be
excluded or included as regions to be considered for primer design. For example, if your
sequence contains Repeat features, you may want to exclude them to obtain primers with
greater specificity. Features can be added or removed by pressing the + and – buttons.
Figure 20.9 Filters tab on Find Primers dialog box
Filters Tab Parameters – Find Primers Dialog Box
Apply Feature Reject Filter
Check the Apply Feature Reject Filter box and press the + and – buttons
to add or remove features from the list. This tells Vector NTI to avoid
making primers to the region of the specified feature(s). A maximum
allowed overlap of the primer with the feature’s 5’ and 3’ ends can be
specified.
Table 20.9 Filters tab parameters – Find Primers dialog box
254
Primer Design: PCR, Sequencing and Hybridization Chapter 20
Filters Tab Parameters – Find Primers Dialog Box
Apply Feature Include Filter
Check the Apply Feature Reject Include box and press the + and – buttons to add or remove features from the list. This tells VNTI to include
these features in the amplicon when making primers. The maximum
acceptable distance from the primer ends to the feature ends can be
specified.
Table 20.9 Filters tab parameters – Find Primers dialog box (continued)
Amplify Selection Dialog Box
The Amplify Selection feature is similar to Find PCR Primers except that primer hybridization
domains upstream and downstream from the target sequence can be specified. Amplify Selection picks primers to amplify the entire selection. If suitable primers cannot be found inside the
selected region, the search will expand within the specified upstream and downstream flanking
regions.
Like the Find PCR Primers dialog box, clicking the More>> button enables complete view of the
dialog box. Only the tabs and parameters that differ from the Find PCR Primers dialog box are
discussed here. For a description of the tabs and parameters common to the Amplify Selection
and Find PCR Primers dialog boxes, see page 248 to page 254.
Primer Tab
The options in the Primer tab (Figure 20.10) allow you to set parameters for PCR primer search
and define primers and/or primer attachments, if desired:
Figure 20.10 Primer tab on Amplify Selection dialog box
Primer Tab Parameters – Amplify Selection Dialog Box
Before
Provides additional upstream region where the Primer may be made.
Amplicon Must Include
Region of Molecule
Set the 5’ and 3’ positions for region of the molecule that must be included in
the final amplified product.
After
Provides additional downstream region where the Primer may be made.
Table 20.10 Primer tab parameters – Amplify Selection dialog box
Amplify Features Dialog Box
Amplify Features is similar to Find PCR Primers except that Vector NTI will find the best primers
for amplifying the designated feature(s) within the region of analysis indicated. Like the Find
255
Vector NTI Advance 10 User’s Manual
PCR Primers and Amplify Selection dialog boxes, clicking the More>> button enables complete
view.
Only the tabs and parameters that differ from the Find PCR Primers dialog box will be discussed
here. For a description of the tabs and parameters common to the Amplify Features and Find
PCR Primers dialog boxes, see page 248 to page 254.
Primer Tab
The options in the Primer tab (Figure 20.11) allow you to set parameters for PCR primer search
and define attachments, if desired. User-defined primers are not allowed:
Figure 20.11 Primer tab on Amplify Features dialog box
Primer Tab Parameters – Amplify Features Dialog Box
Region of Analysis
Specify the 5’ and 3’ boundaries of the region for primer analysis. Features to
be amplified must be within the chosen region. The number of features in the
selection is indicated.
Every Amplicon Length
Specify the range for acceptable minimum and maximum product length.
Vector NTI determines primers that will produce products within the set
length range.
User-Defined Primers
This feature is NOT present.
Table 20.11 Primer tab parameters – Amplify Features dialog box
256
Primer Design: PCR, Sequencing and Hybridization Chapter 20
Features Tab
The Features tab (Figure 20.12) allows you to specify the features you want amplified, how
many of the chosen features you want in one amplicon and whether primer-feature overlap is
permitted:
Figure 20.12 Features tab on Amplify Features dialog box
Features Tab Parameters – Amplify Features Dialog Box
Add Features to Amplify
Click the <Add… button to display the feature list. From the list, choose the
features you would like to amplify.
Features per Amplicon
Designate the minimum and maximum number of features you want to
occur in the amplicons.
Feature-Primer Overlap
To allow feature-primer overlap for the selected features, check the appropriate box/boxes and specify the minimum and maximum permitted base
overlap.
Find Primers in Feature
Specify whether VNTI should find primers either inside or outside of the
amplified feature.
Table 20.12 Features tab parameters – Amplify Features dialog box
Filter Tab
The Filter tab (Figure 20.13) allows you to specify the features you do not want amplified as part
of the product:
Figure 20.13 Filter tab on Amplify Features dialog box
257
Vector NTI Advance 10 User’s Manual
Filter Tab Parameters – Amplify Features Dialog Box
Apply Feature Reject Filter
Check this box to enable the features reject filter. Add or remove features with the +, -, and >Remove All buttons
Apply Feature Include Filter
Check this box to enable the features include filter. Add or remove features with the +, -, and >Remove All buttons
5’ End Overlap
Check the box and specify the maximum permitted overlap of the
primer and the rejected feature(s) for the 5’ end.
3’ End Overlap
Check the box and specify the maximum permitted overlap of the
primer and the rejected feature(s) for the 3’ end.
Distance from Sense Primer
3’ End to Feature 5’ End
Check this box and specify the maximum distance in base pairs from
the Sense Primer 3’ End
Distance from Antisense
Primer 3’ End to Feature 5’
End
Check this box and specify the maximum distance in base pairs from
the Antisense Primer 3’ End
Table 20.13 Filter tab parameters – Amplify Features dialog box
Long PCR Dialog Box
Long PCR is similar to Find PCR Primers except that Vector NTI finds a set of primers for a
group of overlapped PCR products that cover the selected amplification region. Applications for
Long PCR include cloning of large genomic regions to search for polymorphisms and viral
genome amplification.
Note:
The selected region for amplification must exceed 20Kb in length for the Long PCR option to be
enabled.
Like the Find PCR Primers dialog box, clicking the More>> button enables complete view.
Only the tabs and parameters that differ from the Find PCR Primers dialog box will be discussed
here. For a description of the tabs and parameters common to the Long PCR and Find PCR
Primers dialog boxes, see page 248 to page 254.
258
Primer Design: PCR, Sequencing and Hybridization Chapter 20
Primer Tab
The options in the Primer tab (Figure 20.14) allow you to set parameters for Long PCR primer
search and define attachments, if desired. User-defined primers are not allowed
Figure 20.14 Primer tab – Long PCR Analysis dialog box
Primer Tab Parameters – Long PCR Dialog Box
Amplicon(s) Length
Specify the range for acceptable minimum and maximum product length. Vector NTI determines primers that will produce products within the set length
range.
Overlap(s)
Specify the range for acceptable minimum and maximum overlaps between
generated PCR products along the length of the long sequence. Vector NTI
determines primers that will produce products within the set length range.
User-Defined Primers
This feature is NOT present.
Table 20.14 Primer tab parameters – Long PCR dialog box
PCR Using Existing Oligos Dialog Box
PCR Using Existing Oligos is similar to Find PCR Primers except that, for the selected amplification region, VNTI searches for suitable PCR primers from among those selected from the Vector
NTI Oligo Database. Like the Find PCR Primers dialog box, clicking the More>> button enables
complete view.
Only the tabs and parameters that differ from the Find PCR Primers dialog box will be discussed
here. For a description of the tabs and parameters common to the PCR Using Existing Oligos
and Find PCR Primers dialog boxes, see page 248 to page 254.
259
Vector NTI Advance 10 User’s Manual
Primer Tab
The options in the Primer tab (Figure 20.15) allow you to set parameters for PCR primer search
using primers from the VNTI Database and define attachments, if desired. User-defined primers
are not allowed:
Figure 20.15 Primer tab – PCR Using Existing Oligos dialog box
Primer Tab Parameters – PCR Using Existing Primers Dialog Box
Sense Primers
Click the Sense Primers button and select the desired primer(s) from the
VNTI Oligo Database.
Antisense Primers
Click the Antisense Primers button and select the desired primer(s) from the
VNTI Oligo Database.
User-Defined Primers
This feature is NOT present.
Table 20.15 Primer tab parameters – PCR Using Existing Primers dialog box
Note:
Since you can choose the number of 3’ and 5’ primers, the PCR Using Existing Primers feature
effectively enables you to analyze one 3’ primer against an array of 5’ primers or vice-versa.
Alignment PCR Analysis
The Alignment PCR feature in Vector NTI allows you to design PCR primers for amplifying a
region of aligned DNA/RNA molecules. Using this feature you can design primer pair sets that
will amplify any of the DNA/RNA molecules in the specified alignment. In this type of PCR analysis, the molecules are first aligned in AlignX and the alignment is subsequently analyzed using
the Alignment PCR feature in Vector NTI.
Basic Steps in the Alignment PCR Process
The basic procedure for performing an Alignment PCR analysis consists of defining the set of
DNA/RNA molecules you want to use for Alignment PCR analysis, aligning the set of molecules
in AlignX and, finally, performing the Alignment PCR analysis on a selected region of the AlignX
alignment.
Defining DNA/RNA Molecules for Alignment PCR
In Vector NTI, you define the DNA/RNA molecules you want to use for Alignment PCR using the
Alignment PCR tab of the Lists dialog box. From the Alignment PCR tab of the Lists dialog box,
Align X is then launched so the alignment can be performed. Alternately, you can drag and drop
DNA/RNA molecules from the Vector NTI Database directly into AlignX or highlight molecules in
260
Primer Design: PCR, Sequencing and Hybridization Chapter 20
the Database and choose Align > AlignX – Align Selected Molecules from the menu to open
AlignX with the selected molecules, without using the Lists dialog box. However, using the Lists
dialog box to initiate Alignment PCR gives you the additional capability of saving molecule lists
for Alignment PCR that you do not have if you use AlignX directly.
Note:
For more information about using AlignX, see Chapter 14 and Chapter 28.
To launch the Lists dialog box, choose List > Show Lists or from the Vector NTI Workspace/
Molecule Viewing window and select the Alignment PCR tab or choose List > Alignment PCR
List or Analyses > Primer Design > Alignment PCR List to display the Alignment PCR tab
directly (Figure 20.16).
Figure 20.16 Alignment PCR tab of the Lists dialog box
Note:
Initially the text box on the Alignment PCR tab of the Lists dialog box is empty.
z
Add – Click the Add button to select molecules for Alignment PCR analysis from the
Vector NTI DNA/RNA Database.
z
Load – Click the Load button to load in a previously saved Alignment PCR molecule list
file (.apcr file).
z
Save – Click the Save button to save the current Alignment PCR molecule list to a file
(.apcr file).
z
Delete – Highlight a molecule on the list and click the Delete button to delete the molecule from the list.
z
Run – Launches AlignX for the molecules on the Alignment PCR list.
Once you have configured the Alignment PCR molecule list, click the Run button to continue.
Aligning DNA/RNA Molecules for Alignment PCR
The molecule alignment for Alignment PCR is performed in AlignX, as mentioned above. For
more information on aligning molecules in AlignX, see Chapter 14 and Chapter 28.
Performing the Alignment PCR Analysis
To launch the Alignment PCR dialog box, in the AlignX Alignment Pane highlight the region of
the alignment you want to analyze, right-click and choose Design PCR Primers from the shortcut menu. The Alignment PCR dialog box displays (Figure 20.17), allowing you to configure the
parameters for the PCR analysis.
Note:
The Alignment PCR dialog box is part of Vector NTI and In the case where Vector NTI is not currently open, when the Design PCR Primers command is executed Vector NTI opens first, followed by the Alignment PCR dialog box.
261
Vector NTI Advance 10 User’s Manual
Alignment PCR Dialog Box
Only the tabs and parameters of the Alignment PCR dialog box that differ from the Find PCR
Primers dialog box will be discussed in this section. For a description of the tabs and parameters
common to the Alignment PCR and Find PCR Primers dialog boxes, see page 248 to page 254.
Primer Tab
The options in the Primer tab (Figure 20.17) allow you to set parameters for the Alignment PCR
primer search and define attachments, if desired. User-defined primers are not allowed.
Figure 20.17 Primer tab on the Alignment PCR dialog box
Primer Tab Parameters – Alignment PCR Dialog Box
Primer/Every Molecule
Set the minimum overall similarity and 3’ end similarity for the primer with
every molecule in the alignment
Selection
Specify whether Vector NTI is to find primers inside or outside of the region of
the alignment selected for analysis
Amplicon Length Min.
Specify the minimum length for the PCR product
User-Defined Primers
This feature is NOT present.
Table 20.16 Primer tab parameters – Alignment PCR dialog box
262
Primer Design: PCR, Sequencing and Hybridization Chapter 20
Results Tab
The options in the Results tab (Figure 20.18) allow you to specify the output format of the Alignment PCR primer search.
Figure 20.18 Results tab on the Alignment PCR dialog box
Results Tab Parameters – Alignment PCR Dialog Box
Generate Report
Displays a report of the Alignment PCR results in a Preview window once
the analysis is completed. You can print, copy or save the report to your
hard drive from the Preview window (See Figure 20.29).
Note: Alignment PCR results must be saved to an external file; they cannot
be saved in the Text Pane of a particular molecule (as is the case for Find
Primers PCR results, for example), because they pertain to a group of molecules rather than an individual molecule.
Save PCR Product(s) as
DNA Molecule(s) to DB
Allows you to save the resulting PCR products to the Vector NTI Database.
Specify the name for the molecules and the DNA/RNA subset in which you
want to save them.
Save Primer(s) as
Oligo(s) to DB
Allows you to save the resulting PCR primers to the Vector NTI Database.
Specify the name for the primers and the Oligo subset in which you want to
save them.
Table 20.17 Results tab parameters – Alignment PCR dialog box
Alignment PCR Analysis Report
When the search is finished, if you have checked the Generate Report option on the Results
tab, the Alignment PCR Report preview window displays the results of the analysis. The Alignment PCR Analysis Report dialog box appearance and function is similar to the Multiplex PCR
Analysis report dialog box (Figure 20.29).
Note:
Alignment PCR results must be saved to an external file; they cannot be saved in the Text Pane
of a particular molecule (as is the case for Find Primers PCR results, for example), because
they pertain to a group of molecules rather than an individual molecule.
Multiplex PCR Analysis
Multiplex PCR allows you to design PCR primers for amplifying several target sequence regions
or features unambiguously in one reaction.
263
Vector NTI Advance 10 User’s Manual
Basic Steps in the Multiplex PCR Process
The basic procedure for performing a Multiplex PCR analysis consists of defining the selections
or features of the DNA/RNA molecules you want to use for Multiplex PCR analysis (selecting the
region and adding it to the Lists dialog box) and performing the Multiplex PCR analysis on the
selections and/or features you have designated.
Defining DNA/RNA Molecule Selections and/or Features
In Vector NTI you define the portion or feature(s) of a DNA/RNA molecule you want to use for
Multiplex PCR by first opening the molecule in a Molecule Viewing window. Once the molecule
is opened, select the region you are interested in analyzing or, in the case of Multiplex amplification of features, select a region containing the feature(s) you are interested in amplifying. After
you have selected the region for analysis, launch the Lists dialog box and add the selection or
feature type to the Multiplex PCR List tab.
To launch the Lists dialog box, choose List > Show Lists from the Vector NTI Workspace/Molecule Viewing window and select the Multiplex PCR tab or choose List > Multiplex PCR List or
Analyses > Primer Design > Multiplex PCR List to display the Multiplex PCR tab directly (Figure 20.19). Initially the Multiplex PCR tab of the Lists dialog box is empty.
Note:
Run GW (
) and Run TOPO (
) are tools for managing high throughput prepara-
tive PCR for these respective cloning technologies. They are described fully in Chapter 23.
Figure 20.19 Multiplex PCR tab of the Lists dialog box with added molecule selections
z
264
Add – Click the Add button to add the highlighted region/feature(s) to the Lists dialog
box. The Add Fragment to Multiplex PCR Analysis dialog box opens (Figure 20.20).
Primer Design: PCR, Sequencing and Hybridization Chapter 20
Important: If you have not highlighted a molecule or portion of a molecule or portion of a
molecule in a Molecule Viewing window in Vector NTI, the Add button is greyed out and
inaccessible.
Figure 20.20 Add Fragment to Multiplex PCR Analysis dialog box
z
Add Whole Selection – Adds the selected molecule region to the list for Multiplex PCR
analysis (Figure 20.19)
z
Add Features Inside Selection – From the molecule selection, adds the feature(s) that
you designate to the list for Multiplex PCR analysis. Click the Add button (
) to launch
the Add Feature dialog box (Figure 20.21) where you can choose the types of features
you want to add.
Figure 20.21 Multiplex PCR Add Features dialog box
o
Feature Type – Highlight the feature type from the molecule selection that you want
to add.
o
Add all features of this type – Adds all features of the selected type within the molecule selection.
o
Add only features…with the following names – Only adds features of the selected
type with the names that you specify in the names list.
Once you have added the appropriate feature/feature names, click the OK button to accept the
configuration. The Add Fragment to Multiplex PCR Analysis dialog box displays the new configuration (Figure 20.22):
Figure 20.22 All CDSs in the molecule selection added
265
Vector NTI Advance 10 User’s Manual
Note:
Highlight a feature and click the Remove (
ment to Multiplex PCR Analysis dialog box.
) button to delete the feature from the Add Frag-
Click the OK button to add the fragment features to the Lists dialog box (Figure 20.23):
Figure 20.23 Lists dialog box with added features
z
Load – Click the Load button to load in a previously saved Multiplex PCR molecule list
file (.mpcr file).
z
Save – Click the Save button to save the current Multiplex PCR molecule list to a file
(.mpcr file).
z
Delete – Highlight a molecule on the list and click the Delete button to delete the molecule from the list.
z
Run – Launches the Multiplex PCR Analysis dialog box.
Performing the Multiplex PCR Analysis
Click the Run button on the Lists dialog box to launch the Multiplex PCR Analysis dialog box
(Figure 20.25) where you can configure parameters for the PCR analysis (see Multiplex PCR
Dialog Box below).
Click the OK button to begin the primers search. The Searching for PCR Primers dialog box displays, indicating the progress of the search (Figure 20.24):
Figure 20.24 Searching for PCR Primers, Multiplex PCR
Multiplex PCR Dialog Box
Only the tabs and parameters of the Multiplex PCR dialog box that differ from the Find PCR
Primers dialog box will be discussed in this section. For a description of the tabs and parameters
common to the Multiplex PCR and Find PCR Primers dialog boxes, see page 248 to page 254.
266
Primer Design: PCR, Sequencing and Hybridization Chapter 20
Primer Tab
The options in the Primer tab (Figure 20.25) allow you to set parameters for the Multiplex PCR
primer search and define attachments, if desired. User-defined primers are not allowed.
Figure 20.25 Primer tab on the Multiplex PCR dialog box
Primer Tab Parameters – Multiplex PCR Dialog Box
Find Primers in Selection/
Feature
Set the parameter to search for primers outside or within the selection/
feature.
Clustering – Multiplex
Fold Minimum
Minimum number of selections/features with comparable parameters to
be considered a cluster.
Clustering – Amplicon
Length Difference Minimum
Minimum length in base pairs between the amplicons found for the different selections/features amplified within a cluster. A larger amplicon
length difference helps distinguish amplified products when run on a
gel, for example.
Clustering – Maximum/
Minimum Clusters
Directs the program to divide the selections/features analyzed into more
or less clusters. Minimizing the clusters in the case of large numbers of
selections/features may lead to increased instances of random priming
of found primers.
User-Defined Primers
This feature is NOT present.
Table 20.18 Primer tab parameters – Multiplex PCR dialog box
267
Vector NTI Advance 10 User’s Manual
Results Tab
The options in the Results tab (Figure 20.26) allow you to specify the output format of the Multiplex PCR primer search.
Figure 20.26 Results tab on the Multiplex PCR Analysis dialog box
Results Tab Parameters – Multiplex PCR Dialog Box
Generate Report (see
page 266)
Displays a report of the Multiplex PCR results in a Preview window once
the analysis is completed. You can print, copy or save the report to your
hard drive from the Preview window (see Figure 20.29).
Note: Multiplex PCR results must be saved to an external file; they cannot be saved in the Text Pane of a particular molecule (as is the case for
Find Primers PCR results, for example), because they generally pertain
to a group of molecules rather than an individual molecule.
Save PCR Product(s) as
DNA Molecule(s) to DB
Allows you to save the resulting PCR products from clusters to the Vector NTI Database. Specify the name for the molecules and the DNA/
RNA subset in which you want to save them.
Save Primer(s) as
Oligo(s) to DB
Allows you to save the resulting PCR primers from clusters to the Vector
NTI Database. Specify the name for the primers and the Oligo subset in
which you want to save them.
Table 20.19 Multiplex PCR dialog box, Results tab
Note:
268
At least one of the options on the Results tab MUST be selected before you are allowed to continue configuring parameters on the other tabs of the Multiplex PCR Analysis dialog box.
Primer Design: PCR, Sequencing and Hybridization Chapter 20
Cluster Tab
The options in the Cluster tab (Figure 20.27) specify how closely thermodynamic parameters
must match between all primers generated within a cluster.
Figure 20.27 Cluster tab, Multiplex PCR Analysis dialog box
Cluster Tab Parameters – Multiplex PCR Analysis Dialog Box
Tm Difference
Enter difference in degrees Celsius between Tm for primers in a cluster.
%GC
Enter the difference between GC percentages for primers in a cluster.
Primer-Primer Complementarity
Check the Permitted box for primer-primer complementarity; enter the
minimum permitted value for duplex free energy.
Primer-Primer 3’ End
Complementarity
Check the Permitted box for primer-primer 3’ end complementarity; enter
the minimum permitted value for duplex free energy.
Table 20.20 Cluster tab parameters, Multiplex PCR Analysis dialog box
Uniqueness Tab
The options in the Uniqueness tab (Figure 20.28) determine the uniqueness of the primers
generated with respect to the PCR product. These parameters can be used to help ensure that
generated primers bind to the desired template area with greater specificity than to the rest of
the PCR product.
269
Vector NTI Advance 10 User’s Manual
Note:
In the case of Multiplex PCR where many amplicons and primer sets may be used in the same
reaction, often the conditions must be relaxed to allow some level of ambiguity in order to obtain
results. Setting parameters to maximum stringency may result in no primers found.
Figure 20.28 Uniqueness tab, Multiplex PCR Analysis dialog box
Uniqueness Tab Parameters – Multiplex PCR Dialog Box
Uniqueness Checks for
Choosing the Entire Molecule option for Multiplex PCR
often results in the inability to form clusters. It is recommended that you choose the Only within Primers
Annealing Sites in Amplicons option for Multiplex PCR.
Table 20.21 Uniqueness tab parameters, Multiplex PCR Analysis dialog box
Multiplex PCR Analysis Report
When the search is finished, if you have checked the Generate Report option on the Results
tab, the Multiplex PCR Report preview window displays the results of the analysis (Figure
20.29):
Figure 20.29 Multiplex PCR Analysis results report
Three main folders in the report contain the details of the Multiplex PCR Analysis results:
270
Primer Design: PCR, Sequencing and Hybridization Chapter 20
z
Clusterized (Amplicons in Clusters) – Contains the PCR results for selections/features amplified within each cluster, organized according to cluster number. Number of
selections/features in the cluster appears in parenthesis in the cluster name. Clusters
are numbered consecutively beginning with 1 and are listed according to number of
selections/features in the cluster from highest to lowest as you move down the report.
z
Unclusterized (Amplicons not in any Clusters) – Contains the PCR results for selections/features amplified that could not be included as members of a cluster. The number
of unclusterized products is shown in parenthesis after the folder name.
z
Unamplified – Contains the names of selections/features that could not be amplified
using the parameters set in the Multiplex PCR dialog box. The number of unamplified
products is shown in parenthesis after the folder name.
Click the appropriate buttons to print, copy and/or save the PCR report from the report preview
dialog box.
Note:
Multiplex PCR results must be saved to an external file; they cannot be saved in the Text Pane
of a particular molecule (as is the case for Find Primers PCR results, for example), because
they generally pertain to a group of molecules rather than an individual molecule.
The PCR Analysis Folder
After all of the parameters are defined in the PCR Analysis dialog box, click OK to begin analyzing/designing the primers.
During PCR primer analysis, Vector NTI generates a number of primer options that satisfy the
conditions defined in the PCR Analysis dialog. These options are inserted into your Molecule
Display window’s Text Pane as subfolders of the PCR Analysis folder (Figure 20.30).
Note:
The PCR Analysis folder does not appear for Alignment PCR or Multiplex PCR Analyses. Alignment PCR and Multiplex PCR Analyses have their own reporting functions (see page 263 and
page 270, respectively).
Figure 20.30 PCR Analysis folder
In the PCR Analysis Folder, the primer results are sorted in descending order according to their
rating values calculated based on the importance factors assigned in the Qualities tab. The
subfolder titles are numbered and show the length and rating of the PCR products they contain.
The typical maximum rating is 171, although higher ratings are occasionally seen.
Each subfolder contains:
271
Vector NTI Advance 10 User’s Manual
z
The coordinates of molecule’s region included in the PCR product.
z
Melting temperature for the product
z
Optimum annealing temperature for the PCR reaction
z
GC percentage of the product.
The next two folder sections describe the sense and antisense primers, each identified at the
left with the primer icon (
).
z
Τhe complementarity between the primer and its target sequence
z
The actual primer sequence in the 5’J 3’ direction (with attached sequence, if any)
z
The primer length in nucleotides
z
The primer melting temperature
z
The primer’s GC percentage
z
Primer values for enthalpy, entropy, and free energy.
If the Check Primers for Restriction Sites From box was checked on the Structure tab of
the PCR Analysis dialog box (Figure 20.3), the primer section also contains a line showing
restriction sites found in the primers and attached sequences. A number in parentheses
after the cloning site name indicates the number of times that site occurs in the PCR product.
The last line in each product folder shows the difference in the melting temperatures and
GC percentages of the sense and antisense primers.
Operations with PCR Products
Note:
This section does not apply to Alignment PCR or Multiplex PCR Analyses. Alignment PCR and
Multiplex PCR Analyses have their own PCR products operation functions (see page 263 and
page 270, respectively).
Several operations can be performed on PCR products listed in the PCR Analysis folder in the
Text Pane. Place the cursor on a PCR product folder line in the Text Pane and open the shortcut
menu with its options:
z
Save as Molecule in Database saves the product as an independent molecule in the
database. This option first opens the New DNA/RNA Molecule tabbed dialog box
(described in Chapter 19). Enter a name in the text box on the General tab. You can’t tab
to the other pages without a name. The Description field on the DNA/RNA Molecule tab
automatically defines the origin of the fragment. After entering data, click the OK button
to save the product to the database.
z
Save to Database and Create Window option saves the fragment in the database and
immediately opens it in a display window. The option first opens the New Database Molecule dialog box, described immediately above. After entering information, click OK. The
molecule is saved to the database and is immediately loaded into a Molecule Display
window for your review.
z
Find PCR Product option selects in the Graphics Pane and Sequence Panes the exact
region of the molecule included in the PCR product. You can perform the same operation
by clicking the Find button (
) with the product folder selected or select Edit > Find
PCR product.
Operations with PCR Primers
Note:
272
This section does not apply to Alignment PCR or Multiplex PCR Analyses. Alignment PCR and
Multiplex PCR Analyses have their own PCR primers operation functions (see page 263 and
page 270, respectively).
Primer Design: PCR, Sequencing and Hybridization Chapter 20
Wherever you see the oligo symbol to the left of a primer sequence, (
), you can perform various oligo functions. Place the mouse cursor on the oligo line and open a shortcut menu with
these options:
z
Analyze opens the Oligo Analysis dialog box (see Chapter 21) for performing oligo analysis.
z
Add to Oligo List adds the primer to the Oligo List (see Chapter 21). This may be useful
if you want to investigate possible duplexes between sense and antisense primers or
order custom primers (For more information on ordering custom primers, see the next
section.)
z
Save To Database stores it in the database for future use.
Ordering Custom Primers
In Vector NTI Advance 10, you can order custom primers that you have generated and analyzed
in the software. Custom primers are synthetic oligonucleotides made with your specified
sequence for use in a variety of applications from PCR and sequencing to probes for gene
detection.
To initiate the order process, select the oligo from the PCR Analysis Text Pane folder by placing
the mouse cursor on the oligo line (indicated by the oligo symbol
to the left of a primer
sequence) and open a shortcut menu with a right click. Choose the Add to Oligo List feature.
In the New Oligo dialog box, enter the name of your oligo and click OK. (Additional information
pertaining to the New Oligo, such as user fields and keywords, can be entered in the New Oligo
dialog box. For more information on adding a new oligo to the database see page 72.) Vector
NTI verifies the oligo has been added.
Open the Oligo List dialog box by selecting List > Oligo List. Select the appropriate oligo(s) and
click the Order button (
). The Invitrogen webpage opens automatically, and your primer
sequence is entered in the custom primer order form. Enter your name and any custom modification you want, such as standard deoxynucleotides, modified bases, 5´ modified nucleotides
(including fluorescent dyes, enzyme conjugates), and S-oligos for antisense studies. Specifications also include scale of synthesis, level of purity and 5’ or 3’ modifications. Press the Add to
Cart button and proceed to checkout, following the steps outlined on the website.
Saving, Viewing and Printing PCR Analysis Results
Note:
This section does not apply to Alignment PCR or Multiplex PCR Analyses. Alignment PCR and
Multiplex PCR Analyses have their own PCR saving/reporting functions (see page 263 and
page 270, respectively).
The Vector NTI Advance data type, Analysis Results, enables you to save PCR analysis results
to the Vector NTI Advance Database. Saving PCR analysis results to the Database, allows you
to view the results in a Molecule Viewing window at a later date and print the results, including
the PCR Settings used for the analysis.
Saving PCR Analysis Results to the Database
To save PCR analysis results to the Database, after performing the analysis, right-click on the
PCR Analysis folder in the Text Pane of the Molecule Viewing window and choose Save As
273
Vector NTI Advance 10 User’s Manual
Analysis Result from the shortcut menu. In the dialog box that opens, name the PCR analysis
and select the Analysis Results subset to which you want to save it (Figure 20.31):
Figure 20.31 Saving PCR results to the Database
Viewing Saved PCR Analysis Results
To view PCR analysis results saved in the Database, open the molecule for which the analysis
was performed and saved. In Display Setup, make sure that Analyses is checked and that the
Analyses Setup is configured appropriately (see Analyses Setup, page 221). This tells Vector
NTI to display the designated analyses in the Molecule Viewing window as part of your display
profile (Figure 20.32):
Figure 20.32 Saved PCR results displayed in the Molecule Viewing window
Tip:
You may want to save one display profile with Analyses turned on and one with Analyses
turned off, so that you may easily choose either profile from your list of saved profiles.
Printing PCR Analysis Results and Settings
When the Analyses parameter is turned on in the display profile, Analysis Results are shown in
the Graphics and Sequence Panes and the details of the analysis appear in the Text Pane in the
External Analyses folder in a subfolder named according to the name you specified when you
saved the result to the Database. The analysis settings you used to perform the PCR analysis
appear in the PCR Analysis Settings subfolder.
You can copy with the Camera the results of your PCR analysis, including PCR settings, and
print them as follows:
1. Open the folders of interest in the Text Pane.
274
Primer Design: PCR, Sequencing and Hybridization Chapter 20
2. Highlight the desired information.
3. Copy the selection to the Clipboard (or file) using the Camera tool.
4. Paste from the Clipboard (or open the saved file) into a text editor program.
5. Print from the text editor program.
Sequencing Primers
To find primers for sequencing a DNA molecule fragment when the molecule is opened in a
DNA Molecule Display window, select the target sequence of the molecule—the region to be
sequenced. Primers will be generated anywhere within the designated the “Primer Hybridizing
Domain” (upstream and downstream). If the sequencing region is long enough, it is divided by
Vector NTI into sequencing domains, areas in which a single sequencing reaction will take
place. The size of the primer hybridizing domain may then be set (the region in which primers
are sought) as well as other desired primer parameters. Several primer options are evaluated
and sorted from best to worst.
To prepare for sequencing primer design, open a sequence or Molecule Display window for the
molecule and select the region for analysis, using ordinary selection techniques (described in
Chapter 3).
Select Analyses > Primer Design > Sequencing Primers. This command is disabled if a
selection zone is not defined. This opens the Sequencing Primers dialog box (Figure 20.33).
Sequencing Primers Dialog Box
Figure 20.33 Sequencing Primers dialog box
The options in this dialog box allow you to set parameters for sequencing primer search:
Sequencing Primers Dialog Box Parameters
DNA/RNA
Select the type of nucleotide sequence.
Sequencing Region
Region that you want to sequence. Enter the start and end coordinates
of the region to be sequenced.
Sequencing Domain
Enter the number of bases to be sequenced in a single sequencing
reaction.
Table 20.22 Sequencing Primers dialog box parameters
275
Vector NTI Advance 10 User’s Manual
Sequencing Primers Dialog Box Parameters
Primer Hybridizing Domain
Enter the length of region where primers for each sequencing domain
should be sought. Primers are generated within the set domain.
Maximum Number of Primer
Options for Each Domain
Enter the number of primers to be found for each sequencing domain.
(The actual result may contain fewer primers than this number if there
are not enough possible primers.)
User-Defined First Primer
Enter a user-defined nucleotide sequence to be evaluated as a primer
for the FIRST sequencing domain instead of leaving primer search to
Vector NTI.
Analyze
Click the Analyze button to analyze a specified primer in the Oligo
Analysis dialog box (see Chapter 21).
Primer Similarity
Click the Primer Similarity button to specify similarity requirements in
the Similarity of sequencing Primers dialog box (Figure 20.34). (See
Table 20.23)
Primer Parameters
Click the Primer Parameters button to set parameters for sequencing
primers in the Primer/Oligo Parameters dialog box (Figure 20.35). (See
Table 20.24 for description.)
Primer Quality Specifics
Click the Primer Quality Specifics button to open the Primer/Oligo
Quality Specifics dialog box (Figure 20.36) for assigning “importance
factors” to sequencing primers.
Table 20.22 Sequencing Primers dialog box parameters (continued)
After all parameters are defined, click OK to search for the primers. During primer analysis, Vector NTI generates a number of primer options that satisfy the conditions you have defined. The
primer options appear in the Text Pane as subfolders (Figure 20.30).
Primer Similarity Dialog Box
Click the Primer Similarity button in the [Sequencing Primer] [Hybridization Probe] Analysis
box to open this dialog box to specify similarity requirements for the primer(s)/probe (Figure
20.34).
Figure 20.34 Primer Similarity dialog box
Primer Similarity Dialog Box Parameters
Best Fit
Check this button to specify the search for site(s) with maximum similarity
with no set threshold.
> = Similarity Threshold
Check this button to indicate similarity site search above the specified
similarity threshold.
Similarity Threshold
Enter the percentage of minimally acceptable similarity.
Table 20.23 Primer Similarity dialog box parameters
276
Primer Design: PCR, Sequencing and Hybridization Chapter 20
Primer Similarity Dialog Box Parameters
Last ... Nucleotides Must
Have 100% Similarity
Check and specify the number of nucleotides necessary to have 100%
complementarity with the target sequence at the 3’ end.
Similarity Between Ambiguous Nucleotides
The Average, Minimum, and Maximum buttons specify the acceptable
similarity between an ambiguous nucleotide pair. For instance, if you are
calculating similarity between N and A, the average similarity is 25%, the
minimum similarity is 0%, and the maximum similarity is 100%. In case of
R and A they are 50%, 0%, and 100%; in case of R and T - 0%, 0%, and
0%.
See similarity chart on page 218.
Table 20.23 Primer Similarity dialog box parameters (continued)
Primer/Oligo Parameters Dialog Box
Click the Primer Parameters button in the [Sequencing Primer] [Hybridization Probe] Analysis
box to open this dialog box to specify acceptable limits for the interaction of the primer(s) or
hybridization probes (oligo) with the selected target sequence (Figure 20.35).
Figure 20.35 Primer/Oligo Parameters dialog box
Primer/Oligo Parameters
dG Temperature
Enter the temperature in degrees Celsius to be used for calculating free
energy values.
Probe Concentration
Enter the value of probe concentration in pMol, if known.
Salt Concentration
Enter the value of salt concentration in mMol, if known.
% Formamide
When hybridizing in formamide, enter the formamide concentration in %.
Length
Enter primer length limits. Note: Nucleotide sequences such as RENs
attached to a primer’s 5’ end are included when calculating primer length.
%GC
Enter the limits of G/C percentage in the primer and the difference between
GC percentages for sense and antisense primers.
Tm
Enter limits in degrees Celsius for primer melting temperature (Tm) (temperature at which 50% of primer is a duplex) and the difference between
Tm for sense and antisense primers.
Table 20.24 Primer/Oligo parameters
277
Vector NTI Advance 10 User’s Manual
Primer/Oligo Parameters
3’ End
Specify parameters for the primer’s 3’ end. In the Length for Analysis field,
enter the length of the primer 3’ region that should be analyzed. In the dG
<= field, specify the maximum permitted value of 3’ end free energy. Check
the nucleotide boxes to specify permitted last primer nucleotides.
Hairpin Loop Stem
Length > =
Enter the minimum number of base pairs in a hairpin stem. (This value is
also used as a minimum stacking length for primer-primer complementarity
and primer-primer 3’ end complementarity.)
Palindromes <=
Enter the maximum permitted length of palindromes in primers.
Nucleotide Repeats <=
Enter the maximum permitted length of nucleotide repeats in primers.
Hairpin Loops
Check the Permitted box for hairpin loops; enter the minimum permitted
value for free energy of hairpin loops. Primers with hairpin loops which
have free energy values > /= to this number will be accepted.
Primer-Primer Complementarity
Check the Permitted box for primer-primer complementarity; enter the minimum permitted value for duplex free energy.
Primer-Primer 3’ End
Complementarity
Check the Permitted box for primer-primer 3’ end complementarity; enter
the minimum permitted value for duplex free energy.
Check All Features Only
Within 3’ Region of …
Check this box and enter the length of a 3’ region if all of a primer’s features (repeats, palindromes, hairpin loops, dimers) should be checked only
within that 3’ region.(If this box is empty, the whole primer will be evaluated.)
Primers/Oligos Must Be
Unique With Similarity ...
Check this box and enter the similarity threshold to check primer uniqueness on the molecule. Primers which have parasitic hybridization with similarity > /= this threshold will be rejected. Note: this similarity threshold must
be </= the minimum similarity required for hybridization of user-defined
primers (if any).
Table 20.24 Primer/Oligo parameters (continued)
Primer/Oligo Quality Specifics Dialog Box
Click the [Primer]/[Oligo] Quality Specifics button in the [Sequencing Primer] [Hybridization
Probe] Analysis box to open this dialog box to assign “importance factors” to different primer/
oligo parameters (Figure 20.36).
Figure 20.36 Primer/Oligo Quality Specifics dialog box
The importance factors are integers between 1 and 10 used in calculating the score evaluating
primer/oligo quality. The lower the factor, the less weight given in the calculation. For example,
for minimal importance, enter 1 in the appropriate box. For maximum importance, enter 10.
278
Primer Design: PCR, Sequencing and Hybridization Chapter 20
The Sequencing Primers Folder
Figure 20.37 Sequencing Primers folder
The Sequencing Primers folder (Figure 20.37) contains one subfolder with primers for each
sequencing domain in the analyzed region. Subfolder titles are numbered and show the length
and boundaries of the sequencing domains. Each subfolder contains:
z
The primer sequence, in the 5’ J 3’ direction
z
The primer hybridization site and primer similarity for that site
z
The primer length in nucleotides
z
Melting temperature for the primer
z
GC percentage of the primer
z
Values for enthalpy, entropy, and free energy
Wherever you see the oligo symbol to the left of a primer sequence, (
), you can perform various oligo functions. The shortcut menu associated with these primers, launched by right clicking on the primer sequence, has these options:
z
Analyze opens the Oligo Analysis dialog box (see Chapter 21) to perform oligo analysis.
z
Add to Oligo List adds the primer to the Oligo List (see Chapter 21). This can be useful
to investigate possible duplexes between sense and antisense primers or to order custom primers. For more information on ordering custom primers, see page 273.
z
Save To Database stores it in the database for future use.
Hybridization Probes
Hybridization probes analysis is used to design oligonucleotides that will hybridize with a
selected molecule fragment, within specified parameters. Vector NTI can generate a set of oligos or use user-defined or database-stored oligos to test for hybridization efficiency with a target
molecule.
Open a Molecule Display window for the molecule and select the region for analysis, using ordinary selection techniques (described in Chapter 3).
Select Analyses > Primer Design > Hybridization Probes. This command is disabled if a
selection zone is not defined. This opens the Hybridization Probes dialog box (Figure 20.38).
279
Vector NTI Advance 10 User’s Manual
Hybridization Probes Dialog Box
Figure 20.38 Hybridization Probes dialog box
Set parameters in this dialog box for successful hybridization of your probes with your target
fragment:
Hybridization Probes Dialog Box Parameters
Search Region
Enter the start and end coordinates of the region where oligos should
be hybridized:
DNA/RNA
Select the type of nucleotide sequence.
Maximum Number of
Output Options
Enter the number of oligos you would like to find. The actual result may
contain fewer oligos than this number if there are not enough possible
oligos.
User-Defined Oligo (s)
Enter an oligo’s nucleotide sequence or choose an oligo from the oligo
database to check hybridization qualities of a specific oligo.
Enter oligo subset name or choose a name from oligo subsets if you
want to check hybridization qualities of all oligos in this subset.
Analyze
Click the Analyze button to analyze a specified oligo. This button
brings up the Oligo Analysis dialog box (See Chapter 21).
Oligo Similarity
Click the Oligo Similarity button to open the Probe Similarity dialog
box (Figure 20.34) to specify similarity requirements. (See Table 20.23)
Oligo Parameters
The Oligo Parameters button opens the Primer/Oligo Parameters dialog box (Figure 20.35). for setting parameters for probes. (SeeTable
20.24 for description.)
Oligo Quality Specifics
Click the Oligo Quality Specifics button to open the Primer/Oligo
Quality Specifics dialog box (Figure 20.36) for assigning “importance
factors” to probes.
Table 20.25 Hybridization Probes dialog box parameters
280
Primer Design: PCR, Sequencing and Hybridization Chapter 20
The Hybridization Probes Folder
Hybridization probe analysis generates oligos that will hybridize with the target sequence and
stores them in the Hybridization Probes folder (Figure 20.39) in the Text Pane.
Figure 20.39 The Hybridization Probes folder
If a user-defined oligo was specified, the Hybridization Folder contains only that oligo, if it could
hybridize in the defined conditions. The Hybridization folder contains one subfolder for each
probe for the analyzed region.
Subfolder titles show the name of the oligo contained within.
For each oligo, the subfolders contain:
z
The nucleotide sequence of the probe in the 5’-3’ direction
z
The oligo hybridization site and similarity
z
The oligo length in nucleotides
z
The oligo melting temperature
z
The oligo GC percentage
z
Oligo values for enthalpy, entropy, and free energy.
Wherever you see the oligo symbol to the left of a probe sequence, (
), you can perform
various oligo functions. Place the mouse cursor on the oligo line and right click to open a
shortcut menu with these options:
z
Analyze opens the Oligo Analysis dialog box (see Chapter 21) to perform oligo analysis.
z
Add to Oligo List adds the primer to the Oligo List (see Chapter 21). This may be useful
if you want to investigate possible duplexes between sense and antisense primers or
order custom primers. For more information on ordering custom primers, see page 273.
z
Save To Database stores it in the database for future use.
281
Vector NTI Advance 10 User’s Manual
282
C
H A P T E R
21
SEARCH AND ANALYSIS TOOLS
Introduction
This chapter describes Vector NTI’s search and analysis functions, including Oligo analyses,
ordering Custom Primers, Motifs and ORF searches, Mutagenesis, Translation, Back Translation and various Restriction Enzyme analyses.
Oligonucleotide Analyses
This section describes Vector NTI’s oligonucleotide functions, including the Oligo List and the
Oligo Editor, Thermodynamic Properties analysis, and Oligo Duplexes dialog boxes. Vector NTI
Oligo analysis tools are summarized in the following table:
Analysis/Dialog Box
Purpose
Oligo List
Stores a list of oligos for current use. From this dialog box, add new,
edit, analyze, or order oligos.
Edit/New Oligo
Enter new or edit oligo data, including name, sequence, user fields,
comments, keywords.
Thermodynamic Properties (Oligo Analysis)
Set limits for annealing conditions with target sequence; analyze
oligo for meeting specified criteria.
Dimers and Hairpin Loops
Examine oligo’s dimer and hairpin loop structures.
Oligo Duplexes
Generate all possible duplexes of selected oligos.
Table 21.1 Oligo Analysis Tools
The Oligo List
The Oligo List is a data clipboard for listing and analyzing oligonucleotides from a display window or from the database. Oligonucleotides can be user-defined or determined by selecting a
target sequence and letting VNTI design an oligo for the sequence. From this central list, you
can add new oligos or select existing ones for editing and analysis.
283
Vector NTI Advance 10 User’s Manual
To open the Oligo List tab of the Lists dialog box (Figure 21.1), in the Vector NTI workspace or
Molecule Viewing windows, click the Open Oligo List button (
) on the Main Toolbar or
choose List > Oligo List from the menu.
Figure 21.1 Oligo List dialog box
Note:
Initially, the Oligo List is empty.
Button options in the dialog box are summarized as follows:
Oligo List Dialog Box Parameters
Add
Opens the Oligo Editor dialog box (Figure 21.2) to enter a new oligo to the Oligo list.
Note: The calculation does not include an H atom at the 5' end and an OH group at the 3'
end of the oligo. It does include the PO4 group at the 5' end.
Load
Loads oligos into the list from the VNTI oligo database.
Save
Click Save to Database button (
) to save it in the database.
Edit
Opens the Oligo Editor dialog box (Figure 21.2) to edit the selected oligo.
Remove
Removes the selected oligo from the Oligo List.
Analyze
Initiates oligo analysis on the selected oligo. (See Figure 21.1)
Duplexes
Investigates the duplexes on one or more oligos. (See Figure 21.1)
Order
Link to Invitrogen to order custom primers (see section on Ordering Custom Primers
below).
Table 21.2 Oligo List dialog box parameters
Order Custom Primers
In Vector NTI Advance 10, you can order custom primers that you have generated and analyzed
in the software. Custom primers are synthetic oligonucleotides made with your specified
sequence for use in a variety of applications from PCR and sequencing to probes for gene
detection.
Open the Oligo List dialog box by selecting List > Oligo List (Figure 21.1). Select the appropriate oligo(s) and click the Order button (
). The Invitrogen webpage opens automatically,
and your primer sequence is entered in the custom primer order form. Enter your name and any
custom modification you want, such as standard deoxynucleotides, modified bases, 5´ modified
nucleotides (including fluorescent dyes, enzyme conjugates), and S-oligos for antisense studies. Specifications also include scale of synthesis, level of purity and 5’ or 3’ modifications. Press
the Add to Cart button and proceed to checkout, following the steps outlined on the website.
284
Search and Analysis Tools Chapter 21
Oligo Editor Dialog Box
To open the New/Edit Oligo dialog box, called the Oligo Editor:
z
Database Explorer: select the Oligo subset in the drop-down menu, select an oligo from
the list in the Object Pane and double-click on it, select Oligo > Edit or press the Edit
button (
).
z
Molecule Viewing window: In the Text Pane showing oligos, highlight an oligo and
either right click and select Add to Oligo List from the shortcut menu or click on the Add
to Oligo List button (
), or click Add in the Oligo List dialog box (see previous section).
The dialog box that opens is the same for a new oligo or one to be edited (Figure 21.2).
Figure 21.2 Oligo Editor dialog box
The Oligo Editor contains information for one oligo at a time. In the New Oligo dialog box, you
will enter all data including the oligo sequence (except when opened from an oligo in a Text
Pane folder. In that case, the sequence is already entered.) To enter or modify information about
an oligo on the tabs:
General: Enter or edit the name of the oligo.
Oligo:
z
Select a radio button for the oligo type.
z
Check the Reverse Complementary box to replace the oligo with its complementary
sequence.
z
In the Nucleotide Sequence box, enter or edit the standard I.U.B. base code characters
for the molecule sequence. (See Appendix C.)
z
Enter the oligo’s description.
User Fields: Modify custom data in a form of fields (see Chapter 17 for User Fields details.)
Comments: Enter text comments about the oligo.
Keywords: To add a keyword for the oligo, type a new word or select an item in the list of existing keywords. Click the < Add button to move the keyword into the oligo’s keyword list. To
remove an item from the keyword list, select it and press the > Remove button.
Exit Oligo Editor by clicking OK or Cancel.
285
Vector NTI Advance 10 User’s Manual
Thermodynamic Properties Analysis (Oligo Analysis) Dialog Box
Oligonucleotides for analysis can be selected by selecting a target sequence and letting VNTI
design an oligo for the sequence or entering a user-defined oligo.
z
Select a target sequence in an open Molecule Display window, and select Analyses >
Oligo Analyses > Thermodynamic Properties; the oligo selected by Vector NTI is displayed in the text box of the Oligo Analysis dialog box (Figure 21.3) that opens.
z
Open the Oligo Analysis dialog box first with Analyses > Oligo Analyses > Thermodynamic Properties, and then enter a user-defined oligo sequence in the Oligonucleotide
text box
or
You can also select an oligo listed in a Text Pane folder and select Analyze from the shortcut
menu.
Figure 21.3 Oligo Analysis dialog box
Select radio buttons for molecule type, and check Complementary to replace the oligo with its
complement.
The Parameters column lets you accept default settings or specify acceptable limits for the
interaction of the oligo with its selected target sequence. Settings are summarized as follows:
Oligo Analysis Parameters
dG Temperature
Enter the temperature in degrees Celsius to be used for calculating free
energy values.
Probe Concentration
Enter the value of probe concentration in pMol.
Salt Concentration
Enter the value of salt concentration in mMol.
%Formamide
When hybridizing in formamide, enter the formamide concentration in %.
3’ End Length (bp)
Specify the length of the oligo 3’ region that should be analyzed.
Palindromes
Enter the minimum length of palindromes to search for.
Nucleotide Repeats
Enter the minimum length of nucleotide repeats to search for.
Table 21.3 Oligo Analysis parameters
286
Search and Analysis Tools Chapter 21
Oligo Analysis Parameters
Stem Length
Enter the minimum number of base pairs in a hairpin or dimer stem.
Table 21.3 Oligo Analysis parameters (Continued)
Note:
The calculation for Tm is dependent on primer and salt concentrations; varying these concentrations can greatly affect the Tm for any given primer. Make sure to adjust these parameters
according to your reaction conditions when performing your oligo analysis to ensure that you
obtain accurate Tm values.
After these parameters are set, click Analyze. Results are summarized in the same dialog box
as follows:
Oligo Analysis Results
Mol. Wt
Molecular weight of the oligo.
%GC
The percentage of G and C in the oligo.
Therm. Tm
The melting temperature (temperature at which 50% of the oligo is a duplex) calculated
by the Nearest-Neighbors method. This is useful for short oligos, < ~35 bp.
% GC Tm
The %GC Tm field shows the melting temperature calculated by the %GC method.
This is useful for long oligos, > ~35-40 bp.
dG
The free energy values of the entire oligonucleotide.
3’ End dG
The free energy of the 3’ end of the oligo.
dH
The enthalpy of the entire oligo.
dS
The entropy of the entire oligo.
Palindromes
Examine the palindromes in the oligo.
Nucleotide
Repeats
Examine the nucleotide in the oligo.
Table 21.4 Oligo Analysis results
Click the Dimers & Hairpin Loops button to examine the oligo’s dimers and hairpin loops. Both
are undesirable secondary structures that interfere with hybridization or amplification efficiency.
287
Vector NTI Advance 10 User’s Manual
Dimers & Hairpin Loops Dialog Box
Figure 21.4 Dimers & Hairpin Loops dialog box
Note:
In the graphical depiction of dimers and hairpin loops, vertical lines indicate the primary interaction, based on the stem length set and plus symbols indicate secondary interactions. The
greater the dG value, the weaker the interaction; secondary interactions are not considered in
the dG calculation.
Dimers
Dimers are formed when one oligo anneals to another oligo. See the Dimer example in the
upper pane of Figure 21.4. Examine the dimers the oligo contains. Click the Next (
to view the next dimer. Click the Previous button (
) button
) to view the previous dimer.
Hairpin Loops
Hairpin loops are formed when an oligo doubles back on itself. See the Hairpin Loop example in
the lower pane of Figure 21.4. Examine the hairpin loops the oligo contains. Click the Next
(
) button to view the next hairpin loop. Click the Previous button (
hairpin loop.
Note:
288
) to view the previous
To avoid any of the observed results in your final product, modify the oligo or the parameter settings and re-analyze the oligo.
Search and Analysis Tools Chapter 21
Oligo Duplexes Dialog Box
This dialog box is opened by pressing the Duplexes button in the Oligo List dialog box or by
selecting Analyses > Oligo Analyses > Oligo Duplexes. The Oligo Duplexes dialog box (Figure 21.5) allows you to generate all possible duplexes of selected oligonucleotides.
Figure 21.5 Oligo Duplexes dialog box
The upper pane shows oligonucleotides that are currently in the workspace. Select one oligo to
analyze self-duplexes. Select any two oligos to analyze their cross-duplexes. Options in the dialog box are summarized as follows:
z
Analyze: analyzes duplexes of the selected oligos when one or two oligos are selected,
click to generate. At least one, but no more than two oligos, must be selected to enable
the Analyze button.
z
Save Results: Save results to the database.
z
Add New: opens the Oligo Editor to enter a new oligo for the Oligo Duplexes workspace.
z
Remove: removes selected oligos from the workspace.
z
Database: adds oligos to the workspace from the oligo database.
z
Oligo List: adds oligos to the workspace from the Oligo List.
z
dG Temperature: enter the temperature in degrees Celsius to be used for calculating
free energy values.
z
Stem Length: enter the minimum acceptable number of base pairs in a hairpin or dimer
stem.
The display pane at the bottom shows the dimers found in oligos selected in the top display window. The stem length and dimer dG are shown. Use the scroll bar to move left or right along the
dimer. Click the Next button (
) to view the next dimer. Click the Previous button (
) to
view the previous dimer.
Note:
In the graphical depiction of duplexes, vertical lines indicate the primary interaction, based on
the stem length set and plus symbols indicate secondary interactions. The greater the dG value,
the weaker the interaction; secondary interactions are not considered in the dG calculation.
289
Vector NTI Advance 10 User’s Manual
ORFs and Motifs Search
You can use Vector NTI tools to search for ORFs and user-defined motifs on DNA molecules.
Both searches are launched from setup dialog boxes where you define parameters for the
search. To initiate either search, in a Molecule Display window select Analyses > ORF or Analyses > Motifs or click the Display Setup button (
) and select Display Setup from the dropdown menu. In the Display Setup dialog box, check the Motifs or ORFs checkbox to activate the
Motifs Setup or ORFs Setup button, opening the corresponding dialog box. The parameters in
these boxes are discussed in depth in Chapter 18.
After setting parameters, click OK to launch either search.
ORFs Search Results
ORFs search results are displayed in a Text Pane folder, listing the ORF regions meeting the
criteria specified in the search. ORFs are displayed as black arrows in the Graphics Pane (Figure 21.6). Phase indicators in the left margin of the Sequence Pane show the phases of the
ORFs. For the direct strand, the phase is determined by the position of the first select nucleotide
relative to the beginning of the molecule. For the complementary strand, the phase is determined by the position of the last selected nucleotide relative to the end of the molecule. To eliminate the ORF arrow display, return to the Display Setup dialog box and uncheck ORFs Setup.
Figure 21.6 ORFs search results
Ultimate ORF Blast
Invitrogen has generated a database of proprietary ORFs, the Invitrogen Ultimate™ ORF collection. With the Ultimate ORF BLAST web tool in Vector NTI Advance, you can BLAST your fragments obtained from an ORF search against the Ultimate™ ORF collection. Using this tool, you
may determine that your sequence has been previously characterized and is commercially
available from Invitrogen.
To launch a search using Ultimate ORF Blast, select the target sequence by left-clicking and
dragging the mouse across nucleotides in the Sequence Pane, or locating the folder in the Text
Pane (under the Open Reading Frames subfolders) containing the target sequence. Click on
the target sequence. With the target sequence selected, select Tools > Ultimate ORF Blast.
The Sequence Data dialog box opens, allowing you to set the search parameters:
290
Search and Analysis Tools Chapter 21
z
Range selects the range of the target sequence: the entire sequence, a selected
sequence or a selected CDS.
z
Strand selects either the direct or complementary strand.
Click OK to begin the search or Cancel to abort the search process.
The Ultimate ORF Blast tool copies your target sequence and pastes it into the UltimateTM ORF
Browser Sequence Text entry box located on the Invitrogen webpage, which opens automatically when you launch this tool.
Select the animal species to search the sequence query against, checking the Human and/or
Mouse checkbox located above the Sequence Text entry box. To proceed with your search,
click the BLAST button. The Blast dialog box appears, informing you that it is blasting your
sequence.
Once your search is completed, the UltimateTM ORF Browser displays your search results. If
your search identifies similar ORFs, the target sequence, or UltimateTM ORF clone, is commercially available through the Invitrogen website, http://www.invitrogen.com.
Motifs Search Results
Motifs found in a motifs search are displayed in a Motifs folder in the Text Pane and concurrently
on the molecule map in the Graphics Pane (not shown). The shortcut menu that opens from a
selected motif lists three commands specific to motifs:
z
Motif Site Properties displays the site and the percent similarity of the query motif with
that found on the molecule at that site
z
Add Motif Site to F(eature)Map opens the Molecule Feature dialog box where you can
name and categorize the motif before adding it to the molecule.
z
Find Motif site (in the Graphics Pane) positions the caret at the motif site on the molecule map.
Mutagenesis
In a DNA/RNA Molecule Display window, you can search for “silent mutations” which, in any
selected region, do not affect amino acid translation of the selected DNA but result in presence
or disappearance of one or more restriction sites. You can search separately for direct or complementary sequence strand mutations.
To search for the silent mutations make sure that Display Setup contains Restriction Map
options for an at least one restriction enzyme. Select a region of a molecule in the display window and choose Analyses > Mutagenesis>Direct (or Complementary) Strand.
In the Choose Restriction Enzymes dialog box that opens, select one or more restriction
enzyme sites to be analyzed. Select at least one enzyme.
Note:
You can only analyze restriction sites for the enzymes listed in the dialog box. To modify the
enzyme selection, select Analyses > Restriction Analyses > Restriction Sites to open the
Restriction Map Setup dialog box where you can modify the list of RENs in use. For a discussion
of Restriction Map Display Setup, see Chapter 18.
Click OK to initiate the mutagenesis search. Vector NTI analyzes the selected region of the molecule and attempts to generate suitable silent mutations. The reading frame for amino acids is
defined by the start of the selected region so that the first three nucleotides of the selected
region form the first codon.
Note:
The program is able to find both “single” (just one nucleotide altered) and “multiple” (several
neighbor nucleotides altered) mutations for any elementary event (appearing and/or disappear-
291
Vector NTI Advance 10 User’s Manual
ing of at least one site) significantly widening the set of possible solutions compared to just “single”-mutation analysis.
The analysis results are listed in the Mutagenesis folder (Figure 21.7) of the Text Pane of the
display window.
Figure 21.7 Mutagenesis folder
The folder contains a list of mutation options that result in the appearing and/or disappearing of
at least one restriction site. The options are sorted by the position of the first altered nucleotide.
If you selected the complementary strand option, mutation coordinates on both complementary
and direct strands are listed.
To identify a mutation region on the molecule for each mutation option, set the cursor on a numbered line under the Region line. Click the Find button (
), the CTRL + F keys, select Edit >
Find Mutation, or the corresponding command on the shortcut menu. This locates the nucleotides to be altered according to the mutation option.
Translation
Vector NTI offers a number of translation options, both for translating in the Sequence Pane of
the Molecule Viewing window and for translating into a new molecule.
292
Search and Analysis Tools Chapter 21
Translating in the Sequence Pane
A variety of Sequence Pane translation options are available under the Analyses drop down
menu by choosing Analyses > Translation > In Sequence Pane > <translation option> (Figure 21.8):
Figure 21.8 Analyses menu Sequence Pane translation options
Notes:
z
Direct Strand – displays a translation of the direct strand selection in the current frame
z
Complementary Strand – displays a translation of the complementary strand selection
in the current frame
z
6 Frame Translation – displays six translations of the selection, three direct strand and
three complementary strand translations, in the Sequence Pane
z
Feature(s) – displays the translation of the selected Feature(s)
z
ORFs – displays translations of ORFs displayed in the Graphics Pane according to filtering parameters that you designate
z
Translations of the direct strand appear above the sequence; translations of the complementary strand appear below the sequence.
z
You can select three- or one-letter amino acid codes through the Display Setup dialog
box.
To clear Sequence Pane translations, do one of the following:
z
Click the Erase Translations button (
)
z
Choose View > Clear All Translations from the drop-down menu or the corresponding
command from the shortcut menu.
Translating into a New Protein Molecule
You can translate a DNA/RNA molecule selection into a new Protein molecule stored in the Vector NTI Database. The selected portion of a DNA/RNA molecule can be translated (direct or
complementary strand) and saved in the Vector NTI Database by choosing the File > Create
New Sequence > Using Translation Procedure (Protein) > <strand option> from the dropdown menu in the Vector NTI Molecule Viewing window.
293
Vector NTI Advance 10 User’s Manual
Other options for translating DNA/RNA selections into new protein molecules are available
under the Analyses drop-down menu by choosing Analyses > Translation > Into New Protein
> <translation option> (Figure 21.9):
Figure 21.9 Analyses menu translation into new Protein molecule options
Note:
z
Direct Strand – creates a new protein molecule from the direct strand translation of the
current selection
z
Complementary Strand – creates a new protein molecule from the complementary
strand translation of the current selection
z
6 Frame Translation – creates six new protein molecules, one for each of the three
direct and three complementary frame translations
z
Feature – creates a new protein molecule from the translation of the selected feature
z
CDS with Splicing – creates a new protein molecule from an Intron/Exon CDS feature
by joining the Exons and then translating
Protein molecules created by translation display a table of codon usage in the Analysis folder in
the Text Pane of the Molecule Viewing window.
Setting the Genetic Code for DNA/RNA Translations
In Vector NTI, Standard genetic code is used for translations by default. However, you can
choose from among a list of alternate genetic codes or create your own custom genetic code to
use for translations.
For more information on genetic codes, see http://www.ncbi.nih.gov/Taxonomy/Utils/
wprintgc.cgi?mode=c.
294
Search and Analysis Tools Chapter 21
To change the genetic code used in translations, select Analyses > Translation > Set Genetic
Code from the drop-down menu in the Vector NTI workspace or Molecule Viewing windows.
The Genetic Codes dialog box appears (Figure 21.10):
Figure 21.10 Genetic Codes dialog box
From the drop-down list at the top of the Genetic Codes dialog box, select the type of genetic
code you want to use for translations (Figure 21.11):
Figure 21.11 Genetic Codes dialog box code selection drop-down list
If the desired genetic code type is not available on the drop-down list or if you want to create
your own custom genetic code, click the New button on the Genetic Codes dialog box (Figure
21.12):
Figure 21.12 Naming the new genetic code
295
Vector NTI Advance 10 User’s Manual
In the New Genetic Code dialog box, type in the name for the new code you are about to define
and click the OK button to continue. The Genetic Code dialog box now displays the name of
your new code and the buttons for defining the new code are enabled (Figure 21.13):
Figure 21.13 Defining a custom genetic code
To define your custom genetic code, perform the following steps:
z
Highlight the amino acid you want to change in the table on the left side of the Genetic
Codes dialog box
z
Press the appropriate amino acid button on the right side of the dialog box to redefine
the highlighted box in the table
z
Repeat the above two steps for each amino acid you want to change in the table
z
Click the OK button to save your custom genetic code and designate it as that to be
used for translations
When a custom genetic code is selected in the Genetic Codes dialog box, the Delete button is
enabled, allowing you to delete the custom created code from the drop-down selection list.
Note:
When a non-standard genetic code is displayed in the Genetic Codes dialog box, amino acids
that differ from the Standard code appear shaded, as is seen in the following figure (Figure
21.14):
Figure 21.14 Non-standard code with highlighted amino acids
296
Search and Analysis Tools Chapter 21
Back Translation
The Back Translation feature of Vector NTI Advance allows you to obtain a DNA sequence from
a protein sequence by reversing the translation process. You can select from a list of codon
usage table options or configure your own custom codon usage table. You can also set the display to show degrees of ambiguity in the Back Translation, from most ambiguous to most probable, as defined in the selected translation table.
Opening the Back Translation Dialog Box
You can launch the Back Translation dialog box (Figure 21.15) either from a Protein Molecule
display window or from the Vector NTI Suite program files on your hard drive or Start menu as
follows:
z
From a Protein Molecule Display window, choose Analyses > Back Translation.
z
From the Start menu, choose Programs > Invitrogen > Vector NTI Suite 10 > Utilities
> Back Translation.
z
From the Vector NTI Suite program files on your hard drive, double-click on the Back
Translation executable file (BT.exe).
If you open the Back Translation dialog box from a Protein Molecule display window, the dialog
box opens with that protein displayed. If you open the Back Translation dialog box from the Start
menu or Vector NTI program files, an empty Back Translation dialog box opens. To populate the
empty Back Translation dialog box, select File > Open from the menu to open previously saved
protein documents or drag and drop a Protein Molecule from the Vector NTI Protein Database
into the Back Translation dialog box.
Figure 21.15 Back Translation dialog box
The protein sequence appears in the upper pane of the Back Translation dialog box in a format
similar to that in the Sequence Pane of a Protein Molecule Display window. The back translation
appears in the lower pane of the Back Translation dialog box. You can change the Codon Usage
and Translation tables used for the back translation, which you can display in one or three-letter
code and to various degrees of degeneracy.
297
Vector NTI Advance 10 User’s Manual
Codon Usage Tables
The Back Translation feature in Vector NTI allows you to specify the codon usage table you
want to use for the back translation. You have the option of choosing the codon usage table
from a list of many thousands of stock codon usage tables or of creating and using your own
custom codon usage table.
Back Translation also has the ability to detect and repair damaged/corrupt codon usage tables.
Changing the Codon Usage Table
The current Codon Usage Table used for back translation appears in the Codon Usage Table
section below the sequence. To change the current codon usage table, click the Change button
or choose Table > Change Codon Usage Table from the menu to open the Codon Usage
Tables dialog box (Figure 21.16):
Figure 21.16 Codon Usage Tables dialog box
z
Important:
Current Table Name – shown in the grey area above the codon usage table values. A
list of codon usage table choices appears on the left side of the dialog box. Highlight the
table of interest to select it. The selected codon usage table data appears on the right.
A newly selected table must be registered as the new current table. See the Use Table bullet
below.
You can navigate through the codon usage table list by highlighting an entry in the list and typing
the first letter (or first few letters, quickly), using the keyboard, of the name of the codon usage
table you want to move to. The list scrolls to that area.
298
z
Filter – provides another method of selecting a codon usage table. Type the name or
part of the name of the codon usage table in the Filter text box and click the << Apply
Filter button to select it. Codon usage table names containing the entered text display in
the list; any table names not containing the entered phrase are filtered out of the list.
z
Create Table – clears the codon usage data from the right side of the dialog box. To create a new, custom codon usage table, enter the desired codon usage data, designate a
new name (or the name of an existing codon usage table if you want to overwrite that
table) in the Table Name field. Click the Save Table button to save the new table to the
list.
Search and Analysis Tools Chapter 21
Note: You can also “create” a new table by modifying an existing table. To modify an existing table, display the table and replace the appropriate displayed codon usage values.
z
Copy + Rename – allows you to copy the selected table and designate a new name for
the copy.
z
Paste Table – allows you to paste in a new codon usage table from the Clipboard. The
table must be pasted in the format found at the following Codon Usage Database site:
www.kazusa.or.jp/codon. At this site, navigate to the table of interest, highlight the table,
beginning with the table name and ending with the last codon/codon information listed in
the table (you can also highlight only a portion of the codon information, if you do not
want the entire table). In the Vector NTI Codon Usage Table, click the Paste button to
paste in the table. You are asked to confirm or designate a name, depending on whether
or not you included the table name as part of the copied text.
z
Save Table – allows you to save to the list a newly created or modified codon usage
table.
z
Delete Table – deletes the selected table from the list.
z
Use Table – registers the table as that to be used in the Back Translation dialog box.
When you press this button, the Codon Usage Tables dialog box closes and the selected
table appears in the Codon Usage Table field of the Back Translation dialog box.
z
Important: If you do not click the Use Table button to register a newly selected table,
when you close the Codon Usage Table dialog box, the table choice in the Back Translation dialog box defaults to the previously registered codon usage table.
Repairing Corrupt Codon Usage Tables
When you open the Back Translation dialog box, an automatic scan of the codon usage tables is
performed. If the tables are undamaged and no corruption is detected, the back translation dialog box opens normally, as described above. If Back Translation detects corruption in the codon
usage tables file, a message dialog box appears offering you the option of repairing the codon
usage tables immediately or repairing them at a later time. If you choose Yes, Back Translation
repairs the tables immediately. If you choose No, you can execute the repair command manually at any time by choosing Table > Repair Corrupted Tables from the Back Translation menu.
Translation Tables and Codon Ambiguity
In the Back Translation dialog box, you can vary the level of codon ambiguity by sliding the
slider from Least Degenerate to Most Degenerate or any setting in between. Ambiguity is displayed to the degree set by the slide bar as determined by the designation translation table.
By default, the Standard genetic code translation table is selected in the Back Translation dialog
box. To change the Translation table, select from among the options in the drop-down box. For
more information on genetic codes, see http://www.ncbi.nih.gov/Taxonomy/Utils/
wprintgc.cgi?mode=c.
Back Translation Copy Options
The resulting back translation sequence can be copied to the Clipboard by clicking the Copy All
or Copy Selection buttons at the bottom of the screen. The resulting sequence can be pasted
in the Vector NTI Sequence Editor (see Chapter 20) to create a new molecule in Vector NTI. If
you copy using the Camera tool, you have the choice of copying the original sequence or the
299
Vector NTI Advance 10 User’s Manual
translation to either the Clipboard or to an external text file. Choose Camera on the Main Menu
to launch the Camera dialog box (Figure 21.17):
Figure 21.17 Back Translation Camera dialog box
z
Pane – Select the pane you want to copy.
z
Range – Select the part of the sequence you want to copy, all or selection, if you have
made a selection.
z
Copy To – Select the location for the copy.
Restriction Analyses
Restriction Fragments/Restriction Sites
From an open DNA/RNA Molecule Display window, you can calculate restriction fragments that
are the result of cutting the molecule with any subset of enzymes constituting the restriction
map.
With a Molecule Display window open, select Analyses > Restriction Analyses > Restriction
Fragments. In the dialog box that opens, all enzymes are selected by default. Click Unselect
All and select at least one restriction enzyme in the list for “digesting” your molecule.
Note:
To modify the enzyme you can use for calculating restriction fragments, select Analyses >
Restriction Analyses > Restriction Sites to open the Restriction Map Setup dialog box. Here
you can change the list of RENs in use. For a discussion of Restriction Map Display Setup, see
Chapter 19.
Vector NTI calculates the appropriate restriction fragments and lists the results in the Restriction
Fragments folder of the Text Pane.
To easily identify a restriction fragment on the molecule map in the Graphics Pane, set the cursor on the appropriate line in the Restriction Fragments folder. Click the Find button (
), or
select Edit > Find Fragment or the corresponding command on the shortcut menu.
RFLP Analysis
RFLP (Restriction Fragment Length Polymorphism) analysis detects variations in the banding
patterns of different DNA fragments that have been subjected to restriction enzyme digestion.
These restriction fragment length differences originate from polymorphic regions on the DNA
and can be used as markers on both physical and genetic linkage maps. Such differences in
RFLP profiles have revolutionized criminal investigations and have become powerful tools in the
identification of individuals in paternity and maternity cases, population genetics and in the diagnosis of a variety of diseases.
300
Search and Analysis Tools Chapter 21
RFLP Analysis Dialog Box
Vector NTI’s RFLP Analysis function performs a virtual RFLP assessment for two selected molecules and any number of selected restriction enzymes. To begin an RFLP analysis, choose
Analyses > Restriction Analyses > RFLP from the drop-down menu in a Molecule Viewing
window. The Select Molecules and Enzymes for RFLP Analysis dialog box appears (Figure
21.18):
Figure 21.18 Select Molecules and Enzyme for RFLP dialog box
Note:
z
In the Source Molecules section, select a Database subset and highlight the two molecules you want to analyze. The highlighted molecules move to the Selected for RFLP
section on the right side of the dialog box. To remove a molecule from the Selected for
RFLP section, click on it to un-highlight it in the Source Molecules section.
z
In the Source Enzymes section, select an Enzyme subset and highlight the enzyme you
want to use for the analysis. The selected enzyme moves to the Selected for RFLP section. To remove an enzyme from the Selected for RFLP section, click on it to un-highlight
it in the Source Enzymes section.
Only one enzyme may be selected for this analysis.
z
Click the Calculate button to initiate RFLP analysis.
RFLP Analysis Results
Unfiltered results of the RFLP analysis for the selected molecules and enzymes are displayed in
the RFLP dialog box (Figure 21.19):
Figure 21.19 RFLP results dialog box
301
Vector NTI Advance 10 User’s Manual
The RFLP results dialog box shows the resulting digestion products for the two analyzed molecules with each of the selected restriction enzymes.
z
Use Filter – Initially the results are unfiltered (i.e. results for all analyzed restriction
enzymes are shown). You can subsequently filter the results by checking the Use Filter
box, specifying the filtering parameters in the Number Of Sites In sections and clicking
the Apply button (Figure 21.20):
Figure 21.20 Filtered RFLP results
z
Results –Double-click on the enzyme entry in the RFLP Results section to view the
digestion fragments for the analyzed molecules with that enzyme (Figure 21.21).
Figure 21.21 Digestion fragments dialog box
z
Create Gel – Launches the Gel Setup dialog box so you can perform a gel analysis on
the RFLP results for an enzyme analysis. For more information on Vector NTI’s Gel
Analysis function, see Chapter 25.
Finding Common Non-Cutter Restriction Enzymes
The Find Common Non-Cutting Enzymes tool in Vector NTI performs a restriction analysis on
two or more selected DNA/RNA molecules for one or more selected restriction enzymes. The
tool reports non-cutting enzymes from the selected list that are common to all molecules
selected for analysis.
To launch the Non-Cutting Enzymes tool, choose Analyses > Restriction Analyses > Find
Common Non-cutter RENs from the drop-down menu in a Vector NTI DNA/RNA Molecule
viewing window. The Non-Cutting Restriction Enzymes dialog box appears with the active molecule selected for analysis (Figure 21.22):
302
Search and Analysis Tools Chapter 21
Figure 21.22 Non-cutting Restriction Enzymes dialog box
Note:
z
Molecules – Lists the molecules in the Vector NTI Database DNA/RNA Molecule subset
selected in the Subset drop-down box.
z
Enzymes – Lists the enzymes in the Vector NTI Database Enzyme subset selected in
the Subset drop-down box.
z
Selected for Analyses – Lists the DNA/RNA Molecules and Enzymes you have
selected for Non-cutter Enzyme analysis. Allows you to set an upper limit for cut sites;
enzymes that cut more than the designated number of times are ignored.
Initially, the Selected for Analyses section of the dialog box is not populated.
Highlight the molecules you want to analyze in the Molecules section and click the > button to
enter those molecules into the Selected for Analyses section. Click the >> button to enter all
the molecules in the selected subset into the Selected for Analyses section.
Highlight the enzymes you want to use for the analysis in the Enzymes section and click the >
button to enter those enzymes into the Selected for Analyses section. Click the >> button to
enter all the enzymes in the selected subset into the Selected for Analyses section.
Click the Start button to begin the analysis. When the analysis process completes, the Preview:
Non-Cutting Enzymes Report window displays (Figure 21.23):
Figure 21.23 Non-Cutting Restriction Enzymes Report preview window
303
Vector NTI Advance 10 User’s Manual
Non-cutting enzymes common to the molecules analyzed are listed in the Preview: Non-Cutting
Enzymes Report window. From the Preview: Non-Cutting Enzymes Report window, you can
print the file directly, copy it with the Camera feature to the Clipboard or file, or save it directly to
an external file.
Restriction Report
You can create a restriction analysis report for the active molecule with all the enzymes in your
Vector NTI Enzyme Database using Vector NTI’s Restriction Report analysis tool. To create a
restriction analysis report for a molecule, open the molecule in a Molecule Viewing window in
Vector NTI and choose Analyses > Restriction Analyses > Restriction Report from the Main
Menu. When the analysis is completed, a summary of the results appears in the Report Preview
window (Figure 21.24):
Figure 21.24 Restriction Report results for M13mp11
The Restriction Report result has two sections, Cutters and Non-Cutters. The Cutters folder
shows, for each cutting enzyme, the enzyme name, recognition sequence and cut site position(s) on the analyzed molecule. The Non-Cutters section shows the list of the enzymes that do
not cut the analyzed molecule.
304
C
H A P T E R
22
MOLECULE CONSTRUCTION
Introduction
This chapter describes the essentials of creating new molecules with Vector NTI. Features of
two important dialog boxes used for molecule creation—the Construct/Design Molecule dialog
box, and the Molecule Editor—are discussed.
This chapter covers the following points:
z
descriptions of molecule types: basic and constructed
z
differentiating in Vector NTI between molecule Construction and Design
z
preparing fragments for Construction using Fragment Wizard
z
using the Construct/Design Molecule dialog box as a tool for molecule creation
z
modifying component fragments termini with biochemical operations
z
using Molecule Editor to prepare molecule fragments
z
importing molecules
Molecule Types: Basic And Constructed
Molecules in Vector NTI can be of two fundamental types: basic and constructed.
Basic molecules are not built from component fragments. Their sequences, Feature map, and
restriction maps of unsequenced regions (DNA molecules only) are entered by the user or
imported from other databases.
Constructed molecules are built from one or more fragments. For DNA molecules, these can
be fragments of existing DNA molecules, linkers, adapters, etc. The Feature map and nucleotide sequences of parent molecules are automatically transferred to a constructed DNA molecule. You can add features to the Feature map in addition to those obtained from the ancestors.
Constructed DNA molecules are created by Construction or Design, Vector NTI terms for
recombinant processes that are differentiated below.
305
Vector NTI Advance 10 User’s Manual
Protein molecules can be constructed by translating a certain region of a DNA molecule. A constructed protein molecule does not receive any Feature map from its parent DNA molecule.
Methods of creating new DNA/RNA molecules
In Vector NTI, there are several different ways of creating new DNA/RNA molecules:
Basic Molecules:
z
Importing molecules or sequences (including their feature tables) in the following formats: GenBank, GenPept, EMBL, SWISS-PROT, FASTA, and ASCII text. You can also
import molecule data from “quasi-GenBank” files (that is, GCG’s “GenBank” output files).
Molecule import is discussed on page 182.
z
Creating new molecules “from scratch.” You can define a molecule’s nucleotide or
amino acid sequence by hand or paste it from the clipboard and enter the sequence as
a new molecule, describing the feature and restriction maps if you wish. This is
described in Chapter 19 (see page 237).
Constructed Molecules:
Note:
306
z
Creating new DNA/RNA or Protein molecules by splicing together the exons of an
Intron-Exon join feature of another molecule. In the case of Protein molecule creation,
the spliced molecule is subsequently translated and stored in the VNTI Protein Database. A molecule created by this method is considered a constructed molecule; it is a
child molecule of the molecule it was spliced (or spliced and translated) from.
z
Construction of new DNA/RNA molecules from compatible components fragments
from other molecules, linkers, adapters, etc. In Construction, the fragments and restriction sites are entirely defined by the user.
z
Design of new DNA/RNA molecules from components also in a user-defined fragment
list. In Design, however, instead of personally choosing the restriction sites, methods of
terminus modification, etc., the user turns the Design process over to Vector NTI. The
software takes advantage of the best possible restriction sites and genetic engineering
techniques to design the recombination process.
z
Translation of new Protein molecules from selected portions of existing DNA/RNA
molecules. A protein molecule created by this method is considered a constructed molecule; it is a child of the DNA/RNA molecule from which it was translated. For more information on creating new protein molecules using various translation procedures, see
Translating into a New Protein Molecule, page 293.
For creating new molecules, Vector NTI must be in Molecule Editing mode, the default mode
when the Molecule Display window opens.
Molecule Construction Chapter 22
Creating New DNA/RNA or Protein Molecules Using Splicing
For molecules with a marked intron/exon CDS feature (denoted by the join statement in the molecules GenBank file, see Figure 22.1), you can create a new molecule from the intron/exon feature by splicing out the introns and joining the exons.
Figure 22.1 Join statement in GenBank file denoting intron/exon CDS feature
To create a new molecule by splicing the intron/exon feature of another molecule, open the molecule with the intron/exon feature in a Molecule Viewing window, select the intron/exon feature
in the Graphics Pane and choose File > Create New Sequence> Using Splicing (DNA/RNA/
Protein) from the drop-down menu. The Create New Molecule(s) by Splicing dialog box
appears (Figure 22.2):
Figure 22.2 Create New Molecule(s) by Splicing dialog box
In the Source section of the Create New Molecule(s) by Splicing dialog box the following information is defined:
z
Molecule Name – this is preset according to the name of the opened molecule
z
Feature Position – predefined according to the molecule selection when the Create
New Molecule(s) by Splicing dialog box is launched
307
Vector NTI Advance 10 User’s Manual
z
Feature Type(s) To Splice – initially, the Splice Feature Types box is empty; you must
select the feature type(s) to splice from the Add Features dialog box. To add a feature
type, click the plus sign button to the right of the Splice Feature Types box (Figure 22.2).
This opens the Add Features dialog box (Figure 22.3):
Figure 22.3 Add Features dialog box
z
Strand – direct or complementary
The Target section indicates the type for the resulting spliced molecule. If Protein is selected,
the feature is spliced and then translated into a Protein molecule.
In the Results Should Be From section, you can define the number of spliced products you want
generated:
z
Min # of Exons – specify the minimum number of exons to splice to create a product.
z
Max # of Exons – specify the maximum number of exons to splice to create a product.
Vector NTI creates the range of all possible spliced products between the specified minimum
and maximum number of exons. If you want only the full length product (all exons spliced), enter
the total number of exons in both the Min # of Exons and Max # of Exons fields. Unchecking
the Results Should Be From box results in the generation of all possible products from one
exon in length to the maximum possible number of joined exons for the selected molecule feature.
Tools for Creating New Constructed and Designed DNA/RNA Molecules
Vector NTI has three important tools for creating new constructed molecules: the Fragment Wizard, the Construct/Design Molecule dialog box and the Molecule Editor. The process of creating
a molecule generally follows these steps, in an active Graphics Pane:
1. Define the component fragments for the recombinant molecule using Fragment Wizard.
2. Add defined fragments to the Goal Molecule Definition List.
3. Open the Construct/Design Molecule dialog box where you set construction parameters.
4. Name, select data and describe the new molecule.
5. Verify and edit, where needed, the component fragments in the Goal Molecule Definition List.
6. Initiate molecule construction.
If construction is successful, your molecule is entered into the database and is opened in a new
Molecule Display window.
The Molecule Editor is the tool for editing existing database molecules and for creating new
basic molecules from scratch. For details, refer to page 237.
308
Molecule Construction Chapter 22
Construction Tips:
z
Before you begin, open display windows for all of the molecules that are fragment
sources. If you have several display windows open concurrently, the source molecule for
your fragment must be the topmost window.
z
It is sometimes convenient to work with two Molecule Display windows on display at the
same time. Select Window > Tile Vertical. For each window, resize the Graphics Pane
and molecule maps using the split bars, scroll bars and Zoom buttons to optimize viewing of the graphics. Click in a display window to activate it; an active window is designated by a dark blue Title Bar.
Describing Component Fragments in the Fragment Wizard
The Fragment Wizard guides you through several steps required to fully define molecule fragments suitable for construction or design. While in view, it allows you to continue to work in the
Graphics Pane to select the fragment, while providing visual feedback and explanation of the
actions.
To define a fragment using Fragment Wizard, open a display window for the molecule to be the
source of a fragment.
Activate the Graphics Pane and click the Add Fragment To Goal List button (
), or select
List > Add Fragment to Goal List, opening the Fragment Wizard dialog box (Figure 22.4):
Figure 22.4 Fragment Wizard dialog box
The Fragment Wizard screen changes to display the entry fields and descriptions corresponding
to the current step in the fragment definition process.
At any point in the process, you can choose to Cancel, go Back a screen, go to the Next
screen, or Finish the process using the appropriate buttons. (Finish goes directly to the last
step, skipping all the remaining steps, if any. Fragment Wizard goes through all the steps you
skipped and supplies the missing information using default values and the coordinates of the
current selection in the Display window.)
In the first screen (Figure 22.4):
Select the fragment type and process: Construction fragment, Design Recipient fragment and
Design Donor fragment. Since this chapter covers Construction, select Construction Fragment.
Design donor and design recipient fragments are discussed in Chapter 24.
When Construction fragment is selected, you can specify that the fragment should be inverted in
the constructed molecule by checking the Insert Inverted box. Click the Next button to proceed.
309
Vector NTI Advance 10 User’s Manual
In the second screen (Figure 22.5):
Specify the 5’ terminus of a new fragment. The options are:
z
Set to a position on the molecule map (in one of the two following ways)
1. Enter the coordinate in the text box or CLICK in the Graphics Pane of the display window. In the latter case, the option button will be selected automatically and the caret
position is displayed in the position field of the dialog box and on the Status Bar. Use left
or right arrows to reposition the caret.Tip: If, when you click in the Graphics Pane, the
entire molecule is selected (as indicated by the wire-frame), click in the Sequence Pane
to deselect, and begin again.
2. Specify the start of the molecule
To set the 5’ terminus at the start of the molecule, select the Start of Molecule option in the
dialog.
z
Specify a restriction site.
Click on the site or its label in the Graphics Pane. The name of the restriction endonuclease
and the position of the site are displayed in the Set to a Restriction Site box.
Note:
If the Fragment Wizard screen limits your view of the molecule map, click on its title bar and
drag it out of the way.
Figure 22.5 Specifying the 5’ terminus of a new fragment
Click the Next button to proceed.
In the third screen (Figure 22.6):
Specify the 3’ terminus of the fragment. Options are:
z
Specify a position on the molecule map (in one of the two following ways)
1. Enter the position in the text box or SHIFT + CLICK in the Graphics Pane on a position,
restriction site or label, automatically selecting this option. The 5’-3’ selection is now
indicated with a wire-frame in the Graphics Pane and in the set selection box on the
Status Bar. Reposition the 3’ end using SHIFT + the left or right arrows.
2. Specify the Start or End of the Molecule
The selection is indicated with a wire-frame and on the Status Bar.
z
Specify a restriction site.
SHIFT
310
+ CLICK on the site or its label in the Graphics Pane.
Molecule Construction Chapter 22
Tip:
The SHIFT key must be held down for all actions in the Graphics Pane for setting the 3’ end. If
you neglect to do this, your actions will change the 5’ terminus and Fragment Wizard will revert
to screen 2.
Figure 22.6 Specifying the 3’ terminus of the fragment
Click the Finish button, completing the fragment definition.
Review the description of the selected fragment in the New Fragment message box (Figure
22.7).
Figure 22.7 New Fragment message box
If you made a mistake, press Cancel to return to the Fragment Wizard. Otherwise, click the Add
to List button, adding the fragment to the Goal Molecule Definition List and closing the Fragment Wizard.
Now go to the Molecule Display window for the molecule source of the second Construction
fragment and define it using the Fragment Wizard in the manner just described. After reviewing
your fragment as before in the New Fragment dialog box, enter it into the Goal Molecule Definition List.
The Goal Molecule Definition List (Goal List)
The Goal Molecule Definition List is a list of fragments that will be combined to create a new
molecule.
You can add fragments to the Goal Molecule Definition List using the Fragment Wizard as just
described or you can add them directly from the Construct dialog box.
To see the Goal Molecule Definition List, click the Open Goal List button (
) on the Main
Toolbar or choose List > Molecule Goal List. At the bottom of the Lists dialog box (Figure 22.8)
311
Vector NTI Advance 10 User’s Manual
that opens, the Fragments display lists the fragments currently on the Goal Molecule Definition
List.
Figure 22.8 Lists dialog box
Constructing a New Molecule
The Construct & Design Molecule Dialog Boxes
In these dialog boxes, you can describe the new molecule to be constructed (or designed) and
saved into the Vector NTI database. Also you can open it for an existing constructed or
designed database molecule to reconstruct/redesign it, that is, after changing its component
fragments.
To open the Construct or Design dialog box, first open the Lists dialog box from a Molecule Display window by clicking the Open Goal List button (
) or selecting File > Create New
Sequence > Using Construct/Design Procedure (DNA/RNA) or selecting List > Molecule
Goal List. Click the Run button on the Lists dialog box to display the Construct or Design Molecule dialog box. The dialog box is automatically loaded with the new molecule described
through Goal Molecule Definition List.
Note:
There are two operational modes—a mode for molecule Construction and mode for molecule
Design. The appropriate mode is set automatically when you designate the component fragment type in Fragment Wizard. The title of the box “Construct Molecule” or “Design Molecule”
reflects the mode. (If this dialog box is opened before the method is designated, the box title is
also Construct Molecule.) Because Construction is the subject of this chapter, we will refer to it
as Construct Molecule dialog box (Figure 22.9).
Figure 22.9 Construct Molecule dialog box
Enter or select the dialog box fields as follows:
312
z
Name - enter a new name for the molecule to be constructed
z
Circular/Linear - the form of the molecule.
z
DNA/RNA - molecule type
z
Click the General Info button to enter molecule description information:
Molecule Construction Chapter 22
o
Description - notes about the molecule
o
Extra-Chromosome Replication - transformation systems
o
Replicon Type - molecule’s replicon type
o
Keywords - keywords useful for database search. See page 171.
o
Click OK to return to the Construct dialog box.
o
All of the General Info data will appear in the General Description folder when the
molecule is loaded into a Display window.
z
Recipient’s Start - start of the new molecule is as close as possible to the start of the
“recipient” component fragment (the first fragment listed of the Component Fragments).
z
Position ... specify a specific nucleotide of a specific fragment as the starting nucleotide
of the new molecule. (By default, the first nucleotide of the first fragment.)
The Component Fragments Field
The Fragments field in the Lists dialog box contains the Goal Molecule Definition List. Constructed molecules consist of one or more component fragments that can be verified, entered,
deleted, repositioned or edited in this field. In addition, you can add new fragments of five types,
described below in the section on adding new fragments.
To perform an operation on a fragment, select it and press one of the following enabled buttons:
z
Edit: This action can also be initiated by double-clicking the fragment. In the dialog box
that opens, you can edit fragment information. The specific dialog box appears depends
on the type of the fragment you have highlighted. Five fragment types (described below
in the section on adding new fragments) each have their own Edit dialog box.
z
Delete: The selected fragment disappears from the list.
z
Reposition a fragment: To change the position of a fragment in the list, highlight the
fragment you want to move, and click the Up or Down buttons to change its position in
the list.
The molecule will be constructed from the fragments in the order shown, so changing the
positions in the list changes the resulting molecule. The fragment listed first is always considered the “recipient” fragment.
Adding New Component Fragments
To add a new fragment to the list of component fragments, click the Add button above the Fragments field and choose the desired fragment type from the drop down list. In the corresponding
Fragment Editor dialog box that opens, you can enter information about the new fragment:
z
Dummy: A Dummy fragment can be created for a recombinant molecule as a last resort
when a DNA fragment length is known but the exact sequence is not. Residues in
Dummy fragments are added as “nucleotides” only. They will appear in a sequence as
“N”.
When you add or edit a Dummy fragment, the Dummy Fragment dialog box (Figure
22.10) appears where you can enter the number of unsequenced nucleotides the fragment contains:
Figure 22.10 Dummy Fragment dialog box
313
Vector NTI Advance 10 User’s Manual
Dummy fragments have blunt termini. A Dummy fragment must be inserted into a vector
with compatible linkers or adapters flanking the sequence. To add REN sites to ends of a
Dummy fragment, see the Linker section below.
z
Sequence: Sequence fragments are user-specified oligonucleotides. When you add or
edit a Sequence fragment, the Sequence Fragment dialog box appears (Figure 22.11):
Figure 22.11 Sequence Fragment dialog box
In the Nucleotide Sequence field, enter an oligonucleotide up to 120 units long. With the
radio buttons, indicate direct or complementary orientation.
Sequence fragments have blunt termini. A Sequence fragment must be inserted into a
vector with compatible linkers flanking the sequence. To add REN sites to ends of a
Sequence fragment, see the Linker section below.
z
Linker: Linker fragments are single restriction sites that can have short flanking
sequences. They are used to link together longer fragments in Construction or Design.
When you add or edit a Linker fragment, the Linker Fragment dialog box (Figure 22.12)
appears:
Figure 22.12 Linker Fragment dialog box
In the Restriction Site field, enter the name of the restriction endonuclease being used or
click the Browse button (
) to select from a list of RENs in the database.
In the Left Nucleotides and Right Nucleotides fields, you can enter nucleotide sequences
flanking the restriction site.
Once the restriction site is in place, select the radio button that indicates whether the
linker should be the whole restriction site or whether it will attach at the left end or the
right end of another sequence or dummy fragment.
If you click Whole, then both ends of the Linker are blunt. If you click Left, the 5’ end is
blunt and the 3’ end is the restriction site. If you click Right, the 3’ end is blunt and the 5’
end is the restriction site.
Examples:
If you want restriction site Linkers to be attached on each end of a sequence to be
cloned, you must generate a right and a left Linker. In the following example, the Left
Linker will ligate to the 5’ end of the digested recipient fragment and the Right Linker will
ligate to its 3’ end.
314
Molecule Construction Chapter 22
Construction Tip: To add linkers at each end of a Dummy or Sequence fragment, they
should be listed in the Component Fragment list in the following order:
z
o
Recipient Fragment
o
Linker (Left Linker)
o
Dummy or Sequence
o
Linker (Right Linker)
Adapter: Adapter fragments are like linkers except that in the Adapter Fragment dialog
box, you enter or edit nucleotides manually or choose the components of the Adapter
Fragment from the Enzyme and Oligo Databases. Adapters with sticky or blunt ends can
be designed. Adapters are often special-ordered from a synthesizer vendor, as they tend
to be linkers that are “adapted” to the given experiment/need at hand.
When you specify adding an Adapter, the Adapter Fragment dialog box appears (Figure
22.13). In Vector NTI, an Adapter consists of a 5’ or 3’ left terminus, a central doublestranded part, and a 5’ or 3’ right terminus, although any part of an Adapter fragment is
optional.
Figure 22.13 Adapter Fragment dialog box
In the Adapter Fragment dialog box, enter these segments manually in the appropriate
fields of the dialog box or click the appropriate Load button near the bottom of the
Adapter Fragment dialog box to select the various Adapter parts from the Restriction
Enzyme or Oligo Databases:
Once you have selected the appropriate Oligo and left and right Restriction Enzymes for
the Adapter, click the Calculate Adapter button to calculate and enter the sequence into
the upper portion of the Adapter Fragment dialog box (Figure 22.14):
Figure 22.14 Adapter parts from Database calculated
Once you have completed your Adapter fragment design, click the OK button to add the
new Adapter to the Fragment List.
315
Vector NTI Advance 10 User’s Manual
z
Note:
Add Fragment: There are three choices available from the Add Fragment selection,
adding a fragment from the molecule that is currently in focus in the VNTI workspace,
adding a fragment of a molecule in the VNTI database or adding a fragment using the
Fragment Editor. The first two choices will open the appropriate molecule and launch the
Fragment Wizard. The third choice will launch the Fragment Editor.
Although you can add molecule fragments using the Fragment Editor, it is much more
convenient to add them either in advance using the Fragment Wizard—the tool specifically designed for visual selection of molecule fragments from Molecule Display windows
(see page 309) or via the first two choices on the Add Fragment list, which also use the
Fragment Wizard.
Fragments of existing molecules are the key part of most constructed molecules. Click the Add
button and select the Add Fragment > with Fragment Editor choice, or select a component
fragment in the list and click the Edit button to open the Fragment of Molecule dialog box (Figure 22.15) where you add or edit such a fragment:
Figure 22.15 Fragment of Molecule dialog box
Options in this dialog box are summarized as follows:
z
Construct/Design Recipient/Design Donor: molecule fragment type
z
Parent Molecule: Enter the name of the source molecule for the fragment to be added,
or click the Browse button (
316
) to select a molecule from the Vector NTI database.
z
Inverted: Check to insert the fragment in the inverted orientation.
z
Restriction Sites Counted From Nucleotide: Enter the position in the parent molecule
from which restriction site occurrences should be counted. This field is important when
this fragment is taken from a selection display window, where the numbering of sites in
the selection display window may not correspond to the numbering of sites in the molecule as a whole. Usually the value of this field is 1.
z
Termini: To describe a fragment from an existing molecule, you must describe its left
and right termini. Brief descriptions of the termini are displayed next to the corresponding
buttons. Click each of the <…Terminus > buttons to define the termini.
Molecule Construction Chapter 22
Editing the Termini of Fragment of Molecule-type Component Fragments
Click the Left Terminus or Right Terminus buttons in to open the Terminus Editor dialog box
(Figure 22.16).
Figure 22.16 Terminus Editor dialog box
The Left (and Right) Terminus dialog box options are summarized as follows:
Terminus Type:
z
Restriction site: If the terminus is a restriction site, enter its name in the text box, or
click the Browse button (
) to select from a list of the RENs in the database.
The restriction site chosen here determines the form of the terminus (blunt, 5’, 3’). The
terminus can be further modified by biochemical operations, as described below.
z
Nucleotide context: If the terminus is a nucleotide context (oligonucleotide), enter the
sequence in the text box.
This type of terminus is blunt.
z
Position: If the terminus is a position in the molecule’s nucleotide sequence, enter its
position in the text box.
This type of terminus is blunt.
z
Start / End of Molecule: If the terminus is the start or end of the parent molecule, click
the appropriate radio button.
This type of terminus is blunt.
z
Not Defined (NODEF): Click this button if the terminus is undefined.
A fragment with one or more NODEF termini can only be used for automatic molecule
Design, discussed in the next chapter.
Site or Context Data
If the terminus is a restriction site or nucleotide context, these fields are enabled where you are
required to indicate where on the parent molecule the site or context can be found.
z
Enter an integer value in the Number field to use that occurrence of the site or context on
the parent molecule.
In place of a number, you can enter an area of the molecule within which the site or context occurs only once.
z
Enter a value in the Point and Region fields to look for the site or context within (Region)
nucleotides of the (Point) nucleotide of the parent molecule.
317
Vector NTI Advance 10 User’s Manual
Vector NTI uses the Point and Region fields only if the Number field is empty.
Biochemical Operations
Termini of Restriction Site type can be treated with up to three consecutive biochemical operations, performed in the sequence listed in the Terminus Editor dialog box. The operations are
performed in the order in which they are listed.
These operations from the lists in the Biochemical Operations drop-down menus have the following effects:
z
None leaves the terminus untreated.
z
Completely filled in fills in cohesive fragment termini to make them blunt.
z
Incompletely filled in fills in cohesive fragment termini to within a few nucleotides of
being blunt.
z
S1-treated cuts cohesive termini down to blunt.
z
Bal31 treated cuts off a given number of nucleotides from both strands.
z
3’-5’ exonuclease treated cuts off a given number of nucleotides in the 3’-5’ direction.
z
5’-3’ exonuclease treated cuts off a given number of nucleotides in the 5’-3’ direction.
Click OK to return to the Fragment Molecule dialog box (Figure 22.15).
The For Design Only subsection of this dialog box is enabled only in Design mode and is
described in Chapter 24.
Click OK to return to the Lists dialog box. Click the Run button to launch the Construct Molecule dialog box.
The Control Fields and Commands
In Construction mode, the following mode is enabled: Create All Possible Constructs...
When checked, the system creates all possible constructions (up to 24) that can be obtained
from the molecule component fragments. This option allows Vector NTI to include even the parasitic constructs (inserts in the wrong orientation) in the reaction mix.
The Open Display Windows for All field is active only when the Create All Possible Constructs box is checked or the specified number of design output options is more than one. If this
box is checked, and more than one molecule is created during the construction or design process, Molecule Display windows are opened for each new molecule immediately after completing the procedure. If this box remains unchecked, a new Molecule Display window opens
automatically for just the molecule with the name specified in the Name field.
Note:
In Design, display windows are not created for intermediate molecules, but only for the final
option(s).
Once all parameters are set in the Construct Molecule dialog box, click the Construct button to
initiate the process.
Naming of Construction Recombinants
If you start a construction task for a goal molecule with a name that causes a conflict with an
existing set of construction options, Vector NTI informs you of the conflict and asks permission
to delete the existing options. To avoid this, choose a different name for the new goal molecule
or rename old construction options.
For additional constructs, Vector NTI creates names on the basis of the name of the “main” constructed molecule. If the name of the molecule is <MOLNAME >, the name of the first additional
construct will be <MOLNAME > _#1, the name of the second additional construct will be <MOLNAME > _#2, etc.
318
Molecule Construction Chapter 22
As Construction proceeds, Vector NTI creates a special subset for the molecules, named by the
program on the basis of the name of the “main” constructed molecule. If the name of the molecule is <MOLNAME >, then the name of the subset containing additional constructs will be
<MOLNAME > _$Construction Options.
Reconstructing a Molecule
You can reconstruct a previously constructed molecule by right-clicking on the constructed molecule in the Database Explorer window and choosing Reconstruct from the shortcut menu.
This launches the Construct Molecule dialog box with all the parameters used for the original
construction of that molecule. The Reconstruct feature is useful for constructing molecules that
are similar to a previously constructed molecule and for reconstructing molecules that have
failed a previous construction attempt (such molecules appear with a question mark icon to the
left of their names in the Database Explorer window).
319
Vector NTI Advance 10 User’s Manual
320
C
H A P T E R
23
GATEWAY®AND TOPO CLONING
Introduction to Gateway Cloning
Gateway Cloning Technology is Invitrogen’s universal cloning system that provides a rapid and
highly efficient route to protein expression, functional analysis and cloning/subcloning of DNA
segments. This system is based on the well-characterized bacteriophage lambda-based sitespecific recombination system (attL x attR ↔ attB x attP). In overview, Gateway is a 2-step
cloning process; in the first step a sequence of interest is inserted into an Entry Clone. The second step transfers the sequence into a variety of attB-containing Expression Clones that can be
propagated and expressed in a range of host cells for a given experiment.
TOPO Technology is a fast, efficient way to clone. The key to TOPO Cloning is the enzyme DNA
topoisomerase I, whose biological role is to cleave and rejoin DNA during replication. To hara
ness this activity, vectors are linearized and each end is conjugated with topoisomerase on the
3' phosphate. This enables fast ligation of DNA sequences with compatible ends. After 5 minutes at room temperature, enzyme is released, the ligation is complete and the recombinant
molecule is ready for transformation into E. coli. Many Invitrogen expression vectors are
adapted for one-step TOPO Cloning of PCR products in both directional and non-directional formats. Other vectors contain att recombination sequences exterior to the TOPO cloning sites so
that cloned inserts are ready for entry into the Gateway system.
Vector NTI Advance 10 offers an interlocking set of computational tools for planning Gateway or
TOPO cloning experiments from beginning to end. These allow you to simulate recombinant
strategy, as well as to validate design of your reagents before proceeding to primer ordering,
bench-top operations, etc. Steps necessary to identify and screen transformants, expedite purification, fuse an insert with vector tags, etc. can be identified and modifications made before
321
Vector NTI Advance 10 User’s Manual
investing time and money. Vector NTI tools can be used to plan individual experiments (singleor multi-site cloning) or to design batch cloning experiments.
Warning !
If you upgraded to Vector NTI Advance 10 from a previous version and
chose to continue working with your existing database, some Invitrogen molecules needed for the Gateway Cloning feature will not exist in your database. To obtain those molecules, you must download them from the
Invitrogen website at www.invitrogen.com.
If you chose to overwrite your existing database when you upgraded, the
Invitrogen molecules will be part your Vector NTI database.
Introduction to Gateway Cloning
This chapter describes the Vector NTI tools for in silico Gateway Cloning and provides you with
directions for using these tools:
z
Creating Entry Clones – To participate in a Gateway cloning reaction, a DNA sequence
of interest must first be incorporated into an Entry Clone. Five ways for generating or
retrieving Entry Clones are described in this chapter:
a. Generate an Entry Clone from an Expression Clone by BP Recombination–
This option uses a BP reaction to generate an Entry Clone employing an already
existing attB-containing DNA molecule, such as a Gateway Expression Clone or a
pCMVSPORT6 library. See page 323.
DNA sequence of interest in an existing clone (flanked by attB sites) + pDONR vector
(with attP) ↔ Entry Clone (with attL)
b. Create an Entry Clone by PCR Amplification and BP Recombination – This
option allows you to amplify your sequence of interest with attB-containing primers
designed by Vector NTI, then perform a BP recombination using the PCR product
you amplified. See page 324.
PCR product (flanked by attB sites) + pDONR vector (with attP) ↔ Entry Clone (with
attL)
c.
Generate an Entry Clone by PCR and Restriction-Ligation into a pENTR Vector – This process allows you to specify your sequence of interest and amplify it
using standard Vector NTI primer design and amplification techniques. Then insert
the amplicon into a pENTR vector using Vector NTI molecule construction techniques. See page 329.
PCR product (no attB) + pENTR vector (with attL) ↔ Entry Clone (with attL)
d. Obtain a functional Entry Clone from Invitrogen – Find Entry Clones in the Invitrogen collections. See page 331.
e. Generate an Entry Clone by TOPO cloning - This option allows you to amplify
your sequence of interest and clone it into a Gateway-ready TOPO vector. This is
described fully in the TOPO Cloning section of this chapter. See page 323.
z
Perform an LR Recombination – Entry Clones from any of the above methods are
recombined with pDEST vectors. The resulting Expression Clones can drive expression
of the sequence of interest when transformed into host cells. See page 331.
Entry Clone (with DNA sequence of interest flanked by attL sites) + pDEST vector
(with attR) ↔ Expression Clone (with attB)
322
GATEWAY and TOPO Cloning Chapter 23
o
z
ORF and Translation Analyses – Use Vector NTI analysis tools to verify that a DNA
sequence in an Expression Clone is expressed as intended before committing bench
time to subsequent steps. See page 334.
Creating a New Destination Vector – This allows you to create a user-defined destination vector, incorporating unique promoters, fusion tags, etc. See page page 335.
Selected vector + Reading Frame Cassette (with attR) → Destination Vector
Creating Entry Clones
Invitrogen offers several methods for inserting a DNA sequence of interest into an Entry Clone.
Vector NTI tools can perform these recombinant techniques in silico, and additionally, Vector
NTI can be used to design primers, amplify products, construct molecules, track recombinants,
suggest reagents and predict the outcome.
As a general rule, any Entry Clone generated in silico should be submitted to a Gateway LR
recombination in Vector NTI. (See Performing an LR Recombination on page 331.) The resulting Expression Clones should be examined by ORF analysis and translation to verify that the
DNA sequence will indeed be expressed as intended.
Generate an Entry Clone in a BP reaction by Recombining an Expression Clone
A DNA sequence of interest may already be in an attB-containing DNA molecule such as an
existing Gateway Expression Clone or pCMV-SPORT6 library. For information, contact Invitrogen Technical Services at the Invitrogen website http://www.invitrogen.com.
In this strategy, the sequence is extracted from the existing Gateway clone or library and recombined with a Donor Vector in a BP recombination to produce a new Entry Clone. Ultimately, the
Entry Clone can be recombined into a new Expression Clone.
1. Open the Expression Clone in a Molecule Display Window, and from the menu, choose
Cloning > Gateway Cloning > Create an Entry Clone > Recombine an Expression
Clone by BP.
Alternatively, in the Database Explorer, select one or more such clones and from the DNA/
RNA or shortcut menu choose Gateway Cloning > Recombine an Expression Clone by
BP.
2. First screen (Figure 23.1): Use the Add/Remove buttons to browse in one or more pDONR
vectors and attB-containing sequences, in the upper and lower windows respectively. If the
tool was launched from an open file window displaying either type of molecule, those molecules automatically appears in the appropriate pane. Click Next.
Note:
pDONR vectors for multi-site Gateway reactions contain attP sites that are different from those
used in single-fragment cloning. In all reactions, the attB sequences must be compatible with
323
Vector NTI Advance 10 User’s Manual
pDONR attP sites. If invalid files or incompatible vectors and sequences are entered, Vector NTI
will issue an alert and return to this screen.
Figure 23.1 Gateway BP cloning – first screen
3. Second screen (Figure 23.2): An expandable preview page appears, summarizing valid
Entry Clones that can be generated from the entries displayed on the first screen. Batch
submissions from the first screen (e.g. a single pDONR vector and multiple compatible attB
sequences) are summarized as separate Entry Clones.
4. To automatically save the results to the Vector NTI database, check the Save results to DB
checkbox. You are offered the option to open the new clone in a Molecule Display Window.
Click Finish.
In molecules created by the Gateway cloning tools, a folder called Design Description
appears in the Text Pane. It contains a brief description of the protocol and can be copied
and pasted into a word document for reference during the actual experiment.
Figure 23.2 Gateway BP cloning – second screen
5. If the Save results to DB option was not checked, Entry Clones will open in Molecule Display Windows as temporary molecules that can be saved in the Database.
6. Perform an LR recombination in Vector NTI (see page 331) and examine the resulting
Expression Clone by ORF analysis and translation to verify that the DNA sequence is
expressed as intended (see page 334).
Generate an Entry Clone by PCR Amplification and BP Recombination
This strategy is a highly flexible process for entering the Gateway Cloning system by amplifying
a sequence of interest using standard PCR techniques and generating an Entry Clone in a BP
Recombination. This is also the approach used most often when multi-site Gateway cloning is
324
GATEWAY and TOPO Cloning Chapter 23
planned, since each fragment of the final clone must be prepared with a unique combination of
attB sites. Some of the benefits to this approach to creating Entry Clones are:
z
You can add additional sequences to the primers to assist in protein expression and purification.
z
You can open online help topics for assistance in the placement of stop codons and
maintaining reading frames.
z
If reading frame errors are detected, you can return and make the appropriate edits.
z
You can add primer recommendations to an Oligo Goal List from which orders can be
submitted to Invitrogen’s custom Oligo Synthesis service.
1. Open a Molecule Display Window for a DNA molecule containing the sequence of interest.
Select the target region on the molecule and choose Cloning > Gateway Cloning > Create
an Entry Clone > Amplify Selection to Use in a BP Reaction. (These commands are disabled if an appropriate target is not defined.) This opens the Amplification of Selected
Region for BP Recombination dialog box (Figure 23.3).
This dialog box allows you to search for convenient sense and antisense primers according
to your specifications and to check the uniqueness of primers. Most of the tabs and parameters in this dialog box are common to those found in the Find PCR Primers dialog box discussed in Chapter 20. However, the differences on the Primer tab are described here. For
more information on setting PCR parameters in this dialog box, see page 248.
Figure 23.3 Amplification of Selected Region for BP Recombination dialog box
The options on the Primer tab (Figure 23.3) allow you to generate a single pair of primers
that amplifies but does not extend beyond the selected sequence. It also allows you to add
primer attachments for a Gateway Cloning experiment.
Primer Tab Parameters – Amplification of Selected Region for BP Reaction Dialog Box
Region of Analysis
Restricted to exactly the region being amplified. Therefore, Before = After =
0 bp and the Amplicon Must Include Region defaults to the selection.
Table 23.1 Primer tab parameters – Amplification of Selected Region for BP Reaction dialog box
325
Vector NTI Advance 10 User’s Manual
Primer Tab Parameters – Amplification of Selected Region for BP Reaction Dialog Box
Maximum Number of
Output Options
Restricted to 1 (i.e., 1 pair of primers and the associated product).
Salt Concentration
Common to all PCR tools. See page 248.
Probe Concentration
Ibid
dG Temperature
Ibid
Tm
Ibid
%GC
Ibid
Primer Length
Defaults to 18-25, Invitrogen’s recommendation for Gateway Primers
DNA/RNA radio button
Common to all PCR tools. See page 248.
Amplify on Complementary Strand
Check to amplify and express a sequence or feature which maps to the
complementary strand. When this is activated, the contents of the Sense
and Antisense browse-ins will be exchanged in the Primer Additions and
GGGG-attBx Extension boxes. For example, the default attB1 extension
that leads into the expressed sequence will be found in the Antisense text
box and the attB2 extension that exits from the sequence will be found in
the Sense text box.
Primer Additions
Enter nucleotides in the text box, or click the Browse button (
sequences to the template-specific region of the primer.
) to add 5’
In the Choose Additions dialog boxes that open (Figure 23.4), there are
some recommended additions specific to the sense and antisense primers.
(Such sequences can assist in expression or purification when the template
sequence is transferred to an Expression Clone and expressed in a host
cell.) Click on the preferred addition, or click the Add button to name and
enter an additional sequence that can be added to the primer. Click OK to
enter your selection in the appropriate text box. Text box entries are fully
editable.
Note: If you type additions to the antisense window, enter the sequence in
5’ ---> 3’ order, as you want it to appear on the complementary strand
primer.
Instruction
Click the Reading Frame and Stop Codons buttons to open context-sensitive Online Help topics with tips for preserving a reading frame and inserting stop codons into the primers.
Add GGGG-attBx 5’
Extensions
These text boxes must be filled in for a Gateway project. The defaults are
for single fragment cloning: attB1 for the sense primer and attB2 for the
antisense primer. Click the Browse buttons (
) to replace the defaults
with other attB sequences for creating Entry Clones for multi-site cloning
projects. In the Choose attB Extension dialog boxes that open (Figure
23.5), click on the preferred extensions and click OK.
Table 23.1 Primer tab parameters – Amplification of Selected Region for BP Reaction dialog box
326
GATEWAY and TOPO Cloning Chapter 23
Figure 23.4 Browse to suggested additions for controlling expression/purification of your sequence. Use the Add button to enter new sequences to your personal list.
Figure 23.5 attB extensions to PCR primers for generating amplicons for Gateway BP reaction. attB1 (sense) and
attB2 (antisense) are the choice for single-fragment cloning. The other extensions are for multi-site cloning.
The attB extensions listed here are intended to ensure that the sequence of interest remains
in-frame if it is ultimately cloned into a pDEST vector with N-terminal or C-terminal fusion
partners.
In Multi-site Gateway experiments, 2 or 3 distinct elements are cloned into separate Entry
Clones, each using a distinct pairing of attB extensions and specialized pDONR vectors.
The Entry Clones are then mixed with a pDEST vector in an LR recombination (see below)
to generate a single Expression Clone in which the elements are carried together. This can
be useful in coordinating expression of disparate elements from one vector, or in constructing mini-genes. The following table summarizes the available lineups (as of summer 2005)
for designing primers and matching the amplicons with their respective vectors.
327
Vector NTI Advance 10 User’s Manual
Multi-site Gateway – attB extensions and cloning vectors
No. of fragments
fragment order
attB extensions
pDONR vector
pDEST vector
2 fragment cloning
First fragment
SP: attB4
ASP: attB1
pDONR P4-P1R
pDEST R4-R2
Second fragment
SP: attB1
ASP: attB2
Any pDONR of
type P1-P2
First fragment
SP: attB4
ASP: attB1
pDONR P4-P1R
Second fragment
SP: attB1
ASP: attB2
Any pDONR of
type P1-P2
Third fragment
SP: attB2
ASP: attB3
pDONR P2R-P3
3 fragment cloning
pDEST R4-R3
Table 23.2 Multi-site Gateway recommendations for attB primer extensions and pDONR vectors (BP reactions),
and pDEST vectors (LR reactions)
The Load and Save buttons at the lower left of each tab are common to all PCR dialog
parameter boxes. They allow you to save your PCR settings to a file and to load such settings files for subsequent analyses. See page 247 for more information.
In the context of this discussion, you might configure this dialog box to add a Lumio tag to a
primer. By saving these settings, when you select other sequences for amplification, you
could click the Load button and select the saved settings. The Lumio tag would automatically load in the Primer Additions text box and be added to the new primers when you click
OK.
2. Once your PCR parameters are specified, click OK in the Amplification of Selected Region
for BP Reaction dialog box.
PCR product and primers are calculated and displayed in the PCR Analysis Text Pane
folder in the Molecule Display Window. Simultaneously, a dialog box opens (Figure 23.6), in
which you can select to proceed directly to a BP reaction, and/or to add the primers to the
Oligo Goal List to expedite ordering from Invitrogen’s custom Oligo Synthesis service. To
bypass both options, click OK without selecting either checkbox; this will return you to the
starting molecule so that you can examine the calculated PCR product and primers.
Figure 23.6 Choose to proceed directly to the cloning wizard, add the primers to your order list or
examine the primers and products
z
328
If you select Proceed to BP Reaction, the Create Entry Clone by BP Reaction dialog
box (Figure 23.1) opens with the attB-containing PCR product(s) you generated appear-
GATEWAY and TOPO Cloning Chapter 23
ing automatically in the attB sequences pane. Continue as described in the previous section.
z
If you elect to add the oligos to the Oligo List, you can order Oligos from Invitrogen at any
time. See page 276 for more information.
z
If you opt to exit here to examine the primers and products, you can pursue any of the
following options and save the product and primers to continue at a later time:
a. After examining the results, select the PCR product in the PCR Analysis Text Pane
folder and select Recombine a PCR Product by BP from the shortcut menu. Continue with the Create Entry Clone by BP Reaction dialog box (Figure 23.1) as
described in the previous section.
b. Right click on the Product of Length (the PCR product) in the PCR Analysis Text
Pane folder and select Save as Molecule in Database. At a later date, you can
select the PCR product in the Database Explorer and Recombine a PCR Product
to BP as described in the previous section. This option is useful if multiple PCR
products are generated from different files, and you wish to store and submit them
from the database in batch.
c.
Save the parent molecule along with all PCR products and primers in one molecule
file. Choose File > Save As and in the Save As dialog box, select the Save as file
tab and choose a location in which the files are to be saved. Later, to submit the
saved PCR product to a BP reaction, open the file in a Molecule Display Window,
select the PCR product in the PCR Analysis Text Pane folder and continue as
described above.
Generate an Entry Clone by BP Recombination
The Create Entry Clone by BP Reaction dialog box opens with your amplicon in the attB
Sequences pane. Continue with the BP reaction, beginning with step #2 on page 323. The BP
recombination will transfer the amplified sequence, plus any additions you chose during primer
design, into an Entry Clone.
Generate an Entry Clone by PCR Amplification and Ligation into a pENTR Vector
This method uses the Molecule Construction tool in Vector NTI and Invitrogen pENTR Vectors.
pENTR Vectors are closed, circular DNA molecules with a multiple cloning site (MCS) and a
ccdB gene flanked by attL1 and attL2. By amplifying a DNA sequence of interest with extensions that anneal to cut sites in the vector, the sequence can be inserted using Molecule Construction techniques. For more information on Molecule Construction, see Chapter 9 Tutorial:
Molecule Construction and Chapter 22 Molecule Construction.
The generic workflow using pENTR vectors is as follows:
1. Open a Molecule Display Window for a selected pENTR vector and another for a DNA molecule with the sequence of interest. Use the menu command Window > Tile Vertical to
conveniently view both files (Figure 23.7).
329
Vector NTI Advance 10 User’s Manual
Figure 23.7 Creating a Gateway Entry Clone by restriction ligation using a pENTR vector
2. With the pENTR vector as the active window, define restriction site(s) on each side of the
ccdB gene. Choose sites after and before attL1 and attL2, respectively, and avoid enzymes
with internal sites in the sequence of interest. Choose List > Add Fragment to Goal List
and follow the Fragment Wizard to add the fragment to the goal list. For directional cloning,
choose sites that produce non-complementary overhangs.
3. With the DNA donor fragment as the active window, select the sequence of interest using
standard Vector NTI selection techniques. With the sequence selected, choose from the
menu Analyses > Primer Design > Amplify Selection.
z
In the Amplification dialog box that opens, set Before Max_BP and After Max_BP to 0,
and Maximum Number of Output Options to 1.
z
Under More >>, using the Browse (
) buttons, select 5’ REN extensions for the
sense and antisense primers that will anneal to the cut vector ends.
z
To amplify your selection, click OK.
4. In the PCR Analysis Text Pane folder, right-click on the PCR product and choose Save to
Database and Create Window. In the New DNA/RNA Molecule dialog box that opens,
enter the name of your new PCR product. Click OK. Select a subset to store the fragment in
the DNA/RNA Molecule database and click OK.
5. In the Molecule Display Window displaying the new PCR product, select on the REN sites
you designed into your primers (Figure 23.8), and choose List > Add Fragment to Goal
List. Follow the Fragment Wizard and conclude by adding the fragment to the goal list.
330
GATEWAY and TOPO Cloning Chapter 23
Figure 23.8 Selecting on REN sites of a PCR product for Molecule Construction
6. From the List menu, choose Show Lists. From the List Dialog box menu, choose Run.
7. In the Construct Molecule dialog box, ensure that the Circular radio button is selected and
enter a name for your Entry Clone. Choose a subset to store it in the Insert DNA/RNA Molecule(s) into Subset dialog box and click OK. The newly constructed Entry Clone will contain
the DNA sequence of interest flanked by the attL sites. Save the new Entry Clone to the
database.
8. Perform an LR recombination in Vector NTI (see below) and examine the resulting Expression Clone(s) by ORF analysis and translation to verify that the DNA sequence will be
expressed as intended.
Obtaining a Functional Entry Clone from Invitrogen
Invitrogen offers collections of genomic sequences as attL-containing Source Clones (for example, the Ultimate ORF Collection). Check the Invitrogen website http://www.invitrogen.com or
contact Invitrogen Technical Services.
Performing an LR Recombination
All the previously described methods in this chapter describe generating or obtaining an Entry
Clone. In the Gateway LR reaction, one or more Entry Clones recombines with an attR-containing Destination Vector ((pDEST) to produce an Expression Clone. Vector NTI software performs
LR recombination by accepting entries in several categories of projects (single-fragment, multisite, and batch) in a single workspace, recombining them and automatically sorting and validating the entries. A preview screen summarizes all successful Expression Clones and allows
autosaving of the results to the database. (For details on multi-site cloning, refer to the Support
link on the Invitrogen website, www.invitrogen.com.)
1. Open a Molecule Display Window and from the menu, choose Cloning > Gateway Cloning
> Create an Expression Clone by LR. Alternatively, from the Database Explorer, select
331
Vector NTI Advance 10 User’s Manual
one or more molecules, and choose Gateway Cloning > Create an Expression Clone by
LR from the DNA/RNA or shortcut menu.
2. First Screen: In the Create Expression Clones by LR Reaction dialog box (Figure 23.9), use
the Add/Remove buttons to browse in the pDEST vectors and Entry Clones, in the upper
and lower panes respectively. If the tool was launched from an open file containing either
type of molecule, those molecules will automatically appear in the appropriate pane. If
invalid entries are browsed into either window, Vector NTI will issue a message and refuse
the entry.
Figure 23.9 Gateway LR cloning – first screen
Tip:
The attL sites in an Entry Clone and attR sites in a pDEST vector must be compatible. For
Entry Clones generated by Vector NTI software, the identity of att sites becomes part of the
description annotation and can be displayed to help you select compatible molecules. When
you click the Add button, the Choose Database DNA/RNA Molecules dialog box appears.
Right click on the column header, and select Columns. In the Columns dialog box, select
Description in the Available Fields panel to the left and move it to the Displayed Fields
panel. You can click on the Description header to sort the molecules by description, or
scroll through the list to find molecule(s) that contain the appropriate att sites.
You can follow the same procedure in the Database Explorer to display Descriptions and
thus recognize att sites generated by Vector NTI software for any Gateway Clone.
3. Click Next to continue.
4. Second screen: An expandable preview page appears (Figure 23.10), summarizing the
Expression Clones that can be generated from the available entries. Batch submissions (i.e.
a single pDEST vector and multiple compatible Entry Clones) are summarized as separate
Expression Clones. Check the Save results to DB checkbox to automatically save the
Expression Clones to the Vector NTI database. Click Finish.
332
GATEWAY and TOPO Cloning Chapter 23
Figure 23.10 Gateway LR cloning – second screen
Note:
If a pDEST vector and an Entry Clone share the same resistance markers, the recombination
can proceed at the bench, but it will be difficult to select the final Expression Clone. If such
Expression Clones can form, they will be noted on this page in orange. The simplest course in
such cases is to recreate the Entry Clone using a pDONR vector with another marker, for example, pDONRzeo or pDONR207. Alternatively, consider using or creating a different pDEST vector.
The most likely situation for this to occur is when using new pDEST vectors that were not adequately annotated by the investigators who created them. (See Creating a New Destination Vector on page 335.) To minimize such occurrences, make sure that the new vectors have a unique
marker and are annotated using permissible syntax, listed in Table 23.3. If your antibiotic resistance marker is not on this list, contact Invitrogen Technical Services to edit the appropriate configuration file. See Appendix A.
Resistance Marker
Permissible Syntax
Ampicillin
Ampicillin
ampicillin
ampicilin
Ampicilin
AmpR
Amp(R)
AP(R)
bla
Blasticidin
blasticidin
Blasticidin
Bsd
Bsd(R)
Gentamicin
Gentamycin
Gentamicin
gentamycin
gentamicin
gentimicin
gentimycin
Gm(R)
GmR
Table 23.3 Permitted Syntax for Antibiotic Resistance Markers
333
Vector NTI Advance 10 User’s Manual
Resistance Marker
Permissible Syntax
Hygromycin
Hygromycin B
hygromycin B
Hygromycin B(R)
hygromycin B(R)
Hygromycin(R)
hygromycin(R)
Hygromycin
hygromycin
Hygro
hygro
Hygro(R)
hygro(R)
hyg
hph
hyg(R)
hph(R)
Kanamycin
Kanamycin
kanamycin
KmR
KN(R)
Kn(R)
Kan(R)
Kan-Tn5
Neomycin
neomycin
Neomycin
Neo(R)
NeoR
Spectinomycin
spectinomycin
Spectinomycin
SpnR
Spn(R)
Zeocin
zeocin
Zeocin
ZeoR
Zeo(R)
Sh ble
Table 23.3 Permitted Syntax for Antibiotic Resistance Markers
5. To automatically save the results to the Vector NTI database, check the Save results to DB
checkbox. You are offered the option to open the new clone in a Molecule Display Window.
Click Finish.
6. If the Save results to DB option was checked, the Expression Clones are saved but do not
open automatically in Molecule Display Windows. If the Save to the DB option was not
checked, Expression Clones open in Molecule Display Windows as temporary molecules
that can be saved in the Database.
7. Examine the resulting Expression Clone(s) by ORF analyses and translation to verify that
the DNA sequence is expressed as intended. See the following section.
Verifying Expression Product
To verify that the DNA sequence is expressed as intended, examine the resulting Expression
Clone(s) by ORF and translation analyses (Figure 23.11).
334
GATEWAY and TOPO Cloning Chapter 23
Figure 23.11 ORF and translation analysis on Expression Clone verifies that an expressed sequence is
in-frame with a N-terminal fusion partner (a GST tag)
1. For ORF Analysis, select Analyses > ORF.
2. To verify translation, select Analyses > Translation > Into New Protein > <translation
option>. If the DNA sequence was cloned into a Destination Vector containing N- or C-terminus fusion partners, make sure that they and sequence of interest are contained within a
single ORF. Check that the reading frame translates the fusion partners and the sequence
of interest correctly, and that no premature stop codons are encountered. If the reading
frame is disrupted, it may be necessary to return to primer design for creating Entry Clones
again. For detailed tips, see the Reading Frame Online Help topic available in the Primer
tab.
3. In molecules created by the Gateway cloning tools, a folder Design Description appears in
the Text Pane. It contains a brief description of the protocol and can be copied and pasted
into a word document for reference during the actual experiment.
Creating a New Destination Vector
Invitrogen offers a wide selection of Destination Vectors for expressing a sequence of interest in
a variety of hosts and conditions. However, you may want to convert your own vectors into a
Gateway Destination Vector in order to exploit unique promoters, fusion tags, etc. To assist in
this process, Invitrogen offers sets of blunt-ended Reading Frame Cassettes for introducing
attR1 and attR2 sites, and the requisite selectable marker genes, into any vector to convert it
into a Destination Vector.
The set consists of three cassettes, each of which defines a different reading frame from vector
features (tags, cleavage sites, etc.) to attR sites (and ultimately, to the insert sequences cloned
in by LR recombination).
1. Browse the local database to your vector of choice and open it in a Molecule Display Window.
335
Vector NTI Advance 10 User’s Manual
2. Choose Cloning > Gateway Cloning > Create a Novel Destination Vector from the dropdown menu.
Figure 23.12 Create a new Gateway pDEST vector – first screen
3. First screen (Figure 23.12):
z
Following the instructions, CLICK (and SHIFT-CLICK) on the vector feature map to select 1
(or 2) cut sites on the vector for inserting the cassette. If the digestions produce overhangs, choose a method to blunt the vector ends, then Click Next to continue.
o
Fill-in overhangs
o
Trim back overhangs (If any selected site generates 3’ overhangs, only this option
will be offered).
Figure 23.13 Create a new Gateway pDEST vector – second screen
4. Second screen (Figure 23.13):
z
Note:
From the drop-down menu, choose a Reading Frame Cassette: rfa_verB, rfb_verB or rfc.1_verB.
The cassettes differ in length by 1 bp, so that one of them will produce a pDEST vector with an
unbroken reading frame between fusion partners in your vector (if any) and the attR sites introduced with the cassette.
Some combinations of cut sites and cassettes generate in-frame stop codons during ligation, which would prevent expression of a fusion protein between vector sequences and the
sequence coded from inserts. Vector NTI will issue a message if such a combination is
encountered, and recommend alternative actions if expression of a fusion protein is being
considered. If the original vector lacks fusion partners, these instructions can be ignored.
5. Choose to generate one or two new Destination Vector(s) with the cassette in direct,
reverse or both orientation(s).
336
GATEWAY and TOPO Cloning Chapter 23
6. Click Finish. Inspect the new vector(s) and design restriction, sequencing or PCR screens
with which to test transformants for cassette orientation.
Introduction to TOPO Cloning
TOPO cloning takes advantage of the activity of topoisomerase I, one molecule being covalently
bound to each end of a linearized vector in a proprietary process. Inserts up to 3 kb in size are
readily accepted. In a 5 minute bench-top reaction, incoming DNA fragments with 5’-OH ends
are unwound by the enzyme and ligated to the vector end, in a process that releases energy
and liberates the enzyme. The vectors can be grouped into 3 categories, based on the nature of
their ends:
z
Zero-Blunt vectors have 2 blunt ends and can accept blunt ended DNA fragments,
including amplicons produced by a proofreading polymerase. Inserts are cloned in both
orientations.
z
T-A vectors have 2 ends with 3’-T overhangs. They can accept products of PCR amplification with a taq polymerase, whose terminal transferase activity adds 3’-A overhangs to
the amplicon. Inserts are cloned in both orientations.
z
In directional vectors one terminal is blunt ended and the other has a 5’-GGTG overhang on the bottom strand. PCR products are generated with a 5’-CACC extension on
one end and this strand when unwound is preferentially annealed to the vector overhang. More than 90% of the clones are in the correct orientation and the time spent in
screening colonies is thereby reduced.
The presence of topoisomerase enzyme also helps protect vector ends from degradation, particularly from contaminating nucleases that may be present in ligase preparations. Moreover, the
avoidance of restriction site cutback for cloning PCR products means that internal cleavage
sites are not a problem.
Generate a Clone by TOPO cloning
Any linear, double-stranded DNA sequence of interest may be cloned into a TOPO vector using
VNTI NTI Advance. Circular molecules will not be accepted. In addition, linear sequences with
3’-A overhangs, the products of PCR amplification with a taq polymerase, may be cloned into
TOPO-TA vectors. Such taq-generated molecules can be generated in silico using the Vector
NTI Advance PCR tool Amplify selection to use in TOPO reaction (see below).
1. Open the sequence in a Molecule Display Window, and from the menu, choose Cloning >
TOPO Cloning > Launch TOPO Wizard.
Alternatively, in the Database Explorer, select one or more such molecules and from the
DNA/RNA or shortcut menu choose Launch TOPO Wizard.
337
Vector NTI Advance 10 User’s Manual
Figure 23.14 TOPO Cloning – first screen
2. First screen (Figure 23.14): Use the Add/Remove buttons to browse in one or more
sequences and TOPO vectors, in the upper and lower panes, respectively. If the tool is
launched from open windows displaying either type of molecule, those molecules automatically appear in the appropriate pane. Use the information in the Type fields to ensure compatibility of insert sequence and TOPO vector. Click Next.
(If the insert sequence by chance has ≥75% identity to CACC at both 5’-terminals, either
naturally or due to PCR (see below), the type field will report the insert as double directional.
These inserts are accepted by TOPO directional vectors, but the directional cloning ability is
lost. In such cases, consider adding a cap to one of the primers, so that the insert will be
cloned in the intended orientation.)
Figure 23.15 TOPO Cloning – second screen
3. Second screen (Figure 23.15): An expandable preview page appears, summarizing valid
clones that can be generated from the entries displayed on Screen 1. Note that vectors are
regarded as “unused” if they are incompatible with the insert sequences (T-A in this case).
Note also that cloning with bi-directional TOPO vectors will produce 2 clones, with the insert
sequence in both orientations. Batch submissions from the first screen (e.g., a single vector
and multiple compatible sequences) are summarized as separate clones.
4. To automatically save the results to the Vector NTI database, check the Save results to DB
checkbox. You are offered the option to open the new clone in a Molecule Display Window.
Click Finish.
338
GATEWAY and TOPO Cloning Chapter 23
In molecules created by the TOPO cloning tools, a folder Design Description appears in
the Text Pane. It contains a brief description of the protocol and can be copied and pasted
into a word document for reference during the actual experiment.
5. If the Save to the DB option was not checked, clones will open in Molecule Display Windows as temporary molecules that can be saved in the Database (Figure 23.16).
Figure 23.16 Clones generated with the selected sequence cloned in opposite directions
Generate a Clone by PCR Amplification and TOPO Cloning
This strategy is a highly flexible, rapid process for generating clones by amplifying a sequence
of interest with PCR and combining the amplicon with a TOPO vector. The sequence may be on
either strand of any type of DNA molecule, linear or circular, since the first step will generate a
linear PCR product in the desired orientation. You can choose between amplifying for combination with Zero-Blunt, directional or T-A TOPO vectors. For the latter, Vector NTI simulates the
action of taq polymerase, including the addition of 3’-A overhangs to the amplicon by terminal
transferase activity. In addition:
z
You can add additional sequences to the primers to assist in protein expression and purification.
z
You can open online help topics for assistance in the placement of stop codons and
maintaining reading frames.
z
If reading frame errors are detected, you can return and make the appropriate edits.
z
You can add primer recommendations to an Oligo Goal List from which orders can be
submitted to Invitrogen’s custom Oligo Synthesis service.
339
Vector NTI Advance 10 User’s Manual
Figure 23.17 Selection of Small T antigen sequence for amplification and TOPO cloning
1. Open a Molecule Display Window for a DNA molecule containing the sequence of interest
(Figure 23.17). Select the target region on the molecule and choose Cloning > TOPO Cloning > Amplify selection to use in TOPO reaction. (These commands are disabled if an
appropriate target is not defined.) This opens the Amplification of Selected Region for
TOPO cloning dialog box (Figure 23.18).
Figure 23.18 Amplification of Selected Region for TOPO cloning dialog box
340
GATEWAY and TOPO Cloning Chapter 23
2. This dialog box allows you to search for convenient sense and antisense primers according
to your specifications and to check the uniqueness of primers. Most of the tabs and parameters in this dialog box are common to the those found in the Find PCR Primers dialog box
discussed above with regard to Gateway cloning (Table 23.1). The difference on the Primer
tab is described here. For more information on setting PCR parameters in this dialog box,
see page 241.
The options on the Primer tab (Figure 23.18) allow you to generate a single pair of primers
that amplifies but does not extend beyond the selected sequence. It also allows you to tailor
the amplicon termini for specific types of TOPO vectors.
a. In the box marked Cloning termini, choose Blunt to generate an amplicon with 2
blunt ends. These will be the exact boundaries of the selection. These amplicons
are best used with Zero-Blunt TOPO vectors.
b. Choose T-A to generate an amplicon as would be produced by amplification with a
taq polymerase. The primers in such a case will anneal to the exact boundaries of
the selection. However, terminal transferase activity in the enzyme will add 3’-A
overhangs to each end of the amplicon (Figure 23.19).
c.
Choose directional for cloning in TOPO directional vectors, e.g. pENTR-D/TOPO.
The amplicon will be generated using primers, one of which includes a 5’-CACC
extension. The choice of primer is governed by the checkbox Amplify on complementary strand. In the example here, the small T antigen maps to the complementary strand of SV40. In order to orient it for cloning and expression the checkbox will
be on. The resulting amplicon is shown in Figure 23.20. Note the CACC extension
5’ to the start codon on the complementary strand.
Figure 23.19 SV40 small T amplified with computed primers and taq polymerase. Note the 3’-A overhangs exterior to the PCR primers.
341
Vector NTI Advance 10 User’s Manual
Figure 23.20 SV40 small T amplified for reaction with a TOPO directional vector. Note the 5’-CACC extension
on the complementary strand.
As described above, the Load and Save buttons at the lower left of each tab are common to
all PCR dialog boxes. They allow you to save your PCR settings to a file and load the settings file in for subsequent analyses. See page 240 for more information.
3. Once PCR parameters are specified, click OK in the Amplification of Selected Region for
TOPO cloning dialog box.
4. PCR product and primers are calculated, and display in the PCR Analysis Text Pane
folder in the Molecule Display Window. Simultaneously, a dialog box opens (Figure 23.21),
in which you can select to proceed directly to a TOPO reaction, and/or to add the primers to
the Oligo Goal List to expedite ordering from Invitrogen’s custom Oligo Synthesis service.
To bypass both options, click OK without selecting either checkbox; this will return you to
the starting molecule so that you can examine the calculated PCR product and primers.
Figure 23.21 Choose to proceed directly to the cloning wizard, add the primers to your order list or examine the
primers and products
342
GATEWAY and TOPO Cloning Chapter 23
z
If you select Proceed to cloning wizard , the Create TOPO Clone dialog box (Figure
23.14) opens with the PCR product(s) you generated appearing automatically in the
inserts pane. Continue as described in the previous section.
z
If you elect to add the oligos to the Oligo List, you can order the custom Oligos from Invitrogen at any time. See page 266 for more information.
z
If you opt to exit here to examine the primers and products, you can pursue any of the
following options and save the product and primers to continue at a later time:
a. After examining the results, select the PCR product in the PCR Analysis Text Pane
folder and select Clone PCR Product by TOPO from the shortcut menu. Continue
with the Create TOPO Clone dialog box (Figure 23.14) as described in the previous
section.
b. Right click on the Product of Length (the PCR product) in the PCR Analysis Text
Pane folder and select Save as Molecule in Database. At a later date, you can
select the PCR product in the Database Explorer and Launch TOPO wizard as
described in the previous section. This option is useful if multiple PCR products are
generated from different files, and you wish to store and submit them from the database in batch.
c.
Save the parent molecule along with all PCR products and primers in one molecule
file. Choose File > Save As and in the Save As dialog box, select the Save as file
tab and choose a location in which the files are to be saved. Later, to submit the
saved PCR product to a TOPO reaction, open the file in a Molecule Display Window, select the PCR product in the PCR Analysis Text Pane folder and continue as
described above.
5. Generate a TOPO Clone. The Create TOPO Clone dialog box opens with your amplicon in
the attB Sequences pane. Continue with the TOPO reaction, beginning with step #2 on
page 315. The amplified sequence, plus any additions you chose during primer design, will
be cloned into the chosen vector (Figure 23.22).
Figure 23.22 Small T cloned into Gateway-enabled TOPO vector pENTR-D/TOPO. Note that the amplicon is reoriented so that direction of expression is in the attL1→ attL2 direction. This clone is ready for
recombination with a Gateway pDEST vector in an LR reaction.
343
Vector NTI Advance 10 User’s Manual
High Throughput Operations
The simplicity of Gateway and TOPO cloning easily lend themselves to automation and highthroughput operations. This final section describes procedures that can rapidly generate and
store high numbers of primers, amplicons and clones.
High Throughput PCR
1. Open one or more Molecule Display Windows containing the sequences of interest. If more
than one window is opened, consider Tile or Cascade from the Window menu to arrange
them on screen for convenience.
2. For each open window, follow these steps
a. Select the entire sequence (CTRL-A or Select All from the Edit menu) and add to
the Multiplex PCR List (List menu > Multiplex PCR List).
Figure 23.23 Lists Window – Multiplex PCR tab
b. The Lists window opens on the Multiplex PCR tab (Figure 23.23). Click Add on
the Lists window menu and in the ensuing Add Fragment to Multiplex PCR Analysis dialog, choose either Add Whole Selection or Add Features Inside Selection.
c.
If you choose Add Whole Selection and click OK the entire sequence from the
respective Display Window is entered in the multiplex list.
d. If you choose Add Features Inside Selection, use the Browse button (+) to specify the feature types to amplify (e.g. CDS, exons, etc.). You can specify individual
instances of the feature type by name. Or accept the default Add all features of
this type. Click OK and the Add Fragment to Multiplex PCR Analysis dialog will
list the named features, or Any <feature type>. The Add Fragment to Multiplex
PCR Analysis dialog can be used to mix and match different feature types on one
or several molecules.
344
GATEWAY and TOPO Cloning Chapter 23
e. Click OK and the Lists window will display a row <molecule name> Features <feature type/name> inside Selection <molecule length>
f.
Repeat these steps for all molecules open in Molecule Display Windows.
3. When the list is complete, click either Run GW or Run TOPO from the Lists window menu.
The Multiplex PCR Analysis dialog opens for the respective cloning operation. For this illustration, we will use Run GW (Figure 23.24).
Figure 23.24 Multiplex PCR Analysis dialog for generating Gateway amplicons
4. The parameters are configured to generate sense and antisense primers that amplify but do
not extend beyond the selected features. As in single-fragment cloning, sequence additions
can be added/typed to assist in expression or purification. The attB-extensions appearing in
the Add GGGG-attBx 5’ extensions boxes will be added to respective sense and antisense primers.
Ideally, all features for amplification should be on the same strand of the open files, most
often the direct strand. If some features are on the opposite strand, you should consider
whether the cloning procedure downstream is directional. (TOPO Zero-Blunt and TOPO T-A
are not and both orientations will be produced anyway) If cloning is directional (directional
TOPO or Gateway), you can repeat the analysis, and in the list setup, specify the features
on the opposite strand by name. Then check on the Amplify on Complementary Strand
checkbox.
5. In addition, these parameters are configured to attempt amplification of the selected molecules/features without high regard to standard multiplex criteria.
Multiplex fold minimum = 10
Amplicon Length Difference Min = 0
Maximize clusters
Most strikingly, there is no attempt to ensure that amplicons in a cluster will be a minimum
size difference from one another (Amplicon Length Difference Min = 0). It is assumed that
the PCR reactions computed here will be executed in plate format, one reaction per well,
rather than true multiplex format. If this is not the case in your experiment, adjust these
parameters accordingly. Finally, the default configuration will record results in a Report file
(Results tab > Generate Report).
345
Vector NTI Advance 10 User’s Manual
Figure 23.25 Multiplex PCR report
6. Click OK. When PCR computations are complete, a report Preview: Multiplex PCR Amplification is generated (Figure 23.25), which summarizes the features that can be amplified
and the primers computed for the PCR reactions. Under the configuration described above,
most reactions will be grouped in one or a few clusters. Click Save Report to save the
report to a file where it may be read in any text editor. Then click Close Report and check
the preferred options from Save PCR products as DNA molecules to DB, Save Primers
as Oligos to DB and Add Primers to Oligo List. Both “clustered” and unclustered amplicons, and their Gateway primers, are saved to subbases in their respective databases (Figure 23.26).
346
GATEWAY and TOPO Cloning Chapter 23
Figure 23.26 Over 200 annotated features in HUMBRCA1 were amplified and deposited in a single subbase of
the DNA/RNA database. Four features that were successfully amplified but not “clustered” were deposited in a
separate subset (“Cluster_unclusterized”)
High throughput cloning
One or more entries in the Explorer DNA/RNA database can be selected by standard operations
(CLICK, SHIFT + CLICK, CTRL + CLICK). When this is done, the Gateway or TOPO cloning
tools can be launched from the DNA/RNA or shortcut menu. Let’s continue with the example
using the Gateway amplicons generated above.
1. Click on the Cluster 1 subbase in the DNA/RNA database and select all of its contents.
2. From the DNA/RNA or shortcut menu, choose Gateway Cloning > Recombine an Expr
Clone by BP (Figure 23.27).
Figure 23.27 Launching Gateway BP reactions on multiple entries in the Explorer database
3. The first screen of the BP cloning tool opens, with all the amplicons listed in the attB
sequences pane.
347
Vector NTI Advance 10 User’s Manual
4. Continue as with BP for single fragment cloning. Add a pDONR vector, and click Next. You
have the option of directly opening all resulting clones in Molecule Display Windows. Click
Finish. The clones will be stored in a subset of your choosing.
5. To generate Expression Clones in batch, repeat steps 1 through 4., but choose Gateway
Cloning > Create an Expression Clone by LR from the DNA/RNA or shortcut menu.
348
C
H A P T E R
24
MOLECULE DESIGN
Introduction
This chapter describes the creation of DNA molecules through Design.
In Design, you can describe the list of fragments in very general or very specific terms. You can
also describe preferences for techniques used in creating the molecule, such as how fragments
may be isolated from their parent molecules, how termini may be modified, etc. In contrast to the
Construction technique described in Chapter 22, in Design Vector NTI does the rest, taking
advantage of the best possible restriction sites and genetic engineering techniques to engineer
the molecule.
This chapter describes:
z
The overall procedure for designing a DNA molecule
z
How to describe a goal molecule using Display windows, Fragment Wizard, and the Molecule Editor
z
How to start the design process
z
How to set your preferences for design techniques
z
What Vector NTI actually does during the design process, and how you can control the
process
z
Discussion of the design plans Vector NTI generates.
Creating a New DNA Molecule Using Design
For creating a molecule by Design, the Molecule Display window must be in Molecule Edit
mode, the default mode when the window is opened.
The process of creating a new molecule with Vector NTI’s Design capabilities generally follows
these steps in an active Graphics Pane:
1. Describe your goal molecule by defining its recipient and donor fragments and placing them
in the Goal Molecule Definition List in the proper order using Fragment Wizard.
349
Vector NTI Advance 10 User’s Manual
2. Open the Lists dialog box, loaded with the component fragments for your Goal Molecule.
3. Open the Design Molecule dialog box, enter general information for the new molecule and
initiate the Design.
4. When the Design Parameters dialog box appears, set the appropriate parameters and your
design preferences.
5. Start the design process. Vector NTI searches for optimum Design options. If Design is successful, your molecule is entered into the database and opens in its new Molecule Display
window.
6. In the Text Pane of the display window containing the goal molecule, open the Design
Description folder to inspect the design plan Vector NTI has generated.
If you are not satisfied with the design plan, you can choose to redesign the molecule by changing the description of the goal molecule or using different parameters.
Describing the Goal Molecule
In Design, you must define one recipient fragment, listed first in the Goal Molecule Definition
List, and one or more donor fragments.
The simplest way to define fragments for Design is to use the Fragment Wizard and the Graphics Pane to visually define fragments. You can then use the Fragment Editor to fine-tune fragment descriptions. Fragments can be defined by hand in the Design Molecule dialog box, but it
is much more tedious and much less effective than using Fragment Wizard. Refer to Chapter 22
for a detailed description of Fragment Wizard. Here we will describe how to use it to define
design recipient and design donor fragments.
Defining the Recipient Using Fragment Wizard
z
The recipient fragment of the goal molecule remains unaffected during the Design process. All nucleotides within the recipient fragment you defined are included in the goal
molecule. This means that any polylinker sites used for cloning must be outside the
recipient fragment.
z
The recipient must be listed as the first fragment in the Goal Molecule Definition List.
This will be covered later in the chapter.
z
The recipient must come from a circular molecule stored in the Vector NTI database.
To define a recipient fragment, open the Display window for the recipient molecule. If you have
several display windows open concurrently, you can display the source molecules concurrently
by selecting Window > Tile Vertically or make sure the source molecule for your fragment is
the topmost window. Activate its Graphics Pane and click the Add Fragment To Goal List button (
), or select List > Add Fragment to Goal List, opening The Fragment Wizard dialog
box (Figure 24.1).
Figure 24.1 Fragment Wizard dialog box
The Fragment Wizard dialog box content changes to display the entry fields and descriptions
corresponding to the current step in the fragment definition process.
350
Molecule Design Chapter 24
At any point in the process, you can choose to Cancel, go Back a screen, go to the Next
screen, or Finish the process using the appropriate buttons. (Finish goes directly to the last
step, skipping all the remaining steps, if any. Fragment Wizard goes through all the steps you
skipped and supplies the missing information using default values and the coordinates of the
current selection in the Display window.)
In the first “screen”:
Select the kind of fragment you wish to define from three choices: Since this chapter covers
Design, choose the Design Recipient Fragment option and click the Next button to go to the
second screen of Fragment Wizard:
In the second screen (Figure 24.2):
To specify the 5’ terminus of the fragment, select one of the following options. Vector NTI will
look for good cloning sites in the region upstream from the position you specify.
z
Specify a position on the molecule map (in one of the two following ways)
1. Enter the coordinate in the text box or click in the Graphics Pane of the display window.
In the latter case, the Set to a Position button will be selected automatically and the
caret position is displayed in the position field of the dialog box (and on the Status Bar).
To reposition the caret, use the right and left arrow keys.
Tip:
If, when you click in the Graphics Pane, the entire molecule is selected (as indicated by the
wire-frame), click in the Sequence Pane to deselect, and begin again.
2. Specify the start of the molecule by selecting the Start of Molecule option in the dialog
box.
z
Specify a restriction site.
To set the terminus to a restriction site, click on the site or its label in the Graphics Pane. If
selected, Vector NTI must use that site in cloning. For Design, you may be setting an unrealistic limitation. If the site is not convenient, for example, requiring complicated partial
digestion, the cloning may be very difficult.
Note:
If the Fragment Wizard screen limits your view of the molecule map, left click on Wizard’s
blue title bar, and drag it out of the way.
Figure 24.2 Specifying the 5’ terminus of the fragment
When the 5’ terminus is set, click the Next button to proceed.
In the third screen (Figure 24.3):
This screen appears only if you specified that the 5’ terminus should be set to a palindromic
restriction site. If that was not your choice, move on the description of the fourth screen.
You are asked to specify whether the site should be saved or lost in the designed molecule.
Your options are: Save Site, Lose Site or Don’t Care. If you do not specify that site is to be
351
Vector NTI Advance 10 User’s Manual
saved or lost, its fate will be unpredictable. Choose the desired option and click the Next button
to advance to the next screen of the dialog box.
Figure 24.3 Specifying whether the site should be saved or lost in the designed molecule
In the fourth screen:
Specify the 3’ terminus of the fragment. Vector NTI will look for good cloning sites in the region
following the position you specify. Options are:
z
Specify a position on the molecule map (in one of the two following ways)
1. Enter the position into the text box or SHIFT + CLICK in the Graphics Pane and adjust the
caret position using SHIFT-arrow key combinations described in Chapter 3.
2. Specify the end of the molecule
z
Specify a restriction site.
+ CLICK on the site or its label in the Graphics Pane. If selected, Vector NTI must use
that site in cloning. For Design, you may be setting an unrealistic limitation. If the site is not
convenient, for example, requiring complicated partial digestion, the cloning may be very
difficult.
SHIFT
Tip:
The SHIFT key must be held down for all actions in the Graphics Pane for setting the 3’ end.
If you neglect to do this, your actions will change the 5’ terminus and Fragment Wizard will
revert to screen 2.
If you specified that the 3’ terminus is set at a palindromic restriction site, you can go to the
next screen and specify that the site should be saved or lost in the designed molecule.
Choose the desired option and click the Finish button to complete the definition of the fragment.
If you did not specify a palindromic restriction site, the Next button is disabled; click the Finish
button, signifying completion of fragment definition.
Figure 24.4 Adding the fragment to the Goal Molecule Definition List
Review the description of the selected fragment in the New Fragment message box. If you
made a mistake, click the Cancel button to return to the Fragment Wizard. Otherwise, click the
Add to List button (Figure 24.4), adding the fragment to the Goal Molecule Definition List and
closing the Fragment Wizard.
Notes about Design:
352
Molecule Design Chapter 24
z
Ιf you later edit the recipient fragment in the List/Design Molecule dialog box, any biochemical operations you order to be performed on the termini of the recipient fragment
will be ignored. During the Design process, Vector NTI chooses all methods of terminus
modification itself.
z
The recipient fragment always has direct orientation. The Inverted box in the recipient’s
Fragment Editor dialog is disabled during the Design process.
Defining the Donors Using Fragment Wizard
Donors are fragments that Vector NTI inserts into the recipient fragment (vector) to produce the
goal molecule. Donor fragments in Design must carry functional signals into the recipient.
When performing Design, Vector NTI requires all fragments except the first in the Goal Molecule
Definition List to be donor fragments. Donor fragments can come from circular or linear molecules stored in the database.
To define a donor fragment, open the display window for the donor molecule. (If you have several display windows open concurrently, the source molecule for your fragment should be the
topmost window.) Activate its Graphics Pane and click the Add Fragment To Goal List button
(
) on the Window toolbar or select List > Add Fragment to Goal List, opening The Fragment Wizard dialog box.
In the first screen:
Select the Design Donor Fragment option and click the Next button to go to the second screen
of the Fragment Wizard.
In the second screen (Figure 24.5):
z
To select the desired functional signals to be carried on the donor fragment into the
recipient, click on the signal or its label in the Graphics Pane. To select more than one
signal, hold down the SHIFT + CLICK. Note: If the Fragment Wizard screen limits your view
of the molecule map, left click on Wizard’s blue title bar, and drag it out of the way.
z
To deselect a selected signal, hold down SHIFT + CLICK again.
Figure 24.5 Selecting the desired functional signals to be carried on the donor fragment into the recipient
The names of the signals you selected are displayed in the Fragment Wizard dialog box.
If the donor molecule is circular and you have chosen more than one signal, Fragment Wizard
lets you choose the place of the “gap” between signals where Vector NTI will look for a convenient place to cut the donor molecule. To move the gap clockwise, click the right arrow button on
the Fragment Wizard; counterclockwise, click the left arrow button. To illustrate this, select more
than one signal and experiment. When the desired signals are selected, click the Next button to
go to the next screen.
353
Vector NTI Advance 10 User’s Manual
In the third screen (Figure 24.6):
The next screen for specifying the 5’ terminus for design offers two selections:
z
Leave Terminus Undefined if you want Vector NTI to choose restriction sites for you.
z
Use Specific Site to use a restriction site to cut the signals from the donor molecule.
Fragment Wizard prompts you to hold down the SHIFT key and click on the restriction site
or its label in the Graphics Pane. The site label is selected and the name of the site and
its position are shown in the Fragment Wizard dialog box. If selected in this way, Vector
NTI is forced to use that site in cloning. If the site is not convenient, for example, requiring complicated partial digestion, you will be responsible for the difficulty of the cloning
situation.
Figure 24.6 Specifying the 5’ terminus for design
Click the Next button to go to the next screen.
In the fourth screen (Figure 24.7):
If you have chosen the Use Specific Site option, this screen lets you specify the 3’ terminus for
design. The required actions are the same as for the 5’ terminus screen described above.
If you have chosen the Leave Terminus Undefined option, this screen asks you to specify the
maximum size of the 5’ flank region (if you came from the 5’ terminus definition screen) or 3’
flank region.
Figure 24.7 Specifying the 3’ terminus for design, or specifying the maximum size of the 5’ flank region
z
354
Use Flank Region No Larger Than … bps limits the region within which cloning sites
may be sought (thus limiting the size of the resulting flank region). At the prompt, enter
either the maximum length of the flank region in the dialog’s text box or move the appropriate end of the selection in the Graphics Pane into the gap beyond the edges of the
selected functional signals. In this case, the selection in the Graphics Pane shows a
maximum possible flank region. You can use all available techniques for extending a
selection in the Graphics Pane: drag the appropriate end of the selection, SHIFT-CLICK on
the desired position, etc. For details on Selection Techniques, refer to Chapter 3.
Molecule Design Chapter 24
z
Do Not Limit the Size of a Flank Region allows Vector NTI to search all available
space for restriction sites.
When you are finished with the description of both termini of the donor fragment, the Next button becomes disabled. Click the Finish button to complete the definition of the donor fragment.
The New Fragment message box is displayed with the description of the selected donor fragment. If you made a mistake, click the Cancel button to return to the Fragment Wizard dialog.
Otherwise, click the Add to List button. The fragment is added to the Goal Molecule Definition
List and the Fragment Wizard dialog box is closed.
The Goal Molecule Definition List (Goal List)
The Goal Molecule Definition List (Figure 24.8) (in the Fragments tab at the bottom of the Lists
dialog box) is a list of fragments to be combined to create a new molecule. In addition to adding
fragments to the Goal Molecule Definition List using the Fragment Wizard, you can add them
directly from the Lists dialog box.
To see the Goal Molecule Definition List, click the Open Goal List button (
) or choose List >
Molecule Goal List. In the Lists dialog box (Fragments tab) that opens, the Fragments display
box lists the fragments currently in the Goal Molecule Definition List.
Figure 24.8 Goal Molecule Definition List
Note:
The first fragment listed is considered the “recipient fragment.” If a fragment is listed in incorrect
order, highlight it and click the Up or Down buttons to reposition it.
Starting the Design
Although the goal molecule component fragments are ready for processing by Vector NTI’s
Design mode, remember that VNTI decides on the optimum Design fragment termini and cloning strategies.
To begin the design of your new molecule, open the Lists dialog box by clicking on the Open
Goal List button or selecting List > Molecule Goal List.
Open the Design Molecule dialog box by clicking the Run button on the Lists dialog box.
Note: The Construct/Design Molecule dialog box has two operational modes—a mode for molecule construction and mode for molecule design. Because you have defined fragments in this
chapter for Design, in this mode, the dialog box title is the Design Molecule. See Chapter 22 for
details on the Construct Mode.
Enter or select the dialog box fields as follows:
z
Name
z
Circular/Linear - the form of the molecule.
355
Vector NTI Advance 10 User’s Manual
z
DNA/RNA - molecule type
z
Click the General Info button to enter molecule description information:
o
Description - notes about the molecule
o
Extra-Chromosome Replication - transformation systems
o
Replicon Type - molecule’s replicon type
o
Keywords - keywords useful for database search. Refer to page 171 for details.
o
Click OK to return to the Design dialog box.
All of the General Info data will appear in the General Description folder when the molecule is
loaded into a Display window.
z
Recipient’s Start - start of the new molecule is as close as possible to the start of the
“recipient” component fragment (the first fragment listed of the Component Fragments).
z
Position ... - specify a specific nucleotide of a specific fragment as the starting nucleotide of the new molecule. (By default, the first nucleotide of the first fragment.)
The Component Fragments Field
Designed molecules consist of one or more component fragments. Use the Fragments field in
the Lists dialog box to verify or enter this information.
You may edit, delete, and change the order of the fragments in the Component Fragments field,
and you may add new fragments of five types. These operations are described in Chapter 22.
It is essential in molecule design that the recipient fragment is first in the Fragments list, followed by the donor fragments. If you need to change this order, highlight the fragment(s) to be
moved and click the Up or Down buttons until they are in the correct order.
Defining Design Fragments in Fragment Editor
An alternative to using Fragment Wizard for defining design fragments is to enter them manually
into the Fragments tab of the Lists dialog. To do this, click the Add button and choose Add
<Donor/Recipient> Fragment > with Fragment Editor to open the Fragment of Molecule dialog box (Figure 24.9).
Figure 24.9 Fragment of Molecule dialog box
Options in the Fragment Editor dialog box are summarized as follows:
z
356
Design recipient/donor fragment
Molecule Design Chapter 24
z
A donor fragment created with a Display window always has a defined parent molecule
name
z
Change the orientation of a donor fragment by checking the Inverted box.
z
Left/Right Terminus buttons open the Edit Terminus dialog box (Figure 22.16). The way
you defined the termini initially governs which sections are enabled in this dialog box.
For more information on modifying termini, refer to Chapter 22.
In Design, all donor fragments carry functional signals called descriptors into the recipient. To
add or remove descriptors from a donor fragment, use the For Design Donors Only section of
this dialog box. To add a descriptor, click the Add button, opening the Fragment Descriptor dialog box (Figure 24.10):
Figure 24.10 Fragment Descriptor dialog box
To define a descriptor for the donor fragment, choose the type of signal and enter the name of
the signal, if necessary. If the signal is on the complementary strand, check the Complementary box. (If you do not enter a signal name, the descriptor is added to the donor fragment and is
treated as any signal of the specified type.)
Note:
The Fragment Descriptor dialog box is the only way to add a descriptor containing any signal of
a specified type. Such a descriptor cannot be added from a display window.
Click OK to return to the Fragment of Molecule dialog box (Figure 24.9).
z
To remove a descriptor from a donor fragment’s description, highlight it in the Descriptor(s) box and click the Delete button.
z
If after leaving the Display window you would like to add flank regions to a donor fragment, or change flank regions set through a Display window, you can use the Maximum
Flank Region boxes.
z
Subset of Parents – If you prefer to simply identify the feature to be added to the new
molecule, you can let Vector NTI decide which specific molecule of the subset is used as
the source for the functional signal. In the Subset of Parents drop-down menu, select the
subset where the parent molecules might be sought.
After entering and verifying the data in the Lists dialog box, you are ready to proceed with the
design process. Click the Run button to launch the Design Molecule dialog box and then click
the Design button.
Vector NTI performs a preliminary save of the current molecule state. The molecule’s name,
general information, fragment list, etc. are saved and can be recalled. The system then performs a preliminary analysis of the design possibilities, and opens the Design Parameters dialog
box, described below.
If you start a design for a goal molecule with a name that causes a conflict with an existing set of
design options, Vector NTI informs you of the conflict and ask permission to delete the existing
357
Vector NTI Advance 10 User’s Manual
options. If you do not want to do this, choose a different name for the new goal molecule or
rename old design options.
Design Parameters
After the Design is initiated, in the interim dialog box that opens, select a subset for storing
Design results. The Design Parameters dialog box (Figure 24.11) then opens where you can set
the Design parameters the program uses to design the molecule.
Figure 24.11 Design Parameters dialog box
Options in the Design Parameters dialog box are summarized as follows:
358
o
REN Subsets displays the list of restriction endonucleases that Vector NTI will consider in the current Design task.
o
Transformation System(s) and Extra-Chromosome Replication specifies the
capabilities for the current Design process.
o
Dephosphorylation Permitted allows dephosphorylation to be used as a pre-selection method.
o
Try to Lose Junction Sites directs the loss of junction sites if possible without
increasing cloning complexity. Lost sites are then used for efficient pre-selection. This
box is a request, not a command, and Vector NTI may save the site if that results in a
more convenient design option. If, in the Fragment Wizard, you specified that sites be
saved or lost in the description of the recipient, they will automatically be saved or
lost regardless of whether this box is checked.
o
Fragment List Gives Order of Cloning Steps inserts the first donor into the recipient in the first cloning step, the second donor in the second cloning step, etc. If this
box is unchecked, the order of cloning steps is based on the most convenient restriction sites.
o
Fragment List Gives Order in Goal Molecule places the donor fragments in the
goal molecule in the same order in which they are listed in the goal molecule description. If this box is unchecked, the placement order is based on the most convenient
restriction sites.
o
Delete Region specifies the number of nucleotides to be deleted from the recipient
molecule during cloning. This may be disabled, depending on how the fragments
were defined.
o
Phage Size May Be Changed By is enabled if the recipient molecule is a phage,
which may lose its functionality due to length changes. If you want to preserve phage
functionality in the goal molecule, it may be useful to prevent the goal molecule from
Molecule Design Chapter 24
being much different in length than the recipient molecule. Enter the maximum
change in length (%) for phages in the field. If this field is enabled and specified, then
the lengths of the goal molecule and all intermediate recombinants produced by the
Design process are kept within the specified length limits.
o
Preferences opens the Design Preferences dialog box. See next section.
o
PCR Primers – Vector NTI can use PCR amplification to isolate donor fragments.
The system also will propose primers for PCR amplification of cloned fragments in all
molecules produced by the Design process, including the goal molecule.
o
Click the Parameters or Quality buttons under PCR Primers to set the desired
parameters or Quality Specifics of PCR primers. Refer to page 253 for the details of
the dialog boxes that open with these commands.
o
The primers used will satisfy the conditions set by the user in the PCR Analysis dialog box.
When all design parameters are set as you desire, click the Start Design button.
Design Preferences
Although much of the Design process is decided by Vector NTI, you can select preferred techniques for designing the molecules. Click the Preferences button in the Design Parameters dialog box (Figure 24.11) to open the Design Preferences dialog box (Figure 24.12):
Figure 24.12 Design Preferences dialog box
In this dialog box, you can set preferences in the categories of fragment isolation, fragment ligation, and terminus modification.
Depending upon your Design results, you may find it useful to have Vector NTI design the same
goal molecule several times, changing the design preferences each time. This gives you several
alternatives for constructing your molecule.
The parameters for this dialog box are as follows:
z
Fragment isolation: Vector NTI isolates fragments for cloning using convenient restriction sites whenever possible. If no convenient restriction sites are present, partial digestion or PCR can be used to isolate fragments. Check the isolation methods you will
permit:
z
Partial Digestion (Simple): Partial Digestion with 1 site inside required fragment and 3
sites total.
359
Vector NTI Advance 10 User’s Manual
z
o
Partial Digestion (Medium): Partial Digestion with 1 site inside required fragment
and not more than 6 sites total.
o
Partial Digestion (Complicated): Partial Digestion with more than 1 identical site
inside required fragment.
o
PCR
o
Ligation: Check the junction types you will permit Vector NTI to use in designing molecules. Cohesive...Cohesive junction means both ligated fragments have two cohesive ends, each longer than 1 nucleotide; Cohesive...Short junction means both
ligated fragments have one cohesive and one short (exactly 1 nucleotide) end, etc.
Terminus modification: Check the methods you will permit to make termini compatible.
Other Preferences
z
Separation in Gel: Specify the minimum relative difference in length (%) for separating
fragments in gel.
z
Complicated Partial Digestion: Specify the maximum number of restriction sites inside
the required fragment and the total number of sites on the molecule that are acceptable
for fragment isolation using complicated partial digestion.
Priorities
What’s Better – rate priorities for the techniques and ligation types by moving them in the corresponding lists. To reposition any item, select it and click the Up and Down buttons. Items near
the top of the lists have higher priority than items lower in the lists.
Advanced Design Preferences
Click the Advanced button in the Design Preferences dialog box to open the Internal Design
Parameters dialog box (Figure 24.13) to fine-tune Vector NTI’s heuristic search for molecule
design options. Default settings are given in italics.
Figure 24.13 Internal Design Parameters dialog box
360
z
Depth of Backtracking: Specify the number of steps Vector NTI should retrace in its
search algorithm to design a molecule if it hits a dead-end in finding a molecule according to the defined parameters. Default value is 5
z
Min. Rating for Acceptance: Specify the minimum acceptable rating to immediately
accept an option and end the current search step. Vector NTI rates design options on an
integer scale of 1 to 8. The higher the number, the longer Vector NTI continues searching for a better construct according to the defined parameters. Default value is 3
z
Min. Rating to Avoid Next PD Level: If Vector NTI cannot achieve a minimum rating for
acceptance (see previous point), it may try the next more complicated level of PD (partial
digestion.) For instance, if you have listed Simple Digest first (under What’s Better in Fig-
Molecule Design Chapter 24
ure 24.12), then Medium and then Complicated as partial digest preferences, Vector NTI
tries to use the Simple Digest first. If it cannot reach the minimum rating for acceptance
as specified, then it will use the next level of partial digestion, (medium) and so forth.
Specify the rating below which the system will try more complicated partial digestion.
Default value is 1
z
Min. Rating to Avoid PCR: If Vector NTI cannot achieve a minimum rating for acceptance (see second point above), it will try to apply PCR. Specify the rating below which
the system will try PCR. Default value is 1
z
Immediate Break When There Are Enough Backtracking Options: If checked, Vector
NTI stops searching for further solutions once it finds enough alternatives for backtracking. Checking this option can result in faster searches. Default setting is Yes. When this
option is checked, the optimum design option will usually be among those found, but
sometimes the system may find something better if permitted further search.
Click OK twice to return to the Design Parameters dialog box.
Note: InforMax recommends that you not change these parameters until you have developed extensive experience with Vector NTI’s Design capabilities.
The Design Process
When you click the Start Design button in the Design Parameters dialog box, Vector NTI begins
the Design process. An interim “Designing...” dialog box appears, showing you the progress of
the design and allowing you to break and accept at certain points, or cancel the design entirely.
The design process consists of several stages:
1. Vector NTI collects all the information it needs to perform the design. The message “Collecting necessary data...” is displayed on the screen.
2. Vector NTI creates restriction maps for all molecules, which may be involved in the design. If
many maps need to be created (for example, if you chose a large subset of molecules as
potential donors) and if many restriction endonucleases are involved, Vector NTI may take a
relatively long time to create all the maps.
3. Vector NTI begins to perform cloning steps. In each step, one donor fragment is cloned into
the recipient.
4. When each cloning step is complete, Vector NTI constructs the best recombinant it obtained
for that step, models cloning analysis after transformation, searches for important restriction
sites in the recombinant, etc.
5. If a cloning step produces the goal molecule, that is, if no donors remain to be cloned, Vector NTI finishes the Design task and enters the goal molecule into the database.
6. If donor fragments remain, the system moves on to the next cloning step.
7. When the Design process is complete, all intermediate recombinants (if any) are stored in a
new subset in the database, called name_$Intermediate, where name is the goal molecule’s
name. A Molecule Display window opens only for the final molecule.
If you start a Design task for a goal molecule with a name that causes a conflict with an existing
set of intermediate recombinants, Vector NTI informs you of the conflict and asks permission to
delete the existing intermediates and turn the existing designed molecule into a basic molecule.
If you do not want to do this, choose a different name for the new goal molecule.
The recombinants are named as follows: name_$step number_variant number, where name is
the goal molecule’s name, step number is the number of the cloning step, and variant number is
the number of the variant of this step, if more than one variant has been generated.
361
Vector NTI Advance 10 User’s Manual
From a special subset created for the Design result molecules, you can open, examine and/or
delete the intermediate recombinants as desired. If you delete intermediate recombinants, the
goal molecule becomes a basic molecule.
From the moment Vector NTI begins making restriction maps, the Cancel button is active. Press
it if you want to abort the design at any point. If you cancel the design, the information in the
Design Molecule dialog box remains unchanged.
During each cloning step, if at least one acceptable design option has been found, the Accept
Now button is active. Click it to stop further search and accept the best option already found for
the current cloning step. You may wish to turn off the Immediate Break When There Are
Enough Backtracking Options check box in the Advanced Design Preferences, and control
the depth of the heuristic search for each cloning step with the Accept Now button.
Returning to the Pre-Design State
When Vector NTI designs molecules, it saves the original goal description (list of recipient and
donor fragments) in the database along with all other information about the new molecule. After
the molecule has been designed, you can return it to its original state.
This is useful if you want to try several different designs based on the same goal molecule
description. Design the molecule one way and inspect the results in a Molecule Display window.
If you are not satisfied with the results, change the design parameters or design preferences,
and try again until you are satisfied,
Select File > Molecule Operations > Advanced DNA/RNA > Design. An intercept dialog box
opens reminding you that you will be overwriting the new molecule with the original fragments.
Click Yes to continue with the new Design. The Lists/Design Molecule dialog box opens again
loaded with the original Design component fragments you selected.
If you cannot achieve a satisfactory design by changing the design parameters and preferences,
try changing the description of the goal molecule. Change the molecule names each time so you
will have a record of your attempts.
If you still cannot achieve a satisfactory design, try changing the internal design parameters to
influence Vector NTI’s heuristic searches for design options.
The Design Description Folder
The Molecule Display window for the final new molecule automatically opens upon the conclusion of Design. At a later time, you can open a Molecule Display window for newly designed
intermediate molecules stored in the database. In either case, the Text Pane of the display window contains a Design Description folder with subfolders for each cloning step used to create
the molecule. In each cloning step, one donor fragment is cloned into the recipient.
Cloning Step Subfolders
Each cloning step subfolder of the Design Description folder contains the following information:
362
z
Result Molecule: Name of the recombinant obtained in this cloning step. If this is the
final cloning step, the name of the recombinant is the same as the name of the goal molecule. If this is an intermediate recombinant, the name is formed according to the rules
given previously in this chapter.
z
Recipient
o
The name of the molecule used as the recipient
o
The restriction sites used as the left and right termini
o
If and how the termini were modified
Molecule Design Chapter 24
o
z
If partial digestion was used in this cloning step, the number of sites inside the
required fragment and the total number of sites on the molecule
Donor
o
The molecule used as the donor
o
Whether the fragment was inserted in complementary orientation,
o
The restriction sites used as the left and right termini of the donor
o
If and how the termini were modified
o
If partial digestion was used in this cloning step, the number of sites inside the
required fragment and the total number on the molecule
o
The actual flank regions on each end of the donor fragment, that is, the distance in
nucleotides between the first or last nucleotide in the fragment and the appropriate
boundary of the nearest functional signal
o
If the donor fragment was obtained through PCR amplification, the PCR primers used
are displayed in the 5’-3’ direction. If a restriction site was attached to the 5’ end of
the primer, that site is also shown here.
z
Ligation Junction types: cohesive or blunt.
z
Lost restriction sites on the recipient indicates sites lost during cloning
z
Donor fragment orientation indicates if the ligation conditions prevent parasitic donor
fragment orientations.
z
Preselection: The recommended pre-selection method
o
If one or both recipient sites are lost after ligation, they will be recommended for
effective pre-selection.
o
If sites are not lost, the system will recommend dephosphorylation (if that was permitted in the Design Parameters dialog box).
The ability to perform pre-selection influences the choice of methods of clone analysis after
transformation.
z
Transformation system: The recommended transformation system for clone analysis.
This information is useful if the user allowed more than one transformation system to be
used. Vector NTI considers the size of recombinants, their replicon types, and extrachromosome replication capabilities.
z
Recommended method(s) for clone analysis: Recommended methods for clone analysis after transformation. Vector NTI proposes the most reasonable set of four possible
methods: Screening, Colony Hybridization, Restriction Analysis, and PCR amplification
of the cloned fragment. These recommended methods are based on a number of conditions: ligation type, full or partial digestion, pre-selection, etc.
z
Recommendations for restriction analysis: The recommended restriction sites give
distinguishable gel patterns for the result molecule (recipient with insertion) and the
recipient without insertion.
The following information is given even if these methods were not recommended for clone
analysis:
z
Recommended oligonucleotide for colony hybridization: The oligonucleotide will
successfully hybridize with the inserted fragment.
z
Primers for PCR: allow amplification of the region closest to the boundaries of the
cloned fragment.
z
If the ligation conditions permit parasitic donor orientations, restriction sites for restriction
analysis are recommended to identify the clone with required donor fragment orientation.
363
Vector NTI Advance 10 User’s Manual
z
Important restriction sites for the result molecule are listed and categorized: sites missing on the molecule, unique sites located within the cloned fragment, and unique sites
located outside the cloned fragment.
Redesigning a Molecule
You can redesign a previously designed molecule by right-clicking on the designed molecule in
the Database Explorer window and choosing Redesign from the shortcut menu. This launches
the Design Molecule dialog box with all the parameters used for the original design of that molecule. The Redesign feature is useful for designing molecules that are similar to a previously
designed molecule and for redesigning molecules that have failed a previous design attempt
(such molecules appear with a question mark icon to the left of their names in the Database
Explorer window).
364
C
H A P T E R
25
GEL DISPLAY WINDOWS
Introduction
Vector NTI’s Gel Display windows are graphical tools designed for supporting your electrophoresis work.
In a Gel Display window you can:
z
Add gel markers and samples to gel lanes.
z
View general electrophoresis data or specific fragments in Text Pane folders.
z
Assign colors and line formats to individual gel fragments.
z
“Run” a gel in increments or animation for a specific length of time.
z
Enlarge or reduce a gel for optimum visualization.
z
Move gel samples or markers to and from the Gel Sample List, a data clipboard or display windows.
Opening a Gel Display Window
Gel Display windows can be opened in two ways: by opening a new display window or by opening a previously saved Gel Document file.
365
Vector NTI Advance 10 User’s Manual
Opening a New Gel Display Window
To open a new Gel Display window, click the New Gel button (
) on the Main Toolbar, or
choose Gel > Create New. The Gel Setup dialog box (Figure 25.1) opens for setting gel parameters:
Figure 25.1 Gel Setup dialog box
z
z
z
z
z
Electrophoresis Profile: Select from preset settings or previously saved settings
o
Save Settings As… Click to name and save new settings specified in this dialog box.
o
Remove Saved Setting Select an entry in the profile list and click this button to
remove it
Electrophoresis Type
o
Agarose gel with constant electric field
o
Polyacrylamide (Constant Field)
o
Pulse Field (Agarose gel)
Electrophoresis Parameters Default settings are in italics.
o
gel concentration: 1.0%
o
electric field: 2.5 V/cm
o
gel length: 15.0 cm
o
pulse time (for pulse field EP) 2 sec
View Parameters
o
Time increment (time span that each gel modeling iteration adds or subtracts from
the gel run)
o
Animation speed (time increments in minutes added to the gel run for each second
of real time during animation.)
o
Separation distance (the minimum distance by which fragments must be separated
in order for you to distinguish them in the gel.)
Buffer All possible buffers are represented by two types.
o
Tris-Acetate (TAE)
o
Tris-Borate (TBE).
Click OK to close the settings box and open a Gel Display window. See the Electrophoresis
Profile bulleted point to the save the settings.
366
Gel Display Windows Chapter 25
To modify the settings of a Gel Display window at any time, click the Gel and Display Setup
button (
), or select Edit > Gel and Display Setup. The Gel Setup dialog box opens
where you can change data for the open display window.
Opening a Gel Document File
Gel Display window contents can be stored in a Gel Document file. To open an existing Gel Document file, select Gel > Open Document. In the standard File Open dialog box, browse for the
directory or folder and file name of the Gel Document to be opened. Click Open.
Elements of a Gel Display Window
A Gel Display window is divided into two sections, or panes: a Text Pane and a Gel Pane,
divided by a split bar. When the Gel Display window is first opened, it remains empty until you
create your gel.
The Gel Display window toolbar has two different variants, depending on whether the active
pane is the Text Pane or the Gel Pane. Most toolbar buttons have associated tool tips that
explain the button function. Hover the cursor over the button to display the tool tip for that button.
Gel Samples and Gel Markers
Vector NTI gels can contain two types of data:
1. Gel samples: fragments to be analyzed in a Gel Display window. They are created for shortterm use. If saved to the database, they become gel markers.
2. Gel markers: sets of fragments of known lengths used as standards for measuring migration
speed. Gel markers are stored and loaded from the Vector NTI database.
Creating and Adding a Gel Sample to a Gel
To create a gel sample for one gel lane, click the Create Sample button (
) on the Window
toolbar or choose Gel > Create Gel Sample, opening the Create Gel Sample dialog box (Figure
25.2):
Figure 25.2 Create Gel Sample dialog box
z
Source Molecules – In the left column, select a DNA/RNA Molecule subset and one or
more molecules from that subset.
367
Vector NTI Advance 10 User’s Manual
z
Source Enzymes – In the center column, select an Enzyme subset and one or more
enzymes from that subset.
z
Selected for Gel Sample – The right column of the dialog box shows molecules and
enzymes currently selected for creating the sample.
o
Removing Entries – To remove a molecule or enzyme from the Selected for Gel
Sample column, deselect it in the source column or double-click on its name in the
Selected for Gel Sample column.
Performing Partial Digestions – Notice that each enzyme name in the selected column has a
checkbox to its left. Checking the box indicates to Vector NTI that you wish to perform a partial
digestion for the enzyme.
z
Sample Name/Description – Enter a sample name and description in the text box at the
bottom of the dialog box. The gel data is identified in Text Pane folders by the name and
description you enter in these boxes.
When the gel sample is defined, click one of the action buttons at the top of the dialog box:
Note:
z
Add to Gel – Adds the sample to one lane in the active Gel Display window. Select new
molecules and enzymes for each lane and click Add to Gel. If there is no active Gel Display window, this button is disabled.
z
Add to Gel Sample List – Adds the sample to the Gel Sample List. The Gel Sample List
dialog box is described below.
z
Save as Gel Marker – Opens the New Gel Marker dialog box (Figure 25.3) allowing you
to save the sample to the Database as a gel marker (see the next section).
In the Create Gel Sample dialog box, you must select a molecule. To open the New Marker
dialog box without having a molecule already selected, choose Gel > Create Gel Marker.
z
Click the OK button in the New Marker dialog box to save the sample as a gel marker
and to return to the Create Gel Sample dialog box. To add the new marker to the gel, see
Adding a Gel Marker to a Gel on page 369.
New Gel Marker Dialog Box
To create a new gel marker, select Gel > Create Gel Marker. The New Gel Marker dialog box
opens to the General tab. Enter a name for the new marker. Once you have entered the name,
select the Gel Marker tab.
Figure 25.3 New Gel Marker dialog box
368
Gel Display Windows Chapter 25
The Fragments list box lists by length all fragments making up the current sample.
Tip:
z
To add a fragment to the sample, enter its length in bp in the New Fragment box and
click the < Add button.
z
To remove a fragment from the sample, select it in the Fragments box and click the >
Delete button.
If by chance you press Enter instead of the < Add key, thus closing the dialog box before
you are finished, go to the Gel Markers table in the Database Explorer. Double click on the
new gel marker you were creating. It opens in an Edit Gel Marker dialog box where you can
continue the process.
On the Gel Marker tab you can also edit the sample’s description, shown in the Description
text box. The User Fields, Comments, and Keywords tabs are the same as for other kinds of
database objects; they are described in Chapter 20.
Click the OK button to save the sample to the Database as a gel marker.
Adding a Gel Marker to a Gel
To add a gel marker to a gel, click the Add Marker Lane button (
) on the Gel Toolbar. In the
Choose Database Gel Marker dialog box (Figure 25.4), select the gel marker and click OK, adding it to a gel lane. (If you have created your own gel marker, you will see it listed in this dialog
box.)
Figure 25.4 Choose Database Gel Marker dialog box
The Gel Sample List
The Gel Sample List (Figure 25.5) is a data clipboard for mixing gel sample fragments taken
from various sources within Vector NTI. This is an alternative way to prepare gel markers.
Figure 25.5 Gel Sample List
369
Vector NTI Advance 10 User’s Manual
Viewing the Gel Sample List
To open the Gel Sample List, click the Open Gel Sample List button (
or choose List > Gel Sample List.
) on the Main Toolbar
To remove a fragment from the Gel Sample list, select the fragment and click the Remove button. To remove multiple fragments, select all the desired fragments click the Remove button.
To save the Gel Sample List as a gel marker, click the Marker button. This opens the Gel
Marker Editor, described previously.
Adding Fragments to the Gel Sample List
To add a fragment to the Gel Sample List, select it in the Gel Pane by CLICKING + DRAGGING over
its bands with the mouse. Then click the Add to Gel Sample List button (
> Add Selection to Gel Sample List.
), or choose List
If the Gel Sample List is empty, the fragments you have selected will be added to the list. If the
Gel Sample List is not empty, you will be given the option of adding the currently selected fragments to the existing set, or of having the selected fragments override the existing set.
Loading Fragments from the Gel Sample List
To load fragments from the Gel Sample List to the gel, click the Add Lane from Gel Sample
List button (
), or choose the Edit > New > Add Lane from Gel Sample List. All of the fragments currently contained in the Gel Sample List are added to a new lane of the active Gel Display window.
Panes in a Gel Display Window
Once a gel has been created, the contents of the two panes become apparent (Figure 25.6):
Figure 25.6 Text Pane and Gel Pane of a Gel Display window when a gel has been created
Text Pane folders contain a listing of electrophoresis gel data pertinent to the gel shown in the
Display window, and information about the samples loaded into the gel’s lanes.
The Gel Pane shows a graphical depiction of an electrophoresis gel you have just loaded.
370
Gel Display Windows Chapter 25
To switch back and forth between the panes, use the Switch Pane buttons on the Gel Pane
Toolbar (
), (
). The display window panes can be manipulated using the scroll bars and
split bars, as explained in detail in Chapter 3.
Gel Display Window Text Pane
The Gel Display window’s Text Pane contains one or more folders that can be opened, closed,
expanded, collapsed, etc. as described in Chapter 3.
The Gel Display window Text Pane always has a General Description folder, containing data
about the gel itself, including parameters set in the Gel Setup dialog box. The folder also shows
the separation distance, time increment, and animation speed for this gel.
The Text Pane also contains a folder for each occupied lane. Folders can contain:
z
a line giving the length range of the fragments in the lane
z
a description of the contents of that lane
z
subfolders (gel sample), labeled by fragment length, for each fragment in the lane. For
gel samples created and not yet saved, the subfolders contain a description of the
source of the fragment, for example, “Source:
ColE1;
HaeII(5419)
HaeII(1012)”. The numbers refer to the REN site position on the source molecule
map.
z
subfolders (gel marker), while giving the fragment lengths, do not provide fragment
sources
Modifying Fragment Properties
You can use the Text Pane to set the color and pattern with which a fragment is displayed in the
Gel Pane. This is convenient for tracking the progress of a particular fragment as you run your
simulated gel.
To set a fragment’s display color, select the specific fragment’s folder in the Text Pane. Select
Edit > Sample Fragment Properties or Sample Fragment Properties from the shortcut
menu. In the Format Sample Fragment dialog box, choose a pattern and color for the fragment,
and click OK. The fragment is displayed in the Gel Pane with the appropriate pattern and color.
You may not be able to see it until you run your gel.
To simply view the properties for an entire lane, select the lane number by clicking on its well in
the Graphics Pane and choose Edit > Lane [#n] Properties, or select the corresponding option
from the shortcut menu or press ALT + ENTER.
The Gel Display Window Gel Pane
The Gel Display window Gel Pane displays a simulated gel, the lanes of the gel running vertically in the pane. Each lane is numbered at the top of the lane in a box called a “well.” As the gel
progresses, a size scale runs down the left side of the Gel Pane, showing fragment sizes in bp.
To activate the Gel Pane, click on the toggle switch on the Gel Pane Toolbar.
Step Forward, Step Back and Animation
The Time box on the Display window toolbar (
) tracks the time the gel “has been
running”, in the form hours:minutes. To set a new time, click this box to activate it, enter the
new time and press ENTER.
Click the Step Forward (
increment of time per click.
) and Step Back (
) buttons to advance or reverse the gel one
371
Vector NTI Advance 10 User’s Manual
Click the Animate button (
) to start the gel running continuously. To stop the animation, click
the Animate button again or the Step Forward or Step Back button.
(The time increment and the animation speed were set in the Gel Setup dialog box [Figure
25.1])
Gel Lanes
A Gel Display window can contain any number of lanes. You can select a lane by clicking on its
well.
To change the lane width, move the mouse cursor to the division between any two wells where
the cursor changes to a double-ended arrow (
). Drag the cursor left or right. Since all of a
gel’s lanes are displayed with the same width, if you change the width of one lane, all of the
other lanes change as well.
To perform other operations on lanes, place the cursor within the lane’s well and open a shortcut
menu, with these options:
z
Lane [#] Properties displays the properties for the selected lane.
z
Move Left moves a lane one slot to the left. (Or click on the well and select Edit > Move
> Move Lane Left.)
z
Move Right moves a lane one slot to the right. (Or click on the well and select Edit >
Move > Move Lane Right.)
z
Delete deletes the selected lane. (Or click on the well and choosing Edit > Delete [#]
Lane.)
z
Select All selects all fragments in the lane.
z
Add to Gel Sample List adds all selected fragments to the Gel Sample List.
z
Save as Marker launches the New Gel Marker dialog box, allowing you to save the
selected fragments as a gel marker.
Selecting Fragments
To select fragments in the Gel Pane, drag the cursor that becomes a horizontal I-beam (
)
vertically across the fragments to be selected. All fragments in the highlighted selection zone
are selected.
There are two reasons for selecting fragments:
1. Selected fragments can be copied to the Gel Sample List or saved as a gel marker.
2. If the selected fragments are too close to distinguish, VNTI can calculate how long the gel
would have to run to separate them (Separation Time).
Copying fragments to the Gel Sample List and calculating separation times are described below.
Zooming In and Zooming Out
The Gel Pane Zoom buttons, which operate as in other Vector NTI windows, allow you to
enlarge or reduce the gel lane display.
Note:
Most toolbar buttons have associated tool tips that explain the button function. Hover the cursor
over the button to display the tool tip for that button.
The True-Scale View button (
) is specific to the Gel Display window: Click this button to display the gel in an approximation of true scale. When you select this display option, Vector NTI
looks up the pixel size (dot pitch) of your monitor and displays the gel based on that value.
372
Gel Display Windows Chapter 25
Separation Distance
After the Gel Pane has been enlarged several times, gray bars representing separation distances appear around each fragment. Separation Distance is the minimum distance by which
fragments must be separated in order to be distinguishable.
The separation distance is specified in the Gel Setup dialog box (Figure 25.1).
To eliminate the gray zones, click the Zoom Out button several times.
Calculating Separation Times
To calculate a separation time, select any number of fragments, at least two of whose gray bars
are touching. Click the Calculate Separation Time button (
) on the Window toolbar or
choose Analyses > Calculate Separation Time. The minimum time necessary to separate the
selected fragments is displayed. The gel running time is then set to that value.
Note:
To calculate Separation Time, at least two fragments must be selected.
Vector NTI prompts you if any one of the selected fragments would reach the end of the gel
before all selected fragments have separated.
Modifying Fragment Properties
Note:
To modify fragment properties to more easily track fragment migration, refer to the section Modifying Fragment Properties under Gel Display Window Text Pane earlier in this chapter.
Copying Gel Display Window Data
To copy information from a Gel Display window to the Clipboard or a file, use Vector NTI’s Camera feature. General directions for using this feature are described in Chapter 3. Directions specific for the Gel Display window are given here.
When the pane to be copied is activated, click on the Camera button (
). Select in the dialog
box that opens the range and destination of the copied material. The dialog box that opens from
the Gel Pane is unlike most of the other Camera dialog boxes, but is specific for the data to be
copied (Figure 25.7).
Figure 25.7 Camera dialog box specific to the gel data being copied
The copy options are described as follows:
z
Lanes: Include selected lanes.
z
Comb: Include lane numbers (above selected lanes).
z
Scale: Include scale (to the left of selected lanes).
373
Vector NTI Advance 10 User’s Manual
z
Gray Zones: Include separation thresholds (gray rectangles around fragments).
z
Borders: Include borders between lanes
z
Colors: Use fragment colors
Copied Gel Pane information is in Windows Metafile format.
Printing from Gel Display Windows
Printing from Gel Display windows is done one pane at a time. To print a pane, select it and click
the Print Active Pane button (
) on the main toolbar or choose Molecule > Print. In the
standard Print dialog box, click OK.
Further print details (Page Setup and Print Preview) are given in Chapter 3.
374
C
H A P T E R
26
REPORT GENERATION
Introduction
Vector NTI Report Generation Wizard is a convenient tool for customizing different types of
reports of DNA/RNA or protein molecule data. This chapter provides step-by-step instruction for
creating both reports and report templates using the Report Generation Wizard.
Report results are presented in a hierarchal structure, similar to the Text Pane of the Molecule
Display window. The Print Preview feature reflects the actual appearance of the generated
report to be printed. The Vector NTI Camera feature copies selected information to the Clipboard or file in text format, preserving the formatting and enabling easy data exchange with
other applications.
Two types of reports can be generated:
z
General: This report represents general molecule(s) information, such as general
description, standard fields, Vector NTI specific fields, user-defined fields, authoring
information, comments, Feature maps, restriction maps, sequence, components and
fragments and all analyses performed for selected objects.
z
Relation: The second report represents the parent/descendant relationship between
molecules as well as construction information.
Vector NTI report templates enable you to store the settings for generated reports and
retrieve them to use at a later time instead of default settings.
Starting the Report Generation Wizard
To generate a report on a molecule open the molecule in a Molecule Display Window and
choose File > Reports > <report type > on the menu bar. Two of the options initiate Report
Generation Wizard. The third allows you to work with report templates. Each of the three report
options are discussed in this chapter.
375
Vector NTI Advance 10 User’s Manual
The Report Generation Process:
Step 1: Opening the Report Generation Wizard Dialog Box
Selecting General or Relation (Reports) opens the same Report Generation Wizard dialog box,
shown in . For both types of reports, follow the outlined steps to collect the required information.
Figure 26.1 Report Generation Wizard dialog box
Use the Next > and < Back buttons at the bottom of the windows to proceed through the steps.
Cancel the process at any time by pressing the Cancel button, or at any step press the Finish
button to generate the report according to the current settings.
The first step offers two options:
z
New Report lets you create a new report using the default settings. This initializes the
options with default settings.
z
Begin a Report based on an existing template. This initializes the options with previously saved settings.
Click Next > to proceed with either a new General or Relation Report.
To generate a report from an existing template without altering any settings, click Finish after
selecting the desired template.
Step 2: Selecting General Options
In the Set General Report options window (Figure 26.2), check the informational fields with a left
click or press the space bar. Due to the hierarchical organization of the fields, if you include the
parent item, all of the descendants are automatically included. Excluding descendants automatically excludes their parent item as well. Grayed items indicate that the item’s state cannot be
changed. This notation usually indicates either mandatory fields or information that could be
included in the report, but are unavailable currently because they were not generated prior to
starting the generation wizard.
376
Report Generation Chapter 26
Note:
The more fields that are selected for the report, the longer the report generation takes.
Figure 26.2 Select General Report Options window
z
General description: This group of options consists of general information fields such
as name, molecule length, form, and molecule type and nature of the sequence. Molecule name, type and length fields are mandatory and cannot be excluded from the report
information.
z
Standard fields: Standard fields include object data found routinely with all Vector NTI
molecules and other objects. This includes for example, keywords, original source database, accession numbers, sequence source and identifiers in Vector NTI.
z
User-defined fields: Check to include all user-defined fields in the report
z
Authors: Specify the original and/or current authoring information
z
References: Enter any references associated with the molecule
z
Comments: Add any comments associated with the molecule
z
Feature map: Specify molecule Feature map information. If this field is checked, the
Wizard adds an additional step for adjusting Feature map information.
z
Restriction map (DNA/RNA): Check this item to include a restriction map in the report.
The output can be represented either as a tree (similar to the restriction map information
in the Text Pane of the molecule display window), or as a table.
z
Motifs (DNA/RNA): Check this item to include motifs in the report. The output can be
represented either as a tree (similar to the restriction map information in the Text Pane of
the molecule display window), or as a table.
z
ORF (DNA/RNA): This outlines the ORF information that is present.
z
Analysis: As analysis information is not stored in the database, these options are available only if you start the Report Generation Wizard from a Molecule Display Window.
Your report can include only those analyses that have been performed on a molecule
and are shown as available options.
377
Vector NTI Advance 10 User’s Manual
DNA/RNA molecules
Supported options are:
o
PCR analyses
o
Hybridization probes
o
Sequencing primers
o
Mutagenesis
o
Restriction fragments
Proteins
Supported options are:
z
o
Protein properties
o
Acid content
o
Sequence: Check this option to include the molecule sequence.
Construction: This option generates construction information for complex molecules,
including components and fragments of other molecules.
Click Next > to proceed to the next window. If you have not selected Feature map, you will go
directly to .
Step 3: Adjusting Feature Map Information
Figure 26.3 Set Feature Map Options dialog box
This step is necessary if you choose to include Feature map information. Select from the Set
Feature Map Options window (Figure 26.3) list the features to be separately included or
excluded from your report (according to the molecule type). All available feature types are organized into the same tree structure that is in the Display Setup Profile window.
378
Report Generation Chapter 26
Step 4: Report Preview Window
Figure 26.4 Preview dialog box
The steps for either a General or Relation report end at a Preview dialog box (Figure 26.4).
Clicking Finish at any step in the process also brings you directly to this dialog box. The results,
represented in a hierarchical structure, allow you to hide information you think unnecessary by
closing the appropriate branches.
Scroll through the Preview window with the scroll bars. ToolTips appear if you pause the cursor
over a partially visible item. Open shortcut menus on selected items to reveal commands for
expanding and collapsing folders and subfolders in various combinations.
This window lets you review the report and go Back if there is something you would like to
change, or Save the report as a Template. If you are satisfied with the report, proceed with
Print Preview or Print the report (details below) or use the Camera feature to copy the report to
the clipboard or to a file. For details about using the Camera/Copy feature, refer to Chapter 3.
Print Preview and Print
To preview results before printing, click Print Preview. Navigate though the pages using the
Next Page and Prev Page buttons. Use the Zoom buttons to enlarge or reduce the image. To
print the results, click the Print button.
379
Vector NTI Advance 10 User’s Manual
To modify something, click the Close button, returning you to the report. You can go back several steps and change the generation options, or you can expand or collapse some branches to
customize your report presentation.
Figure 26.5 Preview results before printing using the Print Preview feature
Saving Report Templates
To save the report format as a template, click the Save Template button, then enter a name and
click OK on the Save Report Template window to save it. Templates are saved separately for
report and molecule types. For example, when generating a relationship report for DNA/RNA
molecules, the Report Wizard offers you templates saved for the same type of report and molecule type.
Figure 26.6 Save Report Template window
Relation Report
The Relation report includes information on parents, construction and descendants of the molecules involved.
z
380
The parents of a molecule are the molecules that were used in its construction. The molecule itself is called the descendant.
Report Generation Chapter 26
z
Construction information, similar to the construction information presented in the Text
Pane of Molecule Display Window, can be generated either for selected molecules only,
or for selected molecules and all of their parent molecules. The latter option allows you
to see the line of inheritance between the molecules.
Select File > Reports > Relations to generate a Relation Report.
Step 1
Step 1 in a Relational report takes place exactly as explained in Step 1 on page 376. Click Next
> to proceed with a new report or Finish if you are using a Relation template.
Step 2
In Step 2 of a Relational Report, you can select the relationship information to be included in this
report. For an example, see Figure 26.7. Click Next or Finish in this window to proceed to the
Preview window, similar to Figure 26.4. At any time, click Back < to return to a previous screen.
Figure 26.7 Selecting the relationship information to be included in the report
Report Templates
To save any report that you generate as a template, click the Save Template button in the
Report Preview window (Figure 26.4). In the Save Report Template dialog box that opens, name
the new template. Click OK to save.
To use a saved report template to generate a new report, in an open Molecule Display window,
select File > Reports > <report type >. In the Select Report Type dialog box that opens, select
Report based on existing template. Select the template you wish to use and click Next > to
proceed. Then follow the steps beginning on page 376 to generate the report.
Report templates are stored separately for DNA/RNA molecules and proteins. To rename or
delete a template, select File > Reports > Templates. Use the drop-down menu at the top of
381
Vector NTI Advance 10 User’s Manual
the Templates window (Figure 26.8) to select the template type. Select the appropriate template
and click Delete to remove it or Rename to rename the selected template.
Figure 26.8 Templates window
382
C
H A P T E R
27
SHARED DATABASES
Introduction
Special databases, repositories of DNA/RNA or protein molecules, enzymes, oligonucleotides,
and gel markers, can be created and shared between several Vector NTI users on a network.
Shared databases are not a replacement for local databases; each Vector NTI application still
must have its own local database. The local database is used in all operations: construction,
design, creation of viewers etc. The local database is also the place for storing private and temporary data. The main purpose of the shared database is to store common data.
The only operations you can perform on shared databases are:
1. Copying data to/from the local database.
2. Various database management operations such as creating and deleting subsets, etc.
3. Database searches. For instance, you may copy some of your molecules and enzymes from
your local database into the shared database. In order to use them in the design process,
your colleague must copy them to his/her local database first.
In addition to biological data, each database contains information about its creator and registered users. Only the creator and registered users can have access to database data. The
database creator can also change database properties, remove registered users, and
define the password required to become a register user.
Note:
Vector NTI shared databases use portable data format and file naming conventions to
ensure that both Macintosh and Windows users of Vector NTI can access common databases. Shared databases can be located on a wide range of file servers—Vector NTI can
work using not only services native to each system, (Microsoft Network or AppleTalk) but
also various Unix (NFS or Samba) and NetWare services.
Creating a New Shared Database
Shared database capability is a purchased addition to Vector NTI Advance. When shared database capability is purchased, you are issued a Vector NTI shared database license that allows
383
Vector NTI Advance 10 User’s Manual
you to create shared databases. A shared database license is a special type of static license
that allows you to create any number of shared databases but it also limits the number of users
for each database you create. You do not need a shared database license to access shared
databases, but you should have a Vector NTI application version 3.1 or later.
Note:
Shared databases can be accessed but cannot be created from Vector NTI using a license that
is shared through a network server (Dynamic License).
Before creating a shared database, you should find a place on your network (a computer, storage volume and directory or folder) where the database will be located and accessible from the
computers of all potential users of the database. Users should be able to connect to this location
or mount the corresponding network drive and have read/write/delete permissions for all files in
a database directory and its subdirectories. Good places for shared databases are file servers
that can be “visible” as storage devices to other computers in a network. Vector NTI requires
that a separate empty directory should be created for each shared database.
When the network directory for a new shared database is arranged, click the Local/Shared
Data Exchange button (
) or choose Database > Local/Shared Data Exchange. This
opens the Connect To Shared Database dialog box (Figure 27.1) where you can perform a number of database management operations: create a new database, find the location of an existing
database, and edit database properties and user information.
Connecting to a Shared Database
Figure 27.1 Connect to Shared Database window
In the Connect to Shared Database dialog box, click the Create New Database button.
In the Create dbdef file dialog box that opens, enter a name and select the destination for the
shared database definition file (dbdef). Click Save.
384
Shared Databases Chapter 27
In the Database Properties and Users dialog box that opens (Figure 27.2), you can provide
additional information for the database users:
Figure 27.2 Database Properties and Users dialog box
z
Database Name: enter the name of the new database. This name will be displayed in all
dialog boxes and messages related to the database.
z
Password Required To Register At Login: enter in the text box a registration password that will be required to become a registered user of this database. If you decided
that the password is not necessary you can leave this field blank. If the password is not
blank, Vector NTI will ask you to confirm the password before you leave the dialog box.
z
User Information: enter appropriate user information
When you are finished press the OK button.
Vector NTI writes your data into the database definition file and creates the files and directories required to store the database data. The database you just created has no registered
users. To be registered, a user should login to the database and enter the registration password you specified in the Password Required to Register at Login box. This procedure is
described in details below.
Note:
If anything goes wrong at this stage, check the network connection and make sure that you
have “write permissions” for the chosen directory. Then, delete all files in the directory and
repeat the last step.
In the Connect To Shared Database dialog box (Figure 27.1) you will see the name and
location of the database you just created.
Finding the Location of an Existing Shared Database
If you are going to use an existing shared database you should specify the location of the database. First, make sure that you have a working network connection to this location or that the
corresponding network drive is mounted and you have read/write/delete permissions for all files
in the database directory and its subdirectories.
Note:
On some systems you can mount network drives from the standard File dialog boxes. In this
case, no separate step is required.
In the Connect To Shared Database dialog box (Figure 27.1), click the Find Database button. In
the Find dbdef file dialog box, locate the shared database definition file (dbdef). Find the database directory and click the Open button. Vector NTI tries to read the database definition file; if
385
Vector NTI Advance 10 User’s Manual
it succeeds, you will see the name and location of the database in the Connect To Shared Database dialog box.
Editing Database Properties and User Accounts
When the location of a shared database you created is specified, you can edit the database
name and registration password. The creator of the database can also remove registered users.
To edit database properties and user account information, in the Connect to Shared Database
dialog box (Figure 27.1), click the Edit Database Properties and User Accounts button, opening the Database Properties And Users dialog box where you can modify the corresponding
database information.
Saving the Connections in a Connection Profile
When the location of a shared database is specified, you can enter login information that will be
displayed to other users of a shared database. This is a good way to communicate your personal information such as name and phone number. When you are logged into a shared database, Vector NTI displays this information in addition to the login time and the information about
your computer to other database users attempting to log in. In order to return to this configuration later, you may save both database location and login information in a connection profile.
To save the connections in a connection profile, in the Connect to Shared Database dialog box
(Figure 27.1), click the Save Connection As button and enter the name of the connection in the
Save Connection As dialog box. Vector NTI stores the connection profile in the preference file;
each time you open the Connect To Shared Database dialog box you see the stored connections list near the top of the dialog box. You can select stored connections from this list. To
delete the connection from the profile, click the Remove Connection button.
Connecting to a Shared Database
When the location of a shared database is specified, to connect to the database, click the Connect button. Vector NTI reads the information about the database creator and registered users.
If you are not a creator or registered user of the database and the database limit of registered
users is not reached, Vector NTI displays a dialog box allowing you to register.
To register, choose Yes. If the user registration is protected by registration password, you will be
asked to enter the registration password in the Login Registration dialog box. If the password is
correct, Vector NTI adds you to the list of registered users of the shared database.
If you are the database creator or registered user, you have full access rights to the database
data. However, if you are not going to write to the shared database this time, you can check
Read Only box. This guarantees that the shared database contents will not be accidentally
modified.
If you are not the database creator or registered user, you can choose to connect to the database in a browse-only mode to look at the database contents.
Note:
If Vector NTI cannot access the database at this or the subsequent stages, check the network
connection and make sure that you have write permissions for the files in database directory
and its subdirectories.
Managing a Shared Database
When your connection to the selected shared database is established, Vector NTI opens a separate Database Explorer window for the shared database (Figure 27.3). This window is a close
functional equivalent of the local Database Explorer window. In this shared Database Explorer,
you can search the database, manage subsets, rename and delete objects etc. However, the
concept of Vector NTI’s shared databases prevents you from manually creating new objects in
386
Shared Databases Chapter 27
shared databases, opening Display Windows for objects stored in shared databases and editing
shared database objects in place using object editor dialogs.
Figure 27.3 Database Explorer window for the shared database
To modify a shared database object, you must copy it to your local database, modify it there and
put the modified copy back into the shared database as described in the next section.
Note:
If the original object was submitted by another user, instead of replacing it, Vector NTI creates a
separate object. This new object has the same name but a different “Submitted by” field, containing the Author Name you used to identify yourself in the Author Information dialog box.
Exchanging Data with a Shared Database
Exchanging data between your local and shared databases is simple and intuitive. Open two
Explorer windows (one for local and another for shared database), then copy data between
them using drag-drop or copy/paste operations described in the Copying Objects section. The
simplest way to start data exchange is to select Database > Local/Shared Data Exchange or
click the Local/Shared Data Exchange button (
)in the Database Explorer window. This
command allows you to choose a shared database, connects to it (as described in the previous
sections), opens the shared database Explorer window and the local Explorer window (if
needed) and then tiles two Explorer windows on your screen.
You can place your objects into a shared database without worrying about possible name conflicts with objects placed there by your colleagues. Vector NTI automatically stores the name
you used to identify yourself in the Author Information with the objects you put into a shared
database. This name is stored in the shared database in the “Submitted by” field of an object (it
can be different from both the Author and Original Author fields of the object). In addition, Vector
NTI automatically creates and maintains special subsets containing objects that were submitted
by the same users. The name alone is no longer a unique way to identify an object in the shared
database; two or more different objects can have the same name provided that they came from
different sources.
Disconnecting from a Shared Database
When you are finished exchanging data in the Shared Database Exchange dialog, click the
Close button. You will be disconnected from the shared database and the database can be
used by another user.
387
Vector NTI Advance 10 User’s Manual
388
C
H A P T E R
28
ALIGNX
Introduction
The simultaneous alignment of many nucleotide or amino acid sequences is an essential tool in
molecular biology. Multiple alignments are used to find diagnostic patterns, to characterize protein families, and to detect or demonstrate a similarity between new sequences and existing
families of sequences. They are also useful for predicting secondary and tertiary structures of
new sequences, for suggesting oligonucleotide primers for PCR and serving as an essential
prelude to molecular evolutionary analysis.
AlignX, the multiple sequence alignment application of Vector NTI Advance, is a comprehensive
program designed to conduct and manage multiple sequence alignment projects. It uses a modified Clustal W algorithm (see page 402) and incorporates the following features:
z
Profile alignment
z
Guide tree construction, displayed in graphical representation
z
Use of residue substitution matrices
z
Secondary structure consideration
z
Multicolored alignment presentation
z
Automatic consensus calculation
z
Full alignment editing capabilities
z
Dot Matrix comparison of any two sequences
Launching Align X
To launch AlignX from the Start menu, select Start > Programs > Invitrogen > Vector NTI
Suite 10 > AlignX. From Vector NTI Database Explorer, select Align > AlignX– Open New
Alignment Window or select a group of molecules then choose Align > AlignX–Align
Selected Molecules. You can also drag the selected molecules from the Database Explorer
into the AlignX workspace. From other Vector NTI applications, select the molecules to be
included in the alignment and choose Align > AlignX – Align Selected Molecules.
389
Vector NTI Advance 10 User’s Manual
Features of the AlignX Workspace
When AlignX is first opened, the display window is empty. As molecules are added to an AlignX
project, they are listed in the Text Pane. After aligning a group of molecules selected in the Text
Pane, alignment results then appear in the Graphics Pane and the Alignment Pane.
Because it will be much easier for you to understand the AlignX features in a complete display
window, open a demo project into the workspace. Select Project > Open. Find the Vector NTI
Suite folder. (The default location is Program Files\Vector NTI Suite 10\Demo Projects.) Open
the Protein.apr file, a sample alignment of 25 molecules.
The AlignX interface (Figure 28.1) consists of a menu bar, three toolbars, an AlignX Display window, with shortcut menus specific for each pane. A Dot Matrix window can be opened from the
AlignX display window when the Dot Matrix tool is launched.
Figure 28.1 AlignX interface
AlignX has three toolbars: the Main Toolbar, the Pane Selection Toolbar and a Pane Toolbar.
The Main Toolbar contains tools for major program functions, such as opening and saving
projects, adding molecules to the project, exporting molecules’ data in various formats, and creating alignments.
As you are introduced to various operations in this chapter, the toolbar buttons you will use are
displayed appropriately. Most toolbar buttons have associated tool tips that explain the button
function; hover the cursor over the button to display the tool tip for that button. Many toolbar
commands can also be launched from the menu bar or from a shortcut menu.
The AlignX Display window is divided into four panes separated by split bars: a Text Pane, a
Guide Tree Pane, a Graphics Pane, and an Alignment Pane. To apply a command from the
main menu in a given pane (i.e. Print, Print Preview, Camera), that pane must be active. The
active pane can be toggled with the Switch Panes buttons (
,
,
,
Selection Toolbar or by clicking anywhere in the pane you want to activate.
390
) in the Pane
AlignX Chapter 28
Split bars allow re-sizing of the four panes in the AlignX Display window. Scroll bars appear
when the contents of a pane exceed the viewing area, facilitating easier viewing of pane contents.
Text Pane
The Text Pane contains a thorough description of each molecule included in the alignment
project. The information is organized in folders, named by molecule. Each top level (molecule)
folder contains the following subfolders:
Folder
Contents
General description
Molecule type, form (for DNA only), length, etc.
Proprietary fields
User defined fields (for molecules which came from Vector NTI)
Standard fields
GenBank/SWISS-PROT-like fields: keywords, division, original accession numbers, etc.
Comments
Arbitrary text of any length associated with the molecule
References
Bibliographic references (in GenBank/SWISS-PROT format)
Analysis (Protein Molecules only)
Results of common physiochemical analyses
Feature Map
List of molecule features and their positions on the molecule
Table 28.1 AlignX Text Pane folders
Folders and sub-folders can be opened with a double-click or by clicking on the + to the left of
the folder name.
Refer to Chapter 3 for more information regarding the following Text Pane manipulations:
z
Expanding and collapsing folders
z
Shortcut menus
z
Copying pane contents to the clipboard
Finding Features on Graphical and Alignment Panes
Features listed in the Feature Map subfolder in the Text Pane can be highlighted on molecule
graphics and/or sequences in the Graphics and Alignment Panes (only for those molecules that
are part of the current assembly). To visualize the positions of a signal in these panes, select the
feature in the Text Pane folder, then click the Find button (
) on the Text Pane toolbar or
select Edit > Find Feature on the menu bar. The Find command is disabled if selected line is
not a signal with non-zero boundaries.
Marking Features in the Alignment Pane
Features listed in the Feature Map subfolder in the Text Pane can be marked graphically in the
Alignment Pane (for those molecules that are part of the current alignment).
To mark a particular feature in the Alignment Pane, right-click on the feature of interest in the
Text Pane folder and choose Show Feature on Alignment Pane from the shortcut menu. A
391
Vector NTI Advance 10 User’s Manual
graphic depiction of the feature displays below the molecule sequence where the feature occurs
(Figure 28.2):
Figure 28.2 Feature displayed graphically in the Alignment Pane
To mark all the features listed in the Feature Map subfolder for a particular molecule, right-click
on the molecule of interest in the Text Pane and choose Show all Features for <selected molecule name> from the shortcut menu. All the features listed in the Feature Map subfolder of the
molecule display graphically in the Alignment Pane under the molecule sequence.
To hide a feature or all features for a molecule displayed in the Alignment Pane, right-click on
the feature or molecule, respectively, in the Text Pane, as described above, and choose the corresponding Hide command (Hide Feature on Alignment Pane or Hide all Features for
<selected molecule name>, respectively) from the shortcut menu.
Other Feature-Related Commands
Various other feature-related commands are available on shortcut menus launched from the
Alignment Pane. For more information on these commands, see Displaying Molecule Features
in the Alignment Pane, page 396.
Guide Tree Pane
Phylogenetic analysis is the means of studying presumed evolutionary relationships. An inferred
evolutionary history is displayed in a treelike diagram suggesting the inherited relationships
between the molecules.
A guide tree, which resembles a Phylogenetic tree, in Vector NTI Advance is built using the
Neighbor Joining method (NJ) of Saitou and Nei. The NJ method works on a matrix of distances
between all pairs of sequence to be analyzed. These distances are related to the degree of
divergence between the sequences. The guide tree is calculated after the sequences are
aligned. AlignX displays the calculated distance values in parenthesis following the molecule
name in the Guide Tree Pane.
If there are more than 3 sequences in an alignment, a guide tree is shown in the Guide Tree
Pane. To activate this pane, click the Guide Tree button (
) on the Pane Selection Toolbar.
Scrollbars in the Guide Tree Pane enable you to view the entire tree.
Exporting a Guide Tree
To export the guide tree into a .ph file for use with other applications, click the Export Tree (
)
button on the Guide Tree Pane Toolbar or choose View > Export Guide Tree on the menu bar
or select Export Guide Tree from the shortcut menu. Select or enter the file name to export to in
the File Save dialog and click Save.
Interconnection with Other Panes
Any molecule selected in the Guide Tree Pane is selected concurrently in the Alignment Pane.
392
AlignX Chapter 28
Graphics Pane
To activate the Graphics Pane, click on the Graphic Pane button (
) on the Pane Selection
Toolbar. The graphical representation of an alignment contains three graphs in the Graphics
Pane. Graphs are divided by horizontal split bars that can be moved to change the height of the
display area.
Descriptions of the Graphs
z
Alignment Similarity (upper graph): Specific values (in a 0-1 range) are assigned to
each residue at a given alignment position in each aligned sequence, depending on
whether the residue is identical, similar or weakly similar to the corresponding residue of
the consensus sequence. The values (1 (identical), 0.5 (similar), and 0.2 (weakly similar)
for each residue at a given position are totaled; the sum is divided by the number of the
sequences in the alignment, “normalizing” the resulting value.
z
Absolute Complexity profile of the Multiple Alignment (center graph): This graph is calculated as a sum of all pairwise residue substitution scores at a given alignment position
divided by the number of pairs in the alignment. The scores are taken from the residue
substitution matrix used for alignment calculation.
z
Absolute Complexity profile of the Pairwise Alignment for the molecule selected in the
Guide Tree/Alignment Pane relative to the consensus sequence (lower graph): This
graph is calculated in a manner identical to the one in the second graph. Selection of a
molecule in any pane results in the calculation of this graph. This graph is the only one
that changes according to which molecule is selected.
All graphs display the values averaged in a window of a specific length (defined by “window”
parameter) that slides along the alignment.
You can add additional analyses to the graphics pane by activating the Graphics Pane and
choosing View > List of Analyses from the drop down menu to open the Analysis List setup
dialog box (Figure 28.3):
Figure 28.3 DNA/RNA Analysis List Setup dialog box
The dialog box lists all of the analyses available for DNA or Protein, depending on the type of
aligned molecules. Currently displayed analyses are listed in the Selected Analyses box. To add
an analysis, select it in the Available Analyses list box and click the Add Analysis button (
393
)
Vector NTI Advance 10 User’s Manual
to move it to the Selected Analyses list. Alternately, you can move an analysis to the lower list
by double clicking on it.
The plot display order is determined by the order the analyses are listed in the Analysis List
setup box. To modify the order, select an analysis and move it up by clicking the Move Up button (
). Click OK to close the Analysis list setup dialog box and generate the new analyses.
Adding Custom Protein Analyses
Specific values are used in the calculation of the various protein analyses. These values differ
depending on the particular analysis and are stored in small text files having a .pa2 extension.
All .pa2 analysis files are stored in the Analyses subdirectory in the Vector NTI Suite directory.
The name of the analysis corresponds with the name of the .pa2 file.
For example, the Bulkiness analysis is characterized in the Bulkiness.pa2 file as follows:
[general]
author=Zimmerman J.M., Eliezer N., Simha R.
comment=Last modified 15/Mar/1996 by ELG
reference=J. Theor. Biol. 21:170-201(1968).
unique=s30
[data]
values=11.5,14.28,12.82,11.68,13.46,14.45,13.57,3.4,13.69,21.4,21.4,15.71,16.25,19.8,
17.43,9.47,15.77,21.67,18.03,21.57
The [general] section describes the attributes of the analysis and the [data] section contains the
list of values used for calculating the analysis. Values are listed according to the alphabetical
order of the acid coefficients.
You can create your own custom protein analysis by modifying the values in one of the existing
.pa2 files using a plain text editor, such as Notepad. Once modified, the new .pa2 file should be
saved in the Analyses subdirectory under a new name that corresponds to the new analysis
type. If AlignX is open at the time the new .pa2 file is created, it must be closed and reopened
before the new analysis is recognized.
Plot Setup
To modify a particular graph in the Graphics Pane, right click on the graph you want to change
and choose Plot Setup from the shortcut menu.
Figure 28.4 Analysis tab of Plot Setup dialog box
394
AlignX Chapter 28
On the Analysis tab of the Plot Setup dialog box (Figure 28.4), you can set the Window size,
that is the number of sequential residues used to calculate the average for each graph point.
The larger the number entered (Window size), the smoother the graph curve.
Figure 28.5 Datagram tab of the Plot Setup dialog box
On the Datagram tab of the Plot Setup dialog box (Figure 28.5), you can modify the plot color.
Both the size of the window and plot color you select are specific for the selected graph in the
current project. You can also change the graph style and choose to show or hide the horizontal
axis for that graph here. These settings are stored within the project file and applied to graph
next time you load the project.
Zooming Graphs In and Out
Enlarging or reducing regions of alignment graphs is possible using the Zoom buttons. For
descriptions of their use, refer to Chapter 3.
Managing the Scales of the Graphs
Each graph has its own vertical and horizontal scales. Vertical scales are similar for each graph
and show the maximum and minimum values for the graph. On the horizontal scale, either
numerical positions in the sequence or residues can be shown, depending on the degree of
zooming in the graphics pane. If you would like to see the residue designations, zoom in on the
graphics pane. The vertical and horizontal scales can be further managed as follows:
z
As mentioned above, the horizontal axis can be shown or hidden for a particular graph
by checking or unchecking the Show individual axis box on the Datagram tab of the Plot
Setup dialog box.
z
The Show Vertical Axis command is used to show or hide the vertical axis for all the
graphs. This command can be accessed from a button on the tool bar or the shortcut
menu launched by right clicking on the Graphics pane.
Graph legends can be removed from the pane by unselecting the Show Legends button
from the Pane Toolbar or by unchecking the Show Legend command from the shortcut
menu or the View menu. The Place Legends Below Plots command is used to toggle the
graph legends display from the right side of the graphs to below the graphs. The Place Legends Below Plots command can be accessed either from the shortcut menu or from a button on the toolbar.
If no items are checked, the graphs are shown without annotation.
395
Vector NTI Advance 10 User’s Manual
Interconnection with Alignment Pane
Selections within the Graphics Pane are concurrently selected in the Alignment Pane. In general, regions can be selected using the click + drag technique. Detailed selection techniques are
discussed in Chapter 3.
Alignment Pane
To activate the Alignment Pane, click on the Alignment Pane button (
tion Toolbar.
) on the Pane Selec-
The Alignment Pane displays aligned sequences and the resulting consensus sequence. Consensus residues are those that appear most commonly at a particular site. The Alignment Pane
has its own vertical and horizontal scrollbars. The last row in the pane consists of the alignment
consensus.
Vertical scrolling affects both the aligned sequences and their names, but the consensus
sequence is not included in the scroll region: it remains visible as the bottom sequence. The
sequence names remain stationary at the left of the Alignment Pane no matter how the
sequences are repositioned horizontally. If the list of molecules listed in the Alignment Pane is
longer than the size of the pane, a vertical scroll bar appears as well. Vertical scrolling affects
both sequences and their names but the consensus sequence remains visible at the bottom of
the pane.
AlignX shows similarity and identity levels for the generated alignment in the Alignment Pane.
The Status bar displays the percent of similar and identical residues for entire alignment or for a
selected region on the alignment. When the mouse cursor is pointed to any particular column
within alignment, a popup label shows the percent of similar and identical residues within an
alignment column. The popup label option is disabled if only two sequences are aligned.
Interconnection with Other Panes
When a molecule is selected in the Alignment Pane, it is selected in the Guide Tree Pane as
well. A guide tree is not calculated when there are three or less sequences in the alignment.
A selected region within the Alignment Pane is also selected concurrently in the Graphics Pane.
Displaying Molecule Features in the Alignment Pane
Features listed in the Feature Map subfolder in the Text Pane can be marked graphically in the
Alignment Pane (for those molecules that are part of the current alignment) using commands
executed from the Text Pane (see Text Pane, page 391). Once features have been marked in
this way, a number of feature related commands are enabled on the Alignment Pane right-click
shortcut menus as follows:
Graphical Feature Shortcut Menu Options
The following commands are available on the shortcut menu launched by right-clicking on a
graphical feature shown in the Alignment Pane.
396
AlignX Chapter 28
<feature name (position)> – launches the Feature Type Color Scheme dialog box where you
can change the color scheme for the selected feature type or any other feature type (Figure
28.6):
Figure 28.6 Feature Type Color Scheme dialog box
Select the feature type you want to change the color of on the left side of the dialog box and
choose the new color from the color drop-down box for that feature on the right side of the dialog
box.
z
Hide <feature name> – removes the feature graphic from the alignment display.
z
Copy to Consensus <feature name> – copies the feature graphic to the consensus
sequence display.
z
Move to New Line – moves to a new line a graphical feature that occurs on the same
line as another graphical feature.
The following commands are available on the shortcut menu launched by right-clicking on a
graphical feature shown in the Alignment Pane for the Consensus sequence ONLY:
z
Delete from the Consensus <feature name> – deletes the selected graphical feature
from the Consensus sequence display.
z
Edit <feature name> – allows you to change the name of the selected Consensus
sequence graphical feature.
Alignment Pane Shortcut Menu Options
The following commands are available on the shortcut menu launched by right-clicking anywhere in the Alignment Pane:
z
Delete Selected Features – deletes the currently selected graphical feature from the
alignment display.
z
Feature Type Color Scheme – launches the Feature Type Color Scheme dialog box
(Figure 28.6) where you can change the color display for feature types.
z
Create Feature – allows you to create a graphical feature for the consensus sequence.
The portion of the consensus sequence you want to mark must be highlighted before the
Create Feature command is enabled.
397
Vector NTI Advance 10 User’s Manual
Finding Sequences in the Alignment Pane
You can perform sequence searches on molecules in the Alignment Pane using the AlignX Find
Sequence feature. To open the Find Sequence dialog box (Figure 28.7), right-click on the Alignment Pane and choose Find Sequence from the shortcut menu.
Figure 28.7 Find Sequence dialog box
Select the molecule you want to search by highlighting its name on the left side of the Alignment
Pane. Type the sequence you want to search for in the Find Sequence text box. Set the search
parameters to achieve the desired search direction and looping status:
z
Forward – Searches forward from the cursor or highlighted area of the selected molecule, stopping at each point where the entered sequence string is found. Once the
selected sequence has been searched to its end, the search continues with the next
molecule down the list. This process continues until the last molecule in the list, the Consensus, has been searched.
z
Backward – Searches backward from the cursor or highlighted area of the selected molecule, stopping at each point where the entered sequence string is found. Once the
selected sequence has been searched to its beginning, the search continues with the
next molecule up the list. This process continues until the first molecule in the list has
been searched.
z
Loop Search – When a selection is made on a sequence in the Alignment Pane, the
search begins at the selection. The Loop Search option loops the search back to the
beginning of the selection.
Once you have set the search conditions appropriately, click the Find button to begin the
search.
Copying the Reverse/Reverse Complement of a Molecule
Although you can copy to the Clipboard the reverse sequence (Protein) or reverse complement
(DNA/RNA) of a molecule (or selected portion of a molecule) in Vector NTI and ContigExpress,
this feature is not available in AlignX.
Note:
You can use the Reverse Complement feature employed in Vector NTI (Chapter 19) and ContigExpress (Chapter 30) with a molecule, and then subsequently add that molecule to an open
AlignX project.
From AlignX, save the desired molecule to the database by selecting File > Save As (possible
file extensions are “.txt”, “.gb”, “.gp”). Then open the molecule in Vector NTI or ContigExpress
and follow the directions for making the reverse complement of the molecule as described in
Making the Reverse Complement of a DNA Molecule, page 244 or Making a Reverse Complement, page 454.) Save the reverse copy/reverse complement of the molecule.
Once the reverse copy/reverse complement is saved, add it to an active AlignX project by
selecting Project > Add Files (described on page 401 in this chapter). Locate the newly created
reverse copy/reverse complement file and click Open, adding the reverse copy/reverse complement to the project.
398
AlignX Chapter 28
Changing Molecule Order in Alignment Pane
There is one way to reorder the molecules in the Alignment Pane. Changes are retained in the
AlignX project upon saving.
Moving Individual Molecules
To move individual molecules, click the molecule name in the Alignment Pane list and drag it to
the desired position in the list.
Alignment Display Setup
To change a default set of alignment display parameters, click the Alignment Display Setup
(
) button on the Alignment Pane toolbar or choose View > Display Setup from the menu
bar or Display Setup from the shortcut menu. The Alignment Display Setup dialog box opens
with three alignment property tabs: Consensus Calculation, Similarity Tables, and Color Setup.
Consensus Calculation Tab
A consensus sequence is a theoretical representative nucleotide sequence in which each nucleotide represents either the residue seen most frequently at that same site in aligned sequences,
or is selected by other criteria. The Consensus Calculation tab specifies how the consensus
sequence, displayed as the bottom sequence in the Alignment Pane, is calculated in AlignX.
Figure 28.8 Consensus Calculation tab of Alignment Display Setup dialog box
On the Consensus Calculation tab (Figure 28.8), you can select among the following parameters:
z
Consider only identical residues…
z
Ignore gaps in the consensus calculation
z
Specify a sequence to use as the consensus sequence. In this case, select one of the
sequences listed (those used in the alignment).
z
Residue fraction for consensus
If the Use sequence as consensus checkbox is checked, the Consensus will not be calculated but the sequence selected in the listbox below the checkbox will be used as the consensus.
399
Vector NTI Advance 10 User’s Manual
Similarity Tables Tab
The Similarity Table (Figure 28.9) allows you to review or to define residue similarity information
and values necessary for calculation of the alignment quality profile. Each residue pair can be
defined as being strongly or weakly similar to each other. The table is editable only for amino
acid residues.
Figure 28.9 Similarity Tables tab of Alignment Display Setup dialog box
Color Setup Tab
Residues in an alignment are colored according to the following scheme:
Color
Description
black on window
default color
non-similar residues
blue on cyan
consensus residue derived from a block of similar residues at a given position
black on green
consensus residue derived from the occurrence of greater than 50% of a single
residue at a given position
red on yellow
consensus residue derived from a completely conserved residue at a given position
green on window
default color
residue weakly similar to consensus residue at given position
Table 28.2 Alignment default color scheme descriptions
400
AlignX Chapter 28
To modify alignment display colors, in the Alignment Display Setup dialog box, select the Color
Setup tab (Figure 28.10).
Figure 28.10 Color Setup tab of Alignment Display Setup dialog box
Change the colors for the specific project using the drop-down menus, observing the modifications in the preview box. Click OK to save color changes in the alignment project. They will be
applied to the alignment next time you open the project.
After any changes are saved, consensus and colors for residues in the Alignment Pane are
recalculated as well as values for all the three graphs in the Graphics Pane, and both panes are
redrawn.
AlignX Projects
Creating a New Project
When AlignX is launched, a new, empty alignment workspace is created. To create a new alignment project while in the AlignX display window, select Project > New on the menu bar. If you
have any unsaved changes in an existing, and currently open project, AlignX suggests changes
should be saved.
In the dialog box that opens, select Yes to save changes, No to disregard changes or Cancel to
discard changes and continue work on the opened project. In the first two cases, the current
project will be closed and the workspace emptied.
Opening An Existing Project
To open an existing project, choose Project > Open on the menu bar or click the Open Project
button (
) on the Main Toolbar. In the Open dialog box, select the desired file and click Open.
By default, alignment projects have an “.apr” file extension. If the file is an alignment project,
information about molecules, properties and alignments (if any) appears in appropriate panes.
Another way to open an existing project is to drag and drop the project file on the AlignX workspace.
Adding Molecules to the Project
Molecules for a new (or existing) project can be added to AlignX in these ways:
z
In the Vector NTI Database Explorer, in either a DNA/RNA subset or a protein subset,
select a list of molecules, and drag them into the Text Pane of the empty AlignX workspace. Molecules can be dropped in the AlignX workspace to be added to the project if
they are of an appropriate file format and molecule type.
401
Vector NTI Advance 10 User’s Manual
z
Select Project > Add files on the AlignX menu bar or click the Add Files button (
)
on the Main Toolbar. Choose the appropriate file of molecules from the Add files to
project dialog box, and click Open.
AlignX reads various file formats: GenBank and EMBL for DNA, GenPept and SWISSPROT for proteins, FASTA and Vector NTI archives for both DNA and proteins. The first
added molecule determines the molecule type. If you try to add molecules of a different type
later, a warning message appears and the inappropriate molecule is not added. If a molecule’s type correlates with the current project, the molecule(s) are added to the project and
appear in the Text Pane.
If the program fails to define a file’s format, the file can be imported as a raw sequence. If there
are no molecules in the project, the molecule’s type must be selected before it is possible to
import the file (Figure 28.11). If the project is not empty, the molecule type is already defined and
the raw sequence can be imported only if its file type matches the current project.
Figure 28.11 Importing a raw sequence
Imported raw sequences appear in the Text Pane with the names such as NONAME, and NONAME#2. Select Rename Molecule from the shortcut menu to rename the molecule.
Even after molecules are brought in the AlignX workspace, three of the panes are empty until
the alignment is created.
Alignment Import in MSF Format
In addition to its own projects, AlignX can open alignments of the MSF format. To open an MSF
project, choose Project > Import MSF Format from the menu bar. In the Import MSF Format
dialog box, select the MSF project to be opened. By default, MSF projects have an .msf extension, but are not limited to it. AlignX tries to recognize the MSF format itself, not simply by its file
extension. You can also open an MSF project by dragging the file and dropping it within the
AlignX window. An MSF project imported into a new AlignX project is initially named untitled.
Select Rename Molecule from the shortcut menu to rename the molecule.
The information contained within an MSF project is molecule type, name, length and sequence.
For this reason, Text Pane folders of MSF-format molecules contain no information about creation and modification date, author, original access number, references, and feature tables.
Work is done with an MSF project just like any other AlignX project.
Initiating an Alignment
There are two ways to initiate alignments. In the Text Pane, select the sequences to be included
in the alignment, then proceed with either a multiple alignment, or a profile alignment.
Multiple Alignment
In a multiple sequence alignment in AlignX, all sequences included in the alignment are “equally
important.” AlignX uses a modified Clustal W algorithm in which pairwise alignments are performed between sequences and the alignment tree proceeds using the particular scoring matrix
designated by the user in Alignment Setup (see page 407), whereas in the traditional Clustal W,
402
AlignX Chapter 28
the algorithm chooses the scoring matrix or series of matrices as the alignment progresses.
(See page 661 for alignment algorithm references.)
To initiate a multiple alignment, click the Align button (
) on the Main Toolbar or select Align
> Align Selected Sequences from the menu bar. This function is enabled only if more than one
molecule is selected in the Text Pane.
Profile Alignment
A profile alignment in AlignX is based on aligning all selected sequences against a reference
sequence. This is based on the Clustal W algorithm. To initiate a profile alignment, click the
Align Using Profile button (
) on the Main Toolbar or choose Align > Align Selected Using
Profile on the menu bar. In the Select Profile dialog box (Figure 28.12) that opens, select the
molecule to be used as the first profile.
Figure 28.12 Select Profile dialog box
This function is available only if more than 1 molecule is selected in the text view.
Adding a Molecule to an Alignment
To add a molecule to the alignment, select the molecule in the Text Pane or drag it in from Database Explorer. Click the Add to Alignment button (
) or choose Align > Add Selected To
Alignment. A profile alignment using an existing alignment as the first profile will be performed.
This function is available when an alignment already exists and at least one molecule that does
not belong to alignment is selected in the Text Pane.
Realigning a Selected Area of an Alignment
To realign the selected portion of an alignment, in the Alignment Pane, select the region of the
alignment you want to realign by clicking and dragging over the area of interest. Right-click in
the Alignment Pane and choose Realign Selected Area from the shortcut menu. AlignX
realigns the selected area; the unselected regions of the alignment retain their original alignment.
Removing a Molecule from the Project
To delete a selected molecule from the project, click the Delete from Project button (
) from
the Text Pane toolbar, choose Edit > Delete <molecule name> From Project on the menu bar
or Delete <molecule name> From Project from the shortcut menu. If you confirm this operation, the specified molecule will be deleted from the project. If the molecule is removed from the
alignment, the guide tree, consensus and graphs are recalculated and refreshed.
Setting Alignment Parameters
The first molecule added to an alignment defines the molecule type of the alignment (DNA or
protein). When initiated, a default set of alignment options is created for the defined molecule
403
Vector NTI Advance 10 User’s Manual
type. To change these options, click the Alignment Setup button (
) on the Main Toolbar or
choose Align > Alignment Setup. The Alignment Parameters dialog box opens with five possible property tabs: Pairwise Alignment, Multiple Alignment, Protein Profile Alignment, Tree Construction Options and Score Matrix (Figure 28.13).
Pairwise Alignment
The method for calculating pairwise distances is defined on the Pairwise Alignment tab.
Figure 28.13 Alignment Setup dialog box, with Pairwise Alignment tab displayed
Pairwise alignment parameters control the speed/sensitivity of the initial alignments:
z
Fast (approximate) method
z
Slow (more accurate) method uses two gap penalties (for opening or extending gaps)
and a full amino acid weight matrix.
By default, the slower method is used. There are two groups of parameters enabled on this
pairwise tab depending upon which method is chosen.
Note:
Default settings are in parentheses: first number = DNA; second number = protein
Pairwise Alignment Parameters
Slow Options
Gap opening penalty (15/
10)
The penalty for the first residue in a gap
Gap extension penalty
(6.66/0.1)
The penalty for additional residues in a gap
Fast Options
Number of K-tuple
matches (2/1)
Change the K-tuple value to limit the word-length the search should use.
A word-length of 2 is sensitive enough for most protein database
searches. The general rule is that the larger the word length, the less
sensitive, but faster the search will be.
Number of best diagonals
(4/5)
Number of the k-tuple matches on each diagonal used in the alignment
Window size (4/5)
The number of diagonals around each of the best diagonals used
Gap penalty (5/3)
Penalty for the existence of a gap
Table 28.3 Pairwise Alignment parameters
404
AlignX Chapter 28
Multiple Alignment
These parameters control the final multiple alignment (Figure 28.14).
Figure 28.14 Multiple Alignment tab of Alignment Setup dialog box
Note:
Default settings are in parentheses: first number = DNA; second number = protein
Multiple Alignment Parameters
Gap opening penalty (15/
10)
The penalty for the first residue in a gap
Gap extension penalty
(6.66/0.05)
The penalty for additional residues in a gap
Gap separation penalty
range (8)
Tries to decrease the distances between gaps
Use end gap separation
penalty
Does not penalize for gaps introduced at the end of a sequence
% identity for alignment
delay (40)
Delays the alignment of the most divergent sequences; that is,
sequences that are less identical than the percentage shown will be
introduced into the alignment later.
Use residue-specific gaps
Amino acid-specific penalties that increase or reduce penalties at each
position in the aligned sequence
Use hydrophilic residue gap
Increases the chance of a gap within a region of hydrophilic residues (if
yes, specify in the following text box)
Transition weighing
(For DNA only) Gives translations (A<- > G or C<- > T) a specific weight.
(0) means the transition is treated as a mismatch while 1 gives the transition a match score (0)
Table 28.4 Multiple Alignment parameters
405
Vector NTI Advance 10 User’s Manual
Protein Profile Alignment
This dialog box allows you to raise penalties for opening gaps in secondary structure (protein)
regions (Figure 28.15).
Figure 28.15 Protein Profile tab of Alignment Setup dialog box
Note:
Default settings are in parentheses.
Profile Alignment Parameters
Use secondary structure in first/second profile (yes or no)
[If no in either profile, all other parameters are disabled]
Determines if the secondary structure information is to be
used in the indicated profile
Gap penalty for helix core residue (4)
For helix core residues breaking
Gap penalty for strand core residue
(4)
Gap penalty for structure termini (2)
For introducing gaps at the end of a secondary structure
Gap penalty for loop regions (1)
Raises the penalty for introducing gaps in a loop (By default
this penalty is not raised.)
Number of residues inside/outside a
helix/strand to be treated as terminal
Inside helix (3)
Outside helix (0)
Inside strand (1)
Outside strand (1)
Specifies the range of residues inside or outside a helix or
strand beyond the structure
Table 28.5 Profile Alignment parameters
Guide Tree Construction Options
A guide tree is calculated from the alignment using the Neighbor Joining (NJ) method. On the
Tree tab (Figure 28.16), two parameters may be changed for tree construction (neither of these
are set initially):
406
AlignX Chapter 28
Tree Construction Parameters
Use Kimura’s
correction
Corrects for the fact that observed distances underestimate the
actual evolutionary distance. For small divergence, this option
makes no difference. For greater divergence ( > 10%), substitutions can occur multiple times at different sites. (Kimura,
1983)
Ignore positions
with gaps
When checked, any alignment positions where the sequences
have gaps will be ignored.
Table 28.6 Construction parameters
Figure 28.16 Tree tab of Alignment Setup dialog box
Score Matrix
The Score Matrix tab (Figure 28.17) displays the matrix used to generate the current multiple
alignment. From this tab, you can also open other matrices for review or for application to the
alignment.
When a project is created, a residue substitution matrix from the corresponding template (DNA
or protein) is used. If either template file is not found, the default matrix is used (swgapdnamt for
DNA and blosum62mt2 for protein). To review other matrices for either DNA or proteins, click
407
Vector NTI Advance 10 User’s Manual
the Select Matrix button. From the Matrices file, select any other matrix to be loaded on the
Score Matrix tab.
Figure 28.17 Score Matrix tab of Alignment Setup dialog box
Editing a matrix takes place in the Matrix Editor, accessible from the program files where you
installed Vector NTI Advance. For further details regarding customizing or editing matrices, refer
to Chapter 39.
Editing the Alignment
To edit an alignment, click the Edit Alignment button (
) on the Alignment Pane toolbar, or
choose View > Edit Alignment from the menu bar or Edit Alignment from the shortcut menu.
This opens the Edit Alignment dialog box containing rows of molecule names and sequences
(Figure 28.18).
Figure 28.18 Edit Alignment dialog box
Note:
You can resize the Edit Alignment dialog box by clicking and dragging on the lower right corner.
To edit the alignment, select the desired region in the sequence by LEFT-CLICK + DRAG through
the sequence in the appropriate direction with the mouse or double-click with the left mouse button within the sequence, selecting the entire region between two gaps. The current selection, as
well as its position in the sequence, is shown in the status bar of the dialog box.
Editing can only occur by shifting selected sequences into adjacent gaps. Therefore, the four
arrow buttons allowing movement of the selected block are enabled only when there is a gap to
the left or right of the selected region. To shift the block, in the Move Selected Block area, designate the number of positions to move in the text box and press one or more of the following
arrow buttons:
408
AlignX Chapter 28
- to the beginning of the adjacent gap interval in the left direction
- moves the number of positions designated to the left
- moves the number of positions designated to the right
- to the end of the adjacent gap interval in the right direction
Click the OK button to save any changes and close the Alignment Edit dialog box. Click the
Apply button to save any changes and leave the dialog box open. This button is enabled only
when there are differences between the alignment shown in the Alignment Pane and the edited
alignment. The Cancel button discards all the changes made since the last use of Apply.
Templates
Template files contain all the Alignment Setup, the Plot Setup, or the Alignment Display Setup
properties for the AlignX program. When an alignment project is being created, AlignX locates
the default template file (default.xp1 for protein and default.xn1 for DNA) in the main Vector NTI
directory. If the file exists, the properties from it apply to the project. If the file is not found,
default predefined values from AlignX itself are used.
(To change the default files, a new default.xp1 or default.xn1 file must be created and placed in
the top level of the database directory, not the main Vector NTI program directory. Alternatively,
additional template files can be retained and reloaded from any directory or path.)
You can save current settings of the alignment project in a template file or apply settings from an
existing template to an open project. To save settings as a template, choose Edit > Setup >
Save to File and select the destination for the settings (or type the name of the new template
file). Default extension for template files is “xp1” for proteins and “xn1” for DNA. To apply settings from an existing template to the open project, choose Edit > Setup > Load from File and
select the template file. Settings affecting the plot presentation (Plot Setup) or the alignment presentation (Alignment Display Setup) take effect immediately. The alignment properties (Alignment Setup) take effect only after the alignment is recalculated. To do this, select and realign the
same molecules from the Text Pane.
Identity Table Analysis
The Identity Table analysis shows identity, similarity, and/or distance values for all possible
sequence pairs for the sequences that are included in the alignment.
409
Vector NTI Advance 10 User’s Manual
To open the Table, choose Align > Show Identity Table from the menu. An window opens like
the one in Figure 28.19:
Figure 28.19 Similarity Table window
There are two (three for proteins) different pairwise comparison analyses accessible via the buttons on the top of the window.
z
Click the top Identity button (
) to show identity scores between sequence pairs. This
is the percentage of identical residues among all ungapped positions between the pairs.
z
Click the top Conserved button (
) (proteins only) to show similarity values between
the sequence pairs. This is the percentage of identical + similar amino acids among all
ungapped positions between the pairs.
z
Click the top Distance button (
between sequence pairs.
) to show distance scores (e.g., 100 – identity score)
You can also use the Print Table button to print the table or the Camera/Copy Table to Clipboard button to copy the table to the Clipboard so that it can be pasted into another application,
such as Word or Excel.
Dot Matrix Analysis
The Dot Matrix analysis is primarily a method for comparing two sequences to find all possible
matches of residues. This method can also be used to find direct or inverted repeats in protein
and DNA sequences. It can predict regions in RNA that are self-complementary and therefore
might form a double-stranded region or secondary structure.
In the Dot Matrix method of sequence comparison, one sequence (A) is listed on the x-axis of
the graph and the other sequence (B) is listed on the y-axis. Starting with the first positions in A
and B, the program slides the window of n characters along the sequences, performing a comparison of adjacent positions in the windows. If the similarity of residues in each position is
above a certain cutoff, a dot is placed in the matrix in the position defined by the starting positions of the window for both sequences. A diagonal line segment indicates that the two
sequences match consistently over an extended region.
A larger window size is generally used for DNA sequences than protein sequences since the
number of random matches is much greater for DNA.
Note:
410
The window size and matching stringency for the Dot Matrix analysis are set in the Dot Matrix
Setup dialog box (see Dot Matrix Setup, page 412).
AlignX Chapter 28
Launching the Dot Matrix
To perform a Dot Matrix analysis, open a Dot Matrix window by clicking the Dot Matrix button
(
) or by choosing Align > Show Dot Matrix Plot. Initially, the Dot Matrix window (Figure
28.20) is empty.
All molecules present in the AlignX window Text Pane are available in both drop-down menus at
the top of the empty screen (Figure 28.20). To calculate a Dot Matrix for a pair of molecules,
select the molecules in the two drop-down boxes in the Dot Matrix window. A new Dot Matrix is
calculated any time a new selection is made in either drop-down menu (the second should not
be empty).
Figure 28.20 Dot Matrix window drop-down menus
The Dot Matrix window contains a menu bar, Main Toolbar, molecule selection toolbars, status
bar, and Dot Matrix Pane. Most toolbar buttons have associated tool tips that explain the button
function; hover the cursor over the button to display the tool tip for that button. Toolbar buttons
are described in this section as needed.
Dot Matrix Window
The Dot Matrix Window is represented in the following example (Figure 28.21):
Figure 28.21 Dot Matrix Window
The graphical representation of a Dot Matrix is a dashed rectangle in which any region of similar
sequence is revealed by a diagonal row of dots. The molecule selected first corresponds to the
horizontal axis, its name being shown in the right top corner of the Dot Matrix rectangle. The
second molecule corresponds to the vertical axis. Each axis has its own scale that initially displays the sequence positions. When changing the scales (resizing Dot Matrix Window or zooming Dot Matrix Pane) it is possible to show residues along the axes. Residues are displayed only
if they can be displayed on both axes. When the scales allow displaying of residues, a grid can
be laid upon the Dot Matrix. To apply (or revoke) a grid, click the Show Grid (
) button or
choose the Grid on Zoomed Matrix command from the shortcut menu or the View menu.
411
Vector NTI Advance 10 User’s Manual
There are two modes in displaying a Dot Matrix, alternated by clicking the Maintain Isotropic
Scaling button (
) or selecting View > Maintain Isotropic Scaling:
Equal scales are used for both axes, meaning the diagonal rows of dots always have a 45°
angle relative to the axes.
Various scales for axes, that means that Dot Matrix always occupies maximum space in the Dot
Matrix Pane.
The scales for X & Y-axes change dynamically when you resize the Dot Matrix Window. Also,
the boundaries of regions currently displayed are shown for both molecules.
Resizing the Dot Matrix
When the Dot Matrix is first calculated, it is shown as a representation of the full length of a molecule. Generally it is impossible to analyze molecules of several thousand residues each when
displayed in a 500 x 500 (approximate) screen matrix. To alleviate this problem, a region of a
Dot Matrix may be enlarged: click and hold the left mouse button within the Dot Matrix rectangle
while dragging the mouse, displaying the tracking dotted rectangle. When the mouse button is
released, the selected region is enlarged to the entire Dot Matrix rectangle. The previous state is
saved in the history list. Click the Undo Zoom (
ing the view of the selected region.
) and Redo Zoom (
) buttons for modify-
Dot Matrix Setup
The window size and stringency (minimum number of matches) for the Dot Matrix analysis is set
in the Dot Matrix Setup dialog box. Open the Dot Matrix setup (Figure 28.22) by clicking the
Matrix Setup (
) button on the main toolbar or by choosing the Matrix Setup command from
the Matrix menu.
Figure 28.22 Dot Matrix Setup dialog box
Two parameters affect the Dot Matrix calculation:
Dot Matrix Setup
stringency (30% by default)
the minimal number of matches in the window to cause a dot to be set
in the matrix
window (5)
the size of the sliding window
Table 28.7 Dot Matrix setup
Other AlignX Features
The following features can be performed in the AlignX display window. Details specific to AlignX
are outlined here. For general information on these features, refer to Chapter 3.
412
z
Print and Print Preview
z
Copying to the clipboard
AlignX Chapter 28
Notes:
Data or graphics from any pane, including the Dot Matrix can be copied to the Clipboard.
When copying the Alignment Pane with the Camera, the Consensus sequence can be
excluded from the copy, if desired.
For detailed information on copying the reverse/reverse complement to the Clipboard,
see page 398.
z
Note:
Exporting molecules
To export a currently open AlignX project into the MSF format, choose Project > Export
MSF Format.
z
External tools
Alignment Algorithms
For details regarding alignment algorithms, refer to Appendix B.
Alignment PCR
Alignment PCR allows you to design PCR primers for amplifying a region of aligned DNA molecules. To launch an Alignment PCR primers search for a DNA/RNA alignment, in the AlignX
Alignment Pane, highlight the region of the alignment you want to amplify, right-click on the
Alignment Pane and choose Design PCR Primers from the shortcut menu. The Alignment PCR
dialog box (Figure 28.23) displays:
Figure 28.23 Alignment PCR analysis dialog box
The Alignment PCR dialog box allows you to set parameters for your alignment PCR primers
search. For detailed information on performing Alignment PCR, see Alignment PCR Analysis,
page 260.
413
Vector NTI Advance 10 User’s Manual
414
C
H A P T E R
29
BIOANNOTATOR
Introduction
BioAnnotator is a sequence analyzer that performs certain types of DNA and protein sequence
analyses, and displays the results as linear graphics. For proteins, amino acid scaling allows the
user to visualize the distribution of the particular physiochemical properties along the polypeptide chain, thus providing helpful hints about the functional properties of the protein regions or
domains. An amino acid scale is defined by a numerical value assigned to each type of amino
acid. The most frequently used scales are the hydrophobicity, hydrophilicity, and the secondary
structure conformational parameters scales, but many other scales exist which are based on different chemical and physical properties of the amino acids. This program provides about 60 predefined scales entered from the literature. BioAnnotator also includes the following advanced
search and analysis tools, which are run in the Analysis Monitor (see Chapter 34): ProSite,
PFAM, BLOCKS and Proteolytic Cleavage.
Launching BioAnnotator
To open BioAnnotator from the Start menu, select Start > Programs > Invitrogen > Vector NTI
Suite 10 > BioAnnotator. To launch BioAnnotator from Database Explorer, with a molecule
highlighted, select Analyses > BioAnnotator > Analyze Selected Molecule, or select Analyses > BioAnnotator > Open New Analyzer Window. From a Molecule Display Window or
other Vector NTI applications, make the same selections, although, of course, the molecule to
be analyzed will be that opened in the display window.
You can also drag a molecule from a partial Database Explorer screen or other Vector NTI applications into an empty BioAnnotator workspace.
Features of the BioAnnotator Workspace
Depending upon how BioAnnotator is first opened, the display window may be empty. As a new
project is created or an existing BioAnnotator project is opened, the analysis results then appear
in the display window.
415
Vector NTI Advance 10 User’s Manual
If your BioAnnotator display window is empty, open a demo project into the workspace before
you review its features. Select File > Open. Find the Vector NTI Suite folder. It is probably
located in Program Files\Vector NTI\Demo Projects. Open the DNA or protein.apf file.
The BioAnnotator interface (Chapter 29.1) consists of a menu bar, three toolbars, and a BioAnnotator Display window, with shortcut menus specific for each pane.
Figure 29.1 BioAnnotator interface
BioAnnotator has three toolbars: the Main toolbar, the Pane Selection toolbar, and the Pane
toolbar. The Main Toolbar contains tools for major program functions, such as opening BioAnnotator analysis projects, importing molecule data from various formats, adding and deleting analyses, etc. Many toolbar commands can also be launched from the menu bar or from a shortcut
menu.
Note:
Most toolbar buttons have associated tool tips that explain the button function. Hover the cursor
over the button to display the tool tip for that button.
Each Display Window is divided into three section or panes: a Text Pane, a Plot Pane, and a
Sequence Pane. Split bars allow the resizing of the panes in the display window. In BioAnnotator, the heavy line at the bottom or top of a graph is also a split bar. Each pane has its own scroll
bars, allowing vertical and horizontal movement through the pane.
As in the other Vector NTI Advance applications, to apply a command from the main menu in a
given pane (Print, Print Preview, Camera), that pane must be active. The active pane can be
toggled with the Switch Panes (
,
,
) buttons in the Pane Selection Toolbar or by clicking anywhere in the pane you want to activate.
Elements of BioAnnotator Display Windows
Text Pane
To activate the Text Pane, click on the Text Pane button (
) on the Pane Selection Toolbar.
The Text Pane contains a thorough description of the analyzed molecule. The information is
organized in a tree structure with the following folders:
416
BioAnnotator Chapter 29
Folder
Contents
General
description
Molecule type, form (for DNA only), length, etc.
Proprietary
fields
User defined fields (for molecules that came from Vector NTI)
Standard
fields
GenBank/SWISS-PROT-like fields: keywords, division, original
accession numbers, etc.
Comments
Arbitrary text of any length associated with the molecule
References
Bibliographic references (in GenBank/SWISS-PROT format)
Analysis
Results of common physiochemical analyses of proteins
Feature Map
List of molecule features
Table 29.1 BioAnnotator Text Pane folders
The following Text Pane manipulations are outlined in Chapter 3:
z
Expanding and collapsing folders
z
Opening the folder shortcut menus
z
Copying pane contents to the clipboard
Plot Pane
The graphs for a DNA or protein molecule in BioAnnotator display physiochemical properties,
many of which are based on parameters like charge that exert effects over distance. Other properties represented in the plot depend on the way adjacent bases/amino acids fold in 3-dimensional space, which is a function of the sequence itself.
The Plot Pane consists of the graphical analyses region: a vertical (Y) axis, showing minimal
and maximal values of analysis results, and an individual horizontal (X) axis, displaying either
numerical positions in the sequence or residues, scrollbars, and the legend region that displays
the name of each analysis. Even if residues do not show initially, if you enlarge the region
enough, individual residues are displayed. To change the width of the description section, drag
the thin vertical bar in the right corner of the common horizontal scale.
At any point along the sequence (X-axis), the value (Y-axis) for the property is derived not just
from the specific residue at that point, but from adjacent residues as well. For each property, the
algorithm authors have determined the apparent optimum window of adjacent residues to be
considered when calculating the value for a point. For instructions in modifying the Window Size
parameter, see Editing Analysis Properties on page 419.
Note:
You may note that there are no values for the property at the beginning (or end) of the
sequence. Those regions do not have enough bases/amino acids to the left (or right) of the
selected residue (as specified by the Window Size) to make the full calculation. To calculate values for those regions, you can reduce the Window Size. Directions for doing so are found in
Editing Analysis Properties on page 419.
User Interaction Modes
BioAnnotator has two modes for working with plots.
z
Regular Mode (default mode): In this mode, regions of data can be selected, the scale of
plots can be changed, and the data section can be scrolled. In this mode, the Plot Pane
417
Vector NTI Advance 10 User’s Manual
is synchronized with the Sequence Pane. This means that a selected data region on the
Plot Pane is displayed concurrently in the Sequence Pane and vice versa.
z
In the Plot Layout Mode: The plots are treated as pictures that can be arranged in a
number of ways, including changes in positions and the heights of the plots. To activate
the Plot Layout Mode, click the Edit Layout button(
) on the Plots Pane Toolbar. This
enables several edit buttons at the far right of the toolbar.
By default, plots do not overlap, but you can resize them by dragging horizontal separator
bars.
Plot Layout Mode
To perform any of the following operations, BioAnnotator must be in Plot Layout Mode which is
activated by clicking the Edit Layout button (
).
Selecting Plots
To perform certain actions on displayed plots, you must activate the Plot Layout mode by clicking the Edit Layout button (
), then select one or more plots. To select a plot, click on it with
the mouse. If you hold the SHIFT key down, previously selected plots stay selected; otherwise,
they become unselected as you click on new selections. Selected plots can be distinguished
from unselected ones by the black boxes or “handles” in the corners of the selected plot (Layout
Mode only—see below).
Overlapping Plot Graphics
z
If the Enable Overlapping option is turned on (with the Enable Overlapping button
(
), one plot can be superimposed on another (drag it into position). The overlapping
order can also be modified. To bring a plot to the front, use the Bring to Top button
(
) on the toolbar or select View > Bring to Top. To send a selected plot to the back,
press the Send to Bottom button (
tom.
z
) on the toolbar or select View > Send to Bot-
When the Enable Overlapping option is turned off, superimposed plots return to their
original order.
Changing Plot Position
z
If the Enable Overlapping option is on, the plot can be dragged and dropped anywhere in
the Plot Pane. Click on a plot + drag the mouse. The cursor shape is changes from
. It will be placed on top of other plots that might occupy the same position.
z
to
If the Enable Overlapping option is off, the plot can be dropped in specific positions only.
When the cursor shape changes from
sor shape changes to
to
., a new position is allowed. When the cur-
, the new position is invalid.
Changing Plot Height
Plot height can be changed only for a single plot at a time.
418
z
To modify the plot height, move the cursor to one of the handles where it changes to a
two-headed arrow ( ). Drag the handles vertically to resize the plot.
z
If the Enable Overlapping option is on, handles appear at the top and bottom of a graph.
BioAnnotator Chapter 29
Regular Mode
Selecting Data
A region of data may be selected in the Regular Mode only. To select a region, press and hold
the mouse button and drag the mouse horizontally over the plot. To modify the current selection
either hold the SHIFT key down and click/drag in the plot area or resize the edges of the existing
selection by dragging them.
By clicking outside the plot area or individual horizontal axis, BioAnnotator removes the selection from plot.
Selecting a region on one of the plots also changes selected regions on all plots.
Changing Scale
As in other Vector NTI Advance applications, plot analysis graphs can be resized using the
Zoom buttons. The scale for all plots can be changed by using the Zoom In (
Out (
) and Zoom
) buttons or by selecting View > Zoom In or Zoom Out. Increase the scale of a
selected region in the Plots Pane by clicking the Zoom to Selection button (
). In this case,
now you can read the individual residues in the Plot Pane. To fit the entire plot into the data section, use the Fit to Window button (
) or select View > Fit to Window.
Editing Analysis Properties
To modify individual properties and common display properties, double-click on a plot, opening
the Plot Properties dialog box. Alternatively, click on a plot once to select it, then press the Properties button (
) or choose View > Properties command from the menu bar.
In the Plot Properties dialog box, both the analysis parameters and the display setup for the plot
can be changed.
z
The Analysis tab displays a short description of the analysis as well as the Window Size
parameter, which is analysis dependent. The Window Size is the number of adjacent
data points used in averaging values for each displayed data point. (See the description
of Window Size under Plot Pane on page 417.) You may alter the Window Size to reflect
experimental findings or thinking that has changed since the author first reported the
algorithm, or you may want to calculate residues within a blank zone at the beginning or
end of the sequence. Try varying the window size to see how it affects the plot display.
z
The Datagram tab changes the display attributes of the plot, such as plot type and color.
It also turns the display of the individual scale for the plot on or off.
Changing Common Display Properties
The common display properties of all plots can be customized using buttons on the Plot Pane
toolbar of the View menu. The Show Vertical Axis command/buttons (
play of vertical axes on all plots. The Show Legends (
(
) turns on/off the dis-
) and Place Legends Below Plots
) buttons turn on/off and change position of the legends for all of the plots.
Display Setup for Analyses is discussed later in this chapter.
419
Vector NTI Advance 10 User’s Manual
Sequence Pane
Like other Vector NTI Advance applications, in BioAnnotator, nucleotide or amino acid
sequences can be viewed, manipulated and formatted in the Sequence Pane. Regions of the
sequence can be copied and pasted to the Clipboard.
Sequence Pane Elements
In addition to the sequence, the Sequence Pane displays a molecule’s sequence features. Features are shown with a horizontal line above the sequence (protein features and DNA features
on the direct strand) or below the sequence (DNA features on the complementary strand).
Labels also show the name of the feature.
The sequence can be scrolled up or down with the Sequence Pane’s scroll bar. If Sequence
Pane is the active pane, standard arrow keys may be used to scroll the sequence.
Navigating the Sequence Pane Using the Keyboard
Standard keyboard keys may be used to navigate the sequence:
Key
Description
LEFT
Move caret to previous position
RIGHT
Move caret to next position
UP
Move caret position one line up
DOWN
Move caret position one line down
HOME
Move caret position to the beginning of the current line
END
Move caret position to the end of the current line
CTRL-PGUP
Move caret position to the beginning of sequence
CTRL-PGDN
Move caret position to the end of sequence
Table 29.2 Navigating a sequence using the keyboard
Selecting a Sequence Region
To select sequence regions, CLICK + DRAG the mouse across the sequence. Press SHIFT + RIGHT
or LEFT ARROW to start or extend a selection.
A selected region in the Sequence Pane is concurrently displayed on the plots in the Plot Pane.
Changing Sequence Pane Properties
In BioAnnotator, double-strand mode is default mode for DNA/RNA sequences. To switch to a
single strand display, press the (
Strands.
420
) button on the pane toolbar or select View > Show Both
BioAnnotator Chapter 29
The length of a single line of a sequence and number of blocks per line can be adjusted as well.
Click the BioAnnotator Setup (
29.2):
) button on the toolbar to open the Setup dialog box (Figure
Figure 29.2 Setup dialog box
Click the Setup button for a Sequence to control sequence display (Chapter 29.3):
Figure 29.3 Sequence Display Setup dialog box
To choose what features should be shown in the Sequence Pane, click on the Setup button for
Feature Map in the Setup dialog box, opening the FMap Setup dialog box (Chapter 29.4):
Figure 29.4 FMap Setup dialog box
421
Vector NTI Advance 10 User’s Manual
Click the < Add button to add features for display. Feature Map Setup is discussed in detail in
Editing the Feature Map on page 240.
Changing Sequence Character Display Attributes
Display attributes for selected sequence residues can be changed in the same way that text is
formatted in a word processor using the appropriate toolbar buttons. See Chapter 3 for details.
Copying a Raw Sequence
To copy real sequence data to the Clipboard, select a sequence region and choose Edit >
Copy. The sequence will be copied in the plain text format without formatting or line numbering.
This “raw” format is suitable for pasting into other molecular biology software including programs
in Vector NTI Advance. The keystroke for the copy operation is CTRL+C.
BioAnnotator Projects
Creating a New Project
When BioAnnotator is launched, a new, empty display window is opened. To create a new
project, you must import molecule information from various molecule file formats. To import a
molecule, select File > Open on the menu bar.
BioAnnotator reads the following file formats: GenBank and EMBL for DNA, GenPept and
SWISS-PROT for proteins. BioAnnotator also reads ASCII Text, FASTA, and Vector NTI
archives for both DNA and proteins.
In the File Open dialog box that opens, select the desired file and click Open. The program tries
to recognize which format is being used and whether the sequence is nucleic acid (DNA/RNA)
or amino acid (proteins).
If the program fails to define a file’s format, it will be suggested in the following dialog box that
the file be imported as a raw sequence (Chapter 29.5):
Figure 29.5 Importing a raw sequence
To create a new BioAnnotator project from Vector NTI, in Database Explorer, select a molecule,
then choose Analyses > BioAnnotator > Analyze Selected Molecule or Analyses > BioAnnotator > Open New Analyzer Window.
Opening an Existing Project
BioAnnotator can save a molecule and its an analysis list (with individual options) and displayed
character attributes, as a single file. At any time, BioAnnotator can restore the contents of this
file and continue to work with it. An aggregate set of molecule, options, and attributes is called a
BioAnnotator project.
422
BioAnnotator Chapter 29
To open an existing project, choose File > Open or press the (
) button on the toolbar. In the
Open dialog box, select the desired file and click Open. By default, BioAnnotator project files
have an “*.apf” file extension. If the file is an analyzer project, information about the molecule, its
analyses, and sequence display character properties (if any) appears in the appropriate panes.
Another way to open an existing project is to drop the project file on the BioAnnotator window.
Analysis List Setup
The important part of configuring BioAnnotator is the selection of analyses to perform for a molecule. To add or remove any analysis from the plot, open the Analysis List Setup dialog box
where you can choose from the list of available analyses.
To open the dialog box, click the Analysis List button (
) on the Main Toolbar, choose Analyses > Analyses List on the menu bar or click the Setup button for Analysis List in the BioAnnotator Setup dialog box described previously in this chapter. This opens the Analysis List
Setup dialog box (Chapter 29.6).
Figure 29.6 Analysis List Setup dialog box
The dialog box lists currently displayed analyses in the Selected Analyses box and a list of 50
predefined analyses in the Available Analyses box. Available analyses differ for DNA/RNA and
protein molecules. Citations for each analysis are noted in the dialog box.
To add one or more analyses to the displayed analysis list, in the upper list, select the appropriate analyses and click the (
) button or double-click on each analysis to be added. To see the
same analysis with different parameters, you can add more than one “instance” of the same
analysis.
The relative position of an analysis in the Selected Analyses list determines the order in which
the plots appear in the Plot Pane. The list may be rearranged by moving a selected analysis up
or down by clicking (
) and (
) buttons.
Once analyses appear in the bottom box, properties of the selected analyses can be changed,
analyses may be moved up and down in analysis list, and analyses may be removed from the
list. To change the properties of an analysis, select it in the list and click the (
ble-click the analysis in the list.
) button or dou-
423
Vector NTI Advance 10 User’s Manual
To remove an analysis from the displayed analysis list, select it in the analysis list and click the
(
) button.
Analysis Properties
To change analysis parameters and choose from the various plot representation options, open
the Analysis Properties dialog box by clicking the (
) button in the Analysis List Setup dialog
box, or the same button on the Plots Pane Toolbar or by double-clicking on a plot in the Plot
Pane.
The Analysis Properties dialog box has two tabs, the Analysis tab and the Datagram tab.
Analysis Tab
On the Analysis tab, you can specify analysis-dependent analysis parameters. In general, every
analysis has its own version of this tab for editing analysis-specific parameters. However, most
protein analyses have very similar Analysis tabs. Examples of the Analysis tab for two different
analyses are described below.
1.The Analysis tab for the ProtScale analyses has the following format (Chapter 29.7):
Figure 29.7 ProtScale analyses: Analysis tab of the Setup dialog box
424
o
Minimal Value – Minimum value considered for weighted average.
o
Maximal Value – Maximum value considered for weighted average.
o
Window Size – Number of nucleotides or amino acids used to calculate average/
weighted average value, which is plotted on the graph. If you hover your cursor over
a point on a graph, a tool tip appears showing the number of residues in the window
(set window size) and the value calculated for that point using the set window size.
BioAnnotator Chapter 29
The Analysis tab for the Sequence Complexity analysis has the following format (Chapter 29.8):
Figure 29.8 Sequence Complexity analysis Analysis tab
Datagram tab
This Datagram tab is the same for all analyses (Chapter 29.9).
Figure 29.9 Analysis Properties dialog box
In the Personal Graph Properties section, you can specify the following Datagram properties:
o
Show Individual Scale – Check/uncheck the box to display/hide the individual horizontal axis.
o
Visual Type – Choose the plot type (Bar Chart, Line Chart, Boolean Chart).
o
Threshold – The minimal relative value considered as “true” for Boolean Chart.
o
Color – The color of the graph.
The datagram configuration is shown in the preview box on the tab. Choose OK to apply any
changes you have made.
425
Vector NTI Advance 10 User’s Manual
Analysis Descriptions
DNA/RNA Analyses
Melting temperature and free energy are calculated using the “nearest neighbors” method. Constants and algorithms used for calculation of thermodynamic parameters may be found in the
sources listed in Appendix D.
The full list of DNA/RNA analyses are as follows:
z
Free Energy (dG) (kcal/mol)
z
Enthalpy (dS) (kcal/mol)
z
Entropy (dS) (cal/K/mol)
z
Melting Temperature (Thermodynamic) ©
z
Melting Temperature (GC Content) ©
z
GC Content (%)
z
Nucleic Acid Distribution (%)
z
Sequence Complexity
Protein Analyses
Nearly all protein analyses are based on ProtScale analyses. ProtScale allows the computation
and representation of the profile produced by any amino acid scale on a selected protein.
An amino acid scale is defined by a numerical value assigned to each type of amino acid. The
most frequently used scales are the hydrophobicity or hydrophilicity scales and the secondary
structure conformational parameters scales. Many other scales exist which are based on different chemical and physical properties of the amino acids.
The full list of ProtScale analyses is as follows: Full citations appear in Appendix B.
426
z
Amino acid composition (%) in the SWISS-PROT Protein Sequence data bank
z
Antigenicity value X 10
z
Atomic weight ratio of hetero elements in end group to C in side chain
z
Average area buried on transfer from standard state to folded protein
z
Average flexibility index
z
Average surrounding hydrophobicity
z
Bulkiness
z
Conformational parameter for alpha helix (computed from 29 proteins)
z
Conformational parameter for alpha helix
z
Conformational parameter for beta-sheet (computed from 29 proteins)
z
Conformational parameter for beta-sheet
z
Conformational parameter for beta-turn (computed from 29 proteins)
z
Conformational parameter for beta-turn
z
Conformational parameter for coil
z
Conformational preference for antiparallel beta strand
z
Conformational preference for parallel beta strand
z
Conformational preference for total beta strand (antiparallel+parallel)
z
Free energy of transfer from inside to outside of a globular protein
z
Hydration potential (kcal/mole) at 25 C
BioAnnotator Chapter 29
z
Hydropathicity
z
Hydrophilicity scale derived from HPLC peptide retention times
z
Hydrophobic constants derived from HPLC peptide retention times
z
Hydrophobicity (delta G1/2 cal)
z
Hydrophobicity (free energy of transfer to surface in kcal/mole)
z
Hydrophobicity indices at ph 3.4 determined by HPLC
z
Hydrophobicity scale (contact energy derived from 3D data)
z
Hydrophobicity scale (pi-r)
z
Hydrophobicity scale (pi-r)
z
Hydrophobicity scale based on free energy of transfer (kcal/mole)
z
Mean fractional area loss (f) (average area buried/standard state area)
z
Mobilities of amino acids on chromatography paper (RF)
z
Molar fraction (%) of 2001 buried residues
z
Molar fraction (%) of 3220 accessible residues
z
Molecular weight of each amino acid
z
Normalized consensus hydrophobicity scale
z
Normalized frequency for alpha helix
z
Normalized frequency for beta-sheet
z
Number of codon(s) coding for each amino acid in universal genetic code
z
Optimized matching hydrophobicity (OMH)
z
Overall amino acid composition (%)
z
Polarity (p)
z
Polarity
z
Proportion of residues 95% buried (in 12 proteins)
z
Recognition factors
z
Refractivity
z
Relative mutability of amino acids (Ala=100)
z
Retention coefficient in HFBA
z
Retention coefficient in HPLC, pH 2.1
z
Retention coefficient in HPLC, pH 7.4
z
Retention coefficient in TFA
ProtScale Algorithm
All of the ProtScale analyses use one algorithm:
for average method and
for Weight Method.
where,
Di -plot value in i th position
W- window size
Si - amino acid in i
th
position
427
Vector NTI Advance 10 User’s Manual
W
----2
∑
Di =
f ( Si + j )
W
j – ----2
------------------------------
W
W
----2
∑
Di =
f ( S i + j ) × Wh j
W
j – ----2
-----------------------------------------------
W
f( )- coefficient for amino acid from table of coefficients (specified for each of analysis)
Wh j - linear weight coefficient
Advanced Analyses: BLOCKS, ProSite, PFAM and Proteolytic Cleavage
To launch an advanced analysis for the protein molecule displayed in the BioAnnotator workspace, choose Analyses > BioAnnotator > <analysis type> from the menu. Analysis Monitor
opens for the molecule with the appropriate parameters interface for the chosen analysis. For
more information on performing advanced analyses in Analysis Monitor, see Chapter 34.
Note:
The advanced analyses available in BioAnnotator also become available from the Vector NTI
Molecule Viewing window, assuming both BioAnnotator and Vector NTI are licensed.
Adding Custom Protein Analyses
Specific values are used in the calculation of the various protein analyses. These values differ
depending on the particular analysis and are stored in small text files having a .pa2 extension.
All .pa2 analysis files are stored in the Analyses subdirectory in the Vector NTI Suite directory.
The name of the analysis corresponds with the name of the .pa2 file.
For example, the Bulkiness analysis is characterized in the Bulkiness.pa2 file as follows:
[general]
author=Zimmerman J.M., Eliezer N., Simha R.
428
BioAnnotator Chapter 29
comment=Last modified 15/Mar/1996 by ELG
reference=J. Theor. Biol. 21:170-201(1968).
unique=s30
[data]
values=11.5,14.28,12.82,11.68,13.46,14.45,13.57,3.4,13.69,21.4,21.4,15.71,
16.25,19.8,17.43,9.47,15.77,21.67,18.03,21.57
The [general] section describes the attributes of the analysis and the [data] section contains the
list of values used for calculating the analysis. Values are listed according to the alphabetical
order of the acid coefficients.
You can create your own custom protein analysis by modifying the values in one of the existing
.pa2 files using a plain text editor, such as Notepad. Once modified, the new .pa2 file should be
saved in the Analyses subdirectory under a new name that corresponds to the new analysis
type. If BioAnnotator is open at the time the new .pa2 file is created, it must be closed and
reopened before the new analysis is recognized.
Other BioAnnotator Features
The following features can be performed in the BioAnnotator Display window. Details specific to
BioAnnotator are outlined here. For more information, refer to Chapter 3.
z
Printing from BioAnnotator
z
Copying data from BioAnnotator
z
Exporting molecule data
429
Vector NTI Advance 10 User’s Manual
430
C
H A P T E R
30
CONTIGEXPRESS: PROJECT EXPLORER
Introduction
ContigExpress is a program for assembling and editing sequencing fragments, either in the form
of text sequences or chromatograms from automated sequencers, into longer contiguous
sequences or “contigs.”
ContigExpress uses CAP3 (Huang and Madan, 1999; Huang, 1996) to drive the assembly process. This widely-used sequence assembly program can use quality value scores (QVs) in ends
trimming, contig construction and consensus calculation. It also produces excellent results when
QVs are unavailable. It is capable of using forward-reverse constraints to evaluate contigs, a
feature that helps in accurate placement of repetitive sequence fragments. It can also identify
and discard chimeric sequencing reads that frequently result from lane tracking errors. One of
the major strengths of CAP3 is its consensus generation algorithm based on weighted sum of
QVs.
Work in ContigExpress takes place in a ContigExpress Project, a file where you store fragments, their assemblies, and assembly options related to your current task. In ContigExpress,
fragments can be edited directly, with the chromatograms in full view. Changes are tracked and
a history is maintained. The contigs generated are then saved and managed as GenBank,
EMBL or FASTA files. They can be exported into other applications of Vector NTI Advance for
further analysis or visualization.
Launching ContigExpress
To launch ContigExpress from the Start menu, select Start > Programs > Invitrogen > Vector
NTI Suite 10 > ContigExpress. To launch ContigExpress from Vector NTI Database Explorer
or other Vector NTI Advance applications, select Assemble Menu > ContigExpress – Assemble Selected Molecules or Assemble Menu > ContigExpress – Open New Assembly
Project.
431
Vector NTI Advance 10 User’s Manual
Features of the ContigExpress Workspace
ContigExpress consists of three component windows:
Note:
z
ConfigExpress Project Explorer: This window is the first window you see when you
launch ContigExpress. In this window you open, save, and close the projects and set the
assembly options. Project Explorer is also where you can import, organize, and assemble your sequencing fragments.
z
Fragment Viewer: This is the workspace where you work with individual fragments and
chromatograms.
z
Contig Window: Contig Window is the place where you review and edit contigs.
Fragment and Contig Windows are covered in Chapter 31.
CE Project Explorer
Project Explorer, similar to the Vector NTI Database Explorer, is central to the management of
sequencing projects and assembly of fragments into contiguous sequences. When first opened,
the project window is empty. The screenshots in this and the following two chapters use
sequencing fragments supplied with your installation. Select Project > Add Fragments > From
ABI file from the Project window menu. In the Open dialog box, navigate to folder HS354_C02
(located in C:\Program Files\Invitrogen\Vector NTI Suite 10\Demo Projects if a default Vector
NTI Advance 10 installation has been performed). Open the folder and the ABI subfolder inside,
select all the fragments and click the Open button.
Elements of Project Explorer
The CE Project Explorer window (Figure 30.1) consists of a menu bar, a toolbar, a Tree Pane on
the left and a List Pane on the right side of the window.
Figure 30.1 CE Project Explorer interface
As you are introduced to various operations in the chapters covering ContigExpress, the toolbar
buttons are displayed as needed. Most toolbar buttons have associated tool tips that explain the
button function. Hover the cursor over the button to display the tool tip for that button. Many toolbar commands can also be launched from the menu bar or from a shortcut menu.
432
ContigExpress: Project Explorer Chapter 30
The ContigExpress Project Explorer window is divided into two panes: a Tree Pane on the left
and a List Pane on the right. As a new project is created or an existing ContigExpress project is
opened, the fragment and Assembly folders are listed in the Tree Pane. In Contents View, folders can be opened (expanded) or closed (collapsed) as in the other applications of Vector NTI.
Status bars in Project Explorer show information about the items in the Tree and List panes.
The status bar above the display panes shows the current Tree Pane view mode and the number of items contained in the selected project in the Tree Pane (Figure 30.2).
The status bar at the bottom of the Project Explorer shows the amount and type of currently
selected item(s). It can be configured to show one of several properties of a selected single item
in the List pane (View menu > Options > Status Bar tab, or left mouse-click on column header).
Figure 30.2 Contents of the assembly selected in Tree Pane are displayed in List Pane
Tree Pane
The Tree Pane displays the general structure of your ContigExpress Project in either of two
viewing modes: History or Content view. The contents of each pane are displayed and manipulated similar to other Windows applications, such as Vector NTI Database Explorer or Windows
Explorer.
The following types of items can be found in the Tree pane:
z
List of all fragments in the project
z
Assembly of fragments
z
Contig
z
z
Fragment included in an assembly
Fragment not included in an assembly.
433
Vector NTI Advance 10 User’s Manual
History View
List of all fragments
(Root)
Assembly with
descendants
(Node)
Assembly without
descendants (Leaf)
Figure 30.3 Tree Pane History view
The root of the tree is always the list of all fragments existing in the project. The tree nodes are
assemblies that have descendant assemblies, and the leaves are the assemblies that have no
descendants.
Content View
Click the Content View button (
) to display a “flat” list of all assemblies in the project without
displaying their mutual relationships. In Content View, you can display in the Tree Pane the contigs in the assemblies and non-included fragments by clicking on the + button at the left of
assembly name.
As in the History View, the root of the tree always list all of the fragments existing in the project.
The tree nodes are the assemblies. Contigs and fragments that were attempted to be included
but were unsuccessful are listed under the assemblies. Fragments successfully included in the
assemblies are listed inside the Contig Folders (Figure 30.4).
LIST OF ALL
FRAGMENTS (ROOT)
ASSEMBLY (NODES)
Contig folder containing
fragments included in
assemblies
Figure 30.4 Contigs and fragments that were not successfully included are listed under the assemblies
The following table summarizes the contents of each of the viewing modes:
Viewing
Mode
Fragments not Included
in Assemblies
Contigs
History View
Yes
Yes
No
No
Contents View
Yes
Yes
Yes
Yes
Table 30.1 Viewing modes
434
Fragments in
Assemblies
Assemblies
ContigExpress: Project Explorer Chapter 30
List Pane
The List Pane shows the contents of an item currently selected in the Tree pane. When the
Fragments (MAIN) is selected in the Tree Pane, the List Pane displays all fragments in the
project (Figure 30.5).
Figure 30.5 List Pane displays contents of item selected in Tree Pane
When an assembly is selected in the Tree Pane, the List Pane contains:
z
the contigs contained in the assembly
z
the fragments that comprise contigs
z
fragments that were considered in the assembly process, but were not included in the
final assembly.
The following types of items can be found in a List Pane (see Figure 30.2). Note that the
symbols to the left of each list item identifies its place in the project:
z
z
z
Contig
Lite contig A contig generated under Lite Contig mode, in which imported chromatogram data is no longer viewable (page 450).
Fragment not considered in an assembly
z
Fragment included in a contig
z
Fragment considered in an assembly but not used in a contig (grayed out symbol)
A fragment not included in a contig contains no other items; therefore, nothing is shown in the
List pane when it is selected in the Tree pane.
435
Vector NTI Advance 10 User’s Manual
A contig contains its fragments (Figure 30.6):
Figure 30.6 A contig contains its fragments
A fragment not included in a assembly contains no other items; therefore, nothing is shown in
the List pane when it is selected in the Tree pane.
On the toolbar, the List Format buttons control the list display. In the first three modes, only item
icons and names are displayed.
List Pane Formats
Button
Action
View the List pane in Large Icons mode
View the List pane in Small Icons mode
View the List pane in List mode
View the List pane in Details mode. In this mode, you can select the properties
shown in column for each item type.
Table 30.2 List Pane format options
List Pane Filters
The next group of buttons filters data displayed in the List pane.
Button
Action
Enable the Show Contigs filter in List pane
Enable the Expand Contigs filter in List pane
Enable the Show Unassembled Fragments filter in List pane
Enable the Show Other Fragments filter in List pane
Table 30.3 List Pane filter options
436
ContigExpress: Project Explorer Chapter 30
Column Dialog
A Column Dialog (Figure 30.7)can be called up by a right-click on the column header bar:
Figure 30.7 Column dialog for configuring appearance of List Pane
The List Pane column fields can be selected or de-selected in the Details View Tab. Order and
alignment can be adjusted accordingly. Standard display fields are: Name, Length, Original
Length, 5’ Trimmed Bases, and 3’ Trimmed Bases.
The value of “Minimum number of overlapping fragments to calculate unambiguity” dictates that
unambiguity calculation algorithm consider only those segments of contig that have more then
the specified number of overlapping fragments.
Sorting List Pane Columns
Objects are described in the List Pane by fields in columns. Sort column objects by clicking on
the property column headings (in Details mode). Reverse the order by clicking on the same column header for the second time or by selecting View > Arrange Icons.
Note that when contigs are constructed in the Full Contig mode, all component fragments can
be opened in the Fragment Window from within List Pane. However, when in the Lite Contig
mode, the component fragments cannot be opened because the linkage between the fragments
and contigs are not retained. The choice between Full Contig vs Lite Contig mode can be
selected in the Lite Settings Tab in the Assembly Setup dialog box.
General Project Explorer Operations
Opening or Creating a Project
Opening an Existing ContigExpress Project
To open a ContigExpress (.cep) project from a disk or other location, select Project > Open
Project, click the Open Project button (
) or use CTRL-O. You can also drag and drop a
project file from a folder in Windows Explorer into the ContigExpress Project workspace.
437
Vector NTI Advance 10 User’s Manual
To open a ContigExpress (.cep) project from a disk or other location, select Project > Open
Project, click the Open Project button (
) or use CTRL-O. You can also drag and drop a
project file from Database Explorer into ContigExpress.
In the Open Project dialog box, browse the folders available on your computer and select an
existing project file (extension .cep). Select the project file and click Open:
Figure 30.8 Open project dialog, browsed to VectorNTI Demo Projects folder
If you get an error message, the selected project file probably has an invalid structure. If a
project is currently open in the CE Project Explorer and it has been changed since its last save,
you will be asked at this point to save the project. If you choose not to open a new project at this
stage, to be click Cancel.
For your convenience, the four most recently opened projects are listed at the bottom of the
Project menu option. Select Project > <#><previously opened project name> to open one of
those listed.
After successful loading, the panes of the Project Explorer are updated to show the new project.
Importing and Exporting in ACE Format
ContigExpress can import an assembly project in ACE format. In a blank ContigExpress Project
workspace, select Project > Add Fragments > From Phrap ACE file and choose the ACE file in
the standard Windows file open dialog.
To export in ACE format an assembly from a ContigExpress project, select the assembly of
interest in the Tree Pane. Select “Export Assembly to ACE” item from the context sensitive
shortcut menu, invoked with a right mouse-button click. The name of the ACE file for the assembly can be specified in the file open dialog.
Importing Fragments to a Project
To import a fragments to a project, from the CE Project window menu, select Project > Add
Fragments > From <type> file… or from the shortcut menu launched by right-clicking on Fragments (MAIN) in the Tree Pane of the CE Project window, select Add fragments > From
<type> file. Select the fragment file names in the Import Sequence From dialog box and click
Open.
Alternatively, select one or several files/fragments in the Windows Explorer or Vector NTI
Explorer and drag them to ContigExpress Project Explorer and drop them to any of the Project
Explorer panes. Upon dropping, they are added to the project. Similarly, you can use copy and
paste.
438
ContigExpress: Project Explorer Chapter 30
When importing a large number, say 1000, of fragments from individual files, you should select
Project > Add Fragments > Folder of Fragments. This helps you to get around a limit set by
Microsoft Windows on the number of files one can open simultaneously.
Accepted Fragment File Types
Files must be in one of the following supported file formats:
z
GenBank (*.gb)
z
FASTA (*.txt)
z
ABI (*.abi)
z
AB1 (*.ab1)
z
EMBL (*.txt)
z
Staden SCF (*.scf)
z
ALF (*.alf)
z
plain text sequence (*.txt)
z
MegaBASE (.esd)
z
Phred (.seq)
Phrap ACE (.ace)
(Note that if sequence files were passed through an application that renamed them using proprietary file extensions, they may not be visible in their directory when specifying a supported
extension suffix (e.g., .ab1). In most cases, simply change the Files of Type setting in the Import
dialog to All Files (*.*).)
z
The imported fragment(s) are added to the project and the list of all fragments is updated.
Sequence chromatograms can be imported through AB1, SCF and ESD formats. Displaying
chromatograms during review and editing is obviously preferable. However, when dealing with a
large project, say, with more than a few thousands of fragments, computer resources may
become a limiting factor. To help meet this challenge, ContigExpress provides two alternatives:
one is to discard the chromatograms upon importing; the other is to assemble using Lite Contig
mode instead of the Full Contig mode.
Discarding chromatograms can be selected with the “Discard chromatogram data on import”
check box in the Lite Settings tab of the Assembly Setup dialog box. This will save about 50 K of
memory on average for each read of 500 bases length.
In Lite Contig mode, chromatograms associated with the fragments are discarded and edits performed on the fragments contained in contigs are not applied to the individual fragment files as
in the Full Contig mode. Usage of Lite Contig mode reduces the demand for computer memory
tremendously and is thus recommended for assembling large number of fragments. ContigExpress provides a warning message when you try to assemble more than 500 fragments in Full
Contig mode because of the projected requirement for computer resources during contig editing, if all fragments are assembled into one contig. Note that this number is based on our rough
estimation and is definitely not a magic one and can vary in individual installations. It does NOT
mean that ContigExpress cannot assemble more than 500 fragments in Full Contig mode.
Users are recommended to experiment initially with this and find a number appropriate under
your context. When an appropriate number is defined, you can set the controls on Assembly
Setup > Lite Settings tab so that ContigExpress operates in Full Contig mode, but automatically
switches to Lite contigs when the number is exceeded.
For Lite Contig mode, please refer to Lite Settings Tab on page 450.
439
Vector NTI Advance 10 User’s Manual
Finding Fragments
Launch the Find Fragment dialog box by choosing Edit > Find Fragment from the Project
Explorer menu or by pressing CTRL+ F on the keyboard. The Find dialog box displays (Figure
30.9):
Figure 30.9 Find Fragment dialog
Type the object name in the Object Name box and set the search parameters:
440
z
Match whole word only – If checked, finds the object only if the entire object name is
entered in the Object Name box.
z
Match case – If checked, finds the object only if the entire object name is entered in the
Object Name box in case-sensitive fashion.
z
Search area – Specify the area of the project you want to search: the assembly currently
highlighted only, from the current assembly forward, or the entire project.
z
Advanced search options – Allows you to search fragments only and/or fragments/
contigs of a specified length only. Once you have entered the object name and set the
ContigExpress: Project Explorer Chapter 30
search conditions appropriately, click the Find button to begin the search. Search results
display in the lower portion of the Find dialog box (Figure 30.10):
Figure 30.10 Search results in Find Fragment dialog
Double-click on a fragment name in the results section of the Find dialog box to highlight the
fragment in its assembly in the Project Explorer window.
Importing Phred Quality Values
You can load Phred quality values for fragments into your project. In ContigExpress, these values are used in sequence clipping calculation before assembly (see below), consensus determination (see Chapter 31, Contig Viewer Viewing options) or in fragment trimming (see Chapter
32). For more information on Phred quality values, see http://www.phrap.com/phred.
To load Phred quality values for existing fragments, right-click on a fragment listed in the Fragments Pane of the Project window and choose Load Phred Quality Values from the shortcut
menu. In the Open dialog box, navigate to the Phred Quality Score File (.qual), highlight it and
click the Open button.
AB1 and SCF files may contain QVs. Upon import, these QVs are parsed into ContigExpress.
When there are QV files named as xxx.ab1.qual or xxx.scf.qual, the QVs from the .qual file
replace the QVs from the corresponding .ab1 or .scf files in the ContigExpress project. Fragment names must match between the .qual and sequence file and the pair must contain an
equal number of elements.
Importing a Directory of Fragment Files
You can import a directory containing multiple sequencing files (in supported file formats) using
the Import Folder of Fragments command. To execute this command, choose Project > Add
441
Vector NTI Advance 10 User’s Manual
Fragments > Import Folder of Fragments from the menu in the ContigExpress Project window.
Importing FASTA Files
You can import one or more, or a whole folder of FASTA files into a ContigExpress project. If
there are .qual files in the same folder, ContigExpress automatically imports the corresponding
Quality Values (QVs) based on the matching file names. For example, if the sequence file is
named abc.fsa, then abc.fsa.qual will be imported along with the corresponding sequence file
(abc.fsa) and values assigned to the respective bases.
For multi-sequence FASTA files, the corresponding file with a .qual suffix will be recognized just
as the single-sequence files. Values are assigned to the respective bases in each of the fragments. One extra requirement is that the first word between the “>”at the line start and the first
white space on each header line has to match for each sequence, in the sequence file and .qual
files.
Selection Techniques
Selection techniques described here are unique to ContigExpress. General selection techniques are described in Chapter 3.
Tree Pane
In the Tree Pane, click on an item to select it. (Only one item can be selected at a time.) Change
the selection by clicking the item with the left mouse button or by moving the selection bar with
the cursor buttons on the keyboard.
List Pane
The List Pane allows multiple item selections:
z
To select a range of items: SHIFT + CLICK on the first and last item in the list
z
To select non-contiguous items: CTRL + CLICK on each item
z
To select a group of contiguous items in the List Pane, click anywhere in the blank area
of the pane. Drag a box around the files you want to select.
z
To select all the items in the List Pane, right-click on any item in the list and choose
Select All from the Edit menu, the shortcut menu, or use the keystroke CTRL + A.
When you select an item in the Tree Pane, the contents of the List Pane are updated to show
the contents of the newly selected item. The upper status bar is updated as well. The lower status bar reflects selection changes in both panes of the Project Explorer.
To invert a current selection in the List pane (that is, make all currently unselected items
selected and vice versa), select Edit Menu > Invert Selection.
Assembling Selected Items
Select at least two items in the List Pane, and choose Assemble > Assemble Selected Fragments, or click the Assemble Selected button (
).
If one or several contigs are selected for assembly, the sequences of all fragments that comprise the contig(s) are used as fragment sequences for the assembly process.
442
ContigExpress: Project Explorer Chapter 30
Since assembling is a lengthy process, a progress dialog box (Figure 30.11) appears showing
you the assembly steps. You can abort the process at any time by clicking the Cancel button:
Figure 30.11 Assembly in progress
If a contig cannot be created from the selected fragments with the selected setup options, you
will be informed.
If the assembly succeeds, a new “child” assembly is created inside the current assembly. The
selection in the Tree Pane moves to the newly created assembly and the List Pane shows its
contents. At the end of the assembly, an Assembly Completion message displays the duration
of the assembly, the number of contigs constructed and the total number of fragments used.
Assembly of a Large Project:
Although ContigExpress does not have an exact upper bound for project size, your project size
may be limited by the available computer resources in terms of both hardware and software
(such as operating system). When you attempt to assemble more than 500 fragments in Full
Contig mode, ContigExpress generates a warning message to bring this matter to your attention
(Figure 30.12).
Figure 30.12 Assembling a large contig in Full Contig mode places heavy demands on graphics units resources
and makes editing in the Contig Viewer difficult.
If you still want to proceed with the current assembly in Full Contig mode, click the OK button. (If
you check “Do Not show me this message again” ContigExpress will not generate this warning
message again.) If you do encounter an “out of memory” situation, you should consider assembly in Lite Contig Mode (Lite Settings Tab on page 450). Many a times the “out of memory” problem occurs due to the presence of too many assemblies in the ContigExpress Project. In this
case, you are advised to dissolve some of these assemblies, save the project and restart ContigExpress. Limiting the number of assemblies in a project is always a good idea with large
projects. If you decide to use Lite Contig Mode but don’t want to lose the linkage between your
443
Vector NTI Advance 10 User’s Manual
contigs and fragments, you can discard chromatograms (page 451) and trade the ability to
invoke chromatograms for a larger capacity.
Setting Assembly Setup Parameters
When you create or open a Contig Express project, a default set of assembly parameters is
used for assembling contigs in the project. To change these values, click the Assembly Setup
button (
) or select Assemble > Assembly Setup, opening the Assembly Setup dialog box
(Figure 30.13):
Figure 30.13 Assembly Setup -- Assembly tab
Loading and Saving Assembly Setup Settings
Click the Load and Save buttons to read and save any set of parameters from Assembly Setup.
Dialog boxes open allowing navigation to an existing parameter file to be loaded, or to a folder
where a new parameter file will be saved. After loading an existing parameter file, all fields of the
dialog box are updated.
Assembly Tab
There are three main check boxes to control some important aspects of the sequence assembly
process: Use Quality Values, Detect Chimeric Reads and Use Forward-Reverse Constraints.
These options are explained in Table 30.4.
Assembly Options
Use Quality Values
444
When available, base quality values (QVs) are used to trim
poor-quality ends, compute overlaps between reads, construct multiple sequence alignments, and generate a consensus sequence. Use of such scores is optional; when they
are unavailable, assembly will still proceed. Default ON.
ContigExpress: Project Explorer Chapter 30
Detect Chimeric Reads
Chimeric reads consist of pieces from different parts of the
sequence region, usually generated as artifacts. They are
identified based on overlap conflicts and are excluded from
the construction of contigs. The mechanism of detecting chimeric reads can be enabled or disabled with “Detect Chimeric Reads” check box. Default: ON
Use Forward-Reverse Constraints
When reads from both ends of subclones are available, constraints are satisfied if they lie on opposite strands of a double-stranded DNA molecule and within a specified minimum
and maximum range. This corrects assembly errors due to
misplacement of reads containing repeat sequences and
minimizes occurrence of singletons. A few unmet constraints
are allowed. However, if a sufficient number of constraints
are not satisfied by a join AND they all suggest an alternative
one supported by the overlap information, the alternative join
will be made. For most small- and moderate-sized projects, it
is not necessary to use this feature, unless in a situation
involving large region of repeats. Default: OFF.
Table 30.4 Assembly Options
The Assembly Tab contains some detailed settings related to the use of forward-reverse constraints. All these settings are disabled when Use Forward-Reverse Constraints is unchecked,
and are enabled and editable when checked.
Forward & reverse reads must be named identically up to the delimiter (default = dot), and must
contain paired suffixes thereafter (e.g., .s & .r or .x & .y). Suffixes may be added and deleted.
Only the letter immediately following the delimiter is recognized as the suffix. Other letters following it, if any, do not contribute to the identity as forward vs reverse end sequence; however,
they do distinguish one forward/reverse pair from another, thus making two sequence pairs with
the matching reverse/forward end sequence. Minimum & maximum distances may also be
edited.
CAUTION
Take care when defining file names at the sequencer, especially when a project is loaded in
batches over several days. Entries with misplaced suffixes (e.g. <filename>F.<projectName>,
instead of <filename>.F<projectName>) will be overlooked by the constraints feature, although
they may be included in an assembly.
z
Min. Dist. – Minimum Distance between the forward and reverse reads. Default: 0.
z
Max. Dist. – Maximum Distance between the forward and reverse reads. Default: 6000.
z
Delimiter – the letter separating main part and suffix part in read names. In cases that
there are multiple occurrences of the designated delimiter, the rightmost delimiter is
selected.
The values of minimum and maximum distance are uniformly applied to all sequence pairs.
Clipping Tab
Sequence clipping based on quality and similarity is an essential step in the overlap computation and assembly process and ensures validity and correctness. You can control and fine-tune
the clipping process through adjusting the parameters on the Clipping Tab (Figure 30.14). Note
that the clipping is irreversible and iterative within each project. When multiple assemblies are
made within a project, each round of clipping applies to the sequences that had been clipped in
the last round of assembly. This implies that a later attempt to assemble may affect the existing
assemblies. In such cases, ContigExpress generates a warning message (Figure 30.15). If you
445
Vector NTI Advance 10 User’s Manual
choose to proceed, click on the Yes button. The affected contigs will be dissolved. If you choose
not to proceed, click on the No button and the current assembly will be stopped.
Figure 30.14 Assembly Setup – Clipping tab
:
Figure 30.15 Trimming fragments in subsequent assemblies may dissolve earlier assemblies in which
they are contained.
446
z
Use Automatic Clipping –Ends of sequencing reads are usually unreliable and low in
QV values. CAP3 comes with a mechanism to detect and clip these poor end regions
based on sequence similarities with or without QVs. Clipping is done before the computation of overlaps. Note: trimming is available in ContigExpress, in addition to CAP3 clipping, and can be carried out before loading input sequences into assembly projects.
Default ON.
z
Match Score Factor – Also used in calculating Similarity Score for computing overlaps,
but only editable in the Clipping Tab. Match Score Factor is a positive integer to award
each match between two bases from the pair of sequences being compared during the
banded Smith-Waterman alignment. Default: 2.
ContigExpress: Project Explorer Chapter 30
z
Mismatch Score Factor – Also used in calculating Similarity Score for computing overlaps, but only editable in the Clipping Tab. Mismatch Score Factor is a negative integer to
penalize each mismatch between two bases from the pair of sequences being compared
during the banded Smith-Waterman alignment. Default: -5.
z
Gap Penalty Factor –Also used in the computation of overlaps, but only editable in the
Clipping Tab. Gap Penalty Factor is a positive integer to penalize each gap extended
during the banded Smith-Waterman alignment. Default: 6.
z
Quality Cutoff for Clipping – Quality Cutoff for Clipping applies to the clipping of a poor
end region for each read when QVs are provided. It is not used when QVs are not available. The specified value is used to find the low-quality ends of reads, where the quality
value of a base is considered low if it is less than this value. Default: 12.
z
Clipping Range – Clipping Range applies to the clipping of a poor end region for each
read regardless of whether QVs are available. The value is used to extend the ranges for
clipping further away from the ends based on the low-quality positions at each end as
determined with the Quality Cutoff for Clipping value. The larger the value of Clipping
Range, the more extensive the clipping for poor end regions. Default: 250.
z
Min Num Good Reads at Clip Position – This is the depth of good coverage at the clip
position. It applies to the clipping of a poor end region for each read regardless of
whether QVs are available. Depending on the actual depth of coverage, the Minimum
Number of Good Reads at Clip Position parameter determines the exact clipping position within the clipping region. The larger this value is, the more extensive the clipping
becomes. Default: 3.
Overlap Tab
Overlaps between reads are computed immediately following sequence clipping. This step
serves as the basis for contig construction. In order to ensure the quality, each overlap is evaluated with a few measures (Figure 30.16). You can change the rigor of overlap computation. The
parameters are explained below.
Figure 30.16 Assembly Setup – Overlap tab
447
Vector NTI Advance 10 User’s Manual
z
Overlap Length Cutoff – Minimum length required for the length in base pair of all the
overlaps. Default: 40.
z
Overlap Percent Identity Cutoff – Minimum percent identity of the overlap. Default:
0.80.
z
Overlap Similarity Score Cutoff – Minimum similarity score for an overlap. The score is
computed as the sum of match, mismatch or gap scores for each pair of bases weighted
by QVs. Default: 900.
z
Base Quality Cutoff for Difference – Determines the minimum overlap quality by
examining the differences of the overlap at bases of high quality values. This is useful
only when QVs are available. The Base Quality Cutoff for Difference value defines “high
quality” bases. Default: 20.
z
Max QV Sum at Difference – Applies only when QVs are available. Each overlap is
given a “difference score” based on the QVs and the Base Quality Cutoff for Difference.
An overlap with a difference score over the Max QV Sum at Difference value is excluded
from contig construction. Default: 200.
z
Max Clearance for Error Rate – Applies even and especially when QVs are not available. If the error rate of the overlap is greater than the sum of those of the overlapping
fragments plus this value, the overlap is not used for assembly. The smaller the value,
the better the quality control of the overlaps. Default: 30.
z
Band Expansion Size – This parameter specifies band expansion size. The program
automatically determines a minimum band of diagonals for an overlapping alignment
between two sequence reads. The band is then expanded, in each direction, by a number of bases specified here. This affects the computation of both potential overlaps and
true overlaps. Default: 20.
z
Max Gap Length – This is the maximum gap length allowed in an overlap. Default: 20.
z
Max Num Word Matches – This parameter controls the fast method for finding potential
overlaps between a pair of sequences. For each word in one read, at most Max Num
Word Matches occurrences of the word in the other read are considered for non-gapped
extension. A larger value forces the program to consider more word matches at the
expense of time and computer memory. Default: 300.
z
Max Overhang Percent Length – This parameter controls the different overhang
regions before or after the aligned region. It is defined as 100 times the total length of the
different overhang regions divided by the length of the overlap. Overlaps with a value
greater than the maximum cutoff are not used for assembly. Default: 20.
Contig Tab
Contig Tab (Figure 30.17) includes parameters affecting construction of contig and multiple
sequence alignments, thus the consensus sequences. QVs are used extensively during this
process, if they are available. If unavailable, the program assigns a QV of 10 for each base.
448
ContigExpress: Project Explorer Chapter 30
Three of the parameters, Match Score Factor, Mismatch Score Factor and Gap Penalty Factor,
are editable only on Contig Tab.
Figure 30.17 Assembly Setup – Contig tab
z
Match Score Factor –Match Score Factor is a positive integer to award each match
between the existing alignment and the sequence being added when calculating the
score of global alignments. Default: 2.
z
Mismatch Score Factor –Mismatch Score Factor is a negative integer to penalize each
mismatch between the existing alignment and the sequence being added when calculating the score of global alignments. Default: -5.
z
Gap Penalty Factor –Also Gap Penalty Factor is a positive integer to penalize each gap
extended when calculating the score of global alignments between the existing alignment and the sequence being added. Default: 6.
z
Min Num Constraints Correction – This is the minimum difference between the numbers of constraints satisfied in the current assembly and in the alternative assembly. A
difference greater than this value, if the contig is also supported by an alternative set of
overlaps, results in the alternative join.
z
Min. Num Constraints Linking – This is the minimum number of constraints for reporting a link between two contigs.
Description Tab
Any description of the assembly can be entered here (Figure 30.18). Clicking the Default button
on this tab displays a text description of all the available parameters at their default values. Any
value can be edited by typing, if the corresponding parameter has been changed elsewhere in
the Assembly Setup. Or you can supplement this description with information of your own. All
449
Vector NTI Advance 10 User’s Manual
information entered here is viewable in the Assembly Summary… item on the shortcut menu
of the assembly icon in Tree Pane. You can save this description as a text file.
Figure 30.18 Assembly Setup – Description tab
Lite Settings Tab
In ContigExpress, you can create two different types of contigs, Full Contigs or Lite contigs. On
the Lite Settings tab (Figure 30.19), you can specify the type of contigs you want to assemble
in the project.
In Full contigs mode, chromatogram data are retrievable and sequence editing performed in the
Contig Viewer are reflected in the individual fragment files.
Lite contigs disregard fragment chromatogram data and there is no dynamic association
between a Lite Contigs and its component fragments. Editing done on Lite Contigs is NOT
reflected in the original fragment sequences (original sequences remain unedited). Assembly in
450
ContigExpress: Project Explorer Chapter 30
Lite Contig mode reduces memory consumption and is, therefore, the preferred contig type for
assembling large projects.
Figure 30.19 Assembly Setup – Lite Settings tab
Lite Settings Parameters
Discard chromatogram
data on import
Check this box to discard sequence file chromatogram data when the
sequences are imported. Check this box before you import your
sequence reads. Note: you can also discard chromatograms for all fragments after import using Project > Discard All Chromatograms command.
Full Contigs only
Check this box to perform assembly in Full Contig mode. You can
retrieve chromatograms and maintain dynamic links between the contigs
and their component reads.
Lite Contigs only
Check this box to perform assembly in Lite Contig mode. All linkage
between the contigs and sequence reads will be lost and no chromatogram is retrievable in the Contig Viewer.
Lite contigs if selected
more than <#> fragments
Creates Lite Contigs during the assembly process only if the selected
number of fragments is greater than the number specified; otherwise
creates full/ regular contigs.
Table 30.5 Light Settings Options
Registering Assembly Setup Changes
Click OK to apply the entered parameters; they will apply to the future assemblies in the project
until updated. Click Cancel to abort the action.
451
Vector NTI Advance 10 User’s Manual
Editing Project Item Properties
To edit the name, description, or comment about a fragment or contig, right-click on the fragment or contig in the CE Project Explorer List Pane and select Edit on the shortcut menu. In the
Edit dialog box (Figure 30.20) you can change the name, description and comments of the fragment:
Figure 30.20 Adding comments to fragments/contigs
Click OK to confirm the changes; all instances of the item throughout ContigExpress are
updated to reflect the changes. Click Cancel to abort the action.
Viewing Project Item Properties
To view the properties of an item in a ContigExpress project, highlight the item (assembly, contig, fragment, etc.) and click the Properties button (
452
) or select Edit > Properties. The corre-
ContigExpress: Project Explorer Chapter 30
sponding keystroke is ALT-ENTER. This opens the Properties dialog box (Figure 30.21) where
you can review the properties of the selected item(s).
Figure 30.21 Viewing properties of fragments/contigs
Open Contig(s)/Fragment(s)
To view or edit a contig or fragment, select it in the Project List pane and double-click it or select
Open in its shortcut menu.
The Contig or Fragment window for the selected item is opened.
For further information on how to work in the Workspace, Contig, and Fragment Windows see
Chapter 31 and Chapter 32.
Dismissing an Assembly
Dismissing an assembly deletes the selected assembly from the open project. When an assembly item is selected in the Tree Pane or when the List Pane is active and shows the contents of
an assembly, click the Dismiss Assembly button (
) or select Edit > Dismiss Assembly or
the comparable option on the shortcut menu. If the assembly has “child” assemblies, they will be
dismissed as well. The Project Explorer display window is updated to reflect the changes.
Dissolving a Contig
Dissolving a contig removes the selected contig from the assembly, but leaves the rest of the
assembly intact. To execute the Dissolve Contig command, select the contig in the List or Tree
Pane of the Project Window and choose Dissolve Contig from Project menu or from the
shortcut menu. Once the contig has been dissolved, the Project Explorer display window is
updated to reflect the change.
453
Vector NTI Advance 10 User’s Manual
Deleting Contig(s)/Fragment(s) from a Project
To delete selected item(s) from the project, select the item in the List Pane and click the Delete
from Project button (
), press the keyboard DELETE key, select Edit > Delete from Project
or Delete from Project from the shortcut menu. If any of the items to be deleted are included as
a fragment in any assembly, you will be warned that all assemblies (and their child assemblies)
that contain the item will be dismissed. You can confirm or cancel the action.
Renaming an Item
To rename a project item, select the item and click the Rename button (
), select Edit >
Rename or single click inside the name of the item to be renamed. Enter the new name in the
enabled text box. If the item that has been renamed is used elsewhere in the project, all
instances of the item are renamed.
Operations Changing Project Items
Converting a Contig to a Fragment
A fragment with the same sequence as a contig’s consensus and the same name as the original
contig can be created and added to the project. To convert an existing contig to a fragment,
select File > Convert Contig to Fragment on the menu bar or select Convert Contig to Fragment on the shortcut menu.
Making a Reverse Complement
To generate reverse complement copies of selected contigs and fragments from the Project
Explorer List Pane, select the item and choose Make reverse complement from the shortcut
menu. If a contig is selected for this action, it is internally converted to a fragment and then the
action will be applied to it.
The reverse complement copies of the selected items are added to the project with names
Copy of <name >, derived from the names of the original items. The new item appears in the
List Pane.
Finding Sequences
There are two find features available in the ContigExpress Project Explorer window. The Find
Fragment feature allows you to search for and find the location of fragments in the project
according to fragment name (See Finding Fragments on page 440.). The Find Sequence feature allows you to find fragments and contigs in the project that contain the sequence that you
specify.
Launch the Find Sequence dialog box by choosing Edit > Find Sequence from the Project
Explorer menu or by pressing CTRL+ SHIFT+ F on the keyboard. The Find Sequence dialog
box displays (Figure 30.22):
Figure 30.22 Find Sequence dialog
454
ContigExpress: Project Explorer Chapter 30
Type the sequence you want to search for in the Sequence box and set the search parameters:
z
Revert – Reverse complements the sequence entered in the Sequence box.
z
Search Options – Allows you to search fragments or contigs only.
z
Search area – Specify the area of the project you want to search: the assembly currently
highlighted only, from the current assembly forward, or the entire project.
Once you have entered the sequence and set the search conditions appropriately, click the Find
button to begin the search. Search results display in the lower portion of the Find Sequence dialog box (Figure 30.23):
Figure 30.23 Search results in Find Sequence dialog
Double-click on an fragment/contig name in the results section of the Find Sequence dialog box
to highlight the fragment/contig in its location in the Project Explorer List Pane.
Blasting Ultimate ORF Collection
Ultimate ORF Blast Invitrogen has a generated a database of proprietary ORFs, the Invitrogen
Ultimate™ ORF collection. With the Ultimate ORF BLAST tool and using a fragment selected in
Contig Express Contig Viewer as the query sequence, you can launch a search against the proprietary ORF collection.
To launch Ultimate ORF Blast, select Tools > Ultimate ORF Blast. Choose the Range (Whole,
Selection Only, or Current CDS feature) and Sequence display (Single or Double
Stranded). Click OK. See Ultimate ORF Blast on page 467.
455
Vector NTI Advance 10 User’s Manual
Generating an Assembly Summary
To write a text file with an assembly summary, select an assembly in the Tree Pane, and select
Assembly Summary… on the shortcut menu. This writes an “Assembly Summary” file with a
“.log” suffix, summarizing the contig(s) by consensus length, sequence, number of fragments
and date of generation. In addition, summaries of each fragment in a contig appear with name
and position. Finally, data recorded in the Description Tab in the Assembly Setup dialog is summarized. Read the .log file in NotePad.
In the Write Assembly Summary dialog box, enter a file name for the summary and click Save. If
the file with this name already exists, you can overwrite the file. Click Cancel to abort the action.
Trimming Fragments
Trimming fragments is often performed to remove unreliable (ambiguous) residues. To trim one
or more fragments selected in the Project Explorer List Pane, select Edit > Trim Selected Fragments <trim type>…. A Fragment Trimmer dialog box opens, listing all of the selected fragments and/or suggested operations, depending on which type of trimming operation you’ve
chosen (see Chapter 32, page 493). Click OK to proceed with trimming the fragment(s). If no
action is suggested, the OK button is disabled.
Notes on Fragment Trimming:
z
This group of actions is used to trim the selected fragments according to various criteria.
z
Because “trimming” applies only to fragments, if contigs are selected, they will be
skipped.
z
If a fragment selected for trimming is currently open in its Fragment Window, initiating
the trimming mode in Project Explorer automatically forces the fragment into the readonly mode in the Fragment Window to avoid possible inconsistencies in the project after
a successful trimming.
z
If any of these fragments were already changed in their respective windows, select Yes
to save the changes or No to lose the changes or Cancel to skip the fragment in question.
z
Project Explorer reflects the changes if fragments are trimmed. If any of the changed
fragments are open in Fragment Windows, the respective windows are updated as well.
For further information on the Fragment Trimmer dialog boxes, including modifying trimming
settings, refer to Chapter 32, page 493 of this manual.
Calling Secondary Peaks for Fragments
If conflicting residues appear on a chromatogram, you can alter the nucleotides as you wish.
With one or more fragments selected in the Project Explorer List Pane, select Edit > Call Secondary Peaks for Selected Fragments. The Call Secondary Peaks dialog box opens (see
Chapter 32, page 502), listing all selected fragments will be presented to the user. Click OK to
continue.
Notes on Calling Secondary Peaks:
456
z
Because this operation applies only to fragments, if contigs are selected, they will be
skipped.
z
If a fragment selected for secondary peak search is currently open in its Fragment Window, initiating this operation in Project Explorer automatically forces the fragment into
the read-only mode in the Fragment Window to avoid possible inconsistencies in the
project after a successful search.
z
If any of these fragments were already changed in their respective windows, select Yes
to save the changes or No to lose the changes or Cancel to skip the fragment in question.
ContigExpress: Project Explorer Chapter 30
For further information on the Call Secondary Peaks dialog box, refer to Chapter 32, page
502 of this manual.
Other Operations in Project Explorer
Project Explorer Viewing Options
To review or modify viewing options in Project Explorer, highlight a fragment or contig in the List
Pane and select View > Options from the menu. This opens the Options dialog box, which has
several tabs.
Note:
Option settings for contigs and fragments are independent of each other. If a fragment is highlighted when the Options dialog box is opened, display options for fragments are visible in the
dialog box; if a contig is highlighted when the Options dialog box is opened, display options for
contigs are visible.
Details View Tab
The Options dialog box initially opens to the Details View tab (Figure 30.24).
Figure 30.24 Options for displaying column headers in List Pane
The Details View tab controls the columns displayed in the List Pane Details View mode and
related functions as follows:
z
Available Fields – Shows the list of fields that you can add to the List Pane display.
Move columns from the Available Fields box to the Displayed Fields box (and vice-versa)
by highlighting the desired column name and clicking the >> or << button.
z
Displayed Fields – Shows the fields that are currently being shown in the List Pane display. The top-to-bottom order of columns in the Displayed Fields list dictates the left-toright column order shown in the List Pane; top to bottom order in the Displayed Fields list
corresponds to left to right order in the Project Explorer List Pane.
z
Order – Allows you to rearrange the order of the fields in the Displayed Fields list. To
change the order, select a field and click the Move Up or Move Down button.
z
Alignment – Controls the alignment of text in the column headers in the List Pane. To
alter the text alignment for a column, highlight the column name in the Displayed Fields
list and select the appropriate radio button.
457
Vector NTI Advance 10 User’s Manual
z
Minimum number of overlapping fragments to calc unambiguity – Allows you to
specify the minimum number of fragments used for calculating unambiguity for a contig.
Percent unambiguity is shown in the Unambiguousness field.
z
Save the last viewed assembly – Saves the display format of the last viewed assembly.
Status Bar Tab
The second of the Option tabs is the Status Bar tab (Figure 30.25).
Figure 30.25 Options for display in Explorer Status Bar when items are selected in List Pane
The Status Bar tab allows you to choose the type of information displayed in the status bar
when a single item is selected in the List Pane:
458
z
1 Item Selected – Select this option to show the text “1 item selected” in the status bar
when an item is selected in the List Pane.
z
The Value of the Item’s Field – Select this option and a field in the list to show the value
of that field for the item selected in the List Pane.
ContigExpress: Project Explorer Chapter 30
Copy Fragment/Contig Tab
The third of the Option tabs is the Copy Fragment/Contig tab (Figure 30.26):
Figure 30.26 Options for export file type
Here you can define the file format used when you drag an item outside of the Project Explorer
or copy it to the Windows Clipboard.
Copying Selected Fragments or Contigs
In Project Explorer, to copy a fragment or a contig select it and click the Copy button (
Click the Paste button to paste the copy in the List Pane (
the list of objects and named “Copy of <selected object>”.
).
). The copied object is added to
Printing
You can print the contents of the Tree Pane in the CE Project Explorer window (Figure 30.27).
To review what the printout of the Tree pane looks like before it is printed, select Project > Print
Preview:
Figure 30.27 Print preview of project history tree
In the Print Preview dialog box, you can resize the displayed output, send it to the printer, or
press Close to return to the Project Explorer. To define your printer options, select Project >
Print Setup. A standard Window Printer Setup dialog box opens.
459
Vector NTI Advance 10 User’s Manual
To print a copy of the Tree Pane data, activate the Tree Pane. The Tree pane is always printed
in the History view mode with the tree completely expanded. Select Project > Print. In the Print
dialog box, click OK to print or Cancel to abort the action.
Exporting Items from the Project
To export contigs or fragments selected in the Project Explorer List Pane, choose Project >
Export Item > To <file> from the Project Explorer menu or select Export Contig/Fragment >
To <file> on the contig/fragment shortcut menu. ContigExpress can export items in the following
formats: GenBank (*.gb), FASTA (*.txt), EMBL (*.txt), and plain text sequence file (*.txt). Choose
Project > Export Item > Send to VectorNTI, and the selection will open directly in a VectorNTI
viewer.
In the Export To dialog box, select or enter a file name and destination for the exported item.
Click Save to export the item to the entered file. You can overwrite an existing file or click Cancel to abort the action.
Alternatively, you can select one or several contigs or fragments in the List pane and drag and
drop them to Windows Explorer or Vector NTI Explorer. The export format for dragged and
dropped files is defined by the setting on the Copy Fragment/Contig tab of the Options dialog
box (see page 459).
You can return to other Vector NTI Advance programs or send ContigExpress data to AlignX by
selecting Align > <AlignX options> and to BioAnnotator by selecting Analyses > BioAnnotator > Analyze Selected Molecule.
Saving and Closing a Project
To Save a Project to disk, click the Save button ( ), select Project > Save, or use the keystroke CTRL+S. Enter a file name and destination in the Save As dialog box. After the project is
successfully saved, the Save toolbar button and menu item are disabled until you make any
changes in the project.
To close a Project, select Project > Close Project. When you select this action, the Project
Explorer first closes the current project, giving you the option of saving any changes. To save
any changes, click Yes in the dialog box that opens. If you select No, all changes are lost.
Exit Project Explorer
To exit Project Explorer, click on the Explorer close box, select Project > Exit, or use the keyboard shortcut, Alt-F4. This operation closes the ContigExpress application.
460
C
H A P T E R
31
CONTIGEXPRESS: FRAGMENT AND CONTIG VIEWERS
Introduction
ContigExpress offers two workspaces where you can work with fragments or contigs. Fragment
Viewer allows you to work with individual fragments. Contig Viewer allows you to work with contigs or the fragments comprising them. To open fragments or contigs in their respective viewers,
select the item in Project Explorer and double-click on it or select Open from the shortcut menu.
Depending upon the item from which it was launched, a Fragment Viewer or a Contig Viewer
opens. When projects are assembled in Full Contig mode, Fragment Viewers and Contig Viewers may be opened together in the same workspace; the Fragment Viewer, however, is in ReadOnly mode. This section reviews elements common to both types of viewers.
Features of the ContigExpress Workspace
These workspace windows have many of the same features as the other applications of Vector
NTI Advance: a menu bar, toolbars, and three panes and a status bar.
As you are introduced to various operations in this chapter, the toolbar buttons are displayed as
needed. Most toolbar buttons have associated tool tips that explain the button function. Hover
the cursor over the button to display the tool tip for that button. Many toolbar commands can
also be launched from the menu bar or from a shortcut menu.
461
Vector NTI Advance 10 User’s Manual
The windows are organized and managed like any Windows application. Several windows can
be opened in one workspace (Figure 31.1).
Figure 31.1 Several Fragment Viewer windows or Contig Viewer windows can be opened in one workspace
Fragment and Contig Viewers are divided into three panes. Split bars allow re-sizing the three
panes. Scroll bars appear when the contents of a pane exceed the viewing area, facilitating easier viewing of pane contents.
If you prefer, you may view contigs or fragments in a different layout. From the View menu, go to
Edit Pane Layout and toggle between the standard, tabbed or custom layout options. To design
a custom layout, right click on entries in the Pane Manager, design a layout, then drag and drop
the desired pane(s) to the chosen layout. The layout you select will be the default one until a
new layout is chosen.
Switching Between Panes
As in the other Vector NTI Advance applications, to apply a command from the Main Menu in a
given pane that pane must be active. The active pane can be toggled with the Panes buttons on
the Pane Selection Toolbar or by clicking anywhere in the pane you wish to activate. The keyboard strokes are F6 (cycling clockwise through the panes) and SHIFT + F6 (cycling counter
clockwise).
Status Bar
The Status bar shows menu item help and information about the cursor and selection positions
in the active window (Figure 31.2).
Menu item
help
Position box
Selection
box
Figure 31.2 Status bar
The menu item help on the Status Bar is a short description of a selected menu or toolbar item.
462
ContigExpress: Fragment and Contig Viewers Chapter 31
The Position Box shows the current cursor position if relevant. You can position the cursor by
clicking on this box. In the Fragment Viewer, the display is in the form original position/position
post-trimming. In the Contig Viewer, the Position Box can apply to fragments or the consensus.
On fragments, the display indicates position in the Contig (gaps included)/original position in the
fragment. On the consensus, the display indicates position in the Contig (gaps included).
The Selection Box displays the start and end coordinates of selections in the active window. In
the Fragment Viewer, each coordinate is in the form original START position – START position
post-trimming : original END position - END position post-trimming. You can also position a
selection by clicking on this box and checking Do Not Count Gaps on/off as desired. In the Contig Viewer, the Selection Box can refer to fragments or the consensus, with the guidelines
described above. Click this box to set a selection on a fragment (using fragment or contig coordinates) or on a consensus (using Contig coordinates).
General User Actions
Finding a Feature in Other Panes
A feature selected in a Feature Table folder in the Text Pane can be concurrently selected in
both other panes. Select the feature, then click the Find button (
select Find on the shortcut menu opened from a folder.
Note:
) on the Pane Toolbar or
Because some features are circular, they bypass the endpoints of the fragment. Since ContigExpress does not support circular selections, such a feature will not be correctly located. The
program warns you in such cases.
Editing Fragment or Contig Properties
To edit some of a selected contig or fragment’s properties from the Text Pane, double-click on
the first line with the fragment or contig name or select Edit from the associated shortcut menu.
In the Edit dialog box (Figure 31.3), change the name, description or comments:
Figure 31.3 Edit Properties dialog
Click OK to confirm the changes or Cancel to abort the action.
After selecting OK, every instance of the fragment throughout ContigExpress is updated to
reflect the changes.
463
Vector NTI Advance 10 User’s Manual
Saving a Current Window
To save a changed item/apply changes made in a Fragment or Contig Viewer to the project,
select Apply from the Fragment or Contig Menu, use keystroke CTRL-S, or click the Apply button (
).
If a change affects other project items, Project Explorer makes the necessary changes, and
updates its display and the currently opened windows, if needed.
Closing a Current Window
To close the current window, select Close from the Fragment or Contig menu, click on the
respective Close Box, or use keystroke CTRL + F4. If the item in the window you are closing
has not been saved since its last change, you can confirm saving the changes in the dialog box
that opens.
If the item in the window you are closing has not been saved since its last change, you can confirm saving the changes in the dialog box that opens.
Closing All Windows
To close all open windows (thus closing the Workspace), select Close All from the Fragment or
Contig menu, click on the workspace Close Box, or use keystroke ALT + F4.
Selecting All Data
To select all data in the current pane, select Edit > Select All or choose Select All on the shortcut menu.
Deleting Data
To delete a data selection from an item in the active pane, select Edit > Delete Sequence From
<selected bp range> or press the DELETE key on the keyboard. If no selection is currently
defined, one nucleotide is deleted at the cursor position with this action. (If you delete in error,
click on the Undo button (
).
The following additional actions can be performed in ContigExpress windows. Details are given
in Chapter 3.
z
Resizing the panes with the split bars.
z
Scrolling data inside the panes using scroll bars and arrow keys
z
Opening and closing Text Pane folders
z
Opening shortcut menus
z
Copying selected molecule and fragments
z
Copying screen and pane contents
z
Pasting files and text
z
Exporting data to other Vector NTI applications or external programs
z
Printing from ContigExpress windows
External Tools Usage
ContigExpress is integrated with the other components of Vector NTI Advance, making it easy
to launch Vector NTI, AlignX and BioAnnotator from ContigExpress and to easily exchange data
with them. It can also easily export data to third-party tools available on the Internet.
464
ContigExpress: Fragment and Contig Viewers Chapter 31
To invoke the tools, select Analyses > Web Analyses > <tool category> > <tool>, Align >
Web Alignment Tools > <tool category> > <tool>, or Tools > Online Resources > <tool>.
The tools listed in these menus will work with the currently selected items.
For more information on the External Tools, refer to other chapters in the Vector NTI documentation.
Fragment Viewer
Launching a Fragment Viewer
To open a Fragment Viewer, select a fragment in CE Project Explorer and double-click on it or
select Open on its context-sensitive shortcut menu. Alternatively, Fragment Viewers may be
launched from the respective mini-windows in the Fragment Trimming dialogs (Chapter 32).
Finally, when a contig is assembled in Full Contig mode, one or more instances of the Fragment
Viewer may be opened in Read-Only mode by double-clicking on the respective fragments in
any pane of the Contig Viewer. Note that if an assembly was performed in Lite Contig mode, it
will not be possible to open Fragment Viewers from the Project Explorer or the Contig Viewer.
Features of a Fragment Viewer
As in the other applications of Vector NTI Advance, the ContigExpress Fragment Viewer (Figure
31.4) consists of a menu bar, two toolbars and is divided into three panes: Text Pane, Sequence
Pane and Chromatogram Pane. As described above (Features of the ContigExpress Workspace), the panes can be organized in different layouts. A shortcut menu associated with specific folders or objects can be opened with a right click while the cursor is on the object. Most
toolbar buttons have associated tool tips that explain the button function. Hover the cursor over
the button to display the tool tip for that button.
Note:
Most toolbar buttons have associated tool tips that explain the button function. Hover the cursor
over the button to display the tool tip for that button.
Main menu
Main toolbar
Pane selection toolbar
Text Pane
Sequence
Pane
Chromatogram Pane
Figure 31.4 Fragment Viewer - standard layout
As in the other Vector NTI Advance applications, to apply a command from the Main Menu in a
given pane, that pane must be active. The active pane can be toggled with the Switch Pane
buttons (
,
,
) in the Pane Selection Toolbar or by clicking in the pane you want to activate. You can also activate the panes with the F6 and SHIFT-F6 keyboard buttons.
465
Vector NTI Advance 10 User’s Manual
Text Pane
The Fragment Viewer Text Pane contains a thorough description of the fragment, including
length, date of creation, and chromatogram data.
Text Pane manipulations are outlined in the previous section and are also summarized in Chapter 3.
The Text Pane data is divided into a hierarchy of folders and subfolders. A Text Pane can contain the following folders:
Folder
Contents
General description
Molecule type, form (for DNA only), length, etc.
Proprietary fields
User defined fields (for molecules which came from Vector
NTI)
Standard fields
GenBank/SWISS-PROT-like fields: keywords, division, original accession numbers, etc
Comment
Arbitrary text of any length associated with the molecule
References
Bibliographic references (in GenBank/SWISS-PROT format)
Feature Map
List of molecule features
Chromatogram
data (if available)
Data imported from fragment file processed by sequencing
machine (ABI files, for example)
Table 31.1 Fragment Viewer Text Pane folders
Sequence Pane
The Sequence Pane shows the nucleotide sequence of the fragment with feature signals. In this
pane, the nucleotide sequence can be viewed, edited and manipulated and the sequence display can be formatted. Any sequence changes are immediately reflected in the Chromatogram
Pane. Regions of the sequence can be copied and pasted to/from the Clipboard. For more
details, refer to Chapter 3.
In addition to the sequence, the Sequence Pane displays a molecule’s nucleotide sequence features. Features are shown with a horizontal wavy line above the sequence (direct strand features) or below the sequence (complementary strand features) together with the feature label.
Navigating the Sequence Pane Using the Keyboard
Pause the text cursor over a position in the sequence for a few seconds to display a tooltip
defining the exact position of the cursor. The cursor position or selection position is always indicated on the status bar following a left mouse-button click or selection.
Standard keyboard keys may be used to navigate the sequence and position the cursor:
Key
Description
LEFT
Move cursor to previous position
RIGHT
Move cursor to next position
UP
Move cursor position one line up
DOWN
Move cursor position one line down
Table 31.2 Navigating the Sequence Pane using the keyboard
466
ContigExpress: Fragment and Contig Viewers Chapter 31
HOME
Move cursor position to the beginning of the current line
END
Move cursor position to the end of the current line
CTRLPGUP
Move cursor position to the beginning of sequence
CTRLPGDN
Move cursor position to the end of sequence
Table 31.2 Navigating the Sequence Pane using the keyboard
Another way to define an exact cursor position is to click the Set cursor Position box on the status bar. In the Set cursor Position dialog box that opens, enter the cursor position and click OK.
Finding Sequence Fragments
To search for a specific sequence in the Sequence Pane, activate the pane, then click the Find
button (
) on the toolbar, or select Edit > Find.
Figure 31.5 Find Sequence dialog
In the Find dialog box (Figure 31.5), enter the sequence in the text box, with criteria for the
search, such as the strand to search, (direct or complementary), allow ambiguous symbols, and
the search direction from the current cursor position. If the matching sequence is found, ContigExpress selects it and positions both the Sequence Pane and Chromatogram Pane to make it
visible. If the sequence is not found, you are informed and the cursor remains in its current position.
Open Reading Frames
To display ORFs in the sequence, activate the Sequence Pane and choose View > Show ORFs
from the menu or press the Show ORFs button (
) on the toolbar. If the sequence display is
double-stranded, ORFs for both strands display; if the sequence is single-stranded, ORFs for
the direct strand only display. ORF definition can be adjusted on the View Options > ORF tab,
accessed from the View menu or Toolbar button (
Sequence Pane, see page 213.
). For details on displaying ORFs in the
Searching for Ambiguous Symbols
To search for ambiguous symbols quickly, click the Find Previous Ambiguous (
Ambiguous (
) or Find Next
) buttons from the View menu or the respective buttons on the Toolbar.
Ultimate ORF Blast
Invitrogen has generated a database of proprietary ORFs, the Invitrogen Ultimate™ ORF collection. With the Ultimate ORF BLAST web tool in Vector NTI Advance, you can BLAST your frag-
467
Vector NTI Advance 10 User’s Manual
ments against the Ultimate™ ORF collection. Using this tool, you may determine that your
sequence has been previously characterized and the clone containing it is commercially available from Invitrogen.
To launch Ultimate ORF Blast, select the all or part of a fragment, and select Tools > Ultimate
ORF Blast. The Sequence Data dialog box opens, allowing you to set the search parameters:
z
Range selects the range of the target sequence: the entire sequence, a selected
sequence or a selected CDS.
z
Strand selects either the direct or complementary strand. Click OK to begin the search
or Cancel to abort the search process.
The Ultimate ORF Blast tool copies your target sequence and pastes it into the Ultimate ORF
Browser Sequence Text entry box located on the Invitrogen webpage (Figure 31.6), which
opens automatically when you launch this tool.
Figure 31.6 Ultimate ORF Browser
Select the species to search the sequence query against from the checkbox located above the
Sequence Text entry box. To proceed with your search, click the BLAST button. The Blast dialog box appears, informing you that it is blasting your sequence.
Once your search is completed, the UltimateTM ORF Browser displays your search results. If
your search identifies similar ORFs, the target sequence, or UltimateTM ORF clone, is commercially available through the Invitrogen website, http://www.invitrogen.com.
Miscellaneous Operations in the Sequence Pane
For additional operations in the Sequence Pane, refer to Chapter 3:
468
z
Changing Sequence Pane Properties By default, the Sequence Pane displays the direct
strand only. Show two strands display option is available from the View menu or the
Toolbar button (
).
z
Translating sequences Any selection of more than 3 base may be translated in the reading frame defined by the selection, using the commands from the View menu or the Toolbar buttons (
). Translation may appear in 3- or 1-letter code, and may be
ContigExpress: Fragment and Contig Viewers Chapter 31
from the direct or complementary strand. Clear All Translations is also available from
the menu or Toolbar (
).
z
Changing text display attributes The Grouping command from the View menu allows
you to display bases in groups of 1, 3, 5, 10 and 20. You can also Set Number of
Blocks per line. These options are duplicated on the View Options > General tab.
Chromatogram Pane
The Chromatogram Pane displays (Figure 31.7) displays the chromatogram of the fragment if it
was initially provided in the original imported file used to create the fragment. A chromatogram
track shows:
z
a non-editable, color-coded sequence track, with coordinates
z
a duplicate sequence at the top of the pane where that can be edited
z
a vertical slide control for adjusting the dynamic range of the peak heights
.
Figure 31.7 Details of fragment Chromatogram Pane
Any editing changes in the Chromatogram Pane are immediately reflected in the Sequence
Pane and vice versa. Regions of the sequence may be copied and pasted to/from the Clipboard.
Showing/Hiding Traces
By default, all traces are shown in the Chromatogram Pane of the Fragment Viewer. Traces for
each base can be toggled off and on independently in the Chromatogram Pane. Choose View >
Show Traces > <base> Trace from the menu or click the Show Trace button for the particular
base on the toolbar to hide (or show) the trace for that base.
Navigating the Chromatogram Pane Using the Keyboard
Standard keyboard arrow keys can be used to navigate the chromatogram.
A way to define an exact cursor position is to pause the cursor over a residue for a moment
allowing a popup label to identify its position. The tooltip displays the peak height for all 4
traces. In addition, if the fragment has associated quality values, they will also be displayed.
To position the cursor specifically, press the Set cursor Position box on the status bar. In the
Set cursor Position dialog box that opens, enter the cursor position and click OK.
469
Vector NTI Advance 10 User’s Manual
Resizing the Chromatogram
Chromatograms may be resized to facilitate examination of peak shoulders To re-size the
chromatogram, use the Zoom In ( ) or Zoom Out ( ) buttons or select View > Zoom In
or Zoom Out or the corresponding commands on the shortcut menu. Chromatogram peak
height can be adjusted with the vertical slid control on the left side of the Chromatogram
Pane.
Fragment Viewer Operations
Editing a Sequence
If the fragment you are editing in the Fragment Viewer is not included in any assembly, then you
can edit that fragment freely. When you save your changes using the Fragment > Save As
command or by pressing CTRL-S, the fragment is not saved on a disk. Instead, the fragment in
the main fragments list in the current project is updated. To save your changes on disk, apply
your changes first in the Fragment Viewer, and then either save the current project or export the
fragment to disk. You can perform these operations in Project Explorer Window. See page 460
for more information on how to save projects and export fragments.
If the fragment you are viewing is included in a contig in this or another assembly , editing is disabled. If the fragment is in an assembly, but not part of any contig, editing is enabled.
You can edit the sequence in the Sequence or Chromatogram Panes in the same way you
would edit text in a word processor with the following exceptions:
z
In the Sequence Pane, only the direct strand can be edited. The complementary strand
is automatically updated.
z
In the Chromatogram Pane, only the top sequence can be edited. The original fragment
sequence at the bottom is included for reference only.
z
In both Chromatogram Pane and Sequence Pane, you can only replace one nucleotide
at a time.
The valid symbols you can enter are A, T, G, C, N and other acceptable ambiguous nucleotide designations specified by IUB codes (see Appendix C). Editing changes in either pane
are reflected in the other pane immediately.
Sequence editing techniques are detailed in the following table:
Editing
Operation
Action
Delete a
nucleotide
Position the cursor to the left of the symbol to be deleted and press DELETE. (If you
are editing in the chromatogram, you may also place the cursor to the right and
press BACKSPACE.) In the Sequence Pane, the base drops a row and an arrow
appears in its position. In the Chomatogram Pane, the position in the top sequence
of the chromatogram becomes a gap.
Insert a symbol
Select the sequence region to be cut. Press CTRL-X or choose Edit > Cut. The
selected symbols are deleted from the sequence (as above) and copied to the clipboard.
Replace a
symbol
Position the cursor where the new symbol is to be inserted in either Pane. Type a
valid symbol. The new symbol is inserted and a gap appears in the chromatogram
(if present).
Paste a
sequence
from the clipboard
Position the cursor where the symbols are to be inserted, or select the part of the
sequence you want to be replaced. Press CTRL-V or Edit > Paste…
Table 31.3 Sequence editing techniques
470
ContigExpress: Fragment and Contig Viewers Chapter 31
Editing
Operation
Cut a selection
Action
Select the symbol (or gap) in either Pane and type a valid new symbol. It replaces
the previous one (in the Sequence Pane, the previous symbol drops a row). Several
symbols can be replaced at one time: select them and enter the new symbols.
Table 31.3 Sequence editing techniques (continued)
Cut, Copy and Paste options are also available on the shortcut menu opened from the
Sequence Pane.
Calling Secondary Peaks
It is desirable at times to review secondary peaks in a chromatogram and change base calls.
The Edit menu command Call Secondary Peaks opens a dialog box to search for secondary
peaks that are at least some percentage of the highest peak at a base call position. Setting a
value and clicking OK replaces symbols in the fragment (Figure 31.8) as described above and
reports the number that were replaced. For further details on calling secondary peaks, refer to
Chapter 32.
Figure 31.8 Secondary peaks called at 80% level
Showing Deleted Peaks
By default, peaks for deleted bases are visible in the Chromatogram Pane. Peaks for deleted
bases can be removed by toggling View > Show Deleted Peaks from the menu or by clicking
off the Show Deleted Peaks toggle button on the toolbar. This action informs the user that the
fragment is entering Read-Only mode; viewing the fragment without deleted peaks does not
alter the sequence.
When deleted bases are showing, translations proceed through the deletions without considering them. With the deleted peaks removed, the fragment can be translated across a deletion in a
new reading frame and the validity of the deletion assessed. For more information regarding
Showing Deleted Peaks, see Chapter 17.
Revert to Experimental
The original sequence of a fragment may be restored after cumulative edits resulting from multiple operations, including edits performed in the Viewer, and Ends or Vector Contamination Trim-
471
Vector NTI Advance 10 User’s Manual
ming performed in the Explorer. In the Fragment menu, choose Revert to Experimental. This
option is disabled for fragments already in a contig.
Window Viewing Options
The following section summarizes display options available for the Fragment Viewer. Many of
the default options have been described already in context. Others have been alluded to briefly
or not at all.
To modify viewing options for the Fragment Viewer, click on the Viewing Options button (
)
on the Toolbar or select View > View Options. This opens the Fragment Viewing Options dialog
box (Figure 31.9):
Figure 31.9 View Options dialog – General tab
On the General tab, you can do the following:
z
Nucleotide Sequence: change the length of a single line of a sequence, the number of
blocks per line, single/double strand display in the Sequence Pane
z
Search: amend the default settings for the Find dialog box
z
Translation: select the use of three- or one-letter protein codes displayed in the
sequence translation.
z
Gaps: settings for the Do Not Count Gaps checkbox in the Set Cursor Position and Set
Selection dialog boxes. The second checkbox, Gap Chromatogram on Base Insertion(default on) controls how the chromatogram responds when new bases are inserted
into an editable sequence. You may either choose to gap a chromatogram upon base
insertion or insert a new base without a gap appearing in the chromatogram (deselect).
On the ORF tab, you can set the parameters for ORFs display in the Fragment Viewer (Figure
31.10):
Figure 31.10 View Options dialog-- ORF tab
472
ContigExpress: Fragment and Contig Viewers Chapter 31
z
Nested ORFs: Check the box to display ORFs that occur within the main ORF.
z
Minimum Size: Specify the minimum ORF size in codons that you want to display.
z
Start Codons: Define acceptable start codons.
z
Stop Codons: Define acceptable stop codons.
z
Defaults: Restores ORF dialog box default values.
Contig Viewer
Launching a Contig Viewer
To open a Contig Viewer, double-click on a contig in CE Project Explorer, or select Open on a
shortcut menu opened from a contig in Project Explorer.
Features of a Contig Viewer
The ContigExpress Contig Viewer (Figure 31.11) consists of a menu bar, two toolbars and is
divided into three panes: a Text Pane, a Graphics Pane and a Contig Alignment Pane. As
described above (Features of the ContigExpress Workspace), the panes can be organized in
different layouts.
A shortcut menu associated with specific folders or objects can be opened with a right click
while the cursor is on the object.
Note:
Most toolbar buttons have associated tool tips that explain the button function. Hover the cursor
over the button to display the tool tip for that button.
Main menu
Main toolbar
Pane selection toolbar
Pane toolbar
Text Pane
Graph Pane
Alignment
Pane
Figure 31.11 Contig Viewer - Standard Layout
As in the other Vector NTI Advance applications, to apply a command from the Main Menu in a
given pane, that pane must be active. The active pane can be toggled with the Switch Pane
buttons (
,
,
) in the Pane SelectionToolbar or by clicking in the pane you want to activate. You can also activate the panes with the F6 and SHIFT-F6 keyboard buttons.
473
Vector NTI Advance 10 User’s Manual
Find a Fragment
To rapidly locate a fragment in a Contig, the Find Fragment search dialog can be activated from
the Edit menu on all three panes. Enter a fragment name in the text window and click the Find
button (
) as shown in Figure 31.12. Asterisks (*) may be used as wild cards in the search in
accord with the specific syntax of the file names (e.g. *_*_1124*). Double-clicking on a Search
Result will highlight the fragment in all 3 panes.
Figure 31.12 Find Fragment dialog Wildcards (*) are used in accord with syntax of project file names
Text Pane
The Contig Viewer Text Pane contains a thorough description of the contig displayed in the
window.
Text Pane manipulations are outlined in the previous chapter and are also summarized in
Chapter 3.
The Text Pane data is divided into a hierarchy of folders and subfolders. A Contig Text Pane
can contain the following folders:
Folder
Contents
General description
Name, creation date, length, etc.
Comment
Arbitrary text of any length associated with the contig
Fragments
List of fragments contained in the contig
Table 31.4 Contig Text Pane folders
Graphics Pane
The Contig Viewer Graphics Pane (Figure 31.13) contains horizontal arrows representing the
relative positions of the fragments forming the contig. The arrowheads indicate whether the
respective fragment is in the direct or complementary strand, with the names of the fragments
displayed above the fragment lines. When either of the Graphics or Alignment Panes is active,
one of the fragments is always highlighted with another color (usually dark blue). This highlight
is coordinated with highlights in the Sequence Pane to allow you to locate the same fragment in
all panes.
474
ContigExpress: Fragment and Contig Viewers Chapter 31
When the Contig Viewer first opens, all data in the Graph pane is in the Fit to screen mode. In
this mode all the graphical data for the complete contig is always shown in the pane no matter
how you resize the pane.
If you want to examine a part of the graph pane, you can resize the pane using the Zoom and
Fit to Screen buttons. Resizing of the pane does not affect the current scale of the graph. For
more information on using the Zoom buttons, refer to Chapter 3.
475
Vector NTI Advance 10 User’s Manual
By default, zooming is done horizontally. If you want to zoom vertically, press CTRL + Zoom In
button (
).
Fragment line
Fragment name
Highlighted
fragment line
Weight bar
Figure 31.13 Details of contig Graphics Pane
476
Scale with
position markers
Coverage bar
ContigExpress: Fragment and Contig Viewers Chapter 31
Contig Coverage in the Graphics Pane
You can view a graphical representation of contig coverage in the Graphics Pane. Display of the
contig coverage graphic in the Graphics Pane view (Figure 31.14), can be turned off/on by
Show Contig Coverage in the View menu or the toolbar button (
:
Figure 31.14 Contig coverage bar- coverage category summarized in tooltip
The Contig Coverage graphic appears as a bar, which spans the length of the contig and contains segments of varying pattern/color that represent the amount and type of fragment coverage in that segment. If you hover the cursor over a segment, a tooltip appears describing the
coverage type/amount and segment coordinates. Types of coverage include the following:
z
Single Fragment – area is covered by one fragment only.
z
Multiple Fragments Same Direction – area is covered by two or more fragments that
run in the same direction.
z
Both Directions – area is covered by at least two fragments that run in opposite directions.
z
Multiple Fragments Both Directions – area is covered by more than two pairs of fragments that run in both directions.
Weight Graph
Below the Contig Coverage bar is a scale or Weight Graph, for this contig. The Weight Graph
gives an overview of assembly quality. You may note small green vertical lines dropping below
the horizontal . If you position your cursor at one of those sites and click the Zoom In button
repeatedly, you can see the exact nucleotide placement of each line in the graph. You will also
note the negative peak in the Weight graph line, indicating a position where the assembly is
477
Vector NTI Advance 10 User’s Manual
poor (Figure 31.15). Refer to the same position(s) in the chromatogram (if available) and you will
see poorly resolved peaks.
Figure 31.15 A Negative peak in the Weight graph line indicates poorly resolved nucleotides. This is indicated
both in the alignment and on the chromatogram
In the Weight Graph, each combination of two possible sequence symbols is assigned a certain
weight. By default, the highest weights are given to combinations of equal symbols, for example,
“AA” or “CC”. The weights can be changed in the Viewing Options dialog of the Contig Viewer.
At each position in the contig, the weight is calculated from all symbols in the fragments available for this position and from the consensus symbol. The resulting weight is plotted as a point
in the Weight Graph. Dips in the line isolate places where the assembly is poor or nucleotides
are mismatched.
Showing ORFs in the Graphics Pane
ORFs can be shown for the fragments in the Graphics Pane. Choose Show ORFs from the
View menu or click the Show ORFs button on the Toolbar to add an ORFs display to the Graph-
478
ContigExpress: Fragment and Contig Viewers Chapter 31
ics Pane. Parameters defining an ORF may be altered on the ORF tab on the Viewing Options
dialog (accessed from the View menu or the Viewing Options toolbar button) .
Figure 31.16 ORF analysis of contig generated from fragments of HS3454_C02
In Figure 31.16, the three bars between the Contig Coverage and Weight Graphs represent the
3 forward reading frames of the contig, and the green segments indicate the location of their
respective ORFs . Hovering the cursor on a green segment displays a tooltip with the ORF coordinates. Clicking on it highlights that ORF in both the Graphics and Alignment Panes.
Open a Fragment In Another Window
Open fragment(s) in a Fragment Viewer by double-clicking on the fragment line in the
Graphics Pane, or the fragment name in the Alignment Pane.
Camera Specifics
While you can use the Camera feature to copy pane contents, only the currently visible portion is copied to the clipboard or file. In this pane, the Camera cannot copy entire selections.
The data is copied to the clipboard or file in the Windows metafile format (WMF).
For more information on the Camera copy feature, refer to Chapter 3.
Alignment Pane
The Contig Alignment Pane (Figure 31.17) displays the nucleotide sequences of the fragments
that form the contig with overlapping regions aligned appropriately and displayed relative to their
positions in the contig. ORFs and translations can be identified and displayed. You can edit the
sequences here and see how your actions are reflected in the contig alignment and consensus.
The respective chromatograms for the sequences, also aligned appropriately, can also be dis-
479
Vector NTI Advance 10 User’s Manual
played on command. Also, a Comparison Report can be generated between any 2 fragments, or
a fragment and the consensus.
Fragment names list
Fragment current
position
Fragment sequence
(partially selected)
Consensus sequence
Scale
Consensus sequence
Figure 31.17 Details of Contig Alignment Pane
The Contig Alignment Pane has the following main elements:
480
z
The fragments names list (at the left) contains all fragments that are used in this contig.
z
The fragment current position is the relative position of the left end of the fragment
(counted from the fragment start) that is currently shown.
z
The scale (above the chromatogram alignments) gives a reference nucleotide position
for all fragments and the consensus shown in the alignment.
z
The consensus sequence (nucleotide format) shows the nucleotide consensus for
the assembly.
z
The consensus sequence (symbol format) shows the symbol consensus for the
assembly. In the symbol consensus, blank spaces indicate identical residues, dots (•)
indicate positions containing Ns and plus symbols (+) indicate ambiguity and/or gaps.
z
When expanded (select fragment > Show Chromatogram), the fragment track (Figure
31.18) shows from top to bottom, an editable sequence, the non-editable sequence in
dye-associated colors, and a chromatogram (if available and switched on). By hovering
the cursor over a position in a fragment, a tooltip displays the original position of the
base in the fragment. If the fragment has associated quality values, they are also displayed in the tooltip. This is useful in resolving an ambiguous position, if the outlier base
has a low QV.
ContigExpress: Fragment and Contig Viewers Chapter 31
When either the Graphics or Alignment Panes is active, one of the fragments is always highlighted (by name in the fragment names list at the far left) and selected concurrently in other
pane. To highlight another fragment, simply click on it with the left mouse button.
Figure 31.18 Details of a fragment track in the Chromatogram Pane
Finding a Sequence
A specific fragment sequence can be found in the Alignment Pane using the Find feature. Click
on a fragment name in the Alignment pane list to select it. Launch the Find sequence dialog box
)on the toolbar.
either by choosing Edit > Find from the menu or by clicking the Find button (
When the Find dialog box (Figure 31.19) appears, type in the sequence you want to find.
Figure 31.19 Find a Sequence dialog
Click the Find Next button. If the sequence is found, the Alignment Pane displays the region
where the sequence has been found and highlights the area. If gaps were introduced into the
fragment being searched, they are ignored.
Identifying Ambiguous Positions in the Contig
The Alignment Pane can be configured for various text and background displays. Options are
accessed on the Fragments Highlight tab from the View menu > View Options, or the respective Toolbar button (
). The default settings (Highlight Subject = Ambiguity) and colors use a
yellow background to highlight ambiguous positions, and red characters to identify the base
calls in a fragment that differ from the contig consensus sequence at that position.
Find Next/Previous Ambiguous Symbol
To search a fragment or a contig consensus sequence for ambiguous positions or symbols (“N”
or “R”), click on the Find Previous (
Find Previous or Next Ambiguous.
) or Next Ambiguous (
) buttons or select View >
If you start this search with a sequence selected, the search proceeds from the selection in the
specified direction. If there is no selection, the search starts from the start (Find Next) or the end
(Find Previous) of the contig.
481
Vector NTI Advance 10 User’s Manual
If an ambiguous position or symbol is found, its position is selected and displayed. If there are
no more ambiguous symbols in the specified direction, you are informed as such.
Generating a Difference Report
You can generate a Difference Report between any 2 selected fragments, or a fragment and the
consensus. Select on the fragment name in the fragment names list and use the Compare To…
command in the View menu or shortcut menu. In the Difference Report dialog, select a target for
comparison from the combo box menu and click Compare. The resulting Report (Figure 31.19)
may be saved to a folder and opened in a text editing program.
Figure 31.20 Difference Report between a fragment and the contig consensus
Switch the Fragment’s Chromatogram On/Off
To alternate the display of the chromatogram of the highlighted fragment, click on the Show/
on the Pane Toolbar or select Show/Hide All Chromatogram
Hide Chromatogram button(
on the shortcut menu. You can also select View > Show/Hide All Chromatograms from the
menu bar. If the fragment does not have a chromatogram, these actions are disabled.
Repositioning a Fragment
Any fragment in the Alignment Pane can be moved vertically to bring it alongside any other fragment (or the consensus). Simply select the fragment name in the fragment names list, and drag
it to the new position. (In contigs generated in Lite Contig mode, use the shortcut commands
Move Fragment Up/Down.
Customizing Fragment Color in the Sequence Pane
You can customize the color of the text and its background in the Sequence Pane. For more
information on customizing Sequence Pane text color, see Window Viewing Options, page 472.
Consensus Calculation and Display
The CAP3 algorithm calculates a consensus by weighted averages. The default display of the
consensus sequence is according to the most probable base at a position, using QV scores
when available. Alternative displays (i.e. using IUPAC ambiguity symbols) are available through
482
ContigExpress: Fragment and Contig Viewers Chapter 31
the Viewing Options dialog > Consensus tab, from the View menu or Toolbar button
(
).
Positioning the Consensus
When the Contig Viewer is first opened, the consensus sequence (nucleotide and symbol formats) are displayed at the bottom of the alignment. This can be changed by clicking on the
shortcut menu anywhere in the Alignment Pane to display both formats at the top of the pane,
thus juxtaposing the consensus and the scale. Wherever the consensus is placed, any fragment
can be positioned alongside it for comparison by dragging or by using the vertical scroll bars on
the right side of the pane. Extended vertical scrolling from the Toolbar (
) is available for
contigs that contain a large number of fragments which cannot easily be viewed simultaneously
on screen.
Translating the Consensus Sequence
The Alignment pane can display amino acid translations using standard translation, below (or
above) the consensus sequence, in any or all forward reading frames, by toggling the respective
buttons on the View menu > Consensus Translation the shortcut menu, or the Toolbar. Ambiguous positions in the consensus are translated as a single, defined amino acid if codon degeneracy permits (i.e. GGN = Gly). Gaps in the consensus are ignored in the translations, as they
are in ORF calculation. The Toolbar button (
) allows display in single-letter or three letter
codes. To search the consensus for a reading frame that supports a specific conceptual translation, select the consensus, activate Set Translation Frame(s) from the View or shortcut menu,
and type or paste in an amino acid string in single-letter code (Figure 31.21). You can also
check/uncheck translation frames.
Figure 31.21 Enter an amino acid string and search for a supporting reading frame
Additional operations can be performed when the Contig Viewer is placed in Edit Mode. These
are described in the next section.
Editing Contig Fragments or Consensus
Placing the Contig Viewer in Edit Mode from the Toolbar button (
) allows you to edit the
fragments that comprise the contig, change their positions or orientation or edit the consensus
itself. In general, operations that alter the consensus sequence must be done in Edit mode.
Obvious examples are insertions, deletion or replacements to a fragment or consensus, and
shifting fragments or blocks. Some non-obvious operations are reverse complementing fragments or contigs, and declaring a reference sequence (the reference sequence is dropped from
consensus calculation).
All editing changes in the fragments cause an immediate recalculation and redisplay of the contig’s consensus sequence. If necessary, editing changes in the contig consensus are reflected
immediately in the fragment sequences that comprise the contig.
483
Vector NTI Advance 10 User’s Manual
Although the basic sequence editing techniques are the same as in the Sequence Pane of the
Fragment Viewer, there are some editing limitations and specifics because the fragments are
incorporated in a contig. Since fragments in a contig can also be present in contigs from other
assemblies in the project, such edits are allowed only after you confirm that you are aware that
any other assemblies containing the fragment may be dismissed.
Figure 31.22 Warning message regarding editing the contig
Note:
This warning only appears the first time you attempt editing changes (Figure 31.22). If you
select Yes, you will be allowed to continue making more changes without warning. Click Yes to
accept the changes. If you check the Make contig read-only box, the Yes option is disabled. If
you select No, you are returned to the Contig Viewer.
If your changes are base deletions, the nucleotides are deleted from the chromatogram and the
gap is closed. Bases to the right of the deleted region now move to the left and a vertical marker
appears in the sequence at the position of the deletion. (If the base being deleted is at the left
end of a fragment as positioned in the contig, there is an option of not moving the remaining
bases to the left: Viewing Options > General tab > Keep position). The consensus is updated.
If the fragment track is displayed (with or without chromatogram), you can compare the edited
sequence with the original sequence (dye-associated) below it. Also, if you open the edited fragment in the Fragment Viewer, the editing changes are reflected in the sequence.
To help you track edits in the contig, new symbols arising from insertions and replacements in
the fragments are displayed in a teal color. Positions where a deletion occurred are indicted by a
vertical red bar. These indicators are preserved for later reference when the edited contig is
saved and closed.
Note on Editing Lite Contigs
When a lite contig is generated, the “fragments” seen in the contig are no longer distinct entities.
Edits performed on sequences in the Contig Viewer are not transferred to the original fragments,
but to local sequence copies that are part of the contig. Since the edited sequences are not distinct entities, they cannot be reassembled.
If you nonetheless want to reassemble the edited sequences, in the List Pane select all the fragments comprising the contig (not the contig itself). From the shortcut menu, choose Export
Fragment > to GenBank or FASTA format. This will save the edited sequences in a multiple
sequence file which can then be reloaded into Contig Express for further processing
Editing Commands
The following operations require the Contig Viewer to be in Edit mode (
). Once this is done,
several Toolbar buttons become active. Many, though not all operations can be performed similarly in the Graphics Pane or the Contig Alignment Pane, with the results synchronized to the
other pane. Note that positioning the cursor and making a selection are not identical actions and
the following operations may require one but not the other.
Insert Bases or Gaps
In the Alignment Pane, position the cursor immediately ahead of the desired position in a fragment or the consensus and type one or more bases. IUPAC symbols are accepted. All symbols
484
ContigExpress: Fragment and Contig Viewers Chapter 31
are case-insensitive and always displayed in upper case. To insert a gap, use the keyboard
space bar. A gap position is represented by a dash (-). Insertions in a fragment will update the
consensus. Insertions made in the consensus will be updated to all fragments that map to that
position in the consensus.
Delete Bases or Gaps
In the Alignment Pane, position the cursor immediately ahead of the desired position in a fragment or the consensus and press the Delete button on the keyboard one or more times. You can
also select a continuous stretch of bases and use the keyboard Delete button to remove them.
Bases and gaps are deleted in the same way. Deletions in a fragment will update the consensus. Deletions made in the consensus will be updated to all fragments that map to that position
in the consensus.
Replace Bases or Gaps
In the Alignment Pane, select a single position in a fragment or the consensus and type the
replacement from the keyboard. Replacement is disabled if more than one position is selected.
Only IUPAC accepted symbols are accepted. Bases and gaps are replaced in the same way.
However, replacing a base with a gap requires that the base first be deleted, and then a gap
inserted in its place. A replacement in a fragment will update the consensus. A replacement in
the consensus will be updated to all fragments that map to that position in the consensus. Note
that at an ambiguous position in the contig, overtyping the consensus with the current symbol is
not a replacement and does not update disagreeing fragments.
Translating the Consensus
The consensus sequence translation can be displayed in the Alignment Pane in any one or all of
the three direct frames. Display (or hide) the consensus translation in a particular frame by
choosing the corresponding View > Consensus Translation > Frame <#> command from the
Main Menu or by clicking its Consensus Translation - <#> Frame button counterpart.
Common Operations in the Graphics and Contig Alignment Panes
The following operations can be performed similarly in the the Graphics Pane and the Contig
Alignment Pane.
Highlighting a Fragment
The following commands require that a fragment or block be highlighted. To highlight a fragment, click on a fragment “arrow” of a Contig in the Graphic Pane or on a fragment name in the
Alignment Pane fragments name list. The same fragment is concurrently selected in other
panes of the window.
Moving a Fragment
This action changes the position of a fragment in the contig. It is possible only when there are
adjacent gaps in the direction of its movement or if the fragment relocation does not create any
gaps in the contig.
There are multiple methods for moving a highlighted fragment in the contig
1. Press the keyboard CTRL button and continuously select a fragment. You will see a drag
icon (
) and you can drag the fragment to the new location. The new position of the fragment is shown in both a pop-up label and the workspace Status Bar. Release the mouse to
drop the fragment into its new location. Fragment moving is cancelled if you switch to
another window before dropping the fragment. Since moving a fragment is not allowed to
introduce gaps into the contig, your ability to drag will be appropriately limited.
485
Vector NTI Advance 10 User’s Manual
2. Select View > Move Fragment … or the corresponding command on the shortcut menu. In
the dialog box that opens, enter the number of bases and direction (right or left). A text message calculates the permitted range of the move, given the rules described above. Click OK
to move the fragment to the new position. The contig consensus is recalculated.
) one
3. Click one of the Move Fragment buttons on the Toolbar. On two buttons (
click moves the highlighted fragment one position in the respective direction. When movement in any direction is no longer possible, the respective button becomes disabled. The
third button opens the dialog described above, to enter a range and direction.
For each of these actions, the consensus is recalculated and all panes of the Contig Viewer are
updated. Use the Undo/Redo buttons to reverse or repeat each movement.
Move a Highlighted Sequence Block in the Alignment Pane
Blocks of sequence within a fragment may be moved left or right to close a gap. This is often
done on blocks that are short enough to be viewed on-screen in their entirety. Highlight such a
block in a fragment by double-clicking anywhere within it in the Alignment Pane. Click on the
Move block to the left/right buttons (
) to shift the block one position at a time. You
can click repeatedly to move the block over several gapped positions. Once there is no longer a
gap in that direction, the button is disabled. Moving blocks in the consensus sequence is not
permitted.
Reverse Complement a Fragment or Contig
To reverse a fragment, highlight the fragment, click the Reverse Complement Fragment button
(
) frrom the Toolbar, or select Reverse Complement Fragment from the View or shortcut
menu. The fragment will be reverse complemented, the contig consensus is recalculated and all
panes of the Contig Viewer are updated.
To reverse complement the entire contig, use the command Reverse Complement Contig
from the View or shortcut menu.
Declare a Reference Sequence
For use in specific situations, you can declare a fragment a reference sequence. The use of a
reference sequence in a contig will be described more fully below. For now, it is sufficient to
know that declaring a fragment a reference sequence is a form of editing, since the effect is to
remove it from consensus calculation. The consensus is therefore recalculated for the remaining fragments in the contig. To make a reference sequence declaration, select the intended fragment and choose Reference Sequence from the context-sensitive shortcut menu.
Use of a Reference Sequence
For workflows in applications such as comparative genomics or forensics, it is useful to include
a reference sequence in the assembly. Such a sequence may be introduced into ContigExpress
in any supported file format and may or may not include a chromatogram. Add the reference
sequence to the project in the Explorer List Pane and include it in the assembly. In the Contig
Viewer, select the reference sequence in the Alignment Pane fragment names list, and click
Reference Sequence from the shortcut menu. (This action is not permitted unless the Viewer is
in Edit mode.) Only one sequence may be designated as reference at any one time in a contig.
The selected sequence reappears in lower case letters and pink highlight (Figure 31.23). Generally, it no longer contributes to the consensus calculation or any analysis derived from it (ambiguity, protein translation, etc.). However if the reference constitutes single coverage anywhere
in the contig, it will define the consensus for that domain. The reference sequence can be
486
ContigExpress: Fragment and Contig Viewers Chapter 31
moved vertically in the names list to facilitate comparison with any other sequence, and in Difference Reports (page 482) it can be compared to any fragment or the recalculated consensus.
Figure 31.23 Reference Sequence AF043045 supports calling G at positions 2440 and 2442 of contig generated
from fragments of HS3454_C02
Note: If any fragment in an assembly lacks QV scores (e.g. a .gb file intended as a reference
sequence), QVs associated with all other fragments will be ignored during assembly. To avoid
such omissions first exclude the reference from assembly, then re-assemble the resulting contig
with the reference sequence.
Window Viewing Options
The following section summarizes various review and display options available for the Alignment Pane. Many of the default options have been described already in context. Other alternatives have been alluded to briefly or not at all.
The Contig View Options dialog box (Figure 31.24) for may be opened from the View menu >
View Options, or by clicking on the Viewing Options button (
) on the Toolbar. The Contig
Viewing Options dialog box has five tabs for setting various Contig Viewer viewing parameters.
You can save configured settings to a file using the Save button and load previously saved settings in using the Load button.
General Tab
By default, the Contig Viewing Options dialog box opens to the General tab (Figure 31.24):
Figure 31.24 Contig Viewing Options dialog – General tab
z
Gaps – Check the Do Not Count Gaps…. check box if you want to ignore gaps in the
assembled sequence when setting a selection or position via the Set Selection or Set
487
Vector NTI Advance 10 User’s Manual
Cursor methods. This option is useful when you want to navigate the Viewer following
the original numbering scheme of a fragment.
z
On Delete 5’ End – Select the option to keep a fragment in its current aligned position or
move it to the left when you delete bases from its left end as it appears in the contig.
Fragment Highlights Tab
The Fragment Highlights tab (Figure 31.25) controls custom highlighting and coloring options for
the text and background in the Alignment Pane of the Contig Viewer.
Figure 31.25 Contig Viewing Options dialog – Fragment Highlights tab
z
488
Highlight Subject – Determines the subject of highlighting/coloring that appears in the
Alignment Pane.
o
Bases – Choose to color/highlight the text or background of individual bases in the
Alignment Pane using chromatogram default colors (T – red, A – green, G – black, C
– blue). Note that you cannot change the color schemes for the Text selection.
o
Columns – This provides a color scheme to columns in the alignment, based on several criteria:
Ambiguity is the default option. This provides a color background to any column with
any base disagreements, and a counter color to the specific bases in that column that
disagree with the consensus. A palette of colors is provided for the user to choose
from, from the Basic Background Color and Text Color drop down menus.
Probability – Allows you to highlight the background based on the quality of the
assembly at each position.
None –No coloring/highlighting of the sequence in the Alignment Pane.
z
Probability Highlight – Controls color choice and dynamic range for the column highlight subject. The ATG graphic on the right provides a preview of how the current highlight configuration will appear in the Alignment Pane.
z
Brightness – Controls the color brightness for minimum and maximum probability shading (i.e. choose to indicate higher probability with a higher or lower degree of shading).
z
Min/Max Probability (%) – Designates the percent range that the ATG probability shading example pertains to. Narrowing the range displayed, allows for finer color gradation
within the entire range.
ContigExpress: Fragment and Contig Viewers Chapter 31
Weight Table Tab
The Weight Table tab (Figure 31.26) allows you change the nucleotide symbol weight coefficients used in calculating the Weight Graph data in the Graphics Pane.
Figure 31.26 Contig Viewing Options dialog – Weight Table tab
To change a coefficient for any nucleotide symbol pair, click in the table cell that is formed by the
intersection of the nucleotide pair and enter a new value. The table has diagonal symmetry
because the order of the symbols in the pair is irrelevant; the changes in one half of the table are
instantly mirrored in the other half.
ORF Tab
In the ORF tab (Figure 31.27), you can define parameters for ORFs displayed in the Contig
Viewer Graphics and Alignment Panes.
Figure 31.27 Contig Viewing Options dialog – ORF tab
Start and stop codons can be defined here, as well as the minimum codon size for the search,
whether or not to include the stop codon in the ORF, and whether or not nested ORFs will be
displayed. Clicking the Defaults button restores ORF parameters to their default values.
489
Vector NTI Advance 10 User’s Manual
Consensus Tab
The Consensus tab (Figure 31.28) controls parameters affecting calculation of the contig consensus sequence displayed in the Alignment Pane.
Figure 31.28 Contig Viewing Options dialog – Consensus tab
z
Consensus Calling Algorithm – Determines how ambiguous positions are displayed in
the consensus.
o
Most Probable Base – The base call will be the most probable base at the position,
determined by base frequency alone, or base frequency and quality values.
o
IUPAC Nomenclature – The base call will use the respective IUPAC codes designated for ambiguous positions (see Appendix C for a list of IUPAC conventions).
o
Stringency – The base call will be N if the Set Probability Threshold (see below) is
un-checked. If checked, it will call the most probable base when the probability is
above the set threshold, but call N if it is below.
z
Determine Probability By – Sets the method used for determining probability. Probability can be based on frequency of occurrence or on base frequency and Phred quality
values (see Importing Phred Quality Values, page 416). If the latter is checked but there
are no such values in the fragments, determination will be by most frequent occurrence.
z
aSet
Probability Threshold – For Stringency and IUPAC Nomenclature calling algorithms, allows you to set a threshold, above which the most probable base is called, but
below which N is used.
Copy and Camera Features
The Copy feature is the same as in other panes except that only the selected part of a highlighted fragment is copied.
490
ContigExpress: Fragment and Contig Viewers Chapter 31
The Camera feature for this pane works in a slightly different manner than it does in other windows. When you select this action, you will see the Camera dialog box (Figure 31.29):
Figure 31.29 Camera dialog
In the Metafile format, only the currently visible part of the Alignment Pane can be copied to the
clipboard. The data is copied in the Windows metafile format (WMF).
In the Text format, you can select whether you want to copy a current selection or all data available in the contig (it is not limited to the visible part). You can also set wrapping of the copied
sequences at every nth position. The data is copied in the plain text and Rich Text (RTF) formats.
Check the Exclude Consensus text box to exclude the contig sequence from the copied text in
the Sequence Pane (this feature does not exist in the Graphics Pane Camera dialog box).
491
Vector NTI Advance 10 User’s Manual
492
C
H A P T E R
32
CONTIGEXPRESS: GROUP OPERATIONS ON FRAGMENTS
Introduction
This chapter consists of operations performed on fragments to optimize contig assembly. Operatio