1
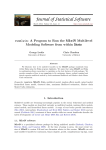
Click Fill grid Click Predict Click Plot grid In the Customised prediction plot window Select Y: median.pred Select X: standlrt.pred Select Grouped by: avslrt.pred Click Apply Which produces: The graph shows how the probability of passing increases as pupil intake ability increases, with the increase being stronger for those in high ability peer groups. We now explore the differences between low and high ability peer groups as functions of standlrt and assess if and where those differences are significant. In the Customised predictions window Select Differences; from variable: avslrt Reference value: −0.5 Press the Predict button In the Customised prediction plots window Select 95% confidence interval: Click Apply 38