1
&KDSWHU
0DWHULDOV7HVWLQJ6RLODQG&RQFUHWH
7RSLFV
1.0.0
Soil Origin
2.0.0
Physical Characteristics of Soils
3.0.0
Soil Classification
4.0.0
Soil Sampling
5.0.0
Soil Testing
6.0.0
Concrete Testing
To hear audio, click on the box.
2YHUYLHZ
Natural earth is the ultimate foundation for any road, airfield, building, or other structure.
Regardless of their designated purpose, all structures are supported by one of the
earth’s construction materials: soil. Because soil is the ultimate foundation for any
project, it may be the most important of all building materials. Just as a poorly
constructed and weak concrete foundation will not support a building, neither will a
poorly “constructed” and weak soil foundation support a well-constructed concrete
foundation.
This chapter will offer the definition of soil, and introduce you to the different types of
soil you may encounter during the wide range of projects Seabees undertake.
It will also present the basic properties and characteristics of soil and explain the
importance those characteristics play in determining adequacy and classification for use
as a construction material.
As an EA, you will be responsible for collecting soil samples and performing certain
testing .This chapter will provide guidance on those procedures as well as explain their
importance in properly and correctly identifying and classifying the many types of soil
that exist in nature.
Finally, this chapter will also acquaint you with various tests for concrete and explain
their purposes and importance as well. You will learn how to perform certain tests
yourself and how to prepare concrete samples for other tests that will be performed by
EAs that are more senior.
Whether the project is a structure with concrete or a road or revetment without concrete,
soil is the foundation, and you as an EA, must gain the skills to determine its
usefulness.
9B!
&1)$
)7
2EMHFWLYHV
When you have completed this chapter, you will be able to do the following:
1. Identify the different types of soil origins.
2. Identify the physical characteristics of soils.
3. Describe the different classifications of soil.
4. Describe the procedures associated with soil sampling.
5. Describe the procedures associated with soil testing.
6. Describe the procedures associated with concrete testing.
3UHUHTXLVLWHV
None
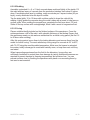
This course map shows all of the chapters in Engineering Aid Basic. The suggested
training order begins at the bottom and proceeds up. Skill levels increase as you
advance on the course map.
Topographic Surveying and Mapping
Indirect Leveling/Level and Traverse Computations
E
N
G
Care and Adjustment of Survey Equipment
I
Materials Testing: Soil and Concrete
N
Direct Leveling and Basic Engineering Surveys
E
Horizontal Control
E
Direct Linear Measurements and Field Survey Safety
R
Surveying: Elements and Equipment
Construction Drawings
I
N
G
Electrical: Systems and Plans
Mechanical: Systems and Plans
AID
Concrete and Masonry
Wood and Light Frame Structures
Drafting: Projections and Sketching
B
A
S
Drafting: Geometric Construction
I
Drafting: Fundamentals and Techniques
C
Drafting: Equipment
Mathematics and Units of Measurement
Engineering Aid Rating
9B!
&1)$
)7
)HDWXUHVRIWKLV0DQXDO
This manual has several features which make it easy to use online.
Figure and table numbers in the text are italicized. The figure or table is either
next to or below the text that refers to it.
The first time a glossary term appears in the text, it is bold and italicized. When
your cursor crosses over that word or phrase, a popup box displays with the
appropriate definition.
Audio and video clips are included in the text, with an italicized instruction telling
you where to click to activate it.
Review questions that apply to a section are listed under the Test Your
Knowledge banner at the end of the section. Select the answer you choose. If the
answer is correct, you will be taken to the next section heading. If the answer is
incorrect, you will be taken to the area in the chapter where the information is for
review. When you have completed your review, select anywhere in that area to
return to the review question. Try to answer the question again.
Review questions are included at the end of this chapter. Select the answer you
choose. If the answer is correct, you will be taken to the next question. If the
answer is incorrect, you will be taken to the area in the chapter where the
information is for review. When you have completed your review, select
anywhere in that area to return to the review question. Try to answer the question
again.
9B!
&1)$
)7
62,/25,*,1
One entry in Merriam-Webster’s Online Dictionary defines soil as “the upper layer of
earth that may be dug or plowed and in which plants grow.” While that may be one
correct definition and perfectly satisfactory to many groups of people, it does not
address the precision required by civil engineers and soil technicians.
For engineering and construction purposes, a more precise definition is this one, found
in Maintenance and Operation Manual 330 (MO-330) “Soil is a heterogeneous
aggregation of uncemented or weakly cemented mineral grains enclosing voids of
various sizes. These voids may contain air, water, organic matter, or different
combinations of these materials.” As you progress through this chapter, the aptness of
this definition for construction will become obvious, but let us consider where soil comes
from first.
6RLO)RUPDWLRQ
Soil formation is a continuous and evolutionary process still in action today. The Earth’s
crust consists of rock, which geologists classify into three groups:
Igneous — formed by cooling from a molten state
Sedimentary — formed by the accumulation and cementing of the particles and
remains of plants and animals
Metamorphic — formed from existing rocks that have been subjected to heat and
pressure
Exposed to the atmosphere, rock undergoes a physical and chemical process called
weathering, which decomposes the rock into a loose, incoherent mixture of gravel,
sand, and finer material. This process over a sufficient length of time disintegrates the
three rock types and produces soils of various designations.
5HVLGXDO6RLO
Residual soil is any soil that remains in place during the weathering process. A mantle
of residual soil will reflect the characteristics of the underlying parent rock from which it
was derived.
7UDQVSRUWHG6RLO
Transported soil is any soil that moved to a place other than its original location during
the weathering process. Transported soils often bear properties induced by its mode of
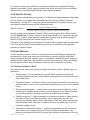
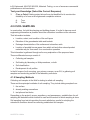
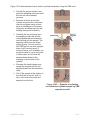
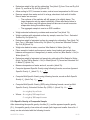
transportation such as water, wind, ice, and the force of gravity. $OOXYLDO6RLO
Alluvial [uh-ORR-vee-uh l] soil is formed when a river or stream with decreasing velocity
gradually loses its soil-transporting capacity. As a river’s velocity diminishes, it does not
have sufficient power to keep the large soil particles in suspension, and they settle to
the riverbed.
Typically, over time this further decreases the river’s velocity, which causes smaller
particles to settle. As the river becomes slow and sluggish (as in the lowlands where the
gradient becomes small), it transports only the extremely fine particles in suspension.
These finite particles settle at the mouth of the river where they form deltas of fine9B!
&1)$
)7&
grained soil. Prime examples of this are the Mississippi, Nile, Ganges, and Mekong
Deltas. (Figure 16-1)
)LJXUH²([DPSOHRIDOOXYLDOVRLOVWUDQVSRUWHGWRIRUPGHOWDV
0DULQH6RLO
Marine soil is also formed from materials carried into the seas by streams, but it
includes material eroded from the beaches by the tidal action of the waves. This tidal
and wave action carries part of the marine soil material out into deep water deposits
while another part of it is heaped back upon the beaches along the coast.
/DFXVWULQH6RLO
Lacustrine [luh-NXKV-trin] soils are transported soils deposited in freshwater lakes. They
are typically fine-grained soils, the result of being brought into freshwater lakes by
streams or rivers.
$HROLDQ6RLO
Aeolian [ee-RK-lee-uh n] soils are transported by wind rather than water. The build up of
heavier sand grain deposits from wind are called “dunes,” and the finer particles
(generally transported farther) are deposited to form a material called loess [ORK-es].
Dune deposits seldom contain material larger than sand size while loess is a finegrained, unstratified accumulation of clay and silt.
9B!
&1)$
)7
*ODFLDO6RLO
Glacial soil (or drift) is material transported by an advancing ice sheet. It could have
been pushed ahead, carried upon, or carried within the ice. As glaciers melt, deposits of
various forms occur, such as these:
Moraine [muh-UH\Q] — a mass of till (boulders, pebbles, sand, and mud)
deposited by a glacier, often in the form of a long ridge. Moraines typically form
because of the plowing effect of a moving glacier.
Kame [NH\P] terrace — an irregularly shaped hill or mound composed of sand,
gravel and till that accumulates in a depression on a retreating glacier.
Esker [HV-ker] — a long, narrow, steep-sided ridge of coarse sand and gravel
deposited by a stream flowing in or under a melting sheet of glacial ice.
Outwash plane — a glacial outwash plain formed of sediments deposited by
melting water at the terminus of a glacier.
&ROOXYLDO6RLO
Colluvial [kuh-ORR-vee-ahl] soil consists of mixed loose earth material that has
accumulated at the base of a hill through the action of gravity, such as piles of talus,
avalanche debris, and sheets of detritus moved by soil creep or frost action.
7HVW\RXU.QRZOHGJH6HOHFWWKH&RUUHFW5HVSRQVH
1.
What source provides a more precise definition of soil for engineering and
construction purposes?
A.
B.
C.
D.
Merriam-Webster’s Online Dictionary
American Society for Testing and Materials
Maintenance and Operation Manual 330
American Society of Civil Engineers
3+<6,&$/&+$5$&7(5,67,&62)62,/6
The physical characteristics of soils aid in determining their engineering characteristics
and are the basis of any soil classification system. In North America, the most common
engineering classification systems for soils are the Unified Soil Classification System
(USCS) and the American Association of State Highway and Transportation Officials
(AASHTO).
The Seabees, the military in general, and civilian engineering each use a system of soil
classification to identify and determine the suitability of soils for both vertical and
horizontal construction projects.
As an EA, your knowledge of these physical characteristics will aid in determining the
degree to which local soils can be used in engineering projects to support traffic loads
or to serve as a subgrade or foundation material.
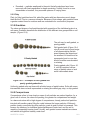
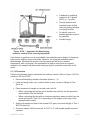
3DUWLFOH6L]H
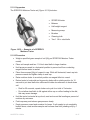
The size of the particle grains in the soil mass determines how the soils are divided into
groups. An EA identifies the particle grain sizes by using sieves.
A sieve is a screen attached across the end of a shallow cylindrical frame. (Figure 16-2)
The screen permits particles smaller than the openings to fall through while retaining
larger ones. When sieves of different sizes are stacked so the largest screen openings
9B!
&1)$
)7)
are at the top and the smallest at the bottom, soil can be separated into particle groups
based on size.
The amount remaining on each sieve can
then be measured and described as a
percentage by weight of the entire sample.
Table 16-1 shows only four of many size
groups used in the Unified Soil
Classification System.
Finer particles passing the No. 200 sieve
that exhibit plasticity and strength when
dry are called clays; those exhibiting nonplasticity and little strength when dry are
called silt.
)LJXUH²7\SLFDOVLHYHVXVHGIRU
SDUWLFOHVL]HLGHQWLILFDWLRQ
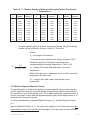
7DEOH²6DPSOHRI)RXU6L]H*URXSV8VHGLQWKH8QLILHG6RLO&ODVVLILFDWLRQ
6\VWHP86&6
6LHYH6L]H
6L]HJURXSV
3DVVLQJ
5HWDLQHGRQ
Cobbles----------------
No Maximum size*---------------
3 in.
Gravels-----------------
3 in.------------------------------------
No. 4
Sands-------------------
No. 4----------------------------------
No. 200
Fines--------------------
No. 200-------------------------------
No minimum size
*In military engineering, maximum size of cobbles is accepted as 40 inches, based upon
maximum jaw opening of the crushing unit.
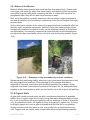
3DUWLFOH6KDSH
The shape of the particles influences the strength and stability of a soil. Bulky and platy
(Figure 16-3) are two general shapes recognized in the USCS and they may be located
within the same geological area.
9B!
&1)$
)7-
)LJXUH²([DPSOHVRIEXON\DQGSODW\SDUWLFOHVKDSHV
%XON\
Cobbles, gravel, sand, and silt particles cover a large range of sizes; however, they are
all bulky in shape. The term “bulky” is confined to particles that are relatively large in all
three dimensions, as contrasted to platy particles, in which one dimension is small as
compared to the other two.
The bulky shape has the following four subdivisions listed in descending order of
desirability for construction:
Angular —recently broken up particles characterized by jagged projections,
sharp ridges, and flat surfaces. Seldom found in nature because of weathering,
angular gravels and sands are generally the best materials for construction
because of their interlocking characteristics but must usually be produced
artificially by crushing.
Subangular — particles that have been weathered to the extent that the sharper
points and ridges have been worn off.
Subrounded — particles that have been further weathered and are still somewhat
irregular in shape but have no sharp corners and few flat areas. Frequently found
in streambeds, if composed of hard, durable particles, subrounded material is
adequate for most construction needs.
9B!
&1)$
)7%
Rounded — particles weathered to the point that all projections have been
removed, with few irregularities in shape remaining. Usually found in or near
streambeds or beaches, they resemble spheres of varying sizes.
3ODW\
Platy (or flaky) particles have flat, plate-like grains with two dimensions much larger
than the third. Clay is a common example. Because of their shape, platy particles have
a greater contact area for moisture and are undesirable for construction purposes.
*UDGDWLRQ
The sizes and shapes of soil particles deal with properties of the individual grains in a
soil mass. Gradation describes the distribution of the different size groups within a soil
sample. (Figure 16-4)
The soil may be well-graded, or
poorly-graded.
Well-graded soils (Figure 16-4,
view A) must have a good range
of all representative particle
sizes between the largest and
the smallest. All sizes must be
represented, and no one size
should be either overabundant
or missing.
Poorly-graded soils (Figure 164, view B) contain a narrow
range of particle sizes or lack
some intermediate sizes.
)LJXUH²([DPSOHVRIZHOOJUDGHGDQG
SRRUO\JUDGHGJUDGXDWLRQV
Uniformly graded soils are those with a limited range of particle sizes. Soils with some
intermediate sizes not well represented or missing are called gap, step, or skip graded.
&RPSDFWQHVV
Compactness refers to how closely a mass of soil particles are packed together; for a
given unit of volume, the closer the packing, the greater its compactness and weight.
In a dense structure with a high degree of compactness, closely packed soil particles
interlock with smaller grains filling the voids between the larger particles. With each
particle closely surrounded by other particles, grain-to-grain contact is increased. This
lessens the tendency for individual grain displacement under load, and the soil is
capable of supporting heavier loads. Usually, well-graded coarse materials are dense
and exhibit strength and stability under load.
9B!
&1)$
)7$
In a loose structure, the particles lack compactness and are not packed as closely
together as possible. Loose, open structures have voids, which will lead to foundation
settlement or to road disintegration when traffic loads are applied.
6SHFLILF*UDYLW\
Specific gravity, designated by the symbol Gs is defined as the ratio between the weight
per unit volume of a material and the weight per unit volume of water at a stated
temperature—usually 20°C. Using the system international (SI) (metric) system, you
can determine specific gravity by the following formula:
Specific gravity Gs weight of sample in air g weight of sample in air g weight of sample submerged g Specific gravity varies between 2.60 and 2.80 for most inorganic soils. While tropical,
iron-rich laterite [ODW-uh-rahyt], as well as some other lateritic soils, can have a specific
gravity of 3.0 or more, sand particles (composed of quartz) have a specific gravity of
about 2.65 and clays can have values as high as 3.50.
The solids of soil particles are composed of minerals with a specific gravity greater than
2.60. Any specific gravity values smaller than that are an indication of the possible
presence of organic matter.
6RLO0RLVWXUH
A soil’s moisture content is often the most important factor affecting its engineering
characteristics. Water may enter from the surface or move through the subsurface
layers by gravitational pull, capillary action, or absorption. Moisture to some degree is
present in most cases and it influences the various soils differently. Moisture probably
has the greatest effect upon soil behavior when the soil is subjected to loading.
6RXUFHVRI:DWHULQ6RLOV
Soil moisture may come from surface or subsurface water, gravity, capillary action, or
absorption.
Surface water — from precipitation or runoff, which enters the soil through
openings between particles. It may adhere to the particles or penetrate the soil to
some lower layer.
Subsurface water — collected or held in pools or layers beneath the surface by a
restricting layer of soil or rock and constantly acted upon by one or more external
forces.
Gravity-controlled water — seeks a lower layer and moves through the voids or
spaces until it reaches some restriction such as bedrock or an impervious layer
of soil with openings or voids are so small it prevents water passage.
Capillary moisture — voids or spaces form continuous tunnels or tubes causing
the water to rise in the tubes by capillary action; the smaller the tube, the
stronger the capillary action. Water rises higher in finer soils which have smaller
interconnected voids. The area of moisture above a free water layer or pool is
called the capillary fringe.
Atmosphere absorption moisture — moisture evaporates from the soil surface,
which draws more moisture from the soil below that also evaporates. This
process continues until the soil is in an air-dry condition (the moisture in the soil
9B!
&1)$
)71
is in equilibrium with the moisture vapor in the air). In an air-dry state, the
moisture in the soil is in the form of thin films of water surrounding individual soil
particles. This is called hydroscopic moisture. Hydroscopic moisture is the result
of naturally occurring electrical forces binding the water molecules to the soil
particles. This moisture may be removed from air-dried soil by heating the
material in an oven at a controlled temperature for 24 hours or until attaining a
constant weight.
The term “moisture content” (symbol W ) is used to define the amount of water present
in a soil sample. It is the ratio of the weight of water to the weight of the solid mineral
grains (weight of dry soil) expressed as a percentage.
Moisture content W weight of water
x 100
weight of dry soil
When a wet soil is air-dried in the laboratory without the use of controlled heating, the
amount of hydroscopic moisture remaining in the air-dried soil is called the hydroscopic
moisture content, also expressed as a percentage of the weight of the dry soil.
3ODVWLFLW\
Plasticity is a property of the fine-grained portion of a soil that allows it to be deformed
beyond the point of recovery without cracking or changing volume appreciably. Some
minerals (quartz powder for example) cannot be made plastic no matter how fine the
particles or how much water is added.
On the other hand, all clay minerals are plastic and can be rolled into thin threads at
certain moisture contents without crumbling. Since practically all fine-grained soils
contain some clay, most of them are plastic and the degree of plasticity is a general
index to the clay content of a soil.
“Fat” and “lean” are terms sometimes used to distinguish between highly plastic and
slightly plastic soils. For example, fat clay is highly plastic while lean clay is only slightly
plastic.
Plasticity is determined by observing the different physical states that a plastic soil
passes through as moisture conditions change. The boundaries between the different
states (described by the moisture content at the time of change) are called consistency
limits or Atterberg limits.
The liquid limit LL is the moisture content corresponding to the arbitrary limit between
the liquid and plastic state of a soil. Above this value, the soil is presumed to be a liquid
and behaves as such by flowing freely under its own weight. Below this value, provided
the soil exhibits a plastic state, it deforms under pressure without crumbling.
The plastic limit PL is the moisture content corresponding to the arbitrary limit
between the plastic and semisolid state. Above this value, the soil is no longer pliable
and crumbles under pressure.
The plasticity index PI is the numerical difference in moisture content between the
two limits, or the plastic range. It defines the range of moisture content within which the
soil is in a plastic state. The equation is PI LL PL .
The shrinkage limit SL is the water content boundary where further loss of moisture
will not result in any more volume reduction. Beyond this point, further drying does not
reduce the volume but may cause cracking.
9B!
&1)$
)7
(IIHFWVRI6RLO0RLVWXUH
Moisture affects coarse-grained soils much less than fine-grained soils. Coarser soils
have larger void openings, which drain more rapidly, and capillary action is practically
nonexistent in gravels and sands containing few fines. If coarse soils are above the
groundwater table, they will not retain large amounts of water.
Also, since the particles in gravelly and sandy soils are relatively large (compared to
clay and silt particles), they are heavy in comparison to the films of moisture that might
surround them.
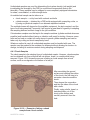
On the other hand, moisture in the voids of fine-grained soil has considerable effect on
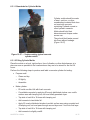
the light, small, sometimes microscopic, particles. Clays often undergo large volume
changes with variations in moisture content, as the shrinkage cracks in a dry lakebed
can demonstrate. Consequently, unpaved clay roads that may be solid enough when
sun-baked will often lose stability and turn into slick mud during rainy weather. (Figure
16-5)
)LJXUH²([DPSOHVRIFOD\URDGXQGHUGU\DQGZHWFRQGLWLRQV
Besides swelling and losing stability when wet, clays retard water drainage due to their
flat, platy shapes and small size. Since drainage is of the greatest importance,
especially in horizontal construction such as airfield pavement for example, design
engineers must know if subsurface clay exists at the project site. As addressed earlier,
plasticity is the characteristic by which you can identify clay in the project’s soil particles.
2UJDQLF6RLOV
Organic soils contain mineral grains but with a conspicuous admixture of vegetable
matter. Soils of organic origin are formed by the growth and subsequent decay of plant
life, by an accumulation of inorganic particles such as skeletons or shells of organisms,
or by a combination of both. An organic soil may be organic silt, organic clay, or it may
be a highly organic soil, such as peat or meadow mat with little silt or clay particles.
Organic soils are most often black in color, and usually have a characteristic musty
odor. Organic soils are usually easily compressible with poor load-bearing properties.
9B!
&1)$
)7
(IIHFWVRI6RLO&KDUDFWHULVWLFV
Soil characteristics are a definitive measure of the soil’s suitability to serve some
intended construction purpose. An understanding of these characteristics is essential for
determining the first step in preparing the earth’s foundation for a structure’s foundation,
or the subgrade for road or other horizontal project.
1. Dense, solid soil withstands greater applied loads (has greater load-bearing
capacity) than loose soil.
2. Particle size has a definite relation to load-bearing capacity. Coarse-grained soils
can be compacted to a greater density than fine-grained soils because the
smaller particles tend to fill the spaces between the larger ones.
3. The shape of the grains affects the bearing capacity. Angular particles tend to
interlock, form a denser mass, and become more stable than rounded particles,
which can roll or slide past one another.
4. Well-graded soils with a good range of particle sizes minimize voids. Poorlygraded soils, with their lack of one or more sizes, leave more or greater voids
and comprise a less dense mass.
5. Moisture content and consistency limits aid in describing the suitability of a soil.
Typically, coarse-grained sandy or gravelly soil has good drainage characteristics
for use in its natural state. Fine-grained clayey soil with a high plasticity index
may require considerable treatment, especially if used in a moist location.
7HVW\RXU.QRZOHGJH6HOHFWWKH&RUUHFW5HVSRQVH
2.
What initially determines how soils are divided into groups?
A.
B.
C.
D.
Gradation of the soil particles
Moisture of the soil particles
Shape of the soil particles
Size of the particle grains in the soil mass
62,/&/$66,),&$7,21
Soil type is an important factor when selecting the proper location on which to construct
any structure or facility, or when determining any necessary soil import amendment to a
predetermined location.
With the existing soil accurately identified and described, its suitability as foundation
material or for supporting traffic as a subgrade base can be determined, or it can be
evaluated for use as an aggregate, filler, or binder for an engineered compaction
mixture.
&ODVVLI\LQJ6RLOV
The Unified Soil Classification System (USCS) is a common soil classification and
reference system that has a universal interpretation. In this system, all soils are divided
into three major divisions.
&RDUVH*UDLQHG6RLOV
Coarse-grained soils have a soil mass where at least half of the material, by weight, is
larger than (retained on) a No. 200 sieve. (Table 16-2) This division is further divided as
gravels and sands. If more than half of the coarse fraction, by weight, is retained on a
9B!
&1)$
)7
No. 4 sieve, it is classified as a gravel. If less than half is retained on a No. 4 sieve, then
it is a sand. Gravels and sands are further subdivided into additional categories
dependent upon the amount and characteristics of any plastic fines the soil sample
contains.
7DEOH²86&6&ODVVLILFDWLRQIRU&RDUVH*UDLQHG6RLOV
Gravel
clean gravel <5% smaller
than #200 Sieve
Coarse grained soils
> 50% of coarse fraction
retained on No.4 (4.75 mm)
sieve
At least 50% retained on
No.200 (0.075 mm) sieve
Sand
clean sand
< 50% of coarse fraction
retained No.4 (4.75 mm)
sieve
sand with >12% fines
gravel with >12% fines
)LQH*UDLQHG6RLOV
Fine-grained soils have a soil mass where more than half of the material, by weight, is
smaller than (passes) a No. 200 sieve. (Table 16-3) The fine-grained soils are not
classified by grain size distribution but according to plasticity and compressibility.
7DEOH²86&6&ODVVLILFDWLRQIRU)LQH*UDLQHG6RLOV
Fine grained soils
More than 50% passes
No.200 (0.075 mm) sieve
silt and clay
liquid limit < 50
inorganic
silt and clay
liquid limit 50
inorganic
organic
organic
+LJKO\2UJDQLF6RLOV
Highly organic soils, such as peat, have too many undesirable characteristics for
consideration as foundations or use as construction material. The USCS has reserved a
special classification for these soils but without any further laboratory criteria.
These soils are usually readily identifiable in the field by their distinctive color, odor,
spongy feel, and frequently fibrous textures from their common components:
decomposed or decomposing leaves, grass, branches, or other fibrous vegetable
matter.
&ODVVLILFDWLRQ7HVWV
These three basic classifications, or divisions, are not the complete description of the
USCS or the methods used to classify soils. There are further and more detailed
descriptors of soils within the Unified Soil Classification System and in the American
Society for Testing and Materials (ASTM) International ASTM D2487 - 06e1, and ASTM
D2488. However, as an EA, you will be performing some of the basic tests (sieve
analysis and Atterberg limits) and you need to understand why you are performing the
tests and how the results are used. You must also know the importance of ensuring that
your test results are correct and reliable. Additional soil testing information is available
9B!
&1)$
)7&
in EA Advanced, NAVFAC MO-330, Materials Testing, or one of numerous commercial
publications on soil mechanics.
7HVW\RXU.QRZOHGJH6HOHFWWKH&RUUHFW5HVSRQVH
7UXHRU)DOVH Existing project site soil may be identified for its construction
suitability or for use as an engineered compaction mixture.
3.
A.
B.
True
False
62,/6$03/,1*
In construction, for both the planning and building phases, it is vital to have as much
engineering information as possible about the subsurface conditions at the site area.
That information includes:
Location, extent, and condition of the soil layers
Elevation of the groundwater table and bedrock
Drainage characteristics of the surface and subsurface soils
Location of possible borrow areas from which soil and other mineral-product
materials may be “borrowed” for a construction operation
This information is gathered through soil survey exploration of the proposed area.
These multifaceted surveys consist of:
Collecting soil samples
Soil testing by laboratory or field procedures, or both
Soil classification
Development of soil profiles
In the full scope of soil surveying, your primary concern, as an EA, is gathering soil
samples and conducting certain of the laboratory soils tests.
6DPSOLQJ0HWKRGV
Collecting soil samples in the field for testing is called soil sampling.
There are three principal methods of soil sampling. They include taking samples from:
1. the surface
2. already existing excavations
3. test pits and test holes
Depending on the project’s scope, expediency, and permanency, available time for soil
sampling will determine which method is used and the extent to which sampling is done.
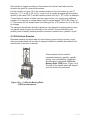
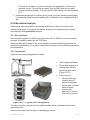
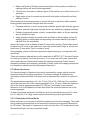
Soil sampling from test pits provides the most satisfactory results for studying the
natural soil conditions as well as collecting undisturbed soil samples.
9B!
&1)$
)7
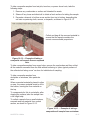
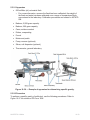
A test pit is an open
excavation large enough for
a person to enter. (Figure
16-6) Usually dug by hand,
digging can be expedited
by power equipment
(clamshell, dragline,
bulldozer, backhoe, powerdriven auger) when
available.
Excavations below the
groundwater table require
using caissons or lowering
the water table.
Excavations to 5 feet or
more may require shoring
and bracing to prevent
cave-ins.
Load-bearing tests can also
be performed on the soil in
the bottom of the pit.
)LJXUH²([DPSOHRIDVRLOVDPSOLQJWHVWSLW
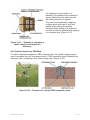
The most common method of
test hole exploration is by hand
auger. (Figure 16-7) Best suited
to cohesive soils, it can also be
used on less cohesive soils
above the water table providing
the individual aggregate
diameter is smaller than the
auger’s bit clearance.
Usually used for work at shallow
depths, with pipe extensions a
powered earth auger may be
used to a depth of about 30 feet
in relatively soft soils.
These samples are completely
disturbed but satisfactory for
determining soil profile,
classification, moisture content,
compaction capabilities, and
similar soil properties.
)LJXUH²([DPSOHVRIKDQGDXJHUVIRUWHVW
KROHVRLOVDPSOLQJ
9B!
&1)$
)7)
In a hasty soil survey, under expedient conditions or limited time, the number of test pits
and test holes is kept to a minimum by using existing excavations for soil sampling.
In a deliberate survey, where time and conditions allow a more thorough soil sampling
operation, test holes are used extensively and augmented by test pits, governed by the
judgment of the engineering officer.
Table 16-4 shows various methods of soil exploration and sampling in a condensed
form.
7DEOH²0HWKRGVRI6RLO([SORUDWLRQDQG6DPSOLQJ
&RPPRQ
QDPHRI
PHWKRG
0DWHULDOVLQ
ZKLFKXVHG
0HWKRGRI
DGYDQFLQJWKH
KROH
0HWKRGRI
VDPSOLQJ
9DOXHIRU
IRXQGDWLRQ
SXUSRVHV
Auger boring
Cohesive soils
and less
cohesive soils
above
groundwater
elevation
Augers rotated
until filled with
soil and then
removed to
surface
Samples
recovered from
material
brought up in
augers
Satisfactory for
highway
exploration at
shallow depths
Well drilling
All soils, rock,
and boulders Churn drilling
with power
machine
Bailed sample
of churned
material or clay
socket
Clay socket
samples are
dry samples.
Bailed samples
are valueless. Rotary drilling
All soils, rock,
and boulders
Rotating bits
operating in a
heavy
circulating
liquid
Samples
recovered from
circulating
liquid
Samples are of
no value.
Test pits
All soils.
Lowering of
groundwater
may be
necessary.
Hand digging or Samples taken
power
by hand from
excavation
original position
in ground
Materials can
be inspected in
natural
condition and
place.
7DJJLQJ6DPSOHV
For gathering information and compiling an accurate interpretation of the collected soil
data, you must label your soil samples correctly and systematically. Review the
following scenario for soil in a given area that is to be tested (such as a proposed
structure’s site).
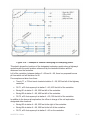
The officer in charge of soil exploration decides how many soil sampling points are
needed and where they must be located to produce a representative test of the soil in
the area. This information is recorded in a sketch like the one shown in Figure 16-8.
Refer to this figure often to follow the scenario.
9B!
&1)$
)7-
)LJXUH²([DPSOHRIDVNHWFKLGHQWLI\LQJVRLOVDPSOLQJSRLQWV
This sketch shows the locations of the designated exploratory points along a highway’s
centerline with the point locations referenced by the centerline stations and the
distances from the centerline.
Left of the centerline, between stations 2 + 80 and 4 + 60, there is a proposed borrow
pit from which soil will be taken for fill.
Five samples are taken from there.
Trench T1, a 75-foot trench located at station 3 + 20, 300 feet left of the highway
centerline
Pit P1, a 20-foot-square pit at station
Boring B1 at station 3 + 60, 250 feet left of the centerline
Boring B2 at station 3 + 80, 400 feet left of the centerline
Pit P2, a 20-foot-square pit at station 4 + 20, 300 feet left of the centerline
+ &0, 425 feet left of the centerline
In addition to the borrow pit exploration, the officer in charge of the soil exploration
designated other locations.
Boring B3 at station 4 + 80, 225 feet to the right of the centerline
Boring B4 at station 6 + 00, 200 feet to the left of the centerline
Pit P3, a 20-foot-square pit at station ) + &0 on the centerline
9B!
&1)$
)7%
Each sample is tagged according to the location from which it was taken and the
locations are given in consecutive numbers.
For the scenario in Figure 16-8, the numbers might run from the bottom up, with T1
being No. 1; P 1 as No. 2; B1 as No. 3; and so on. A sample is tagged with the project
symbol (in this case PFB 7) and the location symbol such as T1, P2, or B4, for example.
If more than one sample is taken from the same location, you need to use additional
numbers. For example, a sample taken from B2 may be tagged ‘‘PFB 7-B2-4, bag 1 of
6.” This means the soil sample came from Boring pit No. 2, at location No. 4, as the first
of six bags.
The sample’s identification should be printed on two tags with a marking pencil or pen,
one placed inside the bag, the other tied on the outside. Gummed labels may be
similarly used to identify samples placed in moisture content boxes, cylinders, or jars.
'LVWXUEHG6DPSOHV
Disturbed samples are those taken by hand scoops, auger borings, shovels, or any
other convenient hand tool but with no attempt to obtain or maintain the material in its
natural state of structure or density.
These samples can be used for
mechanical analysis, plasticity, specific
gravity, frost susceptibility, compaction,
and laboratory compacted California
Bearing Ratio (CBR) tests. (Figure 16-9)
The size of the sample taken will depend
upon the tests to be performed.
)LJXUH — &DOLIRUQLD%HDULQJ5DWLR
&%5WHVWHTXLSPHQW
9B!
&1)$
)7$
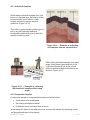
,QGLYLGXDO6DPSOHV
When taking individual samples from a pit,
trench, or exposed face, first shave off any
loose and dried soil to obtain a fresh
surface and clearly expose any soil
variations. (Figure 16-10)
Then take a typical sample of each type of
soil or any soil requiring additional
investigation while being sure to label the
sample number by layer.
)LJXUH — ([DPSOHRIFROOHFWLQJ
VRLOVDPSOHVIURPDQH[SRVHGIDFH
When taking individual samples from hand
auger holes, place typical portions of the
collected soil along a row in the correct
order according to depth and retrieval, as
shown in Figure 16-11.
)LJXUH — ([DPSOHRIFROOHFWLQJ
LQGLYLGXDOVRLOVDPSOHVZLWKDKDQG
DXJHU
&RPSRVLWH6DPSOHV
A composite sample is a representative mixture of all soil within:
A soil mass to be investigated
An existing stockpiled material
A windrow of soil excavated from a trench
A test sample is taken in the laboratory from a composite sample by quartering, which
will be explained later in this chapter.
9B!
&1)$
)71
To take composite samples from test pits, trenches, or power shovel cuts, take the
following steps:
1. Remove any overburden or surface soil intended for waste.
2. Shave off any loose and dried soil to obtain a fresh surface for taking the sample.
3. Excavate a channel of uniform cross section from top to bottom, depositing the
soil onto a quartering cloth, canvas, or tarpaulin, as shown in Figure 16-12.
Collect and bag all the removed material to
ensure that the sample contains the
correct cross sectional proportions.
)LJXUH²([DPSOHRIWDNLQJD
FRPSRVLWHVRLOVDPSOHIURPDQH[SRVHG
IDFH
To take composite samples from auger holes, remove the overburden and then collect
all the material excavated from the hole without bothering to “place typical portions of
the collected soil along a row” as done for individual soil sampling.
To take composite samples from
stockpiles or windrows, take particular
care.
When excavated material is placed in piles
or rows, the coarse material tends to roll to
the bottom, leaving the finer material on
the top.
To compensate for this in a stockpile, after
clearing the surface, take the sample from
a full height strip.
To collect a sample from a small windrow,
excavate and bag material from a short
section, as shown in Figure 16-13.
)LJXUH²([DPSOHRIWDNLQJD
FRPSRVLWHVRLOVDPSOHIURPDZLQGURZ
9B!
&1)$
)7
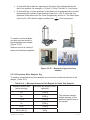
0RLVWXUH&RQWHQW6DPSOHV
To draw a complete soil profile and accurately ascertain the physical properties of soils
obtained from test borings or pits, planners need to know the natural moisture content of
the soil samples.
The natural moisture content is determined from samples taken in the field and placed
in a container, which is then sealed to prevent loss of moisture by evaporation.
Generally, 100 grams of soil are enough to determine the moisture content of finegrained soils, but soils containing gravel require larger samples.
Normally, moisture content samples are
placed in metal dishes (canisters) with
tight-fitting covers. However, any clean,
sealable container may be used.
If the moisture content test will be
performed within 1 day of the sample
collection, sealing the container is not
required.
If a longer interval will elapse between
sampling and testing, the containers
should be sealed. (Figure 16-14)
)LJXUH²([DPSOHRIVHDOLQJD
VDPSOHFRQWDLQHUWRUHWDLQPRLVWXUH
FRQWHQW
8QGLVWXUEHG6DPSOHV
Soil samples that are cut, removed, and
packed with the least possible disturbance
are termed “undisturbed samples.” (Figure
16-15)
As carefully as possible, these samples
are taken in their natural structures with
layers, void ratio, and moisture content
preserved.
)LJXUH²([DPSOHRIXQGLVWXUEHG
VRLOVDPSOHZLWKVXUIDFHOD\HU
9B!
&1)$
)7
Undisturbed samples are used for determining the in-place density (unit weight) and
investigating the strength by the CBR (or unconfined compression) tests in the
laboratory. These samples may be shipped to more completely equipped laboratories
for shear, consolidation, or other strength tests.
An undisturbed sample can be taken as a:
chunk sample — cut by hand with a shovel and knife
cylinder sample — obtained by a CBR mold equipped with a sampling cutter, or
by using a cylindrical sampler in an alternate expedient method
The method chosen will depend on the available equipment, the tests required, and the
type of soil being sampled. Frequently it will require a great deal of ingenuity in adapting
the sampling devices and their usage to the job conditions.
Cohesionless samples must be kept in the sample container (cylinder method whenever
possible) and handled without jarring or vibration until ready for testing. However, some
soils are too hard or contain too many stones to permit cylinder sampling and can be
taken only by cutting out chunk samples by hand.
Whatever method is used, all undisturbed samples must be handled with care. The
sample must be packed in the container for shipment without allowing its structure to
change, including its moisture content during sampling and shipment
&KXQN6DPSOHV
The chunk sample is the simplest type of undisturbed sample. However, chunk samples
can be obtained only from soils that will not deform, break, or crumble while being
removed. Figure 16-16 shows the process of taking a chunk sample from a level
surface, such as a subgrade or the bottom of a test pit.
After smoothing the ground
surface and marking the outline
of the chunk, the first step is to
excavate a trench around the
chunk.
Then deepen the excavation
and trim the sides of the chunk
with a knife.
Finally, using a knife, trowel, or
hacksaw blade, cut off the
chunk at the bottom and
carefully remove it from the
hole.
)LJXUH²([DPSOHRIWDNLQJDFKXQN
VDPSOHIURPDOHYHOVXUIDFH
9B!
&1)$
)7
When taking a chunk sample from the
vertical face of a test pit or trench, the
process is similar except for the extra work
effort and care needed to remove the soil
from behind the intended sample. (Figure
16-17)
Smooth the surface of the face and mark
the chunk outline.
Excavate the soil from the top, sides, and
back of the chunk.
Shape the chunk with a knife
Cut it off and carefully remove it.
)LJXUH²([DPSOHRIWDNLQJD
FKXQNVDPSOHIURPDYHUWLFDOVXUIDFH
After removing a chunk sample from a hole or wall, you need to seal it.
One method is to apply three coats of
melted paraffin. (Figure 16-18)
Allow each coat to cool and become firm
before applying the next coat.
This gives adequate protection for strong
samples that will be used within a few
days.
)LJXUH²([DPSOHRIDSSO\LQJ
SDUDIILQOD\HUVLQFRDWV
9B!
&1)$
)7&
For chunk samples that are weak, or may
not be used within a few days, additional
protection is required.
Wrap them with cheesecloth or other soft
cloth, and then seal them with paraffin.
(Figure 16-19)
If no cloth is available, reinforce the
sample with several loops of friction tape
or twine, taking extra precautions in this
operation so the sample is not damaged.
Then apply three additional coats of
paraffin.
)LJXUH²([DPSOHRIDSSO\LQJ
DGGLWLRQDOFORWKDQGWZLQHSURWHFWLRQ
After wrapping the sample and applying
the first brush coat, as an alternative to
applying the three additional coats of
paraffin, you can dip the entire sample in
melted paraffin. (Figure 16-20)
Of course, this requires a larger container
and more paraffin, but this method also
provides a more uniform coating that can
be built up to 1/8 inch or more in thickness
by repeatedly dipping the sample.
)LJXUH²([DPSOHRIDSSO\LQJ
OD\HUVRISDUDIILQSURWHFWLRQE\GLSSLQJ
9B!
&1)$
)7
For shipping a chunk sample to a
laboratory, for example from a battalion’s
remote detail site to the main body site,
still further protection is required.
This can be accomplished by applying
multiple layers and coats of cloth and
paraffin or by packing the paraffinthickened chunk sample in a cardboard
box with excelsior or sawdust and shipping
it in a wooden box. (Figure 16-21)
)LJXUH²([DPSOHRISDFNDJLQJD
FKXQNVDPSOHIRUVKLSPHQWWRD
ODERUDWRU\
&\OLQGHU6DPSOHVE\&%50ROG
To collect undisturbed samples for CBR or density tests, the cylinder method may be
used for samples from soft, fine-grained soils. A CBR compaction mold is fitted with an
extension collar, a sampling collar, and a cutting edge. (Figure 16-22)
)LJXUH²([DPSOHRIDF\OLQGHU&%5FRPSDFWLRQPROG
9B!
&1)$
)7)
Figure 16-23 demonstrates how to obtain a cylinder sample by using the CBR mold.
Smooth the ground surface, and
press the sampling collar and mold
into the soil with moderate
pressure.
Excavate a trench around the
cylinder and press the mold down
over the soil again using a hand
driver or loading bar if necessary.
(Improvise a loading bar from any
suitably sized piece of timber.)
Carefully trim the soil away from
the sampling collar with a knife,
cutting downward and outward to
avoid cutting into the sample. The
sampling collar does the actual
cutting to size. You can use the
field CBR jack to force the sampler
down, but it has only about 2
inches of travel, so if available, you
would do better to use a truck jack.
In either case, do not force the
sampler down ahead of the
trimming on the outside of the
cylinder.
Excavate the trench deeper and
repeat the process until the soil
penetrates well into the extension
collar.
Cut off the sample at the bottom of
the mold with a shovel, knife, or
wire, and remove the mold and
sample from the hole.
)LJXUH²([DPSOHRIFROOHFWLQJ
DQXQGLVWXUEHGF\OLQGHUVDPSOHE\&%5
FRPSDFWLRQPROG
9B!
&1)$
)7-
Undisturbed samples taken by cylinder method need to be protected similar to the
chunk samples. (Figure 16-24)
Remove the mold and sample from
the hole.
Remove the upper collar of the
mold and trim the top surface of the
sample down to approximately 1/2
inch from the top of the mold.
Fill this recess with paraffin to seal
the end of the sample.
Turn the mold over and remove the
cutting edge, creating a similar
recess in the bottom of the sample.
Fill this recess with paraffin. If the
sample is to be handled a great
deal, you should overfill the ends
with paraffin and trim them exactly
flush using a straightedge.
Place boards over both ends and
clamp in place, using bolts, string,
or wire.
If the samples are to be transported some
distance or handled quite a bit before
testing, wrap the cylinders in cloth and
soak them in paraffin layers.
)LJXUH²([DPSOHRIVHDOLQJDQG
SURWHFWLQJD&%5F\OLQGHUPROG
4XDUWHULQJ6DPSOHV
Quartering is the process of ensuring a soil sample’s representation while reducing it to
a convenient size or dividing it into two or more smaller samples for testing. The
objectives are the same, but the procedures vary somewhat, depending upon the size
of the sample.
6DPSOHV:HLJKLQJ2YHU3RXQGV
To quarter a sample of over 100 pounds, using a shovel, pile and thoroughly mix the
sample on a canvas. (Figure 16-25)
9B!
&1)$
)7%
Place each new shovelful on the top-center of the preceding one so that the soil
will be distributed evenly in all directions.
Flatten the sample into a circular layer of approximately uniform thickness.
Insert a stick or length of pipe under the canvas and then lift it at both ends to
divide the sample into two equal parts.
Remove the stick, leaving a fold in the canvas, and then reinsert it under the
sample at right angles to the first division.
Lift the stick again dividing the sample into four parts.
Discard two diagonally opposite quarters taking care to clean the fines from the
canvas.
Remix the remaining material by taking an alternate shovelful from each quarter.
Repeat the quartering process as necessary to reduce the sample to the desired
size.
)LJXUH²([DPSOHRITXDUWHULQJDQGUHGXFLQJDODUJHVDPSOHWRGHVLUHG
VL]H
9B!
&1)$
)7$
6DPSOHV:HLJKLQJ%HWZHHQDQG3RXQGV
In quartering a sample between 25 and
100 pounds, you can pile the soil on the
canvas and mix it by alternately lifting the
corners of the canvas and pulling the
sample over as if preparing to fold the
canvas diagonally. (Figure 16-26)
Flatten and quarter the sample as done
with the larger, over 100-pound example.
Repeat until the sample is the desired
size.
)LJXUH²([DPSOHRITXDUWHULQJD
VRLOVDPSOHRISRXQGV
6DPSOHV:HLJKLQJ/HVV7KDQ3RXQGV
For samples less than 25 pounds, the
process is the same but on a smaller
scale. (Figure 16-27)
Place the sample on canvas or a clean
sheet of paper.
With a trowel, mix it thoroughly, form it into
a conical shape, and flatten it.
Divide the sample into quarters, and
discard two diagonally opposite quarters.
Remix the remaining material and repeat
the process until the sample is the size
needed for the test.
)LJXUH²([DPSOHRITXDUWHULQJD
VRLOVDPSOHRIOHVVWKDQSRXQGV
7HVW\RXU.QRZOHGJH6HOHFWWKH&RUUHFW5HVSRQVH
4.
7UXHRU)DOVHOnly soil samplings taken from test pits and holes are valid.
A.
B.
True
False
9B!
&1)$
)7 1
62,/7(67,1*
To test the representative soil samples, disturbed or undisturbed, the Navy follows
procedures laid down by the American Society for Testing Materials (ASTM). A
complete soil test typically proceeds according to the following steps:
1. Determine moisture content.
2. Determine soil particle sizes (grains) and the percentage distribution of sizes with
a mechanical analysis.
3. Determine specific gravity.
Specific gravity is expressed in terms of ratio: the weight of a given volume of
substance relative to the weight of an equal volume of water. A cubic foot of
water weighs 62.43 pounds.
o For soil, determine the absolute specific gravity, that is, determine the ratio
of the weight of a dense volume, which is a volume exclusive of air
spaces.
o For example, a cubic foot of dry sand weighs about 100 pounds, but with
air exhausted, a cubic foot of sand weighs about 165.44 pounds.
Therefore, the specific gravity of sand equals 165.44 divided by 62.43 (1
ft. 3 water), or about 2.65.
4. Determine Atterberg limits if the soil is clay or a similar fine-grained soil.
A fine-grained soil remains plastic over a certain range of moisture content.
The upper moisture content is called the liquid limit; the lower is called the
plastic limit. Above the range, the soil becomes fluid; below the range, the soil
becomes semisolid.
5. Determine moisture-density relationship.
Compaction is used to determine the moisture-density relationship; in other
words, with a given compaction energy, determining what moisture content
will result in the maximum compaction. Compaction testing is not included in
this course but will be discussed in EA Advanced.
6. Determine by field control testing:
the field moisture content (with an eye to reducing or increasing it to the
optimum, if feasible).
the point at which the specified density has been obtained by compaction.
Field control testing is not included in this course but will be discussed in EA Advanced.
'HWHUPLQLQJ0RLVWXUH&RQWHQW
A soil’s moisture content (also referred to as water content) is an indicator of the amount
of water present. By definition, moisture content in a sample is the ratio of the weight of
water to the weight of solids (oven-dried), expressed as a percentage ( w ).
9B!
&1)$
)7 Where:
W
w w x 100
Ws
w moisture content of the soil (expresses as a percentage)
Ww weight of water in the soil sample
Ws weight of oven-dried solids in the sample
With many soils, close control of moisture content during compaction is necessary to
develop a required density and strength in the soil mass. The amount of compaction
effort to obtain a specified density depends on having the moisture content at or very
close to optimum.
Specified density is expressed in terms of dry unit weight, so moisture content must be
determined with a wet unit weight to determine whether moisture must be added or
removed from the soil mass at the construction site to achieve the optimum moisture
content (OMC) for compaction.
There are several methods for determining moisture content of soil but the most
accurate is the oven-drying method with an electric or portable gasoline oven to dry the
samples.
The calcium carbide gas pressure method is a more expedient method, but it is less
accurate and should always be approved by your supervisor.
The Nuclear Moisture-Density Meter method is a third option, but it requires special
training, along with operator certification, and will not be covered in this course.
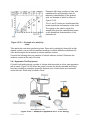
2YHQGU\LQJ0HWKRG
To use the oven-drying method (ASTM D 2216-05), again the most accurate method,
use the following apparatus and procedures.
$SSDUDWXV
Figure 16-28 shows the laboratory apparatus needed for determining moisture content.
9B!
&1)$
)7 A balance for weighing
material to 0.01 grams
(453.6 g = 1 pound)
Several small circular
moisture boxes (called
cans) for placing samples
in to weigh and dry
An electric oven or a
portable gasoline oven to
dry samples
Crucible tongs
)LJXUH²$SSDUDWXVIRUGHWHUPLQLQJ
PRLVWXUHFRQWHQWLQWKHRYHQGU\LQJPHWKRG.
If an electric or gasoline oven is not available, the materials can be dried in a frying pan
held over an ordinary stove or hot plate. However, the frying pan substitute has a
disadvantage. Whereas the electric oven thermostat can be set to a desired
temperature, with a frying pan, the temperature is hard to control and any organic
material in the sample may be burned causing a slight to moderate inaccuracy in the
result.
3URFHGXUH
Perform the following steps to determine the moisture content. Refer to Figure 16-29 for
entries on DD Form 1205.
Record all identifying sample information (blocks 1 - 5).
Label and weigh clean, dry, moisture boxes (cans); record as Weight of Tare
(block d).
Place required soil sample in can and cover with lid.
o When conducting this test as part of another test method, use the specimen
mass stated in that test method.
o When conducting this test with no minimum specimen mass provided, use the
values provided in Table 16-5, depending on the degree of accuracy of the
reported water content.
Weigh soil sample and tare to the nearest 0.01 gram; record as Weight of Tare +
Wet Soil (block a).
Oven-dry sample, with lid removed, at 110°C ± 5° until sample weight becomes
constant.
9B!
&1)$
)7
o
Oven-drying time will vary depending on the type of soil, the size of the
sample, and other factors. For routine water-content determination, ovendry a sample of clean sands and gravel for a minimum of 4 hours. For
most other soils, a minimum drying time of 16 hours is adequate.
Remove sample from oven; replace lid and allow to cool until it can be handled
comfortably with bare hands.
Weigh dried soil sample and tare; record as Weight of Tare + Dry Soil (block b).
Determine weight of water ( Ww ) by subtracting Weight of Tare + Dry Soil (block
b) from Weight of Tare + Wet Soil (block a); record as Weight of Water ( Ww )
(block c).
Determine weight of dry soil ( Ws ) by subtracting Weight of Tare (block d) from
Weight of Tare + Dry Soil (block b); record as Weight of Dry Soil ( Ws ) (block e).
Determine water content ( w ), in percent, and record it using the formula:
w
Ww
x 100
Ws
When determining the average water content, the individual tests must be within ± 1
percent. Any individual tests that do not meet this requirement will not be used. If none
of the individual tests meet this requirement, then additional testing is required. Refer
again to Figure 16-29 to note an invalidated test.
9B!
&1)$
)7 &
)LJXUH²([DPSOHRIGDWDVKHHWIRUVRLOPRLVWXUHFRQWHQW'')RUP
9B!
&1)$
)7 7DEOH²5HFRPPHQGHG0LQLPXP7HVW6SHFLPHQIRU5HSRUWLQJ:DWHU
&RQWHQW
0D[LPXP3DUWLFOH
6L]H3DVVLQJ
6WDQGDUG
6LHYH6L]H
0LQLPXP0RLVW0DVVIRU
5HSRUWLQJWR
0LQLPXP0RLVW0DVVIRU
5HSRUWLQJWR
2.0 mm or less
No. 10
20.0 g
20 g*
4.75 mm
No. 4
100.0 g
20 g*
9.50 mm
3/8 in
500.0 g
50 g
19.00 mm
3/4 in
2.5 kg
250 g
37.50 mm
1 1/2 in
10.0 kg
1 kg
75.00 mm
3 in
50.0 kg
5 kg
7REHUHSUHVHQWDWLYHQRWOHVVWKDQJUDPVVKDOOEHXVHG
&DOFLXP&DUELGH*DV3UHVVXUH0HWKRG $$6+727
CAUTION
The chemical reaction of calcium carbide with water produces acetylene gas, which is
extremely flammable. Exercise extreme caution to avoid open flame when releasing the
gas from the speedy moisture tester. Perform the test in a well-ventilated area, as
asphyxiation could occur if performed in a confined area.
A typical Calcium Carbide Gas Pressure method uses a 26 gram, SPEEDY® moisture
tester to determine the moisture content of soils, fine aggregates, sand, and clay.
Determination can be made in the laboratory or field to within ± 0.5 percent, in from 45
seconds to 3 minutes depending upon the material being tested. If another tester is to
be used, consult the user’s manual for the tester before conducting the moisture-content
determination.
The tester operates on the principle of introducing a calcium carbide reagent (reactive
agent) to the free moisture of the soil sample inside a sealed then shaken chamber. The
resulting chemical reaction creates a gas that is contained in the sealed chamber. The
resulting gas pressure is displayed on a built-in gas pressure gauge.
9B!
&1)$
)7 )
$SSDUDWXV
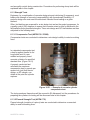
The SPEEDY® Moisture Tester set (Figure 16-30) includes:
SPEEDY® tester
Balance
Half-weight reagent
Measuring scoop
Brushes
Cleaning cloth
Two 1 1/4-in. steel balls
)LJXUH²([DPSOHRID63(('<
0RLVWXUH7HVWHU
3URFHGXUH
Weigh a specified gram sample of soil (26g on SPEEDY® Moisture Tester
model).
Place soil sample and two 1 1/4-inch steel balls in large chamber.
Hold pressure vessel in a horizontal position to prevent soil from contacting
reagent before tester is sealed.
Place #<&=of reagent in cap. While still horizontal, insert cap into
pressure vessel and tighten clamp to seal cap.
Raise moisture tester to a vertical position so reagent falls into vessel.
Return tester to horizontal and vigorously shake with a rotating motion for 10
seconds to put steel balls into orbit around inside circumference to break down
soil.
o Rest for 20 seconds; repeat shake-rest cycle for a total of 3 minutes.
o Do not allow steel balls to fall against either cap or orifice leading to the dial;
this may cause damage.
Hold the tester horizontal at eye level, read and record dial reading as percent of
moisture by wet mass.
Point cap away and release gas pressure slowly.
Empty pressure vessel and examine for lumps. If soil sample is not completely
broken down, retest another sample and increase time limit (shaking unit) by 1
minute.
9B!
&1)$
)7 -
o The limit of the tester is 12 percent moisture for aggregate, or 20 percent
moisture for soil. If the limit is exceeded, then the test must be run again
using a half-sized sample (13 grams) and the dial reading must be multiplied
by 2.
Determine percentage of moisture by dry mass (oven-dry moisture percentage),
by converting direct wet mass reading into a calibration curve supplied with test
set.
0HFKDQLFDO$QDO\VLV
Determining grain sizes and the percentage distribution of each size is done with
mechanical analysis. A complete mechanical analysis is accomplished in two parts:
sieve analysis and hydrometer analysis.
6LHYH$QDO\VLV
Sieve analysis applies to soils that are larger than the No. 200 sieve or contain small
amounts of material passing the No. 200 sieve.
Sieve analysis can be done on the entire sample or on the sample after the fines are
removed by prewashing. To conduct a mechanical analysis, use the following apparatus
and procedures.
$SSDUDWXV
A typical sieve analysis apparatus includes:
Gram weighing balance
Sieves with apertures of
varying sizes used to
determine grain sizes
(Figure 16-31)
Sieves may be:
o Circular sifter type
(usually about 8
inches in diameter)
o Rocker type, a rocker
frame in which
screens with
apertures of various
sizes can be placed
)LJXUH²7\SLFDOVLHYHVHWDSSDUDWXV
The sieve used for analysis is the so-called standard sieve. A standard sieve has a
square aperture.
Sieve screen sizes have two types of identifying systems:
9B!
&1)$
)7 %
A sieve with fewer than four apertures to the linear inch is designated by the
size of an aperture, for example, a 1/4-inch, 1/2-inch, 3/4-inch, or 1-inch sieve.
A sieve with four or more apertures to the linear inch is designated by a number
representing the number of apertures per linear inch. A No. 4 sieve has four
apertures to the linear inch; No. 6 has six apertures; and so on. The finest sieve
1
used is a No. 200, which is slightly smaller than
of an inch square.
200th
To conduct a sieve analysis,
you also need an electric or
hand-operated sieve shaker.
(Figure 16-32)
Shakers come in a variety of
styles and functional operation.
)LJXUH²([DPSOHRIW\SHVRIVLHYH
VKDNHUV
3URFHGXUH6LHYH$QDO\VLV'U\
To conduct a mechanical dry sieve analysis you must have a minimum amount of soil
sample. (Table 16-6)
7DEOH²0LQLPXP$PRXQWRI6RLO6DPSOHIRU*UDLQ6L]H$QDO\VLV
Maximum particle size
(sieve opening)
Minimum dry weight of test
specimen
3 in.
5,000 g
2 in.
4,000 g
1 1/2 in.
3,000 g
1 in.
2,000 g
3/4 in.
1,000 g
3/8 in. (No. 4)
500 g
9B!
&1)$
The minimum sample
weight depends on the
maximum particle size in
the sample.
)7 $
Samples are analyzed by the following procedure. Refer to Figure 16-33 for entries on
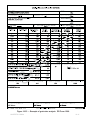
DD Form 1206.
Samples that contain cohesive soils such as clays or silts, which form hard lumps, must
be prewashed. Look for the 4 additional operations.
9B!
&1)$
)7&1
SA
M
PL
E
)LJXUH33²([DPSOHRIgrain-size analysis. '')RUP6
9B!
&1)$
)7&
Prepare sample.
o Spread out and air dry.
o Break up aggregate with fingers or mortar and pestle (usually a part of the
laboratory apparatus). Take care not to crush individual grains. The object is
to separate aggregations of clustering grains.
Obtain representative size. (Table 16-6)
Record identifying sample information on form (blocks 1 through 7).
Oven-dry material at 110°C ± 5° until a constant weight is obtained; allow
cooling.
Weigh oven-dried sample to the nearest gram; record as original weight on form
(block 8).
If only a dry sieve is to be performed, check “No” in block 9 and enter 0 in blocks
10 and 11 and proceed with selecting sieves.
o If sample will be prewashed, check “Yes” in block 9 and add the following 4
operations:
1. Place sample in clean container; cover completely with water; allow
soaking until any adhering and lumpy particles are completely
disintegrated, 2 to 24 hours.
2. Wash sample over a No. 200 sieve into a 2 x 2 foot concrete pan until all –
200 materials have been washed through.
a. If sample contains an appreciable amount of coarse particles, combine
No. 4 and No. 200 sieves.
b. Take care not to overload No. 200 sieve. If necessary, transfer sample
in increments. (This process may take up to 6 different pans and as
long as 8 hours.)
3. Process +200 material.
a. Oven-dry washed + 200 material at 110°C ± 5° until constant weight is
obtained and allow cooling.
b. Weigh to nearest tenth of a gram, record + #200 Sample Weight,
Washed (block 10).
4. Process –200 material.
a. Allow the –200 material to settle in pan until surface water becomes
clear (16 to 24 hours).
b. Decant surface water (use siphon or syringe) ensuring settled material
is not disturbed.
c. Use a trowel to transfer as much material as possible from pan to
pudding pans.
d. Rinse remainder of material from 2 x 2 pans to pudding pans with as
little water as possible.
e. Oven-dry washed –200 material and determine weight to nearest tenth
of a gram; record as — #200 Sample Weight, Washed (block 11).
9B!
&1)$
)7&
o
Retain material from these 4 additional steps for prewashed material for use
in hydrometer analysis.
Select a nest of sieves to accommodate largest particle size of soil; ensure all
material will pass through largest sieve.
Record weight of each selected sieve (to nearest tenth of a gram) on form
(column 13).
o Sieve selection varies according to type of soil being tested. The following is
recommended as a minimum:
2 inch
1 1/2 inch
Stack (nest) sieves on top of each
other with the largest sieve on top.
1 inch
3/4 inch
The coarsest sieve recorded is the
sieve above the first one that
retains any material.
3/8 inch
No. 4
No. 10
The “retained” weight recorded for
this sieve is 0 g.
No. 16
No. 30
The passing weight recorded
through this sieve is the total
weight of the sample.
No. 40
No. 50
No. 100
No. 200
Weigh and place a pan on bottom.
Cover sample.
o If sample was prewashed, place only +200 material onto top sieve of nest and
cover.
o If sample was not prewashed, place entire sample on top sieve of nest and
cover.
Place nest of sieves in sieve shaker and shake for 5 to 15 minutes.
o Shaking interval depends on quantity of fine material.
-
Five minutes-for most coarse-grained soils.
-
Fifteen minutes-for most fine-grained soils.
Remove cover and sieves from shaker in descending order.
Weigh each sieve-sample and record on form (column 14).
9B!
&1)$
)7&
Determine weight of material retained on each sieve by subtracting weight of
sieve (column 13) from weight of sieve and retained sample (column 14); record
as weight retained (column 15).
Add weights retained on all sieves and record as total weight retained in sieves
(block 19).
Weigh pan with material passing No. 200 sieve; subtract weight of pan; record as
weight sieved through No. 200 (block 20).
Complete form blocks 21 through 25 using formulas provided on sheet; if error
percentage is 1 percent or greater, rerun test.
Compute cumulative weight retained (column 16) for each sieve by adding
weight retained (column 15) to the previous cumulative weight retained (column
16) with starting point being 0.
Compute percent retained (column 17) for each sieve by dividing weight retained
by total weight of fractions as follows:
column 15
x 100
block 23
Compute percent passing for each sieve size by subtracting cumulative weight
retained (column 16) from total weight of fractions (block 23) and dividing by total
weight of fractions as follows:
Column18 block 23 column 16
x 100
block 23
Determine percentages for gravel, sand, and fines; record as:
o Gravel is material retained on No. 4 sieve (block 26).
o Sand is material passing No. 4 sieve, retained on No. 200 sieve (block 27).
o Fines are material passing No. 200 sieve (block 28).
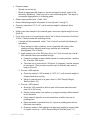
Prepare Grain-Size Distribution graph, DD Form 1207. (Figure 16-34)
o Record identifying sample information in remarks blocks.
o Use sieve-analysis data to plot sieve size and percentage passing sieve.
o Use a french curve to connect plotted points forming a smooth, free-flowing
curve (grain-size distribution curve).
9B!
&1)$
)7&&
+
/
9B!
&1)$
)7&
)7&
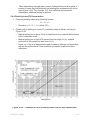
)LJXUH34² Example of grain-size distribution graph. DD Form 1207.
3URFHGXUH6LHYH$QDO\VLVZLWK3UHZDVKLQJUHFDS
If grain-size sample will be prewashed, and “Yes” in block 9 of DD Form 1206 (Figure
16-33) is checked, perform the following 4 operations:
Place sample in clean container; cover completely with water; allow soaking until
any adhering and lumpy particles are completely disintegrated, 2 to 24 hours.
Wash sample over a No. 200 sieve into a 2 x 2 foot concrete pan until all –200
materials have been washed through.
o If sample contains an appreciable amount of coarse particles, combine No. 4
and No. 200 sieves.
o Take care not to overload No. 200 sieve. If necessary, transfer sample in
increments. (This process may take up to 6 different pans and as long as 8
hours.)
Process + 200 material.
o Oven-dry washed + 200 material at 110°C ± 5° until constant weight is
obtained and allow cooling.
o Weigh to nearest tenth of a gram, record as + #200 Sample Weight, Washed
(block 10).
Process — 200 material.
o Allow the — 200 material to settle in pan until surface water becomes clear
(16 to 24 hours).
o Decant surface water (use siphon or syringe) ensuring settled material is not
disturbed.
o Use a trowel to transfer as much material as possible from pan to pudding
pans.
o Rinse remainder of material from 2 x 2 pans to pudding pans with as little
water as possible.
o Oven-dry washed — 200 material and determine weight to nearest tenth of a
gram; record as — #200 Sample Weight, Washed (block 11).
Retain material from these 4 additional steps for prewashed material for use in
hydrometer analysis.
+\GURPHWHU$QDO\VLV
The determination of grain size distribution by sieve analysis is limited to materials
larger than the No. 200 (0.074-mm) sieve. For soil classification, this is sufficient since
grain size distribution is not used to classify fine-grained soils that pass through the No.
200 sieve. However, when appropriate to the geographical area, an analysis of the
distribution of particles smaller than the No. 200 sieve is necessary for frost
susceptibility. Frost susceptibility should always be considered in areas subject to
substantially freezing temperatures, since repeated freezing and subsequent thawing of
water in the soil can seriously affect the ability of the soil to support a structure. A soil is
considered frost susceptible if it contains 3 percent or more by weight of particles
smaller than 0.020 mm in diameter, and hydrometer analysis is the test used to
determine the grain size distribution of soils passing the No. 200 sieve.
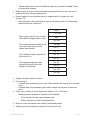
Figure 16-35 shows an example of a grain-size analysis using the hydrometer method.
9B!
&1)$
)7&)
)LJXUH²*UDLQVL]HDQDO\VLV+\GURPHWHU0HWKRG'')RUP
9B!
&1)$
)7&-
Hydrometer analysis is based on Stokes’ law, which relates the terminal velocity of a
free-falling sphere in a liquid to its diameter.
The relation is expressed by the following equation:
Where:
V terminal velocity
V
Gs Gw
x D2
18n
Gs specific gravity of solids
Gw specific gravity of the liquid in which the sphere is falling
n viscosity of the liquid
D diameter of the sphere
Larger particles settle more rapidly than smaller ones and it is assumed that Stokes’ law
can be applied to a mass of dispersed soil particles of various shapes and sizes.
The hydrometer analysis is an application of Stokes’ law that permits the calculation of
grain size distribution in silts and clays. For the analysis, the soil particles are given the
sizes of equivalent spherical particles as in Stokes’ Law.
The density of a soil-water suspension depends upon the concentration and specific
gravity of the soil particles. If the suspension is allowed to stand, the particles will
gradually settle out of the suspension, and the density will be decreased.
A hydrometer is an instrument used to measure the density of the suspension at a
known depth below the surface. The density measurement, together with knowledge of
the specific gravity of soil particles, determines the percentage of dispersed soil
particles in suspension at the time and depth of measurement.
Stokes’ law is used to calculate the maximum equivalent particle diameter for the
material in suspension (at depth and elapsed time of settlement). A series of density
measurements (at known depth of suspension and times of settlement) gives the
percentages of particles finer than the diameters given by Stokes’ law.
Thus, the series of readings will reflect the amount of different sizes of particles in the
fine-grained soils. The particle diameter ( D ) is calculated from Stokes’ equation using
corrected hydrometer readings and a nomographic chart. Hydrometer analysis
procedures are not discussed in this course but are contained in ASTM D 422.
6SHFLILF*UDYLW\7HVWLQJ
Specific gravity is the ratio of the weight of a solid substance to the weight of an equal
volume of water. In dealing with soils, determining specific gravity is necessary for
certain tests, such as hydrometer analysis, and for computations involving volume and
weight relationships.
The specific gravity of solids is normally applied only to soil that passes the No. 4 sieve.
Generally, geotechnical engineers need a soil’s specific gravity to perform additional
testing of that particular soil.
In some cases though, there may be different soil fractions used when performing this
test. For example, a –10 sample’s resulting specific gravity is applicable to hydrometer
9B!
&1)$
)7&%
analysis, while determining the zero-air-voids curve in soils-compaction testing
(laboratory) uses the –4 sample’s specific gravity.
A soil’s specific gravity largely depends on the density of the minerals making up the
individual soil particles. Some typical specific gravity values for specific soil types are:
Solid substance of most inorganic soils — 2.60 to 2.80
Tropical iron-rich laterite, as well as some lateritic soils — 2.75 to 3.0 +
Sand particles composed of quartz — 2.65 to 2.67
Inorganic clays — 2.70 to 2.80
Soils with large amounts of organic matter or porous particles (such as
diatomaceous earth) — 2.00 to 2.60
There are three different formats for expressing the specific gravity of a soil mass.
Specific Gravity of Solids ( Gs ) — the ratio of the weight in air of a given volume
of soil particles to the weight of an equal volume of distilled water, both at a
stated temperature.
o The specific gravity of solids is applied only to that fraction of a soil that
passes a No. 4 sieve.
Apparent Specific Gravity ( Ga ) — the ratio of the weight in air of a given volume
of the impermeable portion of soil particles to the weight in air of an equal volume
of distilled water, both at a stated temperature.
o The impermeable portion of a porous material, such as most large soil grains,
includes the solid material plus impermeable pores or voids within the
particles.
Bulk Specific Gravity ( Gm ) — the ratio of the weight in air of a given volume of
permeable material (including permeable and impermeable voids) to the weight
of an equal volume of distilled water, both at a stated temperature.
6DPSOH6HOHFWLRQ
For specific gravity tests, soil samples may be disturbed or undisturbed. However, take
care to ensure that a sample is a representative sample.
When selecting a sample containing both large and small particles, separate it on a No.
4 sieve; discard any particles not passing.
It is easier to begin the test with an oven-dried sample. However, some soils,
particularly those with high organic content, should be tested at their natural water
content with the oven-dried weight determined at the end of the test.
6SHFLILF*UDYLW\RI6ROLGV
As presented earlier, determining the specific gravity of solids applies only to soil that
passes a No. 4 sieve. However, when used in conjunction with a hydrometer analysis,
specific gravity is determined only on the fraction that passes a No. 200 sieve.
9B!
&1)$
)7&$
$SSDUDWXV
500-milliliter (ml) volumetric flask
o For course discussion, assume the flask has been calibrated; the weight of
the flask and water has been calibrated over a range of temperatures likely
encountered in the laboratory. Calibration procedures are located in ASTM D
854.
Balance, 2,000-gram capacity
Balance, 200-gram capacity
Cans, moisture content
Dishes, evaporating
Funnel
Mortar and pestle
Pump, vacuum (optional)
Stirrer, soil dispersion (optional)
Thermometer, general laboratory
)LJXUH²([DPSOHRIDSSDUDWXVIRUGHWHUPLQLQJVSHFLILFJUDYLW\
3URFHGXUH
To perform a specific gravity (test, use the following procedures. Refer to
Figure 16-37 for entries on DD Form 1208.
9B!
&1)$
)71
9B!
&1)$
)LJXUH²([DPSOHRIGDWDVKHHWIRUVSHFLILFJUDYLW\'')RUP )7
Calibrate volumetric flask (for course discussion, flask has been calibrated).
o Record basic sample information and flask number (blocks 1-5; 6a).
o Weigh clean, dry, flask to nearest 0.01 gram; record as Clean, Dry Weight
Wb (block 6b).
o Fill flask with room-temperature distilled water; ensure bottom of meniscus is
even with calibration mark.
o Weigh flask plus water; record as Flask + Water Weight Wbw (block 6c).
o Determine water temperature to nearest whole degree, record as Observed
Temperature Ti (block 6d).
o Create graph or table for flask being used if additional specific-gravity
determinations are to be made. (NAVFAC MO 330 provides additional
guidance).
Obtain soil sample for testing.
o Separate sample over No. 4 sieve to obtain 100-gram sample passing sieve,
or over No. 10 sieve to obtain 20-gram sample.
o Discard material retained on sieve.
Prepare sample for testing.
o Record identifying sample information (blocks 6e, 6f).
o Place – 4 or –10 sample into evaporating dish.
o Perform following procedures for soil at natural water content or moisture;
otherwise, go to next procedure for oven-dried sample:
-
Add distilled water to sample and mix to slurry.
-
Transfer slurry to flask and add distilled water until about three-fourths full.
o Perform following procedures for oven-dried soil sample:
-
Oven-dry sample to a constant weight at temperature of 110°± 5°C.; allow
cooling and weigh to nearest 0.01 gram; record as Weight of Dish + Dry
Soil (block 6g).
-
Transfer dried sample to volumetric flask; avoid any particle loss.
Fill flask three-fourths full with distilled water and allow to soak for 12
hours.
-
Weigh empty, dry evaporating dish; record as Weight of Dish (block 6h).
Process sample through test method.
o Remove entrapped air by bringing solution to a slow, rolling boil for 10
minutes, occasionally rolling flask to assist in air removal (ensure no loss of
material occurs while boiling); cool to room temperature.
o Fill flask with distilled water until bottom of meniscus is level with calibration
mark.
o Dry outside; thoroughly remove any moisture adhering to neck.
9B!
&1)$
)7
o Weigh flask and contents to nearest 0.01 gram; record as Weight of Flask +
Water + Immersed Soil ( Wbws ) (block 6j).
o Shake flask immediately after weighing (put contents in suspension);
determine water temperature at mid-depth to nearest degree; record as
Temperature of Water ( Tx ) (block 6k).
o Determine dry unit weight for soil processed at natural moisture content:
-
Transfer soil solution from flask to pre-weighed pudding pan; record as
Weight of Dish (block 6h). Use care when transferring all grains.
-
Oven-dry to constant weight at temperature of 110° ± 5°C; allow cooling;
record as Weight of Dish + Dry Soil (block 6g).
Compute results on DD Form 1208.(Figure 16-37)
o Compute weight of dry soil ( Ws ) by subtracting weight of dish (block 6h) from
weight of dish + dry soil (block 6g); record as Weight Of Dry Soil Ws (block 6i).
o Determine weight of flask and water ( Wbw ) by plotting temperature of water
( Tx ) (block 6k) on calibration curve; record as Calculated Weight of Flask +
Water at Tx Wbw (block 6L). (If the calibration curve and graph were not
produced, use the formula as indicated and record the result on the form.)
P T Wbw w x x !Wbw at Ti Wb " Wb
Pw Ti Where:
Pw Tx density of water identified by
temperature Tx Pw Ti density of water identified by
temperature Ti Wbw weight of flask and water in grams
Wb weight of flask in grams
Ti observed/recorded temperature of
water in ºC
Tx any other desired temperature, in ºC
)LJXUH²([DPSOHRIFDOLEUDWLRQ
FXUYHIRUDYROXPHWULFIODVN
o Determine correction factor ( K ).
-
Locate temperature of water ( Tx ) (block 6k) in Table 16-7.
-
Read across to correction factor column; record as Correction Factor for
Tx , K (block 6m).
9B!
&1)$
)7
7DEOH²5HODWLYH'HQVLW\RI:DWHUDQG&RUUHFWLRQ)DFWRU.DW9DULRXV
7HPSHUDWXUHV
7(03
&
5(/$7,9(
'(16,7<
&255(&7,21
)$&725.
7(03
&
5(/$7,9(
'(16,7<
&255(&7,21
)$&725.
7(03
&
5(/$7,9(
'(16,7<
&255(&7,21
)$&725.
18.0
0.99862
1.0004
23.0
0.99756
0.9993
28.0
0.99626
0.9980
18.5
0.99852
1.0003
23.5
0.99744
0.9992
28.5
0.99611
0.9979
19.0
0.99843
1.0002
24.0
0.99732
0.9991
29.0
0.99597
0.9977
19.5
0.99833
1.0001
24.5
0.99720
0.9990
29.5
0.99582
0.9976
20.0
0.99823
1.0000
25.0
0.99707
0.9988
30.0
0.99567
0.9974
20.5
0.99813
0.9999
25.5
0.99694
0.9987
30.5
0.99552
0.9973
21.0
0.99802
0.9998
26.0
0.99681
0.9986
31.0
0.99537
0.9971
21.5
0.99791
0.9997
26.5
0.99668
0.9984
31.5
0.99521
0.9970
22.0
0.99780
0.9996
27.0
0.99654
0.9983
32.0
0.99505
0.9968
22.5
0.99768
0.9995
27.5
0.99640
0.9982
32.5
0.99490
0.9967
o Compute specific gravity of solids to two decimal places using the following
formula; record as Specific Gravity of Solids Gs (block 6n).
Where:
Ws dry weight of the sample
Gs Ws K
Ws Wbw Wbws
K correction factor based on the density of water at 20ºC
Obtain the factor by selecting the correction factor
corresponding the recorded temperature. (Table 16-6)
Wbw weight of the flask filled with water only at test
temperature
Obtain this value from a calibration curve, or table, previously
prepared for the flask used.
Wbws weight of the flask, water, and sample at test
temperature
%XONDQG$SSDUHQW6SHFLILF*UDYLW\
The specific gravity of solids is not applied to coarse particles because they normally
contain voids from which air cannot be displaced unless the particles are ground into
finer particles so as to eliminate the voids. Thus, when dealing with coarser particles, it
is more convenient to work with the apparent specific gravity of the particle mass or to
determine the bulk specific gravity.
To recap the definitions of Apparent Specific Gravity ( Ga ) and Bulk Specific Gravity
( Gm ):
Apparent Specific Gravity ( Ga ) — the ratio of the weight in air of a given volume of the
impermeable portion of soil particles to the weight in air of an equal volume of distilled
water, both at a stated temperature.
9B!
&1)$
)7&
The impermeable portion of a porous material, such as most large soil grains,
includes the solid material plus impermeable pores or voids within the particles.
Bulk Specific Gravity ( Gm ) — the ratio of the weight in air of a given volume of
permeable material (including permeable and impermeable voids) to the weight of an
equal volume of distilled water, both at a stated temperature.
The following applies to the determination of both bulk and apparent specific gravity.
Bulk specific gravity is usually determined for the coarser materials retained on a No. 4
sieve. Large stones may be determined individually.
For aggregates used in Portland-cement concrete, measure to determine the bulk
specific gravity of the aggregates in a saturated, surface dry (SSD) condition. This is the
condition in which the pores in each aggregate particle are filled with water and no
excess water is on the particle surface.
This test method covers the specific gravity and absorption of coarse aggregate. The
specific gravity may be expressed as apparent specific gravity, bulk specific gravity,
bulk specific gravity SSD.
6DPSOH3UHSDUDWLRQ
Prepare a representative sample by washing the material over the No. 4 sieve to
remove dust and coatings and obtain a sample size; approximately 2 kilograms are
required. Ensure the sample is representative.
$SSDUDWXV
Balance, sensitive to 0.5 gram, capable of suspending the sample container in
water from the center of the weighing platform or pan of the weighing device
Wire sample basket or a bucket with a 4- to 7-liter capacity for 1 1/2-inch or
smaller aggregate and a larger basket or bucket for larger aggregate sizes.
Water tank large enough to hold the basket
Volumetric Flask, 2 to 3 cubic feet
Heat source (oven or hot plate)
Metal sample container
Metal spatula
Absorbent towel
3URFHGXUH
Perform the test in the following order, recording weights to the nearest 0.5 gram. Refer
to Figure 16-37 again.
Obtain representative sample.
Record basic sample information (block 7a).
Dry the sample to a constant weight at 110°C + 5°.
Weigh container and record as Tare (block 7j).
Weigh container and dry sample; record as Tare and Dry Soil (block 7i).
9B!
&1)$
)7
Determine weight of dry soil by subtracting Tare (block 7j) from Tare and Dry Soil
(block 7i); record as Dry Soil (A) (block 7k).
Allow cooling to 50°C; immerse in water; soak at room temperature for 24 hours.
Remove sample from water and roll in a large, absorbent cloth until all visible
films of water are removed.
o The surfaces of the particles will still appear to be slightly damp. The
larger fragments may be wiped individually. When saturated surface is
dry, the surface may still appear damp but take care to avoid excessive
evaporation during the surface drying.
o The aggregate sample is now in an SSD condition.
Weigh saturated surface dry container and record as Tare (block 7d).
Weigh container with saturated surface dry sample; record as Tare + Saturated
Surface Dry Soil (block 7c).
Determine weight of saturated surface dry sample by subtracting Tare (block 7d)
from Tare + Saturated Surface-Dry Soil (block 7c); record as Saturated SurfaceDry Soil (B) (block 7e).
Weigh wire basket in water; record as Wire Basket In Water (block 7g).
Place sample in basket and immerse in water; hang basket and sample from
balance and support so it hangs freely in water; record as (Wire Basket + Soil) in
Water (block 7f).
Determine weight of saturated soil sample by subtracting Wire Basket In Water
(block 7g) from (Wire Basket + Soil) in Water (block 7f); record as Saturated Soil
in Water (C) (block 7h).
Measure temperature of water and soil; record in (block 7b).
Compute Apparent Specific Gravity using following formula; record as Apparent
A
Specific Gravity Ga (block 7l). Ga AC
Compute Bulk Specific Gravity using following formula; record as Bulk Specific
A
Gravity Gm (block 7m). Gm BC
Compute Bulk Specific Gravity (SSD) using following formula; record as Bulk
B
Specific Gravity, Saturated Surface Dry (SSD) Gm (block 7n). Gm BC
A weight of dry soil in air
Where : B weight of SSD sample in air
C weight of SSD sample in water
6SHFLILF*UDYLW\RI&RPSRVLWH6DPSOH
After determining the specific gravity of solids (G s ) and the apparent specific gravity
(G a ), the specific gravity of an entire soil sample (both larger and smaller than a No. 4
sieve) can be calculated with the following formula:
9B!
&1)$
)7)
G
100
% Pas sin g No.4 sieve % Re tained on No.4 sieve
Gs
Ga
Enter this composite specific gravity, along with the percent of materials retained on, or
passed through the No. 4 sieve, in the remarks block of the data sheet.
&RPPHQW5HJDUGLQJ&RUUHFWLRQ)DFWRU.
Refer again to Figure 16-37. There you will see the K value used (0.9993) from Table
16-6 and the results obtained by using the correction factor in calculating Gs (block 6n).
Carried to four decimal places, Gs 2.6256 .
If you were to disregard K and recalculate, you would obtain Gs 2.6238 .
The value obtained without the correction factor is hardly different from the value
obtained with the correction factor. Therefore, unless unusually accurate precision is
required, you may disregard the correction factor.
$WWHUEHUJ/LPLWV/LTXLG/LPLW3ODVWLF/LPLW3ODVWLFLW\,QGH[
'HWHUPLQDWLRQ$670$
If the proper amount of water is present, clays and some other fine-grained soils exhibit
plasticity. A plastic soil can be deformed beyond the point of recovery without cracking
or exhibiting a change in volume and be remolded.
The liquid limit (LL) is that point at which the material contains the greatest water
content and remains plastic; additional water causes it to become a thick liquid.
The plastic limit (PL) is that point at which the material contains the lowest water content
and remains plastic; less water causes it to become brittle and break into fragments if
remolding is attempted.
The plasticity index (PI) is the numerical difference between the LL and the PL,
expresses as:
PI LL PL
A large PI indicates a very plastic soil; a small PI denotes a soil with little plasticity.
As water content decreases below the PL, the soil mass shrinks and becomes stiffer.
The shrinkage limit (SL) is that point at which, with further drying, shrinkage stops.
No sharp distinction identifies the liquid, plastic, and solid brittle states of consistency,
so standardized procedures have been established for determining the LL and PL.
These consistency limits, as well as the shrinkage limit, are called the Atterberg limits,
named for Albert Atterberg, a Swedish chemist who did the initial work on soil plasticity.
However, since tests in this course determine only the LLs and PLs and not the SLs,
they are not identified as the Atterberg limits.
9B!
&1)$
)7-
Research with large numbers of clay soils
established the soil plasticity chart for
laboratory classification of fine-grained
soils, an example of which is shown in
Figure 16-39.
The LL and PI values are coordinates that
locate a particular soil sample on the chart.
The region on the chart in which the
sample falls gives the classification based
on the behavioral characteristics of the
particular soil.
)LJXUH²([DPSOHRIDSODVWLFLW\
FKDUW
Take particular care when performing tests. Some soils, particularly those with a high
organic content, can provide inconsistent readings or drastic differences between an
oven-dried sample and a sample at natural moisture content.
Conduct the following tests on samples of natural moisture content. Determine the
moisture content at the end of the test.
$SSDUDWXV7HVW(TXLSPHQW
A Liquid Limit testing device consists of a brass bowl mounted on a box type apparatus
with a crank. (Figure 16-40) When the crank is turned, the device elevates and drops
the bowl (containing a sample) a specific distance onto a hard rubber anvil centered
under the bowl. Each drop is called a “blow.”
)LJXUH²([DPSOHRIDSSDUDWXVIRU//3/WHVWLQJ
9B!
&1)$
)7%
The test requires the standard support equipment of scale, moisture-content (tare) cans,
and evaporating dish, as well as the LL device. Figure 16-41 provides a more detailed
description of an LL device.
)LJXUH²([DPSOHRI/LTXLG/LPLWGHYLFHZLWKJURRYLQJWRROV
3URFHGXUH/LTXLG/LPLW//
Prepare soil sample.
o Sieve soil sample (at natural moisture content) over No. 40 sieve; obtain at
least 250 grams.
o If little or no material is retained on No. 40 sieve:
-
Collect 200 to 250 grams of –40 material for testing.
-
Mix material with distilled water until water content is slightly below LL,
about peanut butter consistency. (The goal is to have the material fall in
the 25- to 35-blow range for the first test.)
-
Place mixture in airtight plastic bag for at least 16 hours (overnight) so
moisture content can become consistent throughout; remix material
thoroughly before testing.
o If material is retained on No. 40 sieve:
-
Place –40 material in airtight plastic bag to maintain natural moisture
content.
9B!
&1)$
)7$
-
Soak coarse material retained on No. 40 sieve. (Soaking time is variable.)
-
Rub colloidal [kuh-ORLG-l] material from surfaces of large particles until
clean, placing fines in suspension.
-
Pour off suspended fines slowly into another pan; be careful not to pour off
coarse material.
-
Add clean water to coarse material and repeat wash process until poured
off water is sufficiently clear to indicate majority of fines in suspension
have been poured off.
-
Remove excess water from pan containing suspended fines after fines
have settled by decantation and evaporation. (Do not oven-dry or add
chemical substances to speed dry or hasten the settlement.)
-
Oven-dry coarse material that was soaked and washed.
-
Sieve oven-dried coarse material over No. 40 sieve.
-
Combine –40 material obtained from plastic bag, decanted and
evaporated fines, oven dried material sieved over No. 40.
-
If combined material is too moist, air-dry until water content is slightly
below LL.
If combined material is too dry, add small quantities of water until
water content is slightly below LL (peanut butter consistency).
Place combined mixture in airtight plastic bag for at least 16 hours
(overnight) so the moisture content can become consistent throughout;
remix material thoroughly before testing.
Inspect LL device.
o Ensure pin connecting cup is not worn permitting side play.
o Ensure screws connecting cup to hanger arm are tight.
o Check cup for wear; if grooved from use, replace it.
o Check contact between cup and base; if flat on cup or dent in base can be
felt, replace or repair.
o Check grooving tool for wear.
o Check cup drop height so point on cup meeting base (not lowest point of the
cup) rises to a height of 1 centimeter; use gauge on handle of grooving tool to
assist. (The height of the drop must be 1 centimeter. Use the thumbscrew at
the rear of the device to make an adjustment.)
Perform LL test. Refer to Figure 16-42 DD Form 1209.
o Obtain about 50 grams of 200- to 250-gram prepared sample; place in airtight
container for use in PL test.
o
Record all identifying sample information on DD Form 1209 (blocks 1-5).
9B!
&1)$
)7)1
)LJXUH²([DPSOHRIGDWDVKHHWIRU//3/GHWHUPLQDWLRQV'')RUP
9B!
&1)$
)7)
o Label and pre-weigh three empty moisture-determination tares (boxes);
record as Weight of Tare (block 6d).
o Place 20 to 25 grams
of thoroughly mixed
sample into brass
cup, and level it off
with a maximum
depth of 1 centimeter.
(Figure 16-43)
)LJXUH²([DPSOHRIOHYHOLQJ//VDPSOH
LQWRFXS
o Divide sample in cup
with grooving tool so
a clean, sharp groove
is formed. (Figure 1644)
Hold cup with cam follower
upward and draw grooving
tool (beveled edge forward)
through specimen downward
away from cam follower.
Use more than one stroke
but no more than six; clean
grooving tool’s cutting edge
after each stroke.
Avoid tearing side of groove;
replace sample and
regroove if side tears.
)LJXUH²([DPSOHRIFXSDQGJURRYLQJ
WRRO
9B!
&1)$
)7)
With some sandy and highly
organic soils, it is impossible
to draw the grooving tool
through the specimen
without tearing the sides of
the groove. In such cases,
the groove should be made
with a spatula, using the
grooving tool only for a final
check of the groove). (Figure
16-45)
)LJXUH²([DPSOHRIFXWWLQJJURRYHZLWK
VSDWXODLQVDQG\VRLO
o Attach cup to device; ensure height of drop is 1 centimeter.
o Turn crank of LL
device at two
revolutions per
second; count blows
until sample’s halves
make contact at
bottom of groove
along a distance of 13
millimeters (1/2 inch.)
(Figure 16-46)
)LJXUH²([DPSOHRIVDPSOHFRQWDFW
9B!
&1)$
)7)
o Record number of blows to close groove 13 millimeters.
o Obtain 5 to 10 grams
from cup to determine
moisture content; take
sample perpendicular
to groove from edge
of cup through portion
that has closed in
bottom of groove, as
shown in Figure 1647. Place in preweighed box; cover
with lid; weigh and
record as Weight of
Wet Soil + Tare
(block 6a).
)LJXUH²([DPSOHRIUHPRYLQJVDPSOHIRU
PRLVWXUHGHWHUPLQDWLRQ
o Transfer remaining cup soil to mixing dish; wash and dry cup and grooving
tool.
o Remix entire soil specimen; add a little water to increase water content of
sample and decrease number of blows required to close groove. Repeat
steps for at least two additional trials, producing successively lower number of
blows to close groove.
o Oven-dry moisture-determination samples (3 minimum); allow to cool,
reweigh and record as Weight of Dry Soil + Tare (block 6b).
o Determine weight of water Ww by subtracting Weight of Dry Soil + Tare
(block 6b) from Weight of Wet Soil + Tare (block 6a); record as Weight of
Water Ww a b (block 6c).
o Determine weight of dry soil Ws by subtracting Weight of Tare (block 6d)
from Weight of Dry Soil + Tare (block 6b); record as Weight of Dry Soil
Ws b d (block 6e).
o Determine and record water content for each specimen by computing
following formula:
W
Ww
x100
Ws
o Plot water-content points on Form 1209 semilog graph (water versus number
of blows); draw a straight line (flow line) representative of sample (3
minimum) points.
9B!
&1)$
)7)&
o Determine LL by interpreting the graph where the flow line intersects the 25blow line. Record LL to nearest whole number (block 8 LL).
3URFHGXUH3ODVWLF/LPLW3/
The PL of a soil is the water content, expressed as a percentage of weight of oven-dried
soil, at which the soil begins to crumble when rolled into a thread millimeters in
diameter. About 50 grams of material are required for the PL test.
Perform the following steps to determine the PL. Refer again to Figure 16-42 DD Form
1209
Label and pre-weigh two empty moisture-determination tares (boxes); record as
Weight of Tare (block 7d).
Obtain 50-gram sample set aside during LL test; reduce water content (if
required) to obtain consistency whereby the sample can be rolled without sticking
to hands while spreading or mixing continuously on glass plate. Drying process
may be accelerated by air-drying only.
Select about 2 grams (marble size) from 50-gram mass; form test specimen into
ellipsoidal mass; roll on a finely ground glass plate with fingers or palm of hand to
a uniform thread diameter of 3.2 millimeters (1/8 inch), taking no more than 2
minutes. (Figure 16-48)
o Rolling rate should be 80 to 90 strokes per minute; count a stroke as one
complete motion forward and back to starting position; rate may have to
decrease for very fragile soil.
)LJXUH²([DPSOHRIUROOLQJ3ODVWLF/LPLW3/VDPSOHE\ILQJHUVRUSDOP
9B!
&1)$
)7)
Remold and roll again to
3.2 millimeters diameter;
repeat until total sample
crumbles before reaching
the 3.2-millimetersdiameter thread. (Figure
16-49)
o Rolled sample may
not crumble at same
time; if thread breaks
into smaller lengths,
roll each length to 3.2
millimeters; continue
until sample can no
longer be remolded
and rolled to 3.2millimeter thread
without total break-up.
)LJXUH²([DPSOHRI3/VDPSOHUROOWKUHDG
WHVWEHIRUHDQGDIWHUFUXPEOLQJ
Collect and place crumbled portions into pre-weighed moisture-determination box
and cover with lid.
Repeat until crumbled threads in box weigh at least 6 grams.
Repeat steps to obtain a second box of at least 6 grams of material.
Weigh boxes with crumbled threads; record as Weight of Wet Soil + Tare (block
7a).
Determine water content by following steps of LL test.
o Oven-dry moisture-determination samples (2 minimum); allow to cool,
reweigh and record as Weight of Dry Soil + Tare (block 7b).
o Determine weight of water Ww by subtracting Weight of Dry Soil + Tare
(block 7b) from Weight of Wet Soil + Tare (block 7a); record as Weight Of
Water Ww a b (block 7c).
o Determine weight of dry soil Ws by subtracting Weight of Tare (block 7d)
from Weight of Dry Soil + Tare (block 7b); record as Weight of Dry Soil
Ws b d (block 7e).
o Determine and record water content for each specimen by computing
following formula:
W
Ww
x100
Ws
Determine average water content of samples and record to nearest tenth as PL.
9B!
&1)$
)7))
o
When determining average water content, individual tests must be within ± 1
percent of mean; any individual test not meeting this requirement will not be
used (Figure 16-42 Tare Number 5-P); if no individual test meets this
requirement, additional testing is required
3ODVWLFLW\,QGH[3,'HWHUPLQDWLRQ
Compute plasticity index using following formula:
PI LL PL
o Record as LL PL PI (block 8 PI)
Classify soil by plotting LL versus PI on plasticity chart as follows, referring to
Figure 16-50.
o Material plotted on or above A line is classified as clay; material plotted below
A line is classified as silt.
o Material plotted on or right of 50 percent line has a high LL (H); material
plotted left of 50 percent line has a low LL (L).
o Upper, or U, line is an approximate upper boundary; although not impossible,
any results plotted above U line should be considered suspect and tests
rechecked.
)LJXUH²([DPSOHRI86&63ODVWLFLW\,QGH[FKDUWIRUVRLOFODVVLILFDWLRQ
9B!
&1)$
)7)-
7HVW\RXU.QRZOHGJH6HOHFWWKH&RUUHFW5HVSRQVH
5.
The Navy follows _____ procedures to test representative soil samples.
A.
B.
C.
D.
American National Standards Institute (ANSI)
National Institute for Standards and Technology (NIST)
National Standards Body (NSB)
American Society for Testing Materials (ASTM)
&21&5(7(7(67,1*
Chapter 8 of this course provides information about concrete and its use in the
construction industry. You may recall that concrete is one of the most economical,
versatile, and universally used construction materials, as well as one of the few building
materials that a user can produce directly on the job to meet the specific requirements.
To combine the ingredients correctly (on the job site or nearby), you must know the
required physical properties of both the plastic and the hardened concrete. The
hardened concrete must have the following:
• Strength
• Workability
• Uniformity
• Durability • Watertightness • Consistency
The quality and character of the hardened concrete is greatly influenced by the
properties of the mix when it is plastic. To attain optimum quality, the plastic mix must
be uniform, consistent, and workable while meeting the specified requirements.
Concrete testing is directed toward those properties and specified requirements.
&RQFUHWH7HVWV
In concrete testing, as in soils testing, no single test can provide all of the required
information. Therefore, an array of tests must be performed to gather specific data.
The following describes common tests that you may perform as an Engineering Aid.
$JJUHJDWH7HVWV
An aggregate must provide maximum strength and durability in a concrete mixture.
Fineness, coarseness, and aggregate gradation are factors considered when deriving
the correct concrete mix for a specific construction purpose. Specific gravity, absorption,
and moisture also affect the aggregate’s ability to bind well with cement and water in a
concrete mix.
The components of the final mix (cement, water, and aggregate) must bond adequately
for structural strength and must resist weather and loads.
Correct aggregate selection also reduces the project’s cost. An engineering analysis
determines the aggregate best suited for a particular purpose. (Table 16-8)
9B!
&1)$
)7)%
7DEOH²([DPSOHRI0D[LPXP5HFRPPHQGHG6L]HVRI&RDUVH$JJUHJDWH
6WUXFWXUH
0LQLPXP'LPHQVLRQ,QFKHV
WR
WR
WR
RU0RUH
1/2 to 3/4
3/4 to 1 1/2
1 1/2 to 3
1 1/2 to 3
3/4
1 1/2
3
6
Slabs, heavily reinforced
3/4 to 1
1 1/2
1 1/2 to 3
1 1/2 to 3
Slabs, lightly reinforced
3/4 to 1 1/2
1 1/2 to 3
3
3 to 6
Reinforced walls, beams, and columns
Unreinforced walls
127(0D[LPXPVL]HQRWWRH[FHHGRIPLQLPXPGLPHQVLRQRIDZDOORUVLPLODUVWUXFWXUHRIVODE
WKLFNQHVVIRUKRUL]RQWDOVODERURIPLQLPXPFOHDUVSDFLQJEHWZHHQUHLQIRUFLQJEDUV
In order to provide the strongest and most durable concrete, the aggregate contained in
the mixture must be the best possible in terms of gradation, shape, strength, and
cleanliness. Testing allows the best selection.
These include tests for stockpile sampling, gradation, specific gravity, absorption, and
surface moisture. These tests are not included in this course, but you can learn more
about aggregate testing in NAVFAC MO-330 Materials Testing.
6OXPS7HVWV
“Workability” describes the relative ease or difficulty of placing and consolidating
concrete. During placing, concrete should be as stiff as possible as a homogeneous,
voidless mass. However, too much stiffness makes it too difficult or impossible to work
into forms and around reinforcing steel. Too fluid a mixture is also detrimental.
The measure of concrete’s workability is its slump, which is a design consideration
inversely proportional to the stiffness of the mix.
As shown in Table 16-9, recommended values for slump vary for different types of
construction.
7DEOH²5HFRPPHQGHG6OXPSVIRU9DULRXV7\SHVRI&RQVWUXFWLRQ
7\SHVRIFRQVWUXFWLRQ
6OXPSLQFKHV
0D[LPXP
0LQLPXP
Reinforced foundation walls and footings
5
2
Plain footings, caissons, and substructure walls
Reinforced slabs, beams, and walls
Building columns
Pavements
Heavy mass construction
Bridge decks
Sidewalks, driveways, and slabs on ground
*When high-frequency vibrators are used, the values may be decreased approximately one-third; in no case should
the slump exceed 6 inches.
To measure this designed inverse proportion between stiffness and workability, testers
typically perform slump tests during project preparation as concrete mix trial batches
9B!
&1)$
)7)$
and as quality control during construction. Procedures for performing slump tests will be
explained later in this chapter.
6WUHQJWK7HVWV
Engineers, by a combination of concrete design mix and reinforcing (if necessary), must
balance the strength of concrete (compressibility) with its weakness (flexibility). A
project’s design mix must meet the structure’s intended force loading on a given
element.
Often, trial batches are prepared for a mix design test and as the project progresses, for
a quality control (QC) measure to ensure that concrete mixed on site or delivered to the
field satisfies those specified strengths. These mix design and QC trial batches are then
subjected to the following tests.
&RPSUHVVLRQ7HVW$670&&0
Compression tests are conducted to determine a mix design’s ability to resist a crushing
force.
In a standard compression test,
a load is applied parallel to the
longitudinal axis of a premolded and properly cured
concrete cylinder of a specified
standard size. (Figure 16-51)
A properly conducted test
calculates the maximum
compression load in pounds per
square inch (psi) that the mix
design, or QC sample, can
obtain at the point the cylinder
ruptures.
)LJXUH²([DPSOHRIFRQFUHWHF\OLQGHU
FRPSUHVVLRQWHVW
The test procedures themselves will be covered in EA Advanced, but the procedures for
preparing the cylinders for testing will be discussed later in this chapter.
)OH[XUDO6WUHQJWK7HVW$670&
Flexural strength (modulus of rupture) tests are conducted to determine a concrete’s
ability to resist a breaking force.
9B!
&1)$
)7-1
In a standard flexural test, a
load is applied perpendicular to
the longitudinal axis of a
standard size, pre-molded, and
properly cured concrete beam.
(Figure 16-52)
From this test, the flexural
strength, expressed in terms of
modulus of rupture and given in
psi, can be readily calculated.
)LJXUH²([DPSOHRIIOH[XUDOVWUHQJWKWHVW
As with the compression test, only the procedures to prepare the test beams will be
discussed in this course.
6OXPS7HVWV
The slump test is performed on newly mixed concrete.
To perform the test, you need a
slump cone and a tamping rod.
(Figure 16-53)
The slump cone should be
galvanized steel, 12 inches in
height, with a base opening 8
inches in diameter and top
opening 4 inches in diameter.
The top and bottom openings
are perpendicular to the vertical
axis of the cone.
The tamping rod is a straight
steel rod 5/8 inches in diameter
and approximately 24 inches in
length.
One end of the rod is rounded
to a diameter of 5/8 inches. (Do
not substitute a piece of rebar.)
)LJXUH²([DPSOHRIVXPSWHVWHTXLSPHQW
9B!
&1)$
)7-
6DPSOLQJ3URFHGXUHV$670&
Obtaining a concrete sample for a slump test should be accomplished according to
ASTM C172 Standard Practice for Sampling Freshly Mixed Concrete.
This course will present only the procedure for sampling from a revolving drum transit
mixer (TM) or agitator. If you ever need to obtain a sample from a paving mixer, opentop truck mixer, or other type of equipment, refer to the most recent ASTM C 172.
Samples taken for the test specimens must be representative of the entire batch.
Accomplish this by taking partial samples at two or more regularly spaced intervals
during discharge of the middle portion of the batch.
Pass a scoop or pail repeatedly through the entire discharge stream and combine the
partials into one sample for testing purposes.
Be sure the first and last portions of the combined samples are taken as quickly as
possible while still representing the entire batch, but never exceeding 15 minutes to
gather the combined samples.
If it is necessary to transport samples away from the mixer to another location where the
slump test is to be performed, combine the samples and remix them with a shovel to
ensure uniformity.
7HVWLQJ3URFHGXUHV$670&
Perform slump tests according to ASTM C143 / C143M Standard Test Method for
Slump of Hydraulic-Cement Concrete. Be sure to start the test within 5 minutes after
obtaining the final portion of the composite sample.
Perform the following steps to determine the slump:
Moisten inside of slump cone and place it on a flat, moist, nonabsorbent (rigid)
surface. Hold in place during filling by standing on two foot pieces.
NOTE: Complete the following steps in an elapsed time of no more than 2 1/2 minutes.
Fill slump cone to one-third volume (2 5/8 inches high) with plastic concrete.
Rod concrete by applying 25 evenly distributed strokes; penetrate full depth of
first layer.
Add second layer until two-thirds volume filled (about 6 1/8 inches high).
Rod second layer as first with rod just penetrating underlying first layer.
Add third and last layer; overfill if possible.
Rod third layer as second with rod just penetrating underlying second layer; if
height subsides below top of cone, add concrete to keep above top of mold.
Strike off excess concrete with tamping rod in screeding and rolling motion so
cone is completely filled.
Remove slump cone from concrete.
o Place hands on handles and press downward.
o Step off footholds.
o Raise cone carefully and quickly in vertical direction.
-
Raise cone a distance of 12 inches within 5 to 7 seconds by a steady
upward lift with no lateral or twisting motion.
9B!
&1)$
)7-
o Place cone directly beside slumped concrete.
-
At this point, about 2 1/2 minutes should have elapsed since start of filling.
Measure and record
slump immediately, as
shown in Figures 16-54
and 16-55.
o Place tamping rod
along top of cone so it
projects over
concrete.
o Measure slump from
bottom of rod to top
center of concrete
with a ruler.
o Record slump to
nearest ¼ inch.
)LJXUH²([DPSOHRIPHDVXULQJVOXPS
If a decided falling away or
shearing off occurs from one
side or portion of the specimen
mass, disregard the
measurement and make a new
test on another portion of the
sample.
If two consecutive tests show
falling away or shearing off, the
concrete probably lacks the
necessary plasticity and
cohesiveness for the slump test
to be applicable.
)LJXUH²6HDEHHSHUIRUPLQJVOXPSWHVW
9B!
&1)$
)7-
After measuring and recording to the nearest ¼ inch, the slump test is complete.
However, as a supplementary procedure, tap the sides of the specimen gently with the
tamping rod. The reaction of the concrete will indicate its cohesiveness and workability.
A well-proportioned, workable mix gradually slumps to lower elevations and retains its
original identity. A poor mix crumbles, segregates, and falls apart.
If a slump test is for a mix design’s trial batch, then too little or too much slump indicates
the need for a new trial batch with revised mix proportions.
When the test is for a quality control measure, the slump obtained by testing will be
compared to the slump specified for that particular project or element of that project. If
QC testing reveals too little or too much slump, the quality control inspector or other
appropriate authority will need to determine whether to accept or reject the concrete.
3UHSDUDWLRQRI&RQFUHWH6SHFLPHQV
Concrete specimens representative of a distinct batch of concrete must be sampled and
analyzed for quality control. The number of specimens tested depends on the job
specifications. If no requirement is listed in the specifications, a minimum of 2 will be
molded for each test age for each 100 cubic yards, or fraction thereof, of each class of
concrete placed in any one day.
A third specimen may be taken to assist in determining when forms may be removed.
The test specimens must remain on site and undisturbed for an initial curing period (the
first 16 to 48 hours after molding). Normally the test ages are 7 and 28 days for
compressive strength tests.
&\OLQGHU6SHFLPHQV
Concrete cylinder specimens are taken to perform tests evaluating the compressive
strength of the concrete. (Figure 16-56)
Compressive strength is defined
as the average of the strengths
of all cylinders of the same age
made from a sample taken from
a single batch of concrete.
At least two cylinders are
required to constitute a test.
Therefore, a minimum of four
specimens are required if tests
are to be made at 7 and 28
days.
The test results will be the
average of the strengths of the
two specimens tested at 28
days.
The standard cylindrical
specimen is 6 inches in
diameter by 12 inches long.
)LJXUH²7\SLFDOFRQFUHWHF\OLQGHUPROG
9B!
&1)$
)7-&
6WDQGDUGVIRU&\OLQGHU0ROGV
Cylinder molds should be made
of steel, cast iron, or other
nonabsorbent material that does
not react with concrete
containing Portland cement or
other hydraulic cements.
Molds should hold their
dimensions and shapes under
severe use.
They should hold water poured
into them without leakage.
(Figure 16-57)
)LJXUH²6HDEHHPDNLQJW\SLFDOFRQFUHWH
F\OLQGHUPROGV
)LOOLQJ&\OLQGHU0ROGV
Place the molds on a level, rigid surface, free of vibration or other disturbances, at a
place as near as possible to the location where they are to be stored for the first 24
hours.
Perform the following steps to produce and label a concrete cylinder for testing:
Prepare mold.
o Clean and dry.
o Oil lightly.
o Assemble.
Make cylinder.
o Fill mold one-third full with fresh concrete.
o Consolidate concrete by applying 25 evenly distributed strokes over mold’s
surface area with tamping rod; rod must totally penetrate layer.
o Tap side of mold 8 to 10 times with tamping rod.
o Add concrete to two-thirds full.
o Apply 25 evenly distributed strokes to mold’s surface area using rounded end
of tamping rod; rod must pass through second layer and 1 inch into first layer.
o Tap side of mold 8 to 10 times with tamping rod.
o Add concrete to slightly overfill.
9B!
&1)$
)7-
o Apply 25 strokes; rod must pass entirely through and 1 inch into second layer.
o Tap side of mold 8 to 10 times with tamping rod.
o Trowel off concrete so it is flush with top of mold and smoothly finished.
Label mold; as a minimum, label should include:
o Specimen number.
o Date cylinder was made.
o Project or placement concrete came from.
-
The system of labeling is optional. The information should be recorded on
a paper tag or gummed label and attached to the mold.
Cover cylinder with plastic or wet burlap to maintain moisture; covering should be
tight around cylinder but not make contact with fresh concrete.
Allow cylinder to cure undisturbed for 24 hours.
Remove covering and mold from cylinder after 24 ( 8) hours.
Transfer label from mold to concrete cylinder; label may be transferred or
information recorded directly on cylinder with grease pencil.
Cure cylinder.
&XULQJDQG6WRULQJ&\OLQGHUV
During the initial curing period of test specimens, be sure to take precautions to prevent
the evaporation and loss of water in the specimens. After an initial curing period of16 to
48 hours, remove specimens from the job site that are intended for checking the
strength of trial design mixtures or QC of field concrete.
Take them to the testing laboratory, moist-cure them at 73.4°F, and store them in moist
rooms, damp sand or sawdust, or limewater to maintain free water on all surfaces of the
specimen at all times.
Occasionally, some test specimens are made in the field to determine when forms may
be removed. These specimens are in addition to the required number of specimens
formed for strength determination. Give these specimens (as much as possible) the
same protection as the specimens for compression testing. Store them in or on the
structure as near as possible to the point of use. Test them in the moist condition
resulting from the specified curing treatment.
Specimens intended for testing to determine when a structure may be put into use are
removed from the molds at the same time the forms are removed from the structure.
To ship specimens to a laboratory, pack them in a sturdy wooden box or other suitable
container surrounded by wet sawdust or wet sand. Provide protection from freezing
during storage or shipment. Moist curing is continued when the specimens are received
in the laboratory.
&DSSLQJ&\OLQGHUV
To prepare cylinders for testing, plane the ends of compression-test specimens within
0.002 inch and within 0.5 degree of being perpendicular to the axis of the cylinder.
2 to 4 hours after molding, cap specimens formed in strong metal molds having
accurately flat baseplates.
9B!
&1)$
)7-)
Make a stiff paste of Portland cement and water at time cylinder is molded so
capping mixture will shrink before application.
Remove any free water or laitance (layer of fine particles on surface) from end of
specimen.
Apply paste to top of concrete and work with a flat plate until smooth and level
with top of mold.
Grind hardened concrete specimens to smooth the ends or cap them with a material
having greater compressive strength than the concrete.
Prepared mixtures of sulfur and granular materials, special high-strength gypsum
plasters, and neat high-early strength cement are satisfactory capping materials.
Ordinary low-strength plaster of paris, compressible rubber, or fibrous materials
are not suitable for caps.
Apply selected material in a plastic state and finish to desired plane surface by
applying glass or metal plates and squeezing out excess material to provide a
cap that is as thin as possible.
Apply sulfur caps in time to harden at least 2 hours before testing. Plaster caps cannot
be stored over 4 hours in the moist room. Age neat cement caps 6 days or more in the
moist room (2 days when Type II cement is used).
During capping, protect moist-cured specimens against drying by covering them with
wet burlap.
There are numerous alternatives to sulfur caps listed in ASTM C 617 Standard Practice
for Capping Cylindrical Concrete Specimens. If you must use sulfur caps, ensure that
sulfur vapors are not inhaled while heating the capping compound. Ensure there is
adequate ventilation and respiratory protection is used. Used sulfur capping compound
is a hazardous material and must be properly disposed of.
%HDP6SHFLPHQV
The flexural strength of hardened concrete is measured by using a simple concrete
beam and third-point loading mechanism. The flexural strength is determined by
calculating measured breaks of the beam and is expressed as a modulus of rupture in
psi.
The standard beam specimen is 6 x 6 x 21 inch (152 x 152 x 532 mm.) for concrete in
which the maximum size of the coarse aggregate is 2 in. (50 mm). When the maximum
size of the coarse aggregate exceeds 2 in. (50 mm), the smaller cross-sectional
dimension is to be increased to at least three times the nominal maximum size of the
coarse aggregate.
All beam specimens prepared in the field are to be the standard beam size (6 in. wide
by 6 in. deep by 21 in. long) unless required otherwise by project specifications.
6WDQGDUGVIRU%HDP0ROGV
Beam molds are to be smooth on all interior surfaces and free from warpage. The molds
are to produce specimens that do not exceed the required cross-sectional dimensions
by 1/8 inches. The length of a specimen is not to be more than 1/16 inches shorter than
the specified length, but may exceed that length.
9B!
&1)$
)7--
5RGGLQJ
Assemble a standard 6- x 6- x 21-inch concrete-beam mold and lightly oil the inside. Fill
the mold with two layers of concrete from the production batches, each about 3 inches
deep. Consolidate each layer by rodding, using one stroke per 2 square inches (63 per
layer), evenly distributed over the layer’s surface.
Tap the sides lightly 10 to 15 times with a rubber mallet to close the voids left by
rodding. Lightly spade the concrete along the mold’s sides with a trowel to help remove
surface voids. When rodding the second layer, penetrate the first layer about 1/2 inch.
Strike off the top surface with a straightedge, finish it with a wood or magnesium float.
&XULQJ
Place a suitable identifying label on the finished surface of the specimens. Cover the
entire specimens—still in the mold—with a double thickness of wet burlap. Ensure that
the specimens remain on site and are undisturbed for an initial curing period (the first 16
to 48 hours after molding).
After this curing period, move them to the testing laboratory and remove them from the
molds for further curing. The most satisfactory curing range for concrete is 68° to 86°F,
with 73.4°F being the most favorable temperature. Moist-cure the beams in saturated
lime water, totally submerged in a wet-tank humidity room, or keep them wet until they
are tested.
When transporting specimens from the field to the laboratory, be sure they are
sufficiently cushioned to protect them from damage by jarring. Additional measures are
required to prevent damage by freezing temperatures and moisture loss. You can
prevent moisture loss by covering the specimens with plastic or surrounding them by
wet sand or wet sawdust.
9B!
&1)$
)7-%
6XPPDU\
Engineering Aids are part of a project from its initial stages. (Figure 16-58) Proper
testing and analysis of local soil and available aggregate can determine the feasibility of
a project at a proposed site. As an EA, the data and information you garner will allow
design engineers to make decisions about the foundation (earth) under a foundation,
and determine the viability of aggregate use in a concrete mix design. Each decision
has its associated cost impact, so your accurate calculations are important in multiple
ways.
)LJXUH²0DWHULDOVWHVWLQJDSSOLHVWRVRLOVDJJUHJDWHDQGFRQFUHWH
9B!
&1)$
)7-$
5HYLHZ4XHVWLRQV6HOHFWWKH&RUUHFW5HVSRQVH
1.
Soil is a mixture of mineral grains enclosing various sizes of voids that contain
_____.
A.
B.
C.
D.
2.
Into how many groups do geologists classify rock?
A.
B.
C.
D.
3.
Igneous
Sedimentary
Metamorphic
Organic
What classification of rock is formed by pressure and heat applied to existing
rock?
A.
B.
C.
D.
6.
Igneous
Sedimentary
Metamorphic
Organic
What classification of rock is formed by accumulation of particles and remains of
plants and animals?
A.
B.
C.
D.
5.
Two
Three
Four
Five
What classification of rock is formed by cooling from a molten state?
A.
B.
C.
D.
4.
air (or other gases)
water
organic matter
air (or other gases), water, and organic matter
Igneous
Sedimentary
Metamorphic
Organic
What is the term for the physical and chemical process that transforms rock into
a loose, incoherent mixture?
A.
B.
C.
D.
Atmospheric exposure
Decomposition
Disintegration
Weathering
9B!
&1)$
)7%1
7.
7UXHRU)DOVH Transported soil will reflect the characteristics of the underlying
parent rock from which it was derived.
A.
B.
8.
Examples of alluvial soil can be found in _____.
A.
B.
C.
D.
9.
mouths of river deltas
freshwater lakes and rivers
dunes
eskers, kames, and moraines
What is the term for fine particles that pass the No. 200 sieve and exhibit
plasticity and strength?
A.
B.
C.
D.
13.
mouths of river deltas
freshwater lakes and rivers
dunes
eskers, kames, and moraines
Examples of glacial soil can be found in _____.
A.
B.
C.
D.
12.
mouths of river deltas
freshwater lakes and rivers
dunes
eskers, kames, and moraines
Examples of aeolian soil can be found in _____.
A.
B.
C.
D.
11.
mouths of river deltas
freshwater lakes and rivers
dunes
eskers, kames, and moraines
Examples of lacustrine soil can be found in _____.
A.
B.
C.
D.
10.
True
False
Marine soil
Clay
Silt
Colluvial soil
What is the term for fine particles that pass the No. 200 sieve and exhibit little
plasticity and strength?
A.
B.
C.
D.
Marine soil
Clay
Silt
Colluvial soil
9B!
&1)$
)7%
14.
According to the Unified Soil Classification System, materials retained on a 3inch sieve are classified as _____.
A.
B.
C.
D.
15.
Which bulky particle shape is considered the most desirable for construction
purposes?
A.
B.
C.
D.
16.
2.60 -- 2.65
2.60 -- 2.80
2.65 – 3.00
3.00 -- 3.50
Which soil property has the greatest effect on soil when subject to loading?
A.
B.
C.
D.
20.
closely packed soil particles interlock with smaller grains
uniformly graded large particles compact together
uniformly graded small particles compact together
uniformly graded intermediate particles compact together
What is the minimum-maximum specific gravity range of most inorganic soils?
A.
B.
C.
D.
19.
uniformly graded large
uniformly graded small
uniformly graded intermediate
a good representation of all
In a dense structure with a high degree of compactness, _____.
A.
B.
C.
D.
18.
Angular
Subangular
Rounded
Subrounded
Well-graded soils consist of _____ particle sizes.
A.
B.
C.
D.
17.
sands
fines
gravels
cobbles
Specific gravity
Gradation
Moisture Content
Plasticity
Which of the following best describes the term “hydroscopic moisture”?
A.
B.
C.
D.
Soil water absorbed by the atmosphere
Absorbed moisture in soil at any time
Absorbed moisture in air-dried soil
Thin films of water surrounding soil particles
9B!
&1)$
)7%
21.
Which of the following factors does the term “moisture content” (symbol W ) refer
to?
A.
B.
C.
D.
22.
Which of the following properties of fine-grained soil permits clay to be rolled into
thin threads at certain moisture contents without crumbling?
A.
B.
C.
D.
23.
Liquid Limit
Plastic Limit
Plasticity Index
Shrinkage Limit
Which of the following terms is used to describe the moisture content
corresponding to the arbitrary limit between the plastic and semisolid state?
A.
B.
C.
D.
26.
Liquid Limit
Plastic Limit
Plasticity Index
Shrinkage Limit
Which of the following terms is used to describe the moisture content
corresponding to the arbitrary limit between the liquid and plastic state of a soil?
A.
B.
C.
D.
25.
Liquidity
Consistency
Plasticity
Cohesiveness
Which of the following terms is used to describe the boundary where further loss
of moisture does not change a soil’s volume?
A.
B.
C.
D.
24.
The amount of free water in a soil sample
The proportion of the weight of water to the weight of wet soil expressed
as a percentage
The amount of hydroscopic moisture in a soil sample
The proportion of the weight of water to the weight of dry soil expressed
as a percentage
Liquid Limit
Plastic Limit
Plasticity Index
Shrinkage Limit
Which of the following constructions would be least affected by soil moisture?
A.
B.
C.
D.
An asphaltic-cement road laid on a sand-clay admixture
A concrete building foundation laid on a base of fine-grained soil
A concrete building foundation laid on a gravel base
An asphaltic-cement runway laid on a gravel-clay admixture
9B!
&1)$
)7%
27.
What soil classification often undergoes large volume changes with variations in
moisture content?
A.
B.
C.
D.
28.
According to the United Soil Classification System, what are the three major
divisions of soil classifications?
A.
B.
C.
D.
29.
Compaction capabilities
Moisture content
Soil profile
All of the above
From which of the following locations was a soil sample tagged CB-P3-1 taken?
A.
B.
C.
D.
32.
Gravel
Sand
Clay
Silt
When samples are taken by test holes with the hand auger, the samples may be
completely disturbed, but they are satisfactory for determining which of the
following information?
A.
B.
C.
D.
31.
Course-grained, Fine-grained, Organic
Course-grained, Fine-grained, Sand
Course-grained, Peat, Organic
Cobble, Fine-grained, Organic
What is the soil classification when less than half of the coarse-grained portion of
a soil sample is retained on a No. 4 sieve?
A.
B.
C.
D.
30.
Gravel
Sand
Silt
Clay
Project CB, bag No. P3, pit No. 1
Project CB, pit No. 3, location No. 1
Construction battalion pit No. 3, area No. 1
Construction borrow pit No. P3, bag No. 1
For which of the following tests are disturbed samples satisfactory for use?
A.
B.
C.
D.
Mechanical analysis
Frost susceptibility
Specific gravity
All of the above
9B!
&1)$
)7%&
33.
How large a sample is enough to determine the moisture content of fine-grained
soils?
A.
B.
C.
D.
34.
A moisture content sample taken at 0730 will not be tested until 1430. At a
minimum, what action, if any, should be taken to prevent the evaporation of
moisture from the soil?
A.
B.
C.
D.
35.
Highly plastic
Cohesionless
Slightly plastic
Moderately cohesive
Which of the following steps should be taken next after removing a CBR mold
and undisturbed sample from a hole?
A.
B.
C.
D.
38.
In-place density
Shear strength
Compressive strength
All of the above
For which of the following soil types would an undisturbed chunk sample be best
suited for sampling?
A.
B.
C.
D.
37.
Seal the canister with friction tape.
Dip the canister in paraffin.
Wrap the canister with a paraffin-coated cloth.
None, since the test will be performed within 1 day.
For which of the following soil properties are undisturbed soil samples tested?
A.
B.
C.
D.
36.
50 grams
75 grams
100 grams
200 grams
Remove the cutting edge.
Coat the top of the sample with paraffin.
Remove the upper collar and trim a ½-inch recess in the top of the mold.
Place boards over both ends.
Which of the following methods is one way to be certain that a soil sample is
representative of the whole sample?
A.
B.
C.
D.
Soaking
Straining
Quartering
Halving
9B!
&1)$
)7%
39.
What quarter(s) should you discard when quartering a sample?
A.
B.
C.
D.
40.
Any single quarter
Two adjacent quarters
Two diagonally opposite quarters
Any three quarters
What is the identified sequence of a complete soil test as laid down by the
American Society for Testing Materials (ASTM)?
A
B
C
D
E
F
A.
B.
C.
D.
Determine specific gravity
Determine moisture content
Determine moisture-density relationship
Determine grain size and distribution
Determine the field moisture content
Determine Atterberg limits
A, B, F, C, E, D
B, C, A, D, F, E
B, D, A, F, C, E
B, D, C, A, E, F
5HIHUWR)LJXUH3&IRUTXHVWLRQV
7DEOHRI9DOXHVIURP'')RUP
&RPSXWHZDWHUFRQWHQWIRUHDFKUXQ
7HVW
1DWXUDO6RLO0RLVWXUH&RQWHQW
Run Number
1
2
3
Tare Weight
6
7
9
A. Weight of Tare + Wet Soil
196.4
187.3
209.6
B. Weight of Tare + Dry Soil
176.8
169.9
190.2
C. Weight of Water, Ww A B D. Weight of Tare
Ww
x100
Ws
grams
grams
43.6
44.0
46.4
grams
E. Weight of Dry Soil, Ws B D Water Content, w grams
grams
%
%
%
)LJXUH3&
41.
What is the dry weight in grams of the soil in run number 1?
A.
B.
C.
D.
176.8
152.8
143.6
133.2
9B!
&1)$
)7%)
42.
What is the weight of water in grams in run number 2?
A.
B.
C.
D.
43.
What is the water content of run number 3?
A.
B.
C.
D.
44.
When the sample is too dry
When the sample has an undesirable water content
When the sample contains too little superfine materials
When the sample contains cohesive soil forming hard lumps
_____ retain on a No. 4 sieve.
A.
B.
C.
48.
½ inch
No.4
No.40
No. 200
When is it necessary to prewash a sample before proceeding with a normal dry
sieve analysis?
A.
B.
C.
D.
47.
13.4%
14.0%
31.1%
41.9%
Sieve analysis applies to soils that are larger than the _____ sieve.
A.
B.
C.
D.
46.
13.0%
13.2%
13.5%
17.4%
What is the average moisture content of the three runs?
A.
B.
C.
D.
45.
17.4
17.6
18.4
18.6
Sands
Fines
Gravels
_____ pass a No. 4 sieve and retain on a No. 200 sieve.
A.
B.
C.
Sands
Fines
Gravels
9B!
&1)$
)7%-
49.
_____ pass a No. 200 sieve.
A.
B.
C.
50.
During a sieve analysis, 2% of the material passed the No. 200 sieve. What
subsequent test should you perform on the sample to determine this soil’s
susceptibility to frost?
A.
B.
C.
D.
51.
D.
Ws dry weight of the sample
K correction factor based on the density of water at 20ºC
Wbw weight of the flask filled with water only
Wbws weight of the flask, water, and sample
How should the surface of a saturated-surface-dry (SSD) #(##?
A.
B.
C.
D.
54.
Only those larger than the No. 40 sieve
Only those retained on the No. 4 sieve
Only those passing the No. 4 sieve
Materials passing the No. 200 sieve
Which factor in the calculation for Specific Gravity of Solids has the least impact
Ws K
on the outcome?
Gs Ws Wbw Wbws
A.
B.
C.
53.
Hydroscopic moisture content
Hydrometer analysis
Specific gravity
Moisture-density relationship
Which of the following materials should you test for specific gravity of solids after
a sieve analysis has been performed?
A.
B.
C.
D.
52.
Sands
Fines
Gravels
Very wet
Very dry
Damp
Pitted
The _____ is the point at which the material contains the greatest water content
and remains plastic.
A.
B.
C.
D.
plasticity index (PI)
plastic limit (PL)
liquid limit (LL)
shrinkage limit (SL)
9B!
&1)$
)7%%
55.
The _____ is the point at which the material contains the lowest water content
and remains plastic.
A.
B.
C.
D.
56.
The _____ is the point at which, with further drying, shrinkage stops.
A.
B.
C.
D.
57.
First and middle
Middle only
First and last
Middle and last
How many times is each layer of a slump test rodded?
A.
B.
C.
D.
61.
Compressibility
Workability
Durability
Strength
From which portion of a batch should a slump test be taken at 2 or more regularly
spaced intervals?
A.
B.
C.
D.
60.
Below 50 LL
Above 51 LL
Below A line
Above U line
What property of concrete does the slump test measure?
A.
B.
C.
D.
59.
plasticity index (PI)
plastic limit (PL)
liquid limit (LL)
shrinkage limit (SL)
Beyond what limit should you consider results suspect when entering data on a
USCS Plasticity Chart?
A.
B.
C.
D.
58.
plasticity index (PI)
plastic limit (PL)
liquid limit (LL)
shrinkage limit (SL)
10
15
25
30
For a slump test, what should the elapsed time be from beginning of fill to lifting
the cone?
A.
B.
C.
D.
2 ½ minutes
5 minutes
7 ½ minutes
10 minutes
9B!
&1)$
)7%$
62.
What are the dimensions of a standard concrete cylinder specimen?
A.
B.
C.
D.
63.
6 in. diameter by 6 in. long
6 in. diameter by 12 in. long
8 in. diameter by 6 in. long
8 in. diameter by 12 in. long
A standard size cylinder specimen should be filled in _____ layers and rodded
_____ times at each layer.
A.
B.
C.
D.
2, 25
2, 50
3, 25
3, 50
9B!
&1)$
)7$1
7UDGH7HUPV,QWURGXFHGLQWKLV&KDSWHU
$WWHUEHUJ
&DOLIRUQLD%HDULQJ5DWLR
&%5
&ROORLGDO
+\GURPHWHU
/DWHULWH
1RPRJUDSKLFFKDUW
:HDWKHULQJ
9B!
&1)$
Albert Mauritz Atterberg (1846–1916). Swedish chemist
and agricultural scientist who created the Atterberg
limits commonly referred to by geotechnical engineers
and engineering geologists.
A penetration test for evaluation of the mechanical
strength of road subgrades and basecourses.
Of a mixture in which very small particles of one
substance are distributed evenly throughout another
substance. The particles are generally larger than those
in a solution and smaller than those in a suspension.
An instrument used to measure the specific gravity (or
relative density) of liquids, that is, the ratio of the density
of the liquid to the density of water.
A red, porous, claylike soil formed by the leaching of
silica-rich components and enrichment of aluminum and
iron hydroxides.
A chart representing numerical relationships.
The physical disintegration and chemical decomposition
of earth materials at or near the earth's surface.
)7$
$GGLWLRQDO5HVRXUFHVDQG5HIHUHQFHV
This chapter is intended to present thorough resources for task training. The following
reference works are suggested for further study. This is optional material for continued
education rather than for task training.
Materials Testing, FM 5-472 Ch.2 /NAVFAC MO 330/AFJMAN 32-1221(I)
Headquarters, Department of the Army, Washington, DC, 1 July 2001
Standard Method for Particle-Size Analysis of Soils, ASTM D422-63, American Society
for Testing and Materials, Philadelphia, Pa., 2007.
Standard Practice for Capping Cylindrical Concrete Specimens, ASTM C617 98(2003), American Society for Testing and Materials, Philadelphia, Pa., 2003.
Standard Practice for Making and Curing Concrete Test Specimens in the Field, ASTM
C31 / C31-8b, American Society for Testing and Materials, Philadelphia, Pa, 2008.
Standard Practice for Sampling Freshly Mixed Concrete, ASTM C172-08, American
Society for Testing and Materials, Philadelphia, Pa., 2008.
Standard Practice for Classification of Soils for Engineering Purposes (Unified Soil
Classification System), ASTM D2487 - 06e1, American Society for Testing and
Materials, Philadelphia, Pa., 2006.
Standard Test Methods for Laboratory Determination of Water (Moisture) Content of
Soil and Rock by Mass ASTM D2216 – 05, American Society for Testing and Materials,
Philadelphia, Pa., 2005.
Standard Test Methods for Liquid Limit, Plastic Limit, and Plasticity Index of Soils,
ASTM D4318 – 05, American Society for Testing and Materials, Philadelphia, Pa, 2005.
Standard Test Method for Slump of Hydraulic Cement Concrete, ASTM C143 / 143M 08, American Society for Testing and Materials, Philadelphia, Pa, 2008.
9B!
&1)$
)7$
CSFE Nonresident Training Course – User Update
+',30,#(#77(
.##0(##803#3(?
0?0##(,?0+'(?
#(2(?##06(D
#;?#?(#??##(;(>#2((
;;(
32,00
.A
+'9-
1#+
?$ 1
':A
%1C$%71%
7(A
+'M9
O30(
MMMM9MMMMMMMMMMMMMMMMMMMMMMMMMMMMMMMMMMMMMMMMMMMMM
3!MMMMMMMMMM#9;MMMM9;<=MMMMMMMMMMMM
!#
MMMMMMMMMMMMMMMMMMMMMMMMMMMMMMMMMMMMMMMMMMMMMMMMMMMMMMMMMMMMMMM
MMMMMMMMMMMMMMMMMMMMMMMMMMMMMMMMMMMMMMMMMMMMMMMMMMMMMMMMMMMMMMM
MMMMMMMMMMMMMMMMMMMMMMMMMMMMMMMMMMMMMMMMMMMMMMMMMMMMMMMMMMMMMMM
<F#(=
MMMMMMMMMMMMMMMMMMMMMMMMMMMMMMMMMMMMMMMMMMMMMMMMMMMMMMMMMMMMMMM
MMMMMMMMMMMMMMMMMMMMMMMMMMMMMMMMMMMMMMMMMMMMMMMMMMMMMMMMMMMMMMM
MMMMMMMMMMMMMMMMMMMMMMMMMMMMMMMMMMMMMMMMMMMMMMMMMMMMMMMMMMMMMMM
<F#(=>9
MMMMMMMMMMMMMMMMMMMMMMMMMMMMMMMMMMMMMMMMMMMMMMMMMMMMMMMMMMMMMMM
MMMMMMMMMMMMMMMMMMMMMMMMMMMMMMMMMMMMMMMMMMMMMMMMMMMMMMMMMMMMMMM
MMMMMMMMMMMMMMMMMMMMMMMMMMMMMMMMMMMMMMMMMMMMMMMMMMMMMMMMMMMMMMM
9B!
&1)$
)7$