1
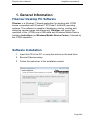
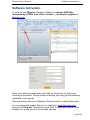
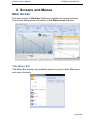
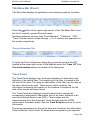
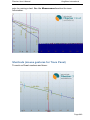
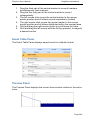
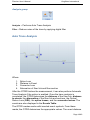
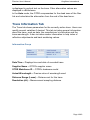
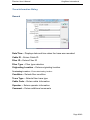
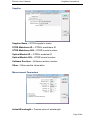
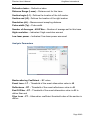
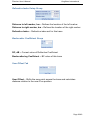
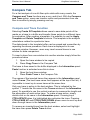
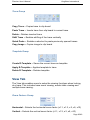
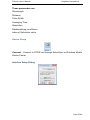
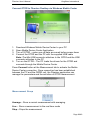
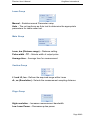
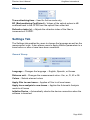
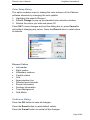
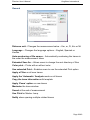
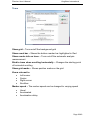
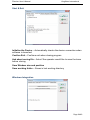
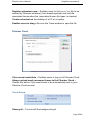
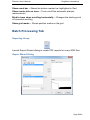
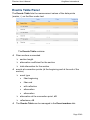
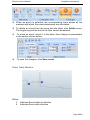
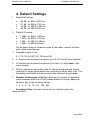
Fiberizer User’s Manual Kingfisher International Fiberizer Desktop User’s Manual V. 1.2 December 14, 2013 Page 1/40 Fiberizer User’s Manual Kingfisher International Table of Contents 1. GENERAL INFORMATION ................................................... 4 Fiberizer Desktop PC Software.................................................................. 4 Software Installation .................................................................................... 4 Software Activation ..................................................................................... 5 2. SCREENS AND MENUS ....................................................... 6 Main Screen .................................................................................................. 6 Title Menu Bar .................................................................................................6 Tab Menu Bar (Panel) ....................................................................................7 Trace Panel .....................................................................................................7 Shortcuts (mouse gestures for Trace Panel) ..............................................8 Event Table Panel ..........................................................................................9 Preview Panel .................................................................................................9 Trace List Panel ............................................................................................10 Parameters Panel .........................................................................................10 3. OPERATIONS ........................................................................ 11 Event Markers Tab ..................................................................................... 11 2 Markers Tab – 2PT and LSA Measurement Modes ........................... 14 Optical Return Loss (ORL) Tab ............................................................... 16 Trace Analysis ............................................................................................ 17 Auto Trace Analysis .....................................................................................18 Trace Information Tab ............................................................................... 19 Compare Tab .............................................................................................. 24 Compare and Trace Function .....................................................................24 Page 2/40 Fiberizer User’s Manual Kingfisher International View Tab ...................................................................................................... 25 Measurement Tab ...................................................................................... 26 Settings Tab ................................................................................................ 30 Batch Processing Tab ............................................................................... 36 Events Table Panel .................................................................................... 37 4. DEFAULT SETTINGS.......................................................... 39 Page 3/40 Fiberizer User’s Manual Kingfisher International 1. General Information Fiberizer Desktop PC Software Fiberizer is a Windows™ based application for working with OTDR traces, compatible with Windows™ XP/Vista/7 (x86/x64) operating systems. The software is capable of displaying, storing, printing and analyzing several traces simultaneously. Fiberizer can control the operation of the OTDRs via a USB cable and Windows Mobile Device Interface AcitveSync (or Windows Mobile Device Center) if desired by the OTDR operators. Software Installation 1. Insert the CD to the PC or unzip the archive to the hard drive. 2. Execute Fiberizer setup. 3. Follow the instruction of the installation wizard. Page 4/40 Fiberizer User’s Manual Kingfisher International Software Activation In order to use Fiberizer Desktop software to analyze SOR files measured by OTDRs from other vendors - you need to register at fiberizer.com. Enter your account parameters and wait for the server to verify your licensing information. During license verifying you may get the following notification from server: Some problems with your Fiberizer Cloud account or subscription plan. In most cases this means that you’ve used your www.fiberizer.com account for Fiberizer Desktop on more than 5 computers, which is the limitation of single account on multiple devices. Page 5/40 Fiberizer User’s Manual Kingfisher International 2. Screens and Menus Main Screen The main screen of Fiberizer Desktop is divided into several sections. The section below gives a summary of the Main screen features. Title Menu Bar Title Menu Bar displays the available system level pull-down File menu and zoom shortcuts. Page 6/40 Fiberizer User’s Manual Kingfisher International Tab Menu Bar (Panel) Tab Menu Bar displays all application commands grouped by functions. Press the button at the upper right corner of the Tab Menu Bar to see the list of currently opened files and traces. Switching between tab bars (like “Event Markers”, “2 Markers”, “ORL”, “Trace”) cause markers mode change - 5 or 2 markers are appeared on the screen respectively. Trace Information Tab To open the Trace Information dialog box, press the arrow button located at the lower right corner of the Info tab under the Trace tab. See Trace Information section for details of the dialog box. Trace Panel The Trace Panel displays the visual representation of attenuation and reflection of an optical fiber. The beginning of the fiber is located at the left side of the trace. The slope or attenuation of the fiber can be seen as the trace moves to the right. There are two active markers, the information containing the location of the markers is located at the left side of the screen as shown below. The Trace Panel also displays several measurement values that correspond to attenuation, attenuation loss at an event, distance to an event and Optical Return Loss (ORL). These values are the measurements from the Automatic Trace Analysis that the OTDR performed in Automatic mode. See the Trace Analysis section for more information. The testing parameters for the active trace are located at the Information Panel below the Trace Panel. All parameters are preset by the operator Page 7/40 Fiberizer User’s Manual Kingfisher International prior to running a test. See the Measurement section for more information. Shortcuts (mouse gestures for Trace Panel) To work on Event markers and trace: Page 8/40 Fiberizer User’s Manual Kingfisher International 1. Drag the thick part of the central marker to move all markers simultaneously (lock markers) 2. Drag the thin (top) part of the central marker to move it independently 3. The left mouse click moves the central marker to the mouse pointer position and all others moved respectively (locked) 4. The right mouse click moves the central marker to the mouse pointer position and all others distributed within the zoomed area 5. Hold and drag the right mouse button to scroll/move the trace 6. Hold and drag the left mouse with the Alt key pressed, to magnify a desired section Event Table Panel The Event Table Panel displays saved events in a tabular format Preview Panel The Preview Panel displays the current trace section relative to the entire trace. Page 9/40 Fiberizer User’s Manual Kingfisher International Trace List Panel The Trace List Panel displays the list of traces for the current window and their colors. Parameters Panel The Parameters Panel displays the trace parameters X – Shows the distance range of the displayed section and the scale of the distance on the horizontal axis Y – Shows the range of loss in dB for the entire trace window and the scale of the loss per division on the vertical axis Fiber Type – Identifies the fiber type (multimode or single mode) and the wavelength N – Displays the Refractive Index of the fiber Lmax – Displays the total distance range Tp – Displays the duration of the pulse width used Nav – Indicates the number of averages L1 – Indicates the distance from the beginning of the fiber to the beginning of the measured section L2 – Indicates the distance from the beginning of the fiber to the end of the measured section In order to reach more accurate measurements, it may be necessary for the technician to adjust certain testing parameters for the specific fiber under test. The operating parameters should be set according to the characteristics of the fiber link under test. For short fiber run, shorter pulse widths and fewer averages are optimum. For longer fiber run, longer pulse widths and more averages are the best. The parameters chosen by users are dependent on the testing requirements. Tradeoffs may be necessary sometimes. Page 10/40 Fiberizer User’s Manual Kingfisher International 3. Operations Event Markers Tab After the OTDR finishes the measurement, it can also perform Automatic Trace Analysis if the option is enabled. Once the trace analysis is completed, the OTDR determines the distance of the fiber line, distance to events, the attenuation of the fiber link and sections, the Optical Return Loss (ORL), the splice losses and the connector losses. The events are also displayed in the Events Table. The OTDR creates marks with inserted event symbols. From these marks, the OTDR determines the appropriate values. The event distance is indicated with the vertically oriented text on the trace. Fiber attenuation values are displayed in dB/distance. Length group Distance, km – Enables users to change distance of event marker L, km – Adjusts main Left marker R, km – Adjusts main Right marker Additional Markers group Left, km - Adjusts the left-most marker of LSA Right, km – Adjusts the right-most marker of LSA Page 11/40 Fiberizer User’s Manual Kingfisher International Splice group - LSA mode is only availalble when users are working on events. dB field displays the splice loss value calclulated with 5-Markers LSA method. By using the Five Markers method, the OTDR can measure the attenuation of a specific event. The Five Markers method works as described below. The left marker (L) and the right marker (R) are placed at either side of the event, as close as possible to the edges of the event, without touching the event itself. The two outermost markers (Left and Right) are used to calculate the straight line approximation of the fiber on both sides of the event and the fifth marker (C) is used to locate the begining of the event. The dB field displays the attenuation of the event. 5 markers on the trace Panel Page 12/40 Fiberizer User’s Manual Kingfisher International Reflectance group dB field displays the reflectance value for current event defined by positions of 5 markers on the active trace. Edit Events group Insert Event – Inserts an event to the Event Table with respect to the current markers (center marker) location Save event – Saves the modified event Delete Event – Deletes the selected event Event Index group Moves to the Next or Previous event in the Event Table. Event Type group The Event type detected is either Non-reflective or Reflective. Page 13/40 Fiberizer User’s Manual Kingfisher International 2 Markers Tab – 2PT and LSA Measurement Modes The measurement values are based upon where the left marker (L) and the right marker (R) are positioned on the trace. The (L,km) field indicates the distance of the left marker (L) while the (R,km) field indicates the distance of the right marker (R) on the trace. (R-L,km) indicates the distance between the left and the right markers. Length group L – Distance to left marker R – Distance to right marker R-L – Distance between markers 2PT group - measuring attenuation between two marker points The dB field displays the attenuation between the left and the right markers, while the dB/km field displays the attenuation co-efficient. dB – Attenuation between markers calculated without LSA approximation dB/km – Slope (attenuation divided by R-L distance) Page 14/40 Fiberizer User’s Manual Kingfisher International LSA group - measuring attenuation with approximation (LSA) The attenuation measurement by approximation mode is used to measure non-event sections of the fiber link. This mode increases the accuracy of the attenuation measurement between the two markers by using a straight line to approximate the measurement. The dB field in the LSA group displays the attenuation between the left and the right markers, while the dB/km field displays the attenuation coefficient. dB – Attenuation between markers calculated with LSA approximation dB/km – Slope (attenuation divided by R-L distance) 2PT and LSA Groups and Trace Panel Options group Check Lock markers to drag markers left or right simultaneously. Check Approximation line to display line visually over the active trace. Page 15/40 Fiberizer User’s Manual Kingfisher International Optical Return Loss (ORL) Tab This marker method measures the Optical Return Loss of a partial fiber section or the whole fiber link by placing the left (L) and the right (R) markers on the fiber link that is being tested. ORL Tab dB – dB loss between L and R markers ORL – ORL value between L and R markers The dB field in the ORL group displays the attenuation between the left and the right markers while the ORL, dB field displays the ratio (in dB) of the optical power entered into the fiber link versus the power returned to the beginning of the fiber for the marked section. ORL Information Group and Trace Panel Page 16/40 Fiberizer User’s Manual Kingfisher International Reflectance group The Reflectance, dB field displays the reflectance value for reflective event located between the left and the right markers. The right marker must be placed on the top of the pulse and the left marker is placed on the pulse front at the backscattering level. Trace Analysis Pass/Fail Thresholds Group The group contains the threshold values that the OTDR uses to compare with the actual trace values when it’s operating in the Automatic Trace Analysis mode. These values are entered by the OTDR operator and used to compare expected measurement values to actual measurement values. The measurement values are displayed in the Events Table and if the real parameters higher than thresholds – events are shown inEvent Table. Filter events – can be used to show full events table or only failed events Event Loss (LT) – Threshold of the event attenuation value in dB. Events with attenuation value that exceeds the threshold value are then shown in the Events Table. Reflectance (RT) – Threshold of the event reflectance value in dB. The reflected events with higher reflectance than the threshold value are shown in the Events Table. According to the EIA/TIA standards, true attenuation losses are only determined by a power meter and a laser source. Page 17/40 Fiberizer User’s Manual Kingfisher International Analysis group Analysis – Performs Auto Trace Analysis Filter – Reduce noise of the trace by applying digital filter Auto Trace Analysis Where 1. 2. 3. 4. Splice Loss Distance to Event Connector Loss Attenuation of fiber link and fiber section After the OTDR finishes the measurement, it can also perform Automatic Trace Analysis if the option is enabled. Once the trace analysis is completed, the OTDR determines the distance of the fiber link, distance to events, the attenuation of the fiber link and sections, the Optical Return Loss (ORL), the splice losses, and the connector losses. The events are also displayed in the Events Table. The OTDR creates marks with inserted event symbols. From these marks, the OTDR determines the appropriate values. The event distance Page 18/40 Fiberizer User’s Manual Kingfisher International is displayed in vertical text on the trace. Fiber attenuation values are displayed in dB/distance. In the Auto mode, the OTDR compensates for the dead zone of the fiber link and calculates the attenuation from the end of the dead zone. Trace Information Tab The Trace tab shows parameters for the currently active trace. Users can modify several variables if desired. This tab includes general information about the trace, such as date, the manufacturer’s information and the trace wavelength. It also includes marker information to help index of reflection adjustments and back scattering values. Information Group Date/Time – Displays time and date of recorded trace Supplier Name – OTDR’s supplier name OTDR Mainframe ID – OTDR’s hardware model Actual Wavelength – Precise value of wavelength used Distance Range (Lmax) – Distance set for this trace Resolution (dL) – Measurement sampling distance Page 19/40 Fiberizer User’s Manual Kingfisher International Trace Information Dialog General Date/Time – Displays date and time when the trace was recorded Cable ID – Enters Cable ID Fiber ID – Enters Fiber ID Fiber Type – Fiber type selection Originating Location – Enters originating location Terminating Location – Enters terminating location Condition – Selects fiber condition Trace Type – Selects fiber trace type Cable Code – Enters cable Information Operator – Enters operator information Comment – Enters additional comments Page 20/40 Fiberizer User’s Manual Kingfisher International Supplier Supplier Name – OTDR supplier’s name OTDR Mainframe ID – OTDR’s mainframe ID OTDR Mainframe S/N – OTDR’s serial number Optical Module ID – OTDR’s modules ID Optical Module S/N – OTDR’s serial number Software Revision – Software revision number Other – Other module information Measurement Parameters Actual Wavelength – Precise value of wavelength Page 21/40 Fiberizer User’s Manual Kingfisher International Refractive Index – Refractive index Distance Range (Lmax) – Distance set for this trace Section begin (L1) - Defines the location of the left marker Section end (L2) - Defines the location of the right marker Resolution (dL) – Measurement sampling distance Pulse-width (Tp) – Pulse width Number of Averages - 4095*Nav – Number of average set for this trace High resolution – Indicates if high resolution was set Low laser power – Indicates if low laser power was used Analysis Parameters Backscattering Coefficient – BC value Event Loss - LT – Threshold of the event attenuation value in dB Reflectance - RT – Threshold of the event reflectance value in dB End-Of-Fiber - ET – Threshold of the event attenuation value in dB to define fiber end Fiber Loss - CT – Attenuation coefficient threshold value of the section in dB/km Page 22/40 Fiberizer User’s Manual Kingfisher International Refractive Index Setup Group Distance to left marker, km – Defines the location of the left marker Distance to right marker, km – Defines the location of the right marker Refractive Index – Refractive index set for this trace Backscatter Coefficient Group RC, dB – Current value of Reflective Coefficient Backscattering Coefficient – BC value of this trace User Offset Tab User Offset – Shifts the zero point across the trace and calculates distance relative to the new 0 km position. Page 23/40 Fiberizer User’s Manual Kingfisher International Compare Tab For a fast analysis of a multi-fiber optic cable with many events, the Compare and Trace functions are a very useful tool. With the Compare and Trace option, users can transfer marks and parameters from one fiber to another by simply pressing one key. Compare and Trace Function Selecting Create R-Template allows users to save data points of the marks on a trace to a buffer and transfer those points to a different trace for evaluation. After creating a template, it is possible to use the Apply Template and Delete Template functions. The template is the analysis calculations related to a particular trace. The data stored in the template buffer can be erased and overwritten by repeating the above procedure. Each trace is displayed in its own separate window. However, users may insert several traces in one window for data comparison. To insert a trace from one window into another window simply follow the procedure below 1. Open the trace window to be copied 2. Press Copy Trace in the Compare Tab The trace is then saved in the buffer displayed in the Information panel. Paste function is activated once this is done. 1. Open the host trace window 2. Press Paste Trace in the Compare Tab The names of the inserted traces then appear in the Information panel under Traces (The host trace name then appears at the top of the list). It is possible to insert up to seven traces at the same time. Only one trace is active in the host window. This is indicated by the symbol ‘^’ beside the file name in the Traces window of the Information panel. It’s possible to use the vertical markers to measure the length and the attenuation of each active trace. To make a trace active, simply double click on its name in the Information panel. Pressing keys CTRL+SPACE when it is highlighted also activates the trace. Pressing CTRL+PAGE UP and CTRL+PAGE DOWN allows users to scroll up and down through traces in the Information panel. To remove an inserted trace from the host window, select and highlight the trace then press Delete Trace button. Page 24/40 Fiberizer User’s Manual Kingfisher International Trace Group Copy Trace – Copies trace to clip board Paste Trace – Inserts trace from clip board to current trace Delete – Deletes inserted trace Shift Trace – Enables shifting of the trace vertically Quick Paste – Enables a shortcut to paste previously opened traces Copy Image – Copies image to clip board Template Group Create R-Template – Saves the current trace as template Apply R-Template – Applies template to trace Delete R-Template – Deletes template View Tab The View tab enables users to setup the viewing functions when looking at a trace. This includes trace zoom viewing, events table viewing and multiple trace viewing. Zoom Factors Group Horizontal – Selects the horizontal zoom factor (x1.1, x1.3, x 2, x5, x10) Vertical – Selects the vertical zoom factor (x1.1, x1.3, x 2, x5, x10) Page 25/40 Fiberizer User’s Manual Kingfisher International Zoom Group Horizontal Zoom In – Zooms in Horizontally Horizontal Zoom Out – Zooms out Horizontally Restore Horizontal Scale – Restores H scale Vertical Zoom In – Zooms in Vertically Vertical Zoom Out – Zooms out Vertically Restore Vertical Scale – Restores V scale Restore Scales – Restores both scales to default settings Window Group Cascade – Cascades active traces Tile – Tiles active traces Measurement Tab Start (Averages) measurement mode with averaging is designed for measuring and analyzing all parameters of the fiber optic cable. When using this feature, the measurement average counter is displayed at the bottom of the main screen. The OTDR displays a progress bar (Number of Averages) at the bottom of the screen. This indicates time elapsed verses total measurement time. The unit beeps when the total measurement is completed. Start (Live) – In the Real Time mode, the OTDR continues to run measurements according to the preset parameters. Stop – Both Average or Live reading may be stopped by this command at any time during the measurement process. This tab enables users to setup the desired parameters of the next trace to be measured. Page 26/40 Fiberizer User’s Manual Kingfisher International These parameters are: Wavelength Distance Pulse Width Averaging Time Resolution Backscattering co-efficient Index of Refraction value Device Group Connect – Connect to OTDR unit through ActiveSync or Windows Mobile Device Center Interface Setup Dialog Page 27/40 Fiberizer User’s Manual Kingfisher International Connect OTDR to Fiberizer Desktop via Windows Mobile Center 1. 2. 3. 4. Download Windows Mobile Device Center to your PC Open Mobile Device Center Application Turn off OTDR – make sure all data are saved before power down Connect the OTDR and the PC with the supplied USB cable Note: The Mini USB connector attaches to the OTDR and the USB connector attaches to the PC 5. Turn on the OTDR – The PC loads the drivers for the OTDR and connects through the Mobile Device Center Press Connect button at the Measurement tab to activate the Mobile Device Center connection. Once connection has been established between the PC and the ORDR unit, the Fiberizer application can manage the parameters and the activities of OTDR measurement. Measurement Group Average – Runs a normal measurement with averaging Live – Runs a measurement in the real time mode Stop – Stops the measurement Page 28/40 Fiberizer User’s Manual Kingfisher International Laser Group Manual – Enables manual Parameter setup Auto – The unit performs an Auto test to determine the appropriate parameters for cable under test Main Group Lmax, km (Distance range) – Distance setting Pulse width - TP – Selects width of output pulse Average time – Average time for measurement Section Group L1 and L2, km - Defines the acquired range within Lmax dL, ns (Resolution) - Selects the measurement sampling distance Flags Group High resolution – Increases measurement bandwidth Low Laser Power – Decreases pulse power Page 29/40 Fiberizer User’s Manual Kingfisher International Others Group Trace refreshing time – Used for Active mode only BC (Backscattering Coefficient) – Values of the optical pulses in dB scattered back to the OTDR from the optical fiber under test Refractive index (n) – Adjusts the refractive index of the fiber in increments of 0.00001 Settings Tab The Settings tab enables the users to change the language as well as the measurement units. It also allows users to apply different parameters to a trace before or after a trace have been measured. General Group Language – Changes the language – English, Spanish, or Korean Distance unit – Changes the measurement value - Km, m, Ft, Kf or Mi Colors – Selects element colors Apply filter to new traces – Applies a Filter to all new traces Apply trace analysis to new traces – Applies the Automatic Analysis mode to all traces Initialize Device – Automatically checks the device connection when the software is launched Page 30/40 Fiberizer User’s Manual Kingfisher International Color Setup Dialog This option enables users to change the color scheme of the Fiberizer software elements by changing the color palette. 1. Highlights the specific Element 2. Selects Change to pop up the standard color selection window 3. Selects the colors you wish and press OK Press OK To save changes and exit the dialog box or press Cancel to quit without changing any colors. Press the Reset button to reset colors to defaults. Element Colors Left marker Right marker Subsidiary markers Central marker Grid Approximation line Selected event boarder Events information Sections information Trace Background Grid Marks Preference Dialog Press the OK button to save all changes. Press the Reset button to reset default values. Press the Cancel button to cancel all the changes. Page 31/40 Fiberizer User’s Manual Kingfisher International General Distance unit - Changes the measurement value – Km, m, Ft, Km or Mi Language – Changes the language options – English, Spanish or Korean Auto-numbering of file names – Automatically numbering the traces in the order the measurement taken Extended Save As – Allows users to change the root directory of files Color print – Prints with or without color Use extended Print – Enables users to use the extended Print option Apply a Filter on all new traces Apply the ‘Automatic’ Analysis mode on all traces Copy the trace information with template Apply ‘Zoom’ option on new traces Maximize the trace window Sound at the end of measurement Use Click for Marker Jump Notify when opening multiple related traces Page 32/40 Fiberizer User’s Manual Kingfisher International Trace Show grid – Turns on/off the background grid Show event bar – Shows the bottom marker bar highlighted in Red Show events info on trace – Turns on/off the automatic analysis measurement Bind to trace when scrolling horizontally – Changes the starting point of horizontal scrolling Show grid marks – Shows position marks on the grid Zoom relevant to Left corner Center Right corner Scrollbar Marker speed – The marker speed can be changed to varying speed Usual Accelerated Acceleration delay Page 33/40 Fiberizer User’s Manual Kingfisher International Start & Exit Initialize the Device – Automatically checks the device connection when software is launched Confirm Exit – Confirms exit when closing program Ask about saving file – Asks if the operator would like to save the trace before closing Save Window size and position Save working folder – Saves in last working directory Windows Integration Page 34/40 Fiberizer User’s Manual Kingfisher International Register extensions now – Enables users to click on a *.sor file to be opened by Fiberizer software (if not already opened) and load the associated traces when the ‘associated known file types’ is checked Create a shortcut on the desktop of a PC or a Laptop Enables users to drag a file onto the Trace window to open the file Fiberizer Cloud Clear saved credentials – Enables users to log out of Fiberizer Cloud Always upload newly measured traces to the Fiberizer Cloud – Checks this button if you want traces to be automatically sent to your Fiberizer Cloud account Trace Group Show grid – Turns on/off the background grid Page 35/40 Fiberizer User’s Manual Kingfisher International Show event bar – Shows the bottom marker bar highlighted in Red Show events info on trace – Turns on/off the automatic analysis measurement Bind to trace when scrolling horizontally – Changes the starting point of horizontal scrolling Show grid marks – Shows position marks on the grid Batch Processing Tab Reporting Group Launch Report Wizard dialog to create PDF reports for many SOR files. Report Wizard Dialog Page 36/40 Fiberizer User’s Manual Kingfisher International Events Table Panel The Events Table lists the measurement values of the data points (marks, ) on the fiber under test. The Events Table contains: Fiber sections numerated section length attenuation coefficient for the section total attenuation for the section events at connection points (at the beginning and at the end of the section) event type fiber beginning fiber end with reflection attenuation attenuation attenuation at the connection point, dB reflectance, dB The Events Table can be managed in the Event markers tab. Page 37/40 Fiberizer User’s Manual Kingfisher International When an event is selected, the corresponding trace shows all the markers with which the event parameters are calculated. To delete an event from the trace and the table, click Delete event. The beginning and the end of the fiber cannot be deleted. To move an event, select it in the table, then change its parameters in the section shown below: To save the changes, click Save event. Event Table Window Where 1. Indicates Event without reflection 2. Indicates Event with reflection Page 38/40 Fiberizer User’s Manual Kingfisher International 4. Default Settings 1 Default BC values 2 -82 dB -77 dB -76 dB -68 dB for SM at 1550 nm for SM at 1310 nm for MM at 1300 nm for MM at 850 nm Default RI values 1.4682 1.4675 1.486 1.4900 for SM at 1550nm for SM at 1310nm for MM at 1300nm for MM at 850nm For an exact index of refraction value of the cable, contact the fiber optic cable manufacturer. 3 Available values in km: 2, 5, 10, 20, 40, 80, 120, 160 and 240 4 L1 marker can be placed anywhere from 0 to L2 in the trace window. 5 L2 marker can be placed anywhere from the L1 to the Lmax in the trace window. 6 Shorter pulses are generally used for shorter distances and higher resolution. Longer pulse widths are required for longer fiber runs. The allowable pulse width is determined by the distance range Lmax. 7 Number of Averages (4096*Nav) defines the number of allowable trace averages when the OTDR measurement is running. Nav may be set to any of the following values 1, 2, 4, 8, 16, 32, 64, 128, 256 Averaging Time (min:sec) can be set by users for particular measurement. Page 39/40 Fiberizer User’s Manual Kingfisher International NOTES Page 40/40