1
5,546,502
10
9
Next, the user observes the new symptom 77, for
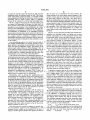
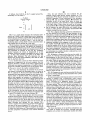
If APij>ot, then ADD Sj to the F,- support group SG,-.
example, uneven copy density, termed symptom S6. The
(Preferably, we set ot=0.0l.)
instantiation 79 of this new symptom is added to the list of
observed symptoms 74 and transferred to the activation
A11, Matrix
Observed Symptoms
predicate 80. The activation predicate 80 maintains the
sI‘S27"‘ISj
contender list 81 of the most likely faults to cause the
observed symptoms. It also provides an “after“ snapshot 82
of all fault values. These values are used by the support
group predicate 85 to maintain contender support groups 86
and to intersect the topics 88 within each support group
thereby to make primary and secondary documentation 89
F1
F2
Faults
’
. . AP,
available through the user interface.
Fm
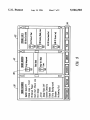
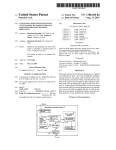
FIG. 9 is a diagram depicting a preferred embodiment of
the user interface of our system. The user interface, in this
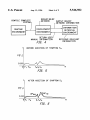
FIG. 5 is a graph which illustrates the individual prob»
embodiment, includes three windows 90, 91 and 92, one 90
relating to categories of possible ?ndings by the user, one 91
relating to the user’s observations, and one 92 listing the
leading fault candidates based upon the probabilities estab
lished in the belief network. The ?rst window represents the
abilities of a series of faults based upon a set of symptoms
entered into our system at a given time. Note that the sum
of the probabilities of all faults must be 1.0. At the instant of
the graph in FIG. 5, faults FE and F1] are the top two
contending faults as being likely to have caused the symp
20
symptoms available in this category for the user to select.
toms entered into the system up to that time.
FIG. 6 illustrates what occurs after an additional symptom
The middle window 91 represents the observed symptoms.
S4 is entered into the system. The addition of symptom S4
probabilities based on all symptoms entered. Also provided
In the last window 92 is the list of faults and their current
increases the probabilities of F8 and F11 while decreasing the
probabilities of all other faults, yet retaining a sum of 1.0.
This represents an example of how the APij (snapshot)
are a series of graphical “push buttons” 94 to enable the user
25
tive information is available, that fact is indicated by an icon
method evaluates the results of introduction of a new
95 which the user may select.
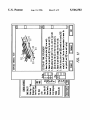
FIG. 10 depicts a situation where the user has asked, for
symptom. Notice the increase in probability in faults F8 and
F“. As their value increases, the value of the other, less
relevant, faults decreases. The AP,’- represents the gap
between the previous fault probability value and the value
after S4 has been observed.
If it is decided that a fault has been influenced (either
positively or negatively) by the new symptom, then the
symptom becomes a member of the fault’s support group.
After each new symptom instantiation, all modi?ed support
groups are evaluated, producing a new set of primary topics
30
35
mentation based on a speci?c content. From there, the user
with respect to primary and secondary topics. As shown in
FIG. 7, symptoms A, B and C have been entered 30. These
symptoms have been entered through the user interface in a
manner which is described below. The symptoms, for the
We have discussed an information retrieval system which
45
result, the symptoms intersect 35 to establish primary topics
40 which are likely of most interest to the user. Where the
symptoms do not so relate to each other as being within a
given fault support group, secondary topics 42 occur which
50
are less well~focused than the primary topics but are still of
interest to the user, and are available to the user. In response
to this information, the user may employ the user interface
45 to select documentation on the primary or secondary fault
A topics 47 available from the topic database 50.
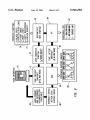
FIG. 8 is a diagram illustrating how both the activation
predicate and the support group predicate ?t into the existing
runtime environment to provide automatic documentation
55
system nodes, which in turn become search patterns. thus
increasing the likelihood of retrieval success. Furthermore,
the actual computationally intensive task of searching on
line text is eliminated from the runtime system by perform
ing the action off-line, during development time. These
characteristics, which provide simple solutions yet exhibit
high quality results, provide an improved system for infor
“before” snapshot 71 is presented of all fault values prior to
the entry of the newest symptom 72. In the case of FIG. 8,
mation retrieval.
the previous symptoms 74 consist of symptoms Sl through
for these symptoms is presented in the manner described
above.
operates in parallel with a probabilistic expert system,
providing query-free technical documentation as an “auto
matic" side-effect of a diagnostic session. The system
derives its search goals from the information embedded in
the expert system. Thus, our system takes advantage of an
expert's knowledge in two ways: as the primary source for
constructing a knowledge base, and as a provider of con
textually sensitive node labels which can later be used to
search technical documentation. As experts become more
and more familiar with the documentation and its creation,
particularly if standard methods of expression are used, the
experts can provide better descriptive labels for the expert
recommendations. In FIG. 8, the dark arrows represent flow
and the open arrows represent output from the system. The
?gure illustrates how through the user interface 70 a
S5 which have been observed. The probabilistic information
example, by “clicking“ on the box marked text, to view the
documentation for the Pick-off Pawl fault. As shown, the
user is presented with lists of both the primary and second
ary topics. Once the user has decided which topic to view
(e.g., “Pick-off Pawl Replacement”), the user interface pro
vides a way of browsing from this point of contact. That is,
the relevant topic is simply an entry point into the docu
typically will browse in the surrounding textual or illustra
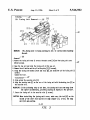
tive areas searching for key information. (Typical documen
tation is shown in FIG. 3.)
FIG. 11 illustrates the user interface provided for the user
to actively browse through the documentation once a point
of entry is established.
for the user to view in the manner explained below.
FIG. 7 is a chart displaying the operation of our system
sake of this example, are members of a particular fault’s
support group (fault A), in the sense of being related to each
other as described in conjunction with FIGS. 5 and 6. As a
to select other menus or screens where textural or descrip
65
The above description of the preferred embodiment has
been made to explain the invention. Although particular
examples such as repair of a photocopy machine have been