1
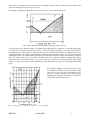
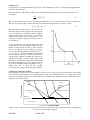
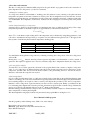
Cooling curves
Cooling curves are evaluated at different compositions of Pb-Sn mixtures in order to construct phase diagram similar
to which is shown in Fig 2.
The temperature T of a Pb-Sn alloy, which is left to itself after melting, initially can be described by the Newton′s
cooling law:
dT
= −k (T − Tr )
dt
(2)
The cooling rate dT/dt is proportional to the temperature difference (T – Tr ), where Tr is the constant room temperature.
The factor k is called cooling constant. The integration in the time interval between t = 0 and t = t gives
T1 − Tr = (T0 − Tr ) ⋅ e − kt
(3)
The temperature of a Pb-Sn alloy is T0 at start and T1
after time t elapsed. If the composition is not the eutectic
one the segregation of solid Pb-Sn mixed crystallites
starts at certain temperature TL. Due to the resulting
solidification heat the cooling rate decreases, i.e., the
cooling curve exhibits a slight discontinuous course at
TL (see Figure 3).
At TE the melt has the eutectic composition and
solidifies like a pure metal. The temperature of the melt
remains constant during the time τE. The horizontal
section of cooling curve can be predicted by equation
1a. For a eutectic transformation in a binary alloy P = 3,
C = 2, and so F = 0. The temperature should remain
constant until the last drop of liquid melt has been
solidified. The completely solidified alloy decreases in
temperature according to equation 3. The k values of the
melt and the solid alloy agree almost. If TL is higher than
the melting temperature of tin, the composition of the
alloy can be determined clearly using Figure 3. If TL is
smaller than 232 °C, there are two possible
concentrations according to the melting point diagram.
Fig. 3 Temperature-time diagram of a Pb-Sn alloy
Cooling curves and phase diagram
By observing the cooling curves of several samples of an alloy across a range of compositions, the shape of the liquidus
curves and the eutectic temperature of the eutectic binary system can be determined (Figure 4). Cooling curves can be
also used to investigate all other types of transformations, for example, those within the solid state where there may be
a change in the crystal structure.
Liquidus
(a)
(b)
(c)
Liquid
Temperature
Liquidus
Liquid plus solid (β)
Liquid plus solid
(α)
Eutectic
Temperature
Solid (α + β)
Composition or Time
Figure 4: Ideal cooling curves for: (a) hypoeutectic alloy, (b) eutectic alloy and (c) hypereutectic alloy, superimposed
on a portion of a eutectic phase diagram.
30/01/2015
hout03_2015
3