1
PROTOCOL SOLUTIONS GROUP
3385 SCOTT BLVD
SANTA CLARA, CA 95054
LeCroy SATASuiteTM
User Manual
for SATracerTM and SATrainerTM Systems
User Manual Version 6.26
For Software Version 6.26
September 2009
Version 6.25
SATASuite User Manual
Document Disclaimer
The information in this document has been carefully checked and is believed to be
reliable. However, no responsibility can be assumed for inaccuracies that may not have
been detected.
LeCroy reserves the right to revise the information in this document without notice or
penalty.
Trademarks and Servicemarks
LeCroy, CATC, SATASuite, SATracer, SATrainer, SATracker, InFusion, and BusEngine
are trademarks of LeCroy.
Microsoft, Windows, Windows 2000, and Windows XP are registered trademarks of
Microsoft Inc.
All other trademarks are property of their respective companies.
Copyright
Copyright © 2009, LeCroy; All Rights Reserved.
This document may be printed and reproduced without additional permission, but all
copies should contain this copyright notice.
Part number: 730-0052-00
LeCroy Corporation
SATASuite User Manual
Version 6.25
Table of Contents
Chapter 1
Overview
1
General Description . . . . . . . . . . . . . . . . . . . . . . . . . . . . . . . . . . . . 2
Features. . . . . . . . . . . . . . . . . . . . . . . . . . . . . . . . . . . . . . . . . . . . . 4
Chapter 2
Installation
7
System Components . . . . . . . . . . . . . . . . . . . . . . . . . . . . . . . . . . . 7
Analyzer PC Requirements . . . . . . . . . . . . . . . . . . . . . . . . . . . . . . 7
Analyzer Hardware Description . . . . . . . . . . . . . . . . . . . . . . . . . . . 7
Analyzer LED Descriptions . . . . . . . . . . . . . . . . . . . . . . . . . . . . . . 8
Front Panel LEDs (from left to right) . . . . . . . . . . . . . . . . . . . . 8
Connectors on the SATA Analyzer Module . . . . . . . . . . . . . . . 8
Rear Panel Description . . . . . . . . . . . . . . . . . . . . . . . . . . . . . . . . . 9
Setting Up the Analyzer . . . . . . . . . . . . . . . . . . . . . . . . . . . . . . . . 10
Connecting Devices to the Analyzer . . . . . . . . . . . . . . . . . . . . . . 11
Installing the SATASuite Software . . . . . . . . . . . . . . . . . . . . . . . . 15
Making a Recording on the SATracer Analyzer . . . . . . . . . . . . . . 16
Stopping a Recording . . . . . . . . . . . . . . . . . . . . . . . . . . . . . . 16
Interrupting the Upload Process . . . . . . . . . . . . . . . . . . . . . . 17
Saving the Trace . . . . . . . . . . . . . . . . . . . . . . . . . . . . . . . . . . 18
Probe Control Settings . . . . . . . . . . . . . . . . . . . . . . . . . . . . . . . . . 19
Avalanche Systems . . . . . . . . . . . . . . . . . . . . . . . . . . . . . . . . 19
SASTracer Systems . . . . . . . . . . . . . . . . . . . . . . . . . . . . . . . 23
Chapter 3
Software Overview
25
Starting the SATASuite Program . . . . . . . . . . . . . . . . . . . . . . . . .
Opening Sample Traces . . . . . . . . . . . . . . . . . . . . . . . . . . . . . . .
Tool Tips. . . . . . . . . . . . . . . . . . . . . . . . . . . . . . . . . . . . . . . . . . . .
Trace Tool Tips. . . . . . . . . . . . . . . . . . . . . . . . . . . . . . . . . . . . . . .
The Menu Bar . . . . . . . . . . . . . . . . . . . . . . . . . . . . . . . . . . . . . . .
Toolbar . . . . . . . . . . . . . . . . . . . . . . . . . . . . . . . . . . . . . . . . . . . . .
Pop-Up Menus . . . . . . . . . . . . . . . . . . . . . . . . . . . . . . . . . . . . . . .
Status Bar . . . . . . . . . . . . . . . . . . . . . . . . . . . . . . . . . . . . . . . . . .
Recording Progress. . . . . . . . . . . . . . . . . . . . . . . . . . . . . . . .
Recording Status . . . . . . . . . . . . . . . . . . . . . . . . . . . . . . . . . .
Recording Activity . . . . . . . . . . . . . . . . . . . . . . . . . . . . . . . . .
Search Status . . . . . . . . . . . . . . . . . . . . . . . . . . . . . . . . . . . .
Navigation Tools. . . . . . . . . . . . . . . . . . . . . . . . . . . . . . . . . . . . . .
Zoom In . . . . . . . . . . . . . . . . . . . . . . . . . . . . . . . . . . . . . . . . .
Zoom Out. . . . . . . . . . . . . . . . . . . . . . . . . . . . . . . . . . . . . . . .
Wrap . . . . . . . . . . . . . . . . . . . . . . . . . . . . . . . . . . . . . . . . . . .
Adding Comments to the Recording . . . . . . . . . . . . . . . . . . . . . .
Set Marker . . . . . . . . . . . . . . . . . . . . . . . . . . . . . . . . . . . . . . . . . .
Edit or Clear Marker . . . . . . . . . . . . . . . . . . . . . . . . . . . . . . . . . . .
Timing Calculations on Markers. . . . . . . . . . . . . . . . . . . . . . . . . .
LeCroy Corporation
25
25
26
26
27
32
35
36
36
37
37
37
38
38
38
38
38
39
41
42
iii
Version 6.25
SATASuite User Manual
Chapter 4
SATracer Recording Options
43
General Recording Options . . . . . . . . . . . . . . . . . . . . . . . . . . . . . 44
Recording Type . . . . . . . . . . . . . . . . . . . . . . . . . . . . . . . . . . . 44
Options . . . . . . . . . . . . . . . . . . . . . . . . . . . . . . . . . . . . . . . . . 44
Recording Scope . . . . . . . . . . . . . . . . . . . . . . . . . . . . . . . . . . 44
Convention-al Single Buffer Recording . . . . . . . . . . . . . . . . . 45
File Structure for Segmented Files . . . . . . . . . . . . . . . . . . . . 46
Channel Settings . . . . . . . . . . . . . . . . . . . . . . . . . . . . . . . . . . . . . 49
Speed Settings . . . . . . . . . . . . . . . . . . . . . . . . . . . . . . . . . . . 49
Channel Settings . . . . . . . . . . . . . . . . . . . . . . . . . . . . . . . . . . 49
Recording Rules . . . . . . . . . . . . . . . . . . . . . . . . . . . . . . . . . . . . . 50
Recording Rules Toolbar . . . . . . . . . . . . . . . . . . . . . . . . . . . . . . . 51
Recording Rules Page - How it Works. . . . . . . . . . . . . . . . . . . . . 52
Selecting Events . . . . . . . . . . . . . . . . . . . . . . . . . . . . . . . . . . 52
Selecting a Channel on an Event Button. . . . . . . . . . . . . . . . 52
Assigning an Action . . . . . . . . . . . . . . . . . . . . . . . . . . . . . . . . . . . 53
Dragging a Button to the Global State Cell or Sequence Cell 53
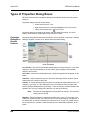
Types of Pop-up Menus . . . . . . . . . . . . . . . . . . . . . . . . . . . . . . . . 56
Global State Cell and Sequence Cell Pop-up Menus . . . . . . 56
Event Pop-up Menu. . . . . . . . . . . . . . . . . . . . . . . . . . . . . . . . 56
Action Pop-up Menu . . . . . . . . . . . . . . . . . . . . . . . . . . . . . . . 57
New Events Menu . . . . . . . . . . . . . . . . . . . . . . . . . . . . . . . . . . . . 59
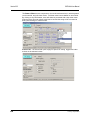
Types of Properties Dialog Boxes . . . . . . . . . . . . . . . . . . . . . . . . 60
Properties Dialog Box - General Features. . . . . . . . . . . . . . . 60
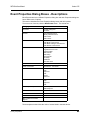
Event Properties Dialog Boxes - Descriptions . . . . . . . . . . . . . . . 63
Primitives . . . . . . . . . . . . . . . . . . . . . . . . . . . . . . . . . . . . . . . . . . . 64
Primitive Categories Properties Dialog . . . . . . . . . . . . . . . . . 64
Primitives Properties Dialog . . . . . . . . . . . . . . . . . . . . . . . . . 64
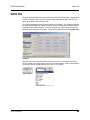
SATA FIS . . . . . . . . . . . . . . . . . . . . . . . . . . . . . . . . . . . . . . . . . . . 65
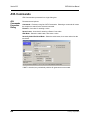
ATA Commands . . . . . . . . . . . . . . . . . . . . . . . . . . . . . . . . . . . . . . 66
ATA Commands Properties Dialog . . . . . . . . . . . . . . . . . . . . 66
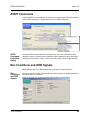
ATAPI Commands . . . . . . . . . . . . . . . . . . . . . . . . . . . . . . . . . . . . 67
ATAPI Command Properties Dialog. . . . . . . . . . . . . . . . . . . . 67
Bus Conditions and OOB Signals . . . . . . . . . . . . . . . . . . . . . . . . 67
Bus Conditions and OOB Signals . . . . . . . . . . . . . . . . . . . . . 67
Errors . . . . . . . . . . . . . . . . . . . . . . . . . . . . . . . . . . . . . . . . . . . . . . 68
Errors Properties Dialog . . . . . . . . . . . . . . . . . . . . . . . . . . . . 68
Breakout Board Data . . . . . . . . . . . . . . . . . . . . . . . . . . . . . . . . . . 68
Breakout Board Data Properties Dialog . . . . . . . . . . . . . . . . 68
State Properties Dialog . . . . . . . . . . . . . . . . . . . . . . . . . . . . . . . . 69
Timer Properties Dialog . . . . . . . . . . . . . . . . . . . . . . . . . . . . . 69
Actions Tab in the Properties Dialog . . . . . . . . . . . . . . . . . . . . . . 70
Assigning Actions. . . . . . . . . . . . . . . . . . . . . . . . . . . . . . . . . . . . . 70
Setting Conditions: The Role of the Global State Cell . . . . . . . . 72
Filter In and Filter Out . . . . . . . . . . . . . . . . . . . . . . . . . . . . . . 73
Filter In or Out Everything . . . . . . . . . . . . . . . . . . . . . . . . . . . 74
Counting Events . . . . . . . . . . . . . . . . . . . . . . . . . . . . . . . . . . 74
iv
LeCroy Corporation
SATASuite User Manual
Version 6.25
Creating Event Sequences . . . . . . . . . . . . . . . . . . . . . . . . . . . . .
States. . . . . . . . . . . . . . . . . . . . . . . . . . . . . . . . . . . . . . . . . . .
How to Create an Event Sequence . . . . . . . . . . . . . . . . . . . .
Using a Timer . . . . . . . . . . . . . . . . . . . . . . . . . . . . . . . . . . . .
Recording Options - Channels . . . . . . . . . . . . . . . . . . . . . . . . . . .
Where Custom Channel Names Appear . . . . . . . . . . . . . . . .
Chapter 5
Display Options
85
General Display Options . . . . . . . . . . . . . . . . . . . . . . . . . . . . . . .
Setting Color, Formatting, and Hiding Options. . . . . . . . . . . . . . .
Setting Color Display Options . . . . . . . . . . . . . . . . . . . . . . . .
Changing Field Formats . . . . . . . . . . . . . . . . . . . . . . . . . . . .
Hiding Display Options . . . . . . . . . . . . . . . . . . . . . . . . . . . . .
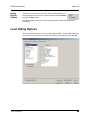
Level Hiding Options . . . . . . . . . . . . . . . . . . . . . . . . . . . . . . . . . .
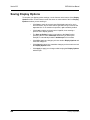
Saving Display Options . . . . . . . . . . . . . . . . . . . . . . . . . . . . . . . .
Chapter 6
75
75
76
78
81
81
Reading a Recording
86
87
87
88
89
89
90
91
Recording View Features. . . . . . . . . . . . . . . . . . . . . . . . . . . . . . . 91
Frame, FIS, ATA Command and OOB Views . . . . . . . . . . . . . . . 91
View Raw Bits . . . . . . . . . . . . . . . . . . . . . . . . . . . . . . . . . . . . . . . 96
Running Disparity . . . . . . . . . . . . . . . . . . . . . . . . . . . . . . . . . 97
Expanding and Collapsing Fields. . . . . . . . . . . . . . . . . . . . . . . . . 97
Expanding a Data Payload . . . . . . . . . . . . . . . . . . . . . . . . . . 98
View Data Block Window . . . . . . . . . . . . . . . . . . . . . . . . . . . . . . . 99
Description of View Data Block Window . . . . . . . . . . . . . . . . 99
Incomplete Frames Handling and Display . . . . . . . . . . . . . . . . . 100
Split Frames. . . . . . . . . . . . . . . . . . . . . . . . . . . . . . . . . . . . . 102
Compact View . . . . . . . . . . . . . . . . . . . . . . . . . . . . . . . . . . . . . . 103
Export Options . . . . . . . . . . . . . . . . . . . . . . . . . . . . . . . . . . . . . . 106
Packets to Text (Packet View Format). . . . . . . . . . . . . . . . . 107
Export to Generator File Format . . . . . . . . . . . . . . . . . . . . . 107
Packets to EAS Format . . . . . . . . . . . . . . . . . . . . . . . . . . . . 107
Export to CSV Format . . . . . . . . . . . . . . . . . . . . . . . . . . . . . 107
Chapter 7
Searching Recordings
111
Go to Trigger . . . . . . . . . . . . . . . . . . . . . . . . . . . . . . . . . . . . . . .
Go to Event ... . . . . . . . . . . . . . . . . . . . . . . . . . . . . . . . . . . . . . .
Go to Marker . . . . . . . . . . . . . . . . . . . . . . . . . . . . . . . . . . . . . . .
Go To . . . . . . . . . . . . . . . . . . . . . . . . . . . . . . . . . . . . . . . . . . . . .
Find . . . . . . . . . . . . . . . . . . . . . . . . . . . . . . . . . . . . . . . . . . . . . .
Complex Searches . . . . . . . . . . . . . . . . . . . . . . . . . . . . . . .
Event Groups. . . . . . . . . . . . . . . . . . . . . . . . . . . . . . . . . . . .
Union, Intersection, and Exclusion . . . . . . . . . . . . . . . . . . .
Using Find . . . . . . . . . . . . . . . . . . . . . . . . . . . . . . . . . . . . . .
Find Next . . . . . . . . . . . . . . . . . . . . . . . . . . . . . . . . . . . . . . .
...............................................
LeCroy Corporation
111
111
112
113
114
115
115
115
116
117
117
v
Version 6.25
SATASuite User Manual
Chapter 8
External Interface for Trigger In /Out
119
BNC External Trigger In / Out . . . . . . . . . . . . . . . . . . . . . . . . . .
Using the BNC Trigger Out . . . . . . . . . . . . . . . . . . . . . . . . .
Using the BNC Trigger In. . . . . . . . . . . . . . . . . . . . . . . . . . .
Breakout Board Trigger In / Out . . . . . . . . . . . . . . . . . . . . . . . . .
Pin-Outs for the Data In/Out Connector . . . . . . . . . . . . . . . . . . .
Prototype Rework Area . . . . . . . . . . . . . . . . . . . . . . . . . . . .
Configuring Input Signaling through the Breakout Board. . . . . .
Chapter 9
Reports
127
File Information . . . . . . . . . . . . . . . . . . . . . . . . . . . . . . . . . . . . .
Traffic Summary . . . . . . . . . . . . . . . . . . . . . . . . . . . . . . . . . . . . .
Error Summary. . . . . . . . . . . . . . . . . . . . . . . . . . . . . . . . . . . . . .
Timing Calculations . . . . . . . . . . . . . . . . . . . . . . . . . . . . . . . . . .
Bus Utilization . . . . . . . . . . . . . . . . . . . . . . . . . . . . . . . . . . . . . .
Link Tracker Window . . . . . . . . . . . . . . . . . . . . . . . . . . . . . . . . .
Frame Tracker Window . . . . . . . . . . . . . . . . . . . . . . . . . . . . . . .
Chapter 10 Networking
145
146
146
147
148
148
149
150
151
153
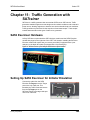
SATA Exerciser Hardware . . . . . . . . . . . . . . . . . . . . . . . . . . . . .
Setting Up SATA Exerciser for Initiator Emulation . . . . . . . . . . .
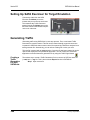
Setting Up SATA Exerciser for Target Emulation . . . . . . . . . . . .
Generating Traffic . . . . . . . . . . . . . . . . . . . . . . . . . . . . . . . . . . .
Creating a Traffic Generation File with SATASuite . . . . . . .
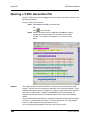
Opening a Traffic Generation File . . . . . . . . . . . . . . . . . . . . . . .
Layout . . . . . . . . . . . . . . . . . . . . . . . . . . . . . . . . . . . . . . . . .
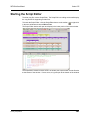
Starting the Script Editor . . . . . . . . . . . . . . . . . . . . . . . . . . . . . .
Toolbar. . . . . . . . . . . . . . . . . . . . . . . . . . . . . . . . . . . . . . . . .
File Tabs . . . . . . . . . . . . . . . . . . . . . . . . . . . . . . . . . . . . . . .
Error Log . . . . . . . . . . . . . . . . . . . . . . . . . . . . . . . . . . . . . . .
Overview of Generation and Global Settings Files . . . . . . . . . .
Traffic Generation (*.ssg) Files . . . . . . . . . . . . . . . . . . . . . .
Settings.inc File . . . . . . . . . . . . . . . . . . . . . . . . . . . . . . . . . .
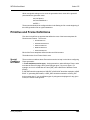
Primitive and Frame Definitions . . . . . . . . . . . . . . . . . . . . . . . . .
Special Conditions for Frames. . . . . . . . . . . . . . . . . . . . . . .
Primitives Decl.inc . . . . . . . . . . . . . . . . . . . . . . . . . . . . . . . .
Address FramesDecl .inc . . . . . . . . . . . . . . . . . . . . . . . . . .
SSPFrames .inc. . . . . . . . . . . . . . . . . . . . . . . . . . . . . . . . . .
SMPFrames .inc . . . . . . . . . . . . . . . . . . . . . . . . . . . . . . . . .
STPFrames .inc. . . . . . . . . . . . . . . . . . . . . . . . . . . . . . . . . .
vi
127
128
129
129
130
135
141
145
Working with Multiple Analyzers . . . . . . . . . . . . . . . . . . . . . . . .
Hardware Setup for Direct USB Connections . . . . . . . . . . . . . .
Setup for Cascaded Multiple Analyzer Use . . . . . . . . . . . . . . . .
Set Up for Remote Access over an IP LAN . . . . . . . . . . . . . . . .
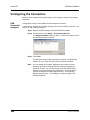
Configuring the Connection . . . . . . . . . . . . . . . . . . . . . . . . . . . .
USB Connected Analyzers . . . . . . . . . . . . . . . . . . . . . . . . .
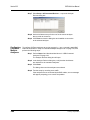
Remote Analyzers Over an IP Network. . . . . . . . . . . . . . . .
Configuring Cascaded Multiple Analyzers. . . . . . . . . . . . . .
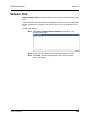
Network Chat . . . . . . . . . . . . . . . . . . . . . . . . . . . . . . . . . . . . . . .
Chapter 11 Traffic Generation with SATrainer
119
119
121
122
123
124
125
153
153
154
154
154
156
156
157
158
159
159
160
160
161
165
165
166
166
166
166
166
LeCroy Corporation
SATASuite User Manual
Version 6.25
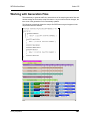
Working with Generation Files . . . . . . . . . . . . . . . . . . . . . . . . . .
Generating Traffic . . . . . . . . . . . . . . . . . . . . . . . . . . . . . . . . . . .
Stop Traffic Generation . . . . . . . . . . . . . . . . . . . . . . . . . . . .
Resume Traffic Generation . . . . . . . . . . . . . . . . . . . . . . . . .
Chapter 12 SATrainer Generation
Language
169
File Structure . . . . . . . . . . . . . . . . . . . . . . . . . . . . . . . . . . . . . . .
Declarations. . . . . . . . . . . . . . . . . . . . . . . . . . . . . . . . . . . . .
Generation blocks . . . . . . . . . . . . . . . . . . . . . . . . . . . . . . . .
Language . . . . . . . . . . . . . . . . . . . . . . . . . . . . . . . . . . . . . . . . . .
Comments: . . . . . . . . . . . . . . . . . . . . . . . . . . . . . . . . . . . . .
Includes: . . . . . . . . . . . . . . . . . . . . . . . . . . . . . . . . . . . . . . .
Settings . . . . . . . . . . . . . . . . . . . . . . . . . . . . . . . . . . . . . . . .
Constants . . . . . . . . . . . . . . . . . . . . . . . . . . . . . . . . . . . . . .
Predefined Constants . . . . . . . . . . . . . . . . . . . . . . . . . . . . .
Data Patterns. . . . . . . . . . . . . . . . . . . . . . . . . . . . . . . . . . . .
Primitives . . . . . . . . . . . . . . . . . . . . . . . . . . . . . . . . . . . . . . .
Packets/ Frames . . . . . . . . . . . . . . . . . . . . . . . . . . . . . . . . .
Generation Block . . . . . . . . . . . . . . . . . . . . . . . . . . . . . . . . . . . .
Definitions . . . . . . . . . . . . . . . . . . . . . . . . . . . . . . . . . . . . . . . . .
Field Variable Declarations . . . . . . . . . . . . . . . . . . . . . . . . .
Changing Frame Fields . . . . . . . . . . . . . . . . . . . . . . . . . . . .
Preprocessor integer arithmetic . . . . . . . . . . . . . . . . . . . . .
Loops. . . . . . . . . . . . . . . . . . . . . . . . . . . . . . . . . . . . . . . . . .
SATrainer Generation Commands . . . . . . . . . . . . . . . . . . . . . . .
General Commands . . . . . . . . . . . . . . . . . . . . . . . . . . . . . .
SATA Commands . . . . . . . . . . . . . . . . . . . . . . . . . . . . . . . .
Primitive Commands . . . . . . . . . . . . . . . . . . . . . . . . . . . . . .
Wait Commands . . . . . . . . . . . . . . . . . . . . . . . . . . . . . . . . .
Wait Command Groups . . . . . . . . . . . . . . . . . . . . . . . . . . . .
Predefined Constants . . . . . . . . . . . . . . . . . . . . . . . . . . . . .
Generation Settings. . . . . . . . . . . . . . . . . . . . . . . . . . . . . . .
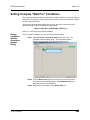
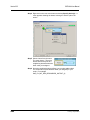
Setting Complex "Wait For" Conditions . . . . . . . . . . . . . . . . . . .
Setting Conditions with the Generation Options Dialog. . . .
Chapter 13 SATracker Systems
169
169
169
170
170
170
170
170
170
171
171
172
174
175
175
175
175
176
177
177
178
179
182
189
193
194
201
201
203
Product Configurations . . . . . . . . . . . . . . . . . . . . . . . . . . . . . . .
Theory of Operation . . . . . . . . . . . . . . . . . . . . . . . . . . . . . . . . . .
Installing the SATracker Command Analyzer. . . . . . . . . . . . . . .
Changing the BusEngine. . . . . . . . . . . . . . . . . . . . . . . . . . .
Preparing to Track a Command Sequence . . . . . . . . . . . . . . . .
Tracking Type . . . . . . . . . . . . . . . . . . . . . . . . . . . . . . . . . . .
Misc. Options. . . . . . . . . . . . . . . . . . . . . . . . . . . . . . . . . . . .
Tracker Archive Memory Size . . . . . . . . . . . . . . . . . . . . . . .
Time Out Triggering Options . . . . . . . . . . . . . . . . . . . . . . . .
Command Log Filename . . . . . . . . . . . . . . . . . . . . . . . . . . .
Saving Tracker Option Settings . . . . . . . . . . . . . . . . . . . . . .
Speed Settings . . . . . . . . . . . . . . . . . . . . . . . . . . . . . . . . . .
Channel Settings . . . . . . . . . . . . . . . . . . . . . . . . . . . . . . . . .
Tracker Sweeping . . . . . . . . . . . . . . . . . . . . . . . . . . . . . . . .
Viewing Command Log Files . . . . . . . . . . . . . . . . . . . . . . . . . . .
LeCroy Corporation
167
168
168
168
203
203
204
204
206
208
208
208
208
209
209
209
210
210
211
vii
Version 6.25
SATASuite User Manual
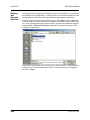
Command Log File Reports . . . . . . . . . . . . . . . . . . . . . . . . . . . .
Exporting Command Log Files. . . . . . . . . . . . . . . . . . . . . . . . . .
Working with Exported Data Files . . . . . . . . . . . . . . . . . . . .
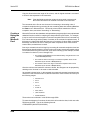
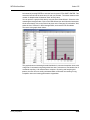
Creating a Histogram using Microsoft Excel . . . . . . . . . . . .
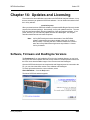
Chapter 14 Updates and Licensing
221
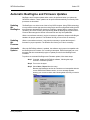
Software, Firmware and BusEngine Versions . . . . . . . . . . . . . .
Software Updates. . . . . . . . . . . . . . . . . . . . . . . . . . . . . . . . . . . .
Automatic BusEngine and Firmware Updates . . . . . . . . . . . . . .
Updating the BusEngine . . . . . . . . . . . . . . . . . . . . . . . . . . .
Updating the Firmware . . . . . . . . . . . . . . . . . . . . . . . . . . . .
Automatic Updates . . . . . . . . . . . . . . . . . . . . . . . . . . . . . . .
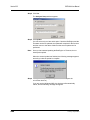
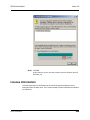
License Information . . . . . . . . . . . . . . . . . . . . . . . . . . . . . . . . . .
Updating the Software License . . . . . . . . . . . . . . . . . . . . . . . . .
Limited Hardware Warranty . . . . . . . . . . . . . . . . . . . . . . . . . . . .
Appendix A Specifications
214
215
216
218
221
222
223
223
223
223
225
226
227
231
Index
viii
LeCroy Corporation
SATASuite User Manual
Version 6.25
Chapter 1: Overview
LeCroy’s Serial ATA (SATA) Product Line includes the following major products to assist
engineers in designing, developing and validating SATA-based products.
•
The SATracer Protocol Analyzer allows users to record and display all communications traffic on SATA links. As with all LeCroy analyzers, hardware-based pre-capture filtering is supported for efficient memory management. Full SATA-II analysis
support is included for Serial ATA environments (1.5 or 3 Gbps). An important
option for the SATracer Analyzer is the SATracker Command Analyzer option.
SATracker monitors commands issued over SATA networks to track all commands,
measure execution time, identify slow commands or commands that fail to complete, and optimize overall system performance.
•
The SATrainer Exerciser is a traffic generation system that can initiate SATA traffic
(emulating either an initiator or target device) for testing of SATA designs and products. The system can be programmed to transmit valid and invalid SATA traffic. It
can send specific IO operations or customized data payloads. The exerciser can
“play-back” any previously recorded trace as a stimulus file and also offers a
text-based API for creating scripts from the ground up.
These products, used either separately or in combination, provide fast, efficient and
accurate debug, test and verification of Serial ATA semiconductors, devices and systems.
They allows designers and validation engineers to quickly and easily transmit valid and
invalid 1.5 or 3 Gbps SATA traffic, selectively record the exchange and display the results
using the SATASuite expert analysis software. The SATASuite software supports all
three products, allowing this all-in-one test platform to play an important role at every
phase of the SATA product development process.
The SATracer and SATrainer systems operate on a common modular hardware design,
based on the LeCroy CATC 10K chassis. The different product functions are supported
by hardware modules which plug into the chassis, by LeCroy’s unique BusEngine
firmware cores, and by the SATASuite Application Software.
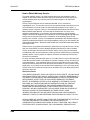
The heart of the LeCroy SATA platform is the revolutionary LeCroy BusEngine™. This
state-of-the-art, field-upgradeable, technology core incorporates a real-time
non-intrusive recording engine and configurable tools to trigger and filter SATA traffic. It
can intelligently monitor SATA frame headers and addresses, and start or stop recording
based on user-defined events.
The modular LeCroy SATA products allow users to expand and upgrade systems as their
needs change. Adding new modules, or adding new BusEngines to existing modules,
can economically expand the system capabilities while maintaining a common software
interface through the integrated SATASuite Application Software.
For complete product information, please visit www.LeCroy.com.
LeCroy Corporation
1
Version 6.25
SATASuite User Manual
Please refer to the Serial ATA Specification for details on the Serial ATA protocol.
General Description
The CATC 10K chassis supports up to two plug-in modules that can support tracing,
traffic generation and/or command analysis. The common hardware design allows users
to obtain muliple functions at economical prices, and to upgrade existing systems to new
functions by adding the appropriate modules, BusEngines or software licenses.
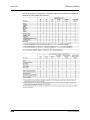
The chart on the following page shows the combinations of products and features
currently offered for preconfigured systems from LeCroy.
The CATC 10K, in turn, connects to a PC over a Hi-Speed USB cable. The PC functions
as the host controller for the CATC 10K. SATASuite software on the PC controls and
configures the products and retrieves and displays recorded data.
The SATASuite trace viewing software runs on any personal computer using the
Windows 98SE, Window 2000, Windows ME, or Windows XP operating systems and
equipped with a functional USB interface.
2
LeCroy Corporation
SATASuite User Manual
Version 6.25
The SATracer analyzer is capable of on-the-fly detection of and triggering on such events
as Primitives, Bus Conditions, Data Patterns, and Errors. Whether recording manually or
with a specified trigger condition, SATracer continuously records the link data in a
wrap-around fashion until manually stopped or until the Trigger Event is detected and a
specified post-Trigger amount of link data is recorded.
Upon detection of a triggering event, the analyzer continues to record data up to a point
specified by the user. Real-time detection of events can be individually enabled or
disabled to allow triggering on events as they happen. This includes predefined exception
or error conditions and a user-defined set of trigger events.
Recorded data is presented as a "trace" in the trace viewer as rows of color-coded
graphics. Users can then search this trace for errors and other events using advanced
search utilities, and then hide from the display all but only the most interesting and
relevant data.
The SATASuite software provides powerful search functions that enable investigation
and highlighting of specific events. In addition to immediate analysis, you can print any
part of the data. Use the Save As feature to save the data on disk for later viewing. The
program also provides a variety of timing information and data analysis reports.
LeCroy Corporation
3
Version 6.25
SATASuite User Manual
Features
•
Integrated Analyzer, Generator and Command Analyzer System
•
Available with One, Two or Four 1.5 or 3.0 Gbps SATA analysis ports
•
Serial ATA Recording at 1.5 or 3.0 Gbps
•
Sophisticated Triggering
•
Hardware Filtering
•
DWORD Display
•
Internal Single-lane or External 4-lane Connector Option
•
Exerciser offers Initiator and Target Emulation
•
Exerciser automatically responds to incoming OOB
•
Command Analyzer option tracks all commands issued in SATA matrix of up
to 8 initiators and 128 targets
•
Traffic Summaries
•
Collapsible / Expandable Headers
•
Automatic Decoding at Transport Layer; SCSI, ATA and Management
Application Layers
•
Field Upgradeable BusEngine Technology
•
Dynamically Allocated Memory Pool (2 GB)
•
13-month Hardware Warranty
•
All-in-one platform transmits, records, and analyzes SATA protocols
•
Monitor, trigger and record up to 4 SATA links simultaneously
•
Isolate areas of interest with real-time hardware triggering
•
Extend capture window by removing non-essential primitives
•
Chronologically display all DWORDs on all channels synchronized to a
common clock
•
Flexible platform for testing host and end-device behavior
•
Automatically bring SATA device under test through power up / reset and
speed negotiation sequence
•
Statistical reports provide high level abstraction of events, operations, errors
and throughput for each I_T_L Nexus
•
Easy “drill-down” on field structures for individual Frames, Commands and
Tasks
•
Easily upgrade firmware to support new features
•
Protect your investment with industry-leading warranty
LeCroy BusEngine
LeCroy’s BusEngine™ Technology is at the heart of the SATA Product Line. The
revolutionary BusEngine core uses FPGA technology and incorporates both the real-time
recording engine and the configurable building blocks that implement data/state/error
detection, triggering, external signal monitoring, and event counting and sequencing.
Like the flash-memory-based firmware that controls its operation, all BusEngine logic is
fully field upgradeable, using configuration files that can be downloaded from the LeCroy
Website.
4
LeCroy Corporation
SATASuite User Manual
Version 6.25
Power Cord Set
Cord Manufacturer and Models:
180-0005-00 Quail 5000.079 UL,CSA
180-0013-00 Quail 8500.098 VDE, KEMA, CEBERC, NEMDO, DEMDO, SETI,
OVE, SEV
180-0014-00 Quail 9650.098 ASTA
SATA Protocol Analyzer and Exerciser on the CATC 10K Platform
CATC 10K is a USB 2.0 Certified Hi-Speed Device. To upload traces from the analyzer
to an attached PC at Hi-Speed, the PC must have a USB 2.0 Certified Host Controller
and be running Windows 2000 SP3 or Windows XP.
Note:
LeCroy Corporation
The CATC 10K products include 2.0 USB hubs. You might see the
drivers for these generic hubs being installed upon the initial plug-in.
5
Version 6.25
6
SATASuite User Manual
LeCroy Corporation
SATASuite User Manual
Version 6.25
Chapter 2: Installation
This chapter describes how to set up the SATA Analyzer and create your first recording.
System Components
•
One stand-alone SATA Analyzer system
•
One USB cable
•
SATASuite software program CD-ROM
•
SATA cables
•
Breakout board
Note:
Specific components included with the SATracer/Trainer system
vary based on model and configuration ordered.
Analyzer PC Requirements
The SATA Analyzer and CATC 10K connect to a Host PC via USB line.
Please consult the readme file on the installation CD for the latest PC requirements.
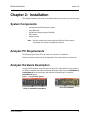
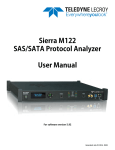
Analyzer Hardware Description
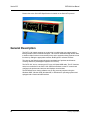
LeCroy’s SATA Analyzer System is based on the CATC 10K platform. Plug-in modules
for SATA are available with either the Internal SATA style cable connector (SS002MAA-X
& SS003MAA-X) or the new plug-in with External "Infiniband style" connectors
(SS004MAA-X) below.
Figure 1: LeCroy Analyzer Systems
Module Part # SS002MAA-X & SS003MAA-X
LeCroy Corporation
Module Part # SS004MAA-X
7
Version 6.25
SATASuite User Manual
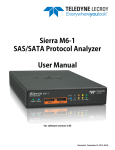
Analyzer LED Descriptions
When powered on, the SATA Analyzer activates the user-accessible controls and LEDs
on the front and rear panels of the CATC 10K.
Warning!
Do not open the CATC 10K enclosure. There are no user serviceable
parts inside. Refer servicing to LeCroy.
Figure 2: Front Panel (Internal single lane connector - SS002MAA & SS003MAA-X)
Figure 3: Front Panel (4 Port External connector - SS004MAA-X)
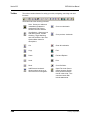
Front Panel
LEDs (from
left to right)
Connectors
on the SATA
Analyzer
Module
8
A
PWR (power) - Green indicator LED for CATC 10K. Lights when the unit
power is switched on.
B
Status indicator - Red indicator LED for CATC 10K. Lights during
initialization/power up of CATC 10K base unit. Blinks if a self-test fails.
C
REC (recording) - Green LED. Lights when the unit is recording.
D
TRG (triggered) - Orange LED. Lights when the unit triggers on an event.
E
UPLD (Upload) - Green LED. Lights when trace is being uploaded from the
analyzer to the PC.
F
Manual Trigger - Push-button. Allows a manual Trace capture.
G
1 - 4 (Link Channels 1 - 4) - Green LEDs. Lights when a connection is
established on the corresponding link.
•
Plug-in Modules SS002MAA-X & SS003MAA-X use single-lane Serial ATA
Connectors (4).
•
Plug-in Module SS004MAA-X use 4 port Infiniband style connectors (1).
LeCroy Corporation
SATASuite User Manual
Version 6.25
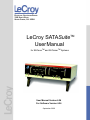
Rear Panel Description
From left to right, the CATC 10K rear panel contains the following components:
Figure 4: Rear Panel
USB type “B” host computer connector
This connector links the analyzer to the Host PC. for the purpose of transmitting
commands from the PC to the analyzer and uploading traces from the analyzer’s
recording memory to the SATASuite software for viewing and analysis.
RS-232 25 pin "Data Output" Connector
This connector links a 25 pin RS-232 cable to an external breakout board. The breakout
board allows signals to be sent from the analyzer to an external device such as an
oscilloscope or from an external device to the analyzer for the purpose of triggering on
an external input. You configure input/output signalling through the Recording Options
dialog box. Breakout board use is described at the end of this chapter.
BNC Connectors "Ext. In" and "Ext. Out"
These connectors allow BNC cables to be attached to the analyzer for the purpose of
triggering on external input signals or for sending an output signal from the analyzer to
another device. These connectors have the same function as the 25 pin RS-232
connector - i.e., they channel input and output signals but do not support the use of a
breakout board.
Wide range AC connector module
— Power socket
— Power on/off switch
— Enclosed 5x20 mm 2.0A 250 V fast acting glass fuse
Warning!
LeCroy Corporation
For continued protection against fire, replace fuse only with the type and
rating specified above.
9
Version 6.25
SATASuite User Manual
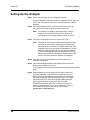
Setting Up the Analyzer
Step 1
Remove the analyzer from its shipping container.
The SATA Analyzer module will already be installed in the left slot of the
CATC 10K. The right slot may have a second analyzer or a SATA
Exerciser.
Step 2 Connect the Analyzer unit to a 100-volt to 240-volt, 50 Hz to 60
Hz, 120 W power outlet using the provided power cord.
Note:
The Analyzer is capable of supporting supply voltages
between 100-volt and 240-volt, 50 Hz or 60 Hz, thus
supporting all known supply voltages around the world.
Step 3 Turn on the power switch on the rear of the CATC 10K.
Note:
At power-on, the analyzer initializes itself in approximately
ten seconds and performs an exhaustive self-diagnostic
that lasts about five seconds. The Status LED of the CATC
10K base unit turns red on power up/initialization. The LED
remains on approximately 25 seconds while the analyzer
performs self-diagnostic testing. If the diagnostics fail, the
Status LED will blink red, indicating a hardware failure. If this
occurs, call LeCroy Customer Support for assistance.
Step 4 Insert the CD into the CD ROM drive of the PC that will be
controlling the analyzer.
Step 5 Connect the USB cable between the USB port on the back of the
analyzer and a USB port on the PC.
The operating system detects the analyzer and begins to install the USB
driver.
Step 6 Follow Windows on-screen Plug-and-Play instructions for the
automatic installation of the analyzer as a USB device on the
Host PC (the required USB files are included on the SATASuite
CD). Step through the Windows hardware wizard. The wizard
will see that the CATC 10K has an internal USB hub and will
begin loading hub drivers. Afterwards, the wizard will
automatically install the system as a USB device on the PC.
When the wizard prompts you for driver information, point it to
the CD which should be in your disk drive and install
catcupa.sys and SATracer.sys.
10
LeCroy Corporation
SATASuite User Manual
Version 6.25
Connecting Devices to the Analyzer
Model SS004MAA-X incorporates the external "Infiniband style" connector which
includes both a non-intrusive as well as a repeater style front-end. This allows users to
selectively switch between these two probing techniques based on their specific
application. Only one pair of connectors may be used at a time.
Note:
User’s with model SS004MAA-X must switch between "repeater"
and "non-intrusive" using the SATASuite software. Go to Setup >
Probe Control to enable "repeater" or "non-intrusive" mode.
Figure 5: Plug-in Module SS004MAA-X offers two types of probing
Non-intrusive Tap
Also known as passive tapping, this approach silently samples the signal without
re-driving the differential lines (high value resistors contribute to reduction in amplitude
~15%).
Figure 6: Non-intrusive tap diagram
LeCroy Corporation
11
Version 6.25
SATASuite User Manual
Repeater Tap
In repeater mode, the analyzer reproduces the exact patterns it receives on the inbound
(RX) line. While the repeater does not re-time the signal—it does "clean-up" normal
reflections that can occur over a full length cable when the analyzer is not in the line.
Figure 7: Repeater tap diagram
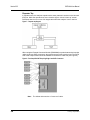
When using the External Connector Module (SS004MAA) to probe between devices that
utilize single lane SATA connectors, the special octopus cable must be used. The SATA
side of the octopus cables would be attached to the devices under test (see Figure 8).
Figure 8: Test Setup With DUT Requiring Single Lane SATA Connectors
Note:
12
The initiator side must be a "cross-over" cable.
LeCroy Corporation
SATASuite User Manual
Version 6.25
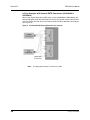
Figure 9: Test Setup With DUT Requiring External 4 Lane Connector
Note:
LeCroy Corporation
When using new External Connector Module (SS004MAA) with
standard 4X External InfiniBand style cables, there is no need to use
"cross-over" cable. Both cables above are straight.
13
Version 6.25
SATASuite User Manual
LeCroy Analyzer with Internal SATA Connectors (SS002MAA &
SS003MAA)
When using original single-lane "SATA-style" module (SS002MAA & SS003MAA) with
devices that utilize single-lane SATA style connectors, the special octopus cable must be
used. The SATA connector side of the octopus cables would be attached to the analyzer
(see Figure 10).
Figure 10: Test Setup With DUT Requiring External 4 Lane Connector
Note:
14
The target side must be a "cross-over" cable.
LeCroy Corporation
SATASuite User Manual
Version 6.25
Installing the SATASuite Software
Once the SATA Analyzer has been recognized as a USB device, install the SATASuite
software on the Host PC.
Step 1 On the PC, run setup on the installation CD and follow the
on-screen instructions.
The SATASuite software will install on the PC hard disk.
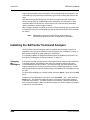
Step 2 To start the application, launch the LeCroy SATASuite program
from the Start menu:
Start > Programs > LeCroy > LeCroy SATASuite.
The SATASuite program opens.
Note:
LeCroy Corporation
The software may be used with or without the analyzer. When used
without an analyzer, the program functions as a viewer to view,
analyze, and print recorded files.
15
Version 6.25
SATASuite User Manual
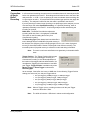
Making a Recording on the SATracer Analyzer
After installation, the software is configured to make a four-Mbyte snapshot recording of
your Serial ATA traffic.
To make this recording, follow these steps:
Step 1 Connect a cable to each of the two connectors on the SATracer
module, then connect the other ends to the Serial ATA device
under test and Serial ATA host system.
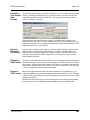
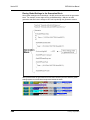
Step 2 From the Setup menu, select Recording Options.
Step 3 Select the General tab.
The following window displays the factory default settings such as
“Snapshot” and 16 MBytes buffer size are displayed. For your first
recording, you can leave these settings unchanged.
Step 4 Click
on the Tool Bar. After 16 MBytes of traffic is recorded,
the SATracer Analyzer uploads the data and displays the
Frames.
Stopping a
Recording
16
You can stop the recording process at any time by pressing
will automatically upload from the analyzer to the PC.
. Afterwards, the trace
LeCroy Corporation
SATASuite User Manual
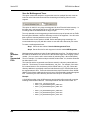
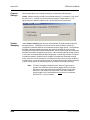
Interrupting
the Upload
Process
Version 6.25
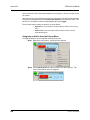
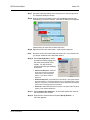
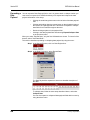
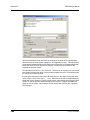
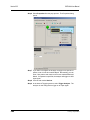
You can interrupt the upload process by pressing the Stop
will cause the following dialog box to open:
button. Pressing Stop
This dialog presents options for stopping, continuing, or aborting the recording:
•
Select New Upload Range within the Recorded Buffer
•Slide Bar - Adjust arrows at either end of the slide bar to select the
range of buffer you want uploaded. The color in the slide bar
indicates pre- and post-trigger traffic.
•Full Buffer - Uploads entire buffer to the PC.
•Upload Selection - Uploads whatever range you have selected via
the slide bar.
•
Abort Upload?
•Stop - Stops the recording and then displays the trace on screen.
•Continue - Resumes the recording.
•Flush - Cancels the recording without saving or displaying the trace.
Once you have interrupted an upload, a new button will appear on the toolbar:
. This
button ("Re-upload") opens a dialog box with a slide bar for re-selecting the range of the
trace that you would like to upload.
LeCroy Corporation
17
Version 6.25
Saving the
Trace
SATASuite User Manual
When the recording session is finished, the bus traffic is uploaded to the PC and is
automatically saved to the hard drive as a file named data[sn].sata where [sn] is the
serial number of the 10K chassis; or the name you assign as the default filename.
Step 1 To save a current recording for future reference, select
Save As from the File menu.
Step 2 Give the recording a unique name and save it to the appropriate
directory.
18
LeCroy Corporation
SATASuite User Manual
Version 6.25
Probe Control Settings
LeCroy analyzers are designed to interface with the communications channel in a
non-intrusive manner, to minimize any distruption of traffic or error conditions due to
insertion of the analyzer. In some cases, the user may desire to adjust the probe settings
to achieve a more optimum balance of complete data capture with minimal traffic
disruption, and for that reason direct user access is provided to the probe control settings.
The probe control dialog provides several user adjustable settings for the probe
performance, which vary depending on the model (Avalanche or SASTracer).
Modification of these settings occur in real-time and do not require cycling the power or
uploading new firmware.
Avalanche
Systems
LeCroy Corporation
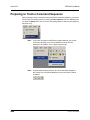
To access probe control setting for an Avalanche System, select Probe Control from the
Setup menu.
19
Version 6.25
SATASuite User Manual
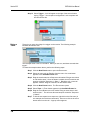
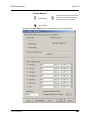
Selecting this option displays the Probe Control Setting dialog:
Allowed adjustments include chip selection, port selection, applying input signal
equalization, output pre-emphasis, output power, input state, input LOS, and output state.
You can Restore Factory Defaults.
Chip Selection
In the Avalanche System, the probes can be controlled separately for initiator traffic and
for target traffic. For separate adjustments, first adjust one probe, click Apply to apply the
settings, then select the other probe and make adjustments there.
Probe Control Settings can be set for Initiator, Target, or Apply to Both. You can select
the Target from a list.
Port Selection
Probe Control Settings can be set for P1, P2, P3, P4, or Apply to All Ports.
20
LeCroy Corporation
SATASuite User Manual
Version 6.25
Input Signal Equalization
Input signal equalization can be adjusted within a matrix of three time values, with four
settings for each time value. The time settings are relative: Short, Medium, and Long. The
available levels, from left to right, are Off, Min(imum), Mod(erate), and Max(imum). The
default setting is Min for Short. The default setting is Off for Medium. The default setting
is Min for Long.
Output Pre-emphasis
Output pre-emphasis is controlled within a matrix of two time values, with 15 settings
within each time value. The time values are Output Pre Long and Output Pre Short. The
settings for each are from Off (0) to Max (15). The default setting is Off for
Output Pre Long. The default setting is 13 for Output Pre Short.
For short cables, Short Level is more important than Long Level. For long cables,
Long Level is more important than Short Level. Use cable length to set pre-emphasis:
•
•
For long cables, set Long Level at the middle and Short Level to OFF or at a predefined value that you derive by trial and error in the lab.
For short cables, set the Long Level at the middle and set Short Level to a value that
you derive by trial and error in the lab.
For Output Pre Long and Output Pre Short, you can set the Decay from 0 to 7. The
default setting is "Off" for Output Pre Long. The default setting is 4 for Output Pre Short.
Output Power
The output power is available in eight steps from 626 mV to a maximum of 1294 mV. The
default setting is 808 mV.
You can Terminate to VDD.
LeCroy Corporation
21
Version 6.25
SATASuite User Manual
Input State
You can Terminate to VDD.
Input LOS
You can set LOS Threshold from 0 to 7. The default value is 2.
Output State
You can set the Mode from 0 to 15. The default value is 5.
You can Enable LOS Forwarding.
22
LeCroy Corporation
SATASuite User Manual
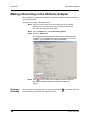
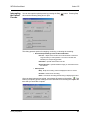
SASTracer
Systems
Version 6.25
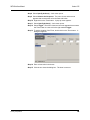
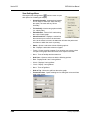
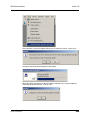
To access probe control settings for a SASTracer System, select Probe Control from the
Setup menu.
If there’s more than one analyzer
connected, the user will have an
option to select Probe Control
Settings for each device individually
The Port Settings and OOB Idle Sensitivity are only available when the SAS analyzer
system is operating in Repeater mode.
The Plug-in Mode options provide an additional control for the SASTracer External
Connector Module (SS004MAA) only. These controls will be disabled when attached to
the Internal SATA-style module (SS002MAA) because this module operates in Repeater
mode only.
Break Link - Checking this box for a specific channel takes the link to electrical idle. It
has the same effect as manually detaching a single connector from the device to "break
the link". Unchecking the Break Link box for a specific channel brings the link up. It has
the same effect as attaching a connector to a powered-on device.
LeCroy Corporation
23
Version 6.25
SATASuite User Manual
High Swing - Alters the repeaters differential output swing to accommodate for PCB /
connector loss. By default, the repeater uses "Normal" swing. "High" swing may be
required when tapping between long backplanes or extended cable distances:
•
•
Normal Swing: 440 mV min and 660 mV max (peak to peak)
High Swing: 800 mV min and 1200 mV max (peak to peak)
OOB Idle Sensitivity - Alters the repeaters OOB detection behavior to accommodate for
marginal OOB signal amplitude in SAS devices under test. The OOB idle sensitivity offers
an adjustable threshold for detecting an inbound OOB sequence. If two PHYs fail to
complete OOB, users may find lowering the OOB idle sensitivity provides a mechanism
for establishing the link even when the OOB signals from the DUT are marginal.
•
•
•
24
Normal - 100mV to 200mV
Decrease 30mV
Decrease 60mV
LeCroy Corporation
SATASuite User Manual
Version 6.25
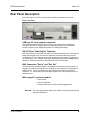
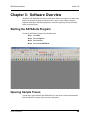
Chapter 3: Software Overview
SATASuite is an application that may be used with or without an analyzer unit. When used
without an analyzer, the program functions as a viewer to view, analyze, and print
captured traces (from SATracer analyzers) or command log files (from the SATracker
option on the SATracer).
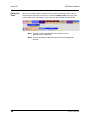
Starting the SATASuite Program
To start the SATASuite program from the Start menu,
Step 1 Click Start.
Step 2 Select Programs.
Step 3 Select LeCroy.
Step 4 Click LeCroy SATASuite
Opening Sample Traces
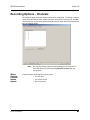
A good way to gain familiarity with SATASuite is to open some of the provided sample
files and explore the menus, pop-up menus, and reports.
LeCroy Corporation
25
Version 6.25
SATASuite User Manual
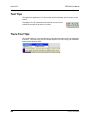
Tool Tips
Throughout the application, Tool Tips provide useful information about buttons on the
toolbar.
To display a Tool Tip, pause the mouse pointer over an item of
interest such as part of the trace or a button.
Trace Tool Tips
Many fields within the Trace will display tool tips when the mouse pointer is suspended
over them. These tips may provide a simple legend for the cell or may give substantial
added details about the field.
26
LeCroy Corporation
SATASuite User Manual
Version 6.25
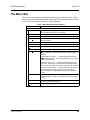
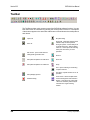
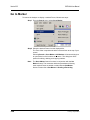
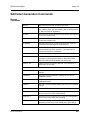
The Menu Bar
While some of the analyzer’s main display window options are familiar, many contain
options specific to the analyzer program. Depending on the particular analyzer function
in use, not all of the options shown here may be displayed.
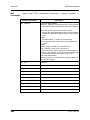
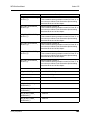
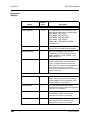
Table 1: Main Display Pull-Down Menus
Menu
Function
File
New GenFile
Creates a new (and empty) traffic generation file. To add text,
click the Edit as Text button on the toolbar.
Open…
Opens a trace file or traffic generation file.
Close
Closes the current trace or generation file.
Save As…
Saves all or a specified range of Frames from the current file with
a specified name.
Print…
Prints part or all of the current trace or traffic generation file.
Print Preview
Produces an on-screen preview before printing.
Print Setup…
Sets up your current or new printer.
Edit Comment…
Opens a dialog for entering a brief comment about the trace.
Export>>
Packets to Text (Packet View Format) - Saves all or part of a
trace to a text file. Useful for saving traces to floppy disk and for
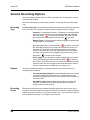
emailing.
to Generator File Format ... - Creates a traffic generation file
based on the open trace. This is a fast and easy way of creating
a traffic generation file.
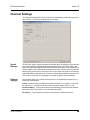
Packets to EAS Format ... - Creates an EAS file based on the
open trace. Running this command opens a dialog prompting
you for a file name, path, and a range of Frames to be exported.
Transport to CSV Format ... - Creates a structured .csv file from
all or part of the trace data. This file may be imported into
external databases or spreadsheet programs (e.g., Microsoft
Excel).
LeCroy Corporation
Convert>>
Convert .stg to .ssg - Converts SATA traffic generation files
created by SATracer (.stg) to the SASTracer generation format
(.ssg).
Merge Trace Files
Merges files which have been recorded as multitrace files (e.g.,
when using cascaded analyzers)
Exit
Exits the SATASuite program.
27
Version 6.25
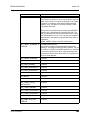
SATASuite User Manual
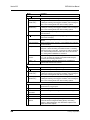
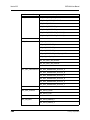
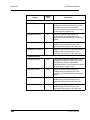
Menu
Function
Setup
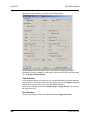
Display Options…
Opens a dialog for customizing trace colors, formats, and filters.
Recording Options
(UPAS 10K)…
Configures the SASTracer analyzer’s recording behavior. Opens
a dialog for selecting event triggers and filters, and for setting the
size of the recording buffer and other recording options.
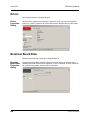
Recording Options
(Avalanche)…
Configures the Avalanche analyzer’s recording behavior. Opens
a dialog for selecting event triggers and filters, and for setting the
size of the recording buffer and other recording options.
Update Device
Opens a dialog for updating the BusEngine and Firmware of the
selected device.
Tracker Options
Configures tracking type, memory, triggering, channel settings,
and tracker sweeping.
Probe Control
Provides a dialog to adjust the probe settings of the selected
device.
Channel Settings
Allows renaming of the channels - ie the establishment of aliases
for each channel.
Analyzer Network
...
Opens a dialog box for browsing to local and networked
analyzers. Within the dialog, click Add to browse. The dialog
lists PCs that are on the LAN. If a PC has an analyzer attached
to it, and if DCOM permissions have been set on the selected
PC, clicking Select establishes a connection.
All Connected
Devices ...
Opens a dialog box with a list of analyzers connected to the host
PC. Lets you select an analyzer and update the BusEngine,
Firmware, and licensing information.
Switch ... to...
Switches between SATracer and SATracker capabilities for
systems with dual-function licenses.
Record
Start
Causes the Analyzer to begin recording.
Stop
Causes the Analyzer to stop recording.
Recording Options
(UPAS 10K)…
Configures the SASTracer analyzer’s recording behavior. Opens
a dialog for selecting event triggers and filters, and for setting the
size of the recording buffer and other recording options.
Recording Options
(Avalanche)…
Configures the Avalanche analyzer’s recording behavior. Opens
a dialog for selecting event triggers and filters, and for setting the
size of the recording buffer and other recording options.
Generate
28
Start Generation
Starts traffic generation. This command requires that a traffic
generation file (.ssg) be open.
Stop Generation
Stops traffic generation.
Resume
Generation
Resumes traffic generation if generation has been stopped.
Connect Link
Establishes a link between SATA Exerciser and the DUT.
Disconnect Link
Breaks the link between SATA Exerciser and the DUT.
Generation
Options
Opens a dialog for configuring traffic generation. The dialog
looks like the Recording Rules dialog (Setup > Recording
Options > Recording Rules). See Generation Options in the
Traffic Generation chapter.
LeCroy Corporation
SATASuite User Manual
Version 6.25
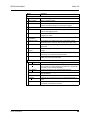
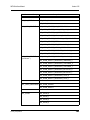
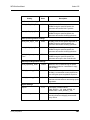
Menu
Function
Tracker
Start Tracking
Initiates tracking of all commands issued and completed.
Stop Tracking
Stops command tracking.
Tracker Options
Opens a dislog box to allow the user to establish settings to
control command tracking and set the timeout trigger.
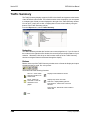
Report
File Information
Displays information about the recording such as the number of
Frames and triggering setup.
Error Summary
Summarizes the errors throughout the recording. Allows for fast
navigation to errors.
Timing
Calculations
Calculates timing between two Frames.
Traffic Summary
Summarizes the numbers and types of Primitives, Frames,
SCSI Operations, and errors that occurred in the open Trace.
Bus Utilization
Displays graphs of various types of events that occurred in the
open trace.
Run Verification
Scripts
Opens a dialog that allows you to select and run verification
scripts
Link Tracker »
Opens a window for displaying a detailed chronological view of
bus activity on a Primitive-by-Primitive basis.
Frame Tracker
Opens a window for displaying a detailed chronological view of
traffic on a Frame-by-Frame basis.
Search
LeCroy Corporation
Go to Trigger
Positions the display to show the Trigger event.
Go to Event...
Positions the display to the indicated Packet, Frame, Primitive
etc. The menu is context-sensitive and depends on the decode
level that you are currently displaying.
Go to Marker »
Positions the display to the selected marked Frame.
Go to »
Enables quick searching for specific events using a cascade of
pop-up windows.
Find ...
Allows searches by multiple criteria.
Find Next
Looks for the next instance of an event specified with Goto or
Find.
Search Direction
Allows the search direction to be changed from forward to
backwards or backwards to forward.
29
Version 6.25
SATASuite User Manual
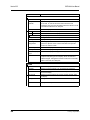
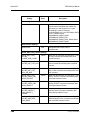
Menu
Function
View
Toolbars
Displays list of available Tool bars.
Analyzer Network
Chat Bar
Opens a dialog that allows users to conduct chat sessions over
an IP LAN. In order to send and receive electronic text
messages, each user must be working with a PC that is on an IP
LAN and also attached to an analyzer.
Status Bar
Switches display of the Status Bar on or off.
Zoom In
Increases the size of the displayed elements.
Zoom Out
Decreases the size of the displayed elements.
Wrap
Wraps displayed Frames within the window.
Compact
Changes view mode to the compact view.
Link Layer
Displays Link Layer traffic in the trace.
Decoding
Assignments
Decoding scripts set the values of the display and recording
options for optimum views of trace information from specific
vendors or classes of data.
Frame Layer
Decodes and displays the Frame layer.
FIS Layer
Decodes and displays FIS layer transactions.
Command (ATA)
Layer
Decodes and displays ATA Application layer transactions
Hide
Hides packet types, SATA FIS types, SATA FIS ports,
transport level (FIS types or FIS ports), SCSI commands or
initiators-targets, management function codes, ATA commands,
ATAPI commands, and ATA ports,
Window
30
New Window
Switches display of the Tool bar on or off.
Cascade
Displays all open windows in an overlapping arrangement.
Tile Horizontal
Displays all open windows as a series of strips horizontally
across the display.
Tile Vertical
Displays all open windows as a series of strips vertically down
the display.
Arrange Icons
Arranges minimized windows at the bottom of the display.
Windows ...
Displays a list of open windows.
LeCroy Corporation
SATASuite User Manual
Version 6.25
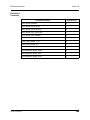
Help
LeCroy Corporation
Help Topics ...
Opens online help.
Update License ...
Opens a dialog box for entering license key information for the
analyzer.
Register Product
Online
Register at the LeCroy website.
Check for Updates
Use the Internet to analyze your system for licensed updates.
Display License
Information ...
Opens a dialog box with information about the current status of
the analyzer's license
About...
Displays version information about SATASuite.
31
Version 6.25
SATASuite User Manual
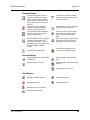
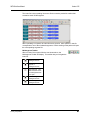
Toolbar
The Tool Bar provides quick access to most of the SATASuite software functions. You can
learn the function of each button by pausing the mouse pointer over them. Descriptions
of the buttons appear on the status bar at the bottom of the window and as tooltips above
each button.
Open File
Save As
Stop Recording
Re-upload. This button appears in the
toolbar if Stop has been pressed
during an upload. Causes analyzer to
re-upload trace from analyzer buffer
to the PC. Gives options for selecting
which part of the trace you want
uploaded.
Edit as text - opens a text editor for
editing traffic generation files.
Zoom In
Setup Record Options for SASTracer
Zoom Out
Setup Record Options for Avalanche
Wrap
Find - Opens a dialog for conducting
complex searches
Setup Display Options
Start Recording
32
Find Next - repeats last Find or Go To
operation
Trace Panes. Allows multiple traces
to be locked together and scrolled in
tandem. This option only works with
.mlt traces created by multi-analyzer
cascades in a single recording
session.
LeCroy Corporation
SATASuite User Manual
Version 6.25
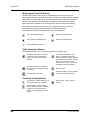
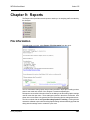
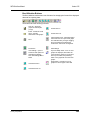
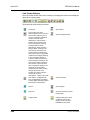
Reports Buttons
File Information Report. Opens a
summary of the trace file including
when it was made, the Recording
Options used to create the file, and
data on the analyzer that recorded
the trace.
Error Report. Opens the Traffic
Summary window and displays a
summary of errors in the trace.
Timing and Bus Usage Calculations.
Opens a calculator for measuring
timing between Frames.
Show Data Block. Opens a dialog for
navigating to data blocks within
Frames and Transactions. Once a
data block is located, the window can
display the data in a variety of
formats.
Opens the SAS-Auditor dialog.
Traffic Summary. Opens a window
displaying a table summary of traffic
recorded in the trace.
Bus Utilization. Presents a graphical
summary of traffic in the trace.
Show Link Tracker. Opens window
with detailed chronological view of
traffic on a Primitive-by-Primitive
basis.
Show Frame Tracker. Opens window
with detailed chronological view of
traffic on a Frame-by-Frame basis.
Opens a dialog that allows you to
select and run verification scripts.
Decode Buttons
Decode & display Link Layer (Frames
& Primitives)
Decode & display ATA Application
Layer
Decode & display FIS Layer
Decode & Display OOB (Out of Band)
Signaling
Decode & display TrC Layer
Hide Buttons
Hide Align and Notify Primitives
Hide Initiator Channel 1
Hide RRDY Primitives
Hide Target Channel 1
Hide SATA Sync Cont Primitives
Hide Unassociated Traffic
LeCroy Corporation
33
Version 6.25
SATASuite User Manual
Multisegment Trace File Buttons
These buttons become active if a multi-segmented trace file has been opened.
Multi-segment traces are traces that have been recorded as a series of small segments
rather than as a single, large recording. Multi-segmenting was developed to make it
easier to work with large recordings where navigation can sometimes be difficult.
Multi-segmenting is enabled in the General page of the Recording Options dialog.
Multi-segmenting produces two kinds of files: segments and an index file that
summarizes the recording and keeps tabs of the various segments.
The buttons below allow multi-segmented traces to be navigated.
Show first multisegment file
Show next multisegment file
Show previous multisegment file
Show last multisegment file
Show multisegment index file
Traffic Generation Buttons
These buttons become active if a traffic generation file (.ssg) is open.
Start Traffic Generation. This button
activates if a traffic generation file
(.ssg) is open and an SATrainer is
attached.
Stop Traffic Generation. This button
becomes active if a traffic generation
is underway.
Resume Traffic Generation.
Connect link. Establishes a link
between SATrainer and the DUT.
When a Connect is built into the traffic
generation script, this button will give
status on the connection (it will
depress when a connect occurs and
undepress when disconnected.)
Disconnect link
Generation Options. Opens a dialog
for configuring traffic generation.
Command Tracking Buttons
Start Tracking. Initiates tracking of all
commands issued and completed.
Stop Tracking. Stops command
tracking.
Tracker Options. Opens a dialog
window to allow the user to establish
settings for controlling command
tracking, including setting a timeout
trigger.
34
LeCroy Corporation
SATASuite User Manual
Version 6.25
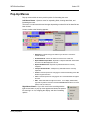
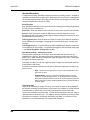
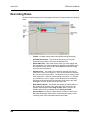
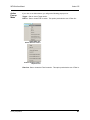
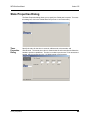
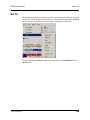
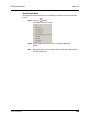
Pop-Up Menus
Pop-up menus within the trace provide options for formatting the trace.
Left Mouse Button - Opens a menu for expanding fields, viewing data fields, and
formatting the trace.
The menu is context-sensitive and changes depending on what field of the data file has
been clicked.
A menu similar to the following appears:
•
Data Field - Indicates the type of field that you selected. This field is
context-sensitive.
•
•
View Data Block - Allows raw data to be viewed from a data cell.
•
Expand All Data Fields - Expands any data fields that are currently
collapsed.
•
Collapse All Data Fields - Collapses any data fields that are currently
expanded.
•
Format - Presents options for changing the numerical formatting of the data
fields throughout the trace.
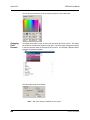
•
Color - Presents options for changing the color of the data fields throughout
the trace.
•
Hide - Hides data fields throughout the trace. To re-display hidden fields,
right-click anywhere in the trace and select Unhide Cells and then one of the
options from the sub-menu.
Expand Data/Collapse Data - Expands or collapses data field. Summarizes
the amount of data displayed in the cell.
Right Mouse Button - If you click a cell in the recording with the
right mouse button, a pop-up menu appears and shows the options
for zooming in or out, wrapping the display, and other formatting
options.
LeCroy Corporation
35
Version 6.25
SATASuite User Manual
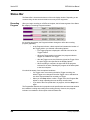
Status Bar
The Status Bar is located at the bottom of the main display window. Depending on the
current activity, the bar can be divided into as many as four segments.
Recording
Progress
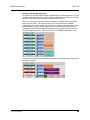
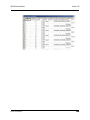
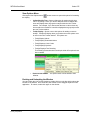
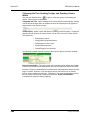
When you begin recording on a SATracer Analyzer, the left-most segment of the Status
Bar displays a recording Progress Indicator:
As recording progresses, the Progress Indicator changes to reflect the recording
progress graphically:
•
In the Progress Indicator, a black vertical line illustrates the location of
the Trigger position you selected in Recording Options.
— Pre-Trigger progress is displayed in the field to the left of the
Trigger Position.
— When the Trigger position is reached, the progress indicator
wiggles as it waits for the Trigger.
— After the Trigger occurs, the field to the right of the Trigger fills in
the post-Trigger color specified in the Display Options.
— When recording is complete, the upper half of the progress
indicator fills in white, indicating the progress of the data upload
to the host computer.
You should be aware of two exceptional conditions:
•
If a Trigger event occurs during the before-Trigger recording, the
before-Trigger color changes to the after-Trigger color to indicate that
not all the expected data was recorded pre-Trigger.
•
When you click Stop before or after a Trigger event, the Progress Bar
adjusts to begin uploading the most recently recorded data.
•
If you wish to abort an upload that is in progress, click the Stop button
again.
The Progress Bar fills with color in proportion to the specified size and actual rate at which
the hardware is writing and reading the recording memory. However, the progress
indicator is normalized to fill the space within the Status Bar.
36
LeCroy Corporation
SATASuite User Manual
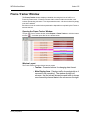
Recording
Status
Version 6.25
During recording, the current recording status is displayed in the next segment of the
status bar. (Refer to previous screenshot for examples.) When recording is begun, one
of the following messages flashes (depending on the selected Recording Options):
•
Trigger?
•
Triggered!
•
Uploading
After recording stops, The following occurs:
•
Flashing message changes to Uploading data–x% done (x% indicates
the percentage completion of the data uploading process).
•
Traffic data is copied to disk (overwriting any previous version of this
file) using the default file name data.sata. You can also create a file
name of your choice by specifying one in the Recording Options
window.
To abort the upload process, press the Stop button.
You are asked if you want to keep or discard the partially uploaded data.
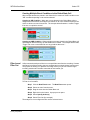
When the data is saved, the Recorded Data file appears in the main display window, and
the Recording Status window is cleared.
Recording
Activity
•
If the recording resulted from a Trigger event, the first Frame following
the Trigger (or the Frame that caused the Trigger) is initially positioned
second from the top of the display.
•
If the recording did not result from a Trigger event, the display begins
with the first Frame in the traffic file.
During recording, the fourth segment from the left of the Status Bar displays Recording
activity as a series of vertical bars.
The more vertical bars that are displayed, the greater the amount of activity being
recorded. If there are no vertical bars, there is no recorded activity.
During uploading, the percent of the completed upload is displayed.
Search
Status
LeCroy Corporation
The rightmost segment displays the current search direction: Fwd (forward) or Bwd
(backward).
37
Version 6.25
SATASuite User Manual
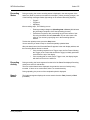
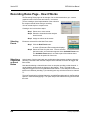
Navigation Tools
You can zoom in and out, and wrap the recording to fit within the screen by using the
following buttons:
Zoom In
Increases the size of the displayed elements, allowing fewer (but larger) Frame fields per
screen.
Click
Zoom Out
Decreases the size of the displayed elements, allowing more (but smaller) Frame fields
per screen.
Click
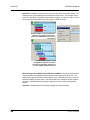
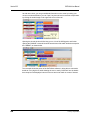
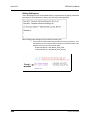
Wrap
on the Tool Bar.
on the Tool Bar.
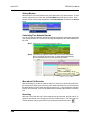
Adjusts the Trace View so that Frames fit onto the next line if they are longer than the size
of the window. Without Wrap, you can use the horizontal scroll bar to see the hidden part
of a Frame.
Click
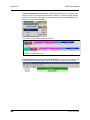
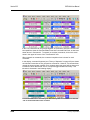
on the Tool Bar.
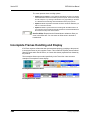
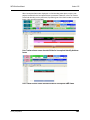
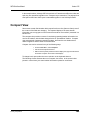
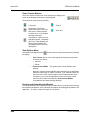
Trace with Wrap turned off. In this example, the Time Stamp extends
off the right edge of the screen.
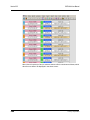
Trace with Wrap turned on. Entire Frame displays in window.
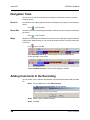
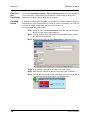
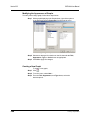
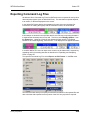
Adding Comments to the Recording
You can create, view, or edit the 100-character comment field associated with each data
file.
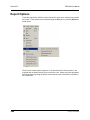
Step 1 From the File menu, select Edit Comment.
The Edit Trace Comment Dialog window appears.
Step 2 Create, view, or edit the comment.
Step 3 Click OK.
38
LeCroy Corporation
SATASuite User Manual
Version 6.25
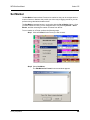
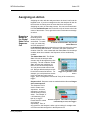
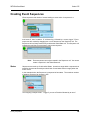
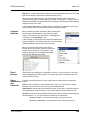
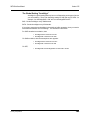
Set Marker
The Set Marker feature allows Frames to be marked so they can be navigate back to
events of interest. Markers also provide you with a way of tagging events so you can
perform timing calculations between them.
The Set Marker command works in conjunction with the Go to Marker feature. Once
you have marked a Frame, you can navigate back to it by selecting Search > Go to
Marker, and then selecting the marker of interest from the list.
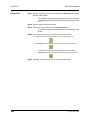
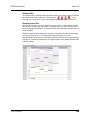
To set a marker on a Frame, perform the following steps:
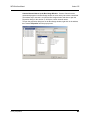
Step 1 Click on Frame # for the Frame you wish to mark.
Step 2 Select Set Marker.
The Edit Market for Frame # comment window appears.
LeCroy Corporation
39
Version 6.25
SATASuite User Manual
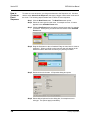
Step 3 Enter your comment.
Step 4 Click OK.
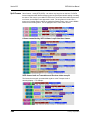
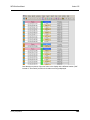
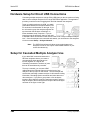
A marked Frame is indicated by a vertical red bar along the left edge of
the Frame # block:
40
LeCroy Corporation
SATASuite User Manual
Version 6.25
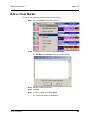
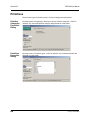
Edit or Clear Marker
To clear or edit comments associated with a Frame marker,
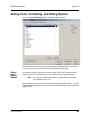
Step 1 Click on Frame # for the chosen packet.
Step 2 To edit the marker comment, select Edit Marker.
The Edit Marker for Frame # comment window appears.
Step 3 Edit the comment as desired.
Step 4 Click OK.
Step 5 To clear a marker, click Clear marker.
The vertical red Marker bar disappears.
LeCroy Corporation
41
Version 6.25
SATASuite User Manual
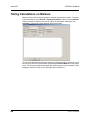
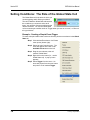
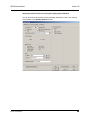
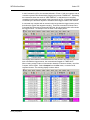
Timing Calculations on Markers
Markers can be used as reference points to calculate timing between events. To perform
a timing calculation, select Reports > Timing Calculations, and then click the Markers
buttons to select the markers you want to use for the calculation. Afterwards, click
Calculate to calculate the timing between the marked events.
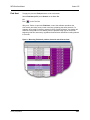
You can also calculate timing between markers by clicking the left mouse button on the
first cell of a Frame in the trace window and selecting Time from Marker from the pop-up
menu. The Timing Calculations dialog will open and prompt you to select a marker. Upon
selecting a marker from the list, the calculation will be performed.
42
LeCroy Corporation
SATASuite User Manual
Version 6.25
Chapter 4: SATracer Recording Options
The Recording Options dialog box presents options for configuring a trace recording.
The dialog box has two pages of options: General and Speed Selection. The General
page present general types of options that affect all recordings. The Speed Selection
page presents options for configuring the traffic speed that will be recorded.
From the Setup menu, select Recording Options.
Recording Options window appears, displaying the General tab.
LeCroy Corporation
43
Version 6.25
SATASuite User Manual
General Recording Options
The General page presents options for setting the buffer size, recording type, and the
Trace filename and path.
Two sets of Recording Type options are presented: Recording Scope and Recording
Type.
Recording
Type
The Recording Type box presents three options that control how SATASuite begins and
ends a recording. The options are Snapshot, Manual Trigger, and Event Trigger.
•
Snapshot: A Fixed-length recording. A Snapshot is a recording whose
size is set via the "Buffer Size" box. Recording begins when the Start
Recording button
is clicked and ends when either the selected
buffer size is filled or the Stop Recording button
is pressed.
•
Manual Trigger: A recording whose ending is triggered by pressing the
Trigger button on the front panel.
Recording begins when the Record button
is pressed on the Tool
Bar. Recording continues in a circular manner within the limits set by
the buffer size. Recording ends following depression of the Trigger
button on the front panel. Once the Trigger button has been pressed,
recording continues until the post-trigger buffer has been filled or the
Stop button
•
Options
Recording
Scope
44
is clicked on the Tool Bar.
Event Trigger: A recording whose ending is triggered by user-defined
events. Recording begins when the Record button
is clicked on
the Tool Bar. Recording continues in a circular manner within the limits
set by the buffer size until a trigger event is detected and the defined
amount of data has been recorded after the Trigger event.
The options checkboxes appear on the upper right side of the General tab of the
Recording Options window.
•
Truncate Data Payload Dwords: Allows data payloads to be truncated
to whatever length is specified in the box. Truncating the payload
preserves recording buffer, thereby increasing the amount of traffic that
can be recorded.
•
Beep When Trigger Occurs: When this checkbox is selected, the
computer connected to the SATASuite beeps three times when a
Trigger condition is first detected.
Recording Scope presents two important options that affect the size or scope of the
recording. These options are Spooled and Conventional recordings. The Spooled option
enables very large recordings - for example, several hours. The Conventional option is
used for smaller recordings - for example, several minutes.
LeCroy Corporation
SATASuite User Manual
Conventional Single
Buffer
Recording
Version 6.25
In a Conventional recording, the entire trace is recorded and stored in the analyzer buffer
before it is uploaded to the host PC. Recordings are thus limited in size to the size of the
analyzer buffer - or 2 GB. If you are planning to create a moderate-sized recording, this
is a good option to select. You set the buffer size and the trigger position, then begin the
recording. The analyzer’s buffer fills, then the traffic is uploaded to the host PC.
If you are planning to create a large recording or are planning to let the analyzer run over
a several days, then select Spooled Recording. In a Spooled Recording, traffic is
uploaded periodically to the host PC - thus freeing analyzer buffer and allowing the
recording to continue.
Buffer Size - The Buffer Size slide bar adjusts the
recording buffer size from 1.6 megabytes to 2048 MB.
This option is used for setting the memory for a
Conventional recording.
The Recording Type option determines how this buffer is
used. Although there are 2048 MB of physical memory in
the Analyzer, the efficiency of the recording ranges from 2:1 to 4:1 ratios of physical
memory to actual SATA traffic. Shorter Frames yield a less efficient recording. The
non-traffic portion of physical memory is utilized for control and timing information.
Note:
The scale is not linear and affords more granularity in the smaller buffer
sizes.
Trigger Position - The Trigger Position slide bar sets
the amount of pre- and post-trigger recording in a
Conventional recording. It also allows adjustment of
the location of the trigger within the defined buffer. You
can adjust the Triggering Position between 1 and 99%
post-Trigger. Trigger Position is available only when
Manual Trigger or Event Trigger is selected as
Recording type.
As an example, if the buffer size is set to 16MB, then for the following Trigger Position
settings, the amount of pre- and post-Trigger data is:
•
•
•
•
•
LeCroy Corporation
95% post-triggering: 0.8MB pre-trigger, 15.2MB post-trigger
75% post-triggering: 4MB pre-trigger, 12MB post-trigger
50% post-triggering: 8MB pre-trigger, 8MB post-trigger
25% post-triggering: 12MB pre-trigger, 4MB post-trigger
5% post-triggering: 15.2MB pre-trigger, 0.8MB post-trigger
Note:
When a Trigger occurs, recording continues until the post-Trigger
amount of the buffer is filled.
Note:
The buffer is limited to 1 GB when in trainer mode/configuration.
45
Version 6.25
SATASuite User Manual
Save As Multisegment Trace
This option causes the analyzer to segment the trace into multiple files and create an
index file called data.mlt that summarizes the starting and finishing frame for each
segment.
This option is useful for very large recordings and for host PCs with limited memory. In
the latter case, multi-segmenting gives a PC with limited memory a way to open
recordings that would otherwise be too large to open.
The only downside to multi-segmenting is that limits the scope of reports such as Traffic
Summary, Bus Utilization, and Error Summary to each of the segments. You will not be
able to perform summary statistics on the full recording.
The default value for this option is 64 MB. Before attempting large recordings, it is
recommended that you play with this number to see what value best suits your needs.
To create a multisegmented trace,
Step 1 Check the box marked Save As Multisegmented Trace.
Step 2 Set the file size for each segment in the box marked MB Segments.
File
Structure
for
Segmented
Files
Multisegmenting produces an index file and subordinate trace files. The default name of
the index file is dataXYZ.smt, where XYZ is the last three digits of the analyzer’s serial
number. (You can see the unit’s serial number by selecting Help > About SATASuite)
Thus, for example, if you had an analyzer with the serial number 111, the index file would
be called data111.smt.
The index file and the segmented trace files are stored in a directory named after the
index file. The directory is named indexfilename_smt_files. For example, if the index
file is named data111.smt, the directory will be named data111_smt_files. Below this
directory additional, sequentially numbered sub-directories (up to 100,000) that house
the segmented trace files. These sub-directories bear simple numerical names: 00000 00999. Each of these subdirectories can hold up to 100 sequentially-numbered segment
files. Collectively, the entire directory structure can hold up to 10 million files.
Example
A 1010 MB recording using 10 MB segments and the default file names will create the
following sub-directories and files. The example below uses the serial number 111:
46
•
•
•
data111.smt This is the index file.
data111_smt_files\00000\segment_00000.sata
data111_smt_files\00000\segment_00001.sata
...
•
•
•
data111_smt_files\00000\segment_00099.sata
data111_smt_files\00001\segment_00100.sata
data111_smt_files\00001\segment_00101.sata
LeCroy Corporation
SATASuite User Manual
Version 6.25
The index file looks something like a trace file but contains packet-like entities that
summarize each 10 MB segment.
When uploading is complete, the index file will be opened. Each "packet" in this file
corresponds to one of the numbered segments. Double clicking on the packet will open
the corresponding segment file.
Multisegment Toolbar
When an index file is opened like the one shown above, the
Multisegment Toolbar will display. This toolbar lets you navigate the
index file.
Open first segment in
multisegment trace.
Open previous
segment in
multisegment trace.
Open index file. This
button becomes active
if a multisegment trace
file is open.
Open next segment in
multisegment trace.
Open last segment in
multisegment trace.
LeCroy Corporation
47
Version 6.25
SATASuite User Manual
Spooled Recording
In a Spooled recording, uploading commences when the recording is begun. As traffic is
uploaded from the analyzer to the host PC, the analyzer memory is freed - creating space
for recording additional traffic. Recording can thus continue for long periods of time, and
create file lengths well in excess of 2 GBs.
Recording Size
With Spooled Recordings, you are given the option of setting the recording length based
on time or on the recording size.
Record for - Enter the duration of the recording in days, hours, minutes, and seconds.
Record - Enter the amount of traffic (in MB) that you want the analyzer to record.
Selecting this option will create a fixed length recording that begins as soon as you click
the REC button on the menu bar.
Until Triggered, plus - Enter the amount of traffic (in time) that you want the analyzer to
record following an event trigger. Recording time units are days, hours, minutes, and
seconds.
Until Triggered, plus - Enter the amount of traffic (in MB) that you want the analyzer to
record following an event trigger. You select event triggers in the Recording Rules page
-- see “Recording Rules” on page 50 for details.
Spooled Recordings - Performance Issues
During a spooled recording if the analyzer buffer fills faster than the trace can be
uploaded to the host PC, the analyzer will briefly suspend recording until some of the
buffer is free. When recording is suspended, gaps will appear in the trace. These gaps
will appear as entries in the trace.
During the recording, you can see if gaps are likely to happen by reading the status bar
at the bottom of the screen.
The Status bar has two fields that you can use to determine if gaps are occurring or are
about to occur.
•
Gaps - Shows how many gaps have occurred. In the example above, two
gaps have occurred.
•
Hardware Buffer - shows you how full the analyzer buffer is and if the
analyzer is currently dropping packets. In the example above, Hardware
Buffer field shows that the buffer is full (shown by the thick green graph) and
that the analyzer is currently dropping packets (shown by thin red line atop of
the green graph.)
Preventing Gaps
Gaps can be caused by a number of factors - the number of channels being recorded,
the absence of filtering, the performance of the host PC (for example, is it using USB 2.0
to upload traffic?), and the amount of traffic produced by the devices under test.
There are several ways to prevent gaps. You will need to experiment with your setup to
determine what works best for you. You might try filtering out primitives, turning on data
truncation (for example to 10 Dwords) and filtering out LISMs. If you want to record
primitives, it is recommended that you enable primitive packing.
48
LeCroy Corporation
SATASuite User Manual
Version 6.25
Channel Settings
The Channel Settings page lets you to set speed, descrambling and packing options for
each channel. It also lets you inhibit channel recording.
Speed
Settings
The SATracer system supports Autodetect Link Rate which is designed to pass through
the speed negotiation signaling allowing the initiator and device to determine the link
speed using the method defined in the SATA specification. However, if the negotiated link
speed is higher or lower than the speed selected in this tab, SATracer will not decode the
traffic properly (there will be errors in the trace). If an initiator and target are successfully
negotiating 3Gbps transmission rate, choose the 3Gbps Speed Selection in this tab. The
user will know if devices are negotiating successfully by getting clean recordings.
Channel
Settings
These options allow you to inhibit recording and turn off scrambling and packing on a
channel by channel basis.
Inhibit - Inhibits recording of traffic from selected channels. For example, if you check
the option for T1, it means "record all channels except for Target channel 1 (T1)."
No Descrambling - Turns off the analyzer’s descrambling from the selected channels.
Select this option if your DUTs are not scrambling their traffic.
No Packing - Turns off primitive and idle packing from the selected channels.
LeCroy Corporation
49
Version 6.25
SATASuite User Manual
Recording Rules
The Recording Rules page lets you set triggers and filters. The page divides into following
areas:
50
•
Toolbar - Contains buttons that control the Recording Rules page.
•
Available Events area -- Part of the screen where you can park
buttons that you intend to use in the Global State Cell.
•
Global State Cell -- Part of the screen where you create trigger and
filter conditions. You create conditions by dragging event buttons from
the Available Events Area into the Global State Cell and then assign
actions to the event buttons.
•
Sequence Cell -- The inactive cell marked by the faint text Drag an
event here to add a new sequence. Once an event button is placed in
this cell, the cell becomes active. The Sequence Cell is used to create
event sequences - chains of events leading to an action: If x followed
by y followed by z occurs, trigger. Event Sequences are created by
assigning the action Advance the Sequence to the links in the chain
and trigger (or some other action) to the final event.
•
Rule Status Indicator - An indicator that shows the validity status of
the current set of recording rules. When the rules are correct, the
indicator will display the text Config is valid. When incorrect, the
indicator will turn red and display the text Config is Invalid.
•
Pop-up Menus (not shown) - Right-clicking on button or area in the
Recording Rules page will access a context-sensitive pop-up menu
containing most of the commands listed in the toolbar.
LeCroy Corporation
SATASuite User Manual
Version 6.25
Recording Rules Toolbar
The Recording Rules toolbar exposes functionality for controlling the Recording Rules
page.
New Event. Opens a menu of events. Selecting an
event causes an event button to appear in the Available
Events area.
Delete Event. Deletes selected event button.
Undo. Undoes last change made to Recording Rules
page. The undo buffer has unlimited depth.
Redo. Repeats changes undone by the Undo button.
Zoom In. Enlarges the display. There are five zoom
levels. The default level is the middle one. If you have a
wheel mouse, you can also zoom by holding down the
Control key and then operating the mouse wheel.
Zoom Out. Makes the display appear smaller.
Show/Hide channels. When pressed, this button tells
the Recording Rules dialog to show the channel buttons
on the Events icons. When unpressed, the channels are
hidden.
Show/Hide Properties Dialog. Shows or hides the
Properties dialog of the selected State/Event/Action.
Config is valid. This message displays when the current
Recording Rules configuration is valid and can be
executed by the hardware. This message gets updated
every time the Recording Rules configuration changes.
When the configuration is incorrect, the message is
replaced by "Config is incorrect."
Config is invalid. This message displays when the
current Recording Rules configuration exceeds
hardware limitations. You can click the indicator to get
the diagnostics message box to find the problem.
LeCroy Corporation
51
Version 6.25
SATASuite User Manual
Recording Rules Page - How it Works
The Recording Rules page can be thought of as a chalk board where you create a
graphical model of the events and actions. In essence,
you are creating a visual representation of the rules that
the analyzer should follow during a recording.
You can create simple or complex rules.
Creating a rule involves three steps:
Step 1 Select one or more events.
Step 2 Select the channels that the analyzer
should record.
Step 3 Assign an actions to the events.
Selecting
Events
Events are selected from the New Event menu:
Step 1 Click the New Event button.
A menu of Events and Event categories displays.
Step 2 Select an Event from the menu. Once a selection
has been made, an Event button appears in the Available Events area.
The Available Events area is an inactive part of the window where
buttons can be parked for future use.
Selecting a
Channel on
an Event
Button
At the bottom of each event button are small buttons that represent analyzer channels.
Selecting a channel button tells the analyzer which channels to monitor for trigger and
filter events.
Note that deselecting a channel button does not stop the recording on that channel - it
merely disables actions such as triggers on the channel. Thus, if you had set the
analyzer to trigger on an error but had deselected channel T1, the analyzer would record
traffic on all channels (including T1) but would ignore any error that occurred on channel
T1.
To turn off recording for individual channels, use Inhibit Recording option in the Recording
Options > Channel Settings page. This option will prevent traffic from being recorded into
the trace.
52
LeCroy Corporation
SATASuite User Manual
Version 6.25
Assigning an Action
Assigning an action tells the analyzer what to do when it has found the
targeted event. If you do not assign an action, the analyzer will look for
the event but do nothing once the event has been encountered.
Assigning an action is a two-step process: first, move an Event button
from the Available Events area on the left to one of the two cells in the
center of the window. Then, right-click on the Event button and assign
an action.
Dragging a
Button to
the Global
State Cell or
Sequence
Cell
The center of the
Recording Rules
window is where rules
are defined. To create
To activate an Event button, drag it to the
a rule, you must drag
Global State Cell.
an Event button from
the Available Events area on the left to one of the two cells in the center
of the Recording Rules window. The cells in the center control the
duration of the rule: rules created with the Global State Cell are always
enabled, while rules created in the Sequence cell are conditionally
enabled.
The Global State Cell - The Global
State Cell tells the analyzer what
events to look for throughout the entire
recording. The cell is called a "Global
State" because the conditions you
define in the cell are always active.
You can place several events in this
cell. Doing so tells the analyzer to look
This configuration reads
for all of the events all of the time. For
"trigger if any of these events
example, you could place three events
occur."
in this cell and have each cause a
trigger. Such a configuration would read "If any of the events occur,
trigger."
Sequence Cell - Sequence cells are marked with the faint text Drag to
add a new sequence.
The Sequence Cell is
used to create event
sequences. An event
sequence is a chain of
events leading to some
action. For example, "If
x is followed by y and
then by z, trigger."
Events linked in a chain An event sequence. This reads "If a primitive
is followed by an error, then trigger."
are looked at
sequentially. Thus, at
any given time, the analyzer is often only be looking for a single event
out of the several that might be in the Sequence cell.
LeCroy Corporation
53
Version 6.25
SATASuite User Manual
There can be up to 255 events linked together into a sequence. Only one sequence can
be created.
When two or more events have been moved into a Sequence cell, they can be linked into
a sequence by assigning the action Advance the sequence to events in the chain. The
last event in a sequence is then usually assigned the action Trigger.
There are two ways to assign an action to an event button:
•
Right-click on an event button and select Specify Action from the pop-up
menu.
•
Double-click on the event button and then select an action from the
Properties dialog box.
Assigning an Action from the Pop-up Menu
To assign an action to an event button via the pop-up menu,
Step 1 Right-click on the button. A pop-up menu appears:
Step 2 Select Specify Action and then an action from the sub-menu. The
menu closes and the action is assigned.
54
LeCroy Corporation
SATASuite User Manual
Version 6.25
Assigning an Action via the Properties Dialog Box
Step 1 You can also assign actions to event buttons via the Properties
dialog box. Double-click on an event button to open the
properties dialog box.
Step 2 Select the Actions tab.
Step 3 Assign an action.
See “Types of Properties Dialog Boxes” on page 60 for further
details on Properties dialog boxes.
LeCroy Corporation
55
Version 6.25
SATASuite User Manual
Types of Pop-up Menus
The pop-up menu are context-sensitive and will display different options depending on
the object you have clicked.
Global State
Cell and
Sequence
Cell Pop-up
Menus
If you click on the Global State Cell or Sequence Cell (but not one of the buttons inside
them), you will get the following pop-up menu:
Event
Pop-up
Menu
If you click on an Event button, you will get the following pop-up menu:
New Event - Brings up a menu of Event types. This is the same menu that appears when
you click the New Event button on the toolbar.
Properties - Brings up the State Properties dialog for the selected state.
Specify Action(s) - opens a sub-menu with the following options:
•
Trigger - Triggers end of recording. Recording continues until post-trigger
buffer is expended. Buffer settings are controlled by the Recording Options General page.
•
Filter Out - Excludes selected traffic from recording. Filtering preserves
recording memory, thereby extending recording sessions and excluding
events of little interest.
•
Advance the Sequence - Appears only in Sequence Cells and is used to
create event sequences. Tells the analyzer to look for the next event in the
sequence.
•
Filter In - Includes selected traffic in recording.
•
External Trigger Pulse HIGH - Sends an output signal with a Pulse High
format through the output ports on the back of the CATC 10K. Pulse High is
the default format. Pulse High causes the analyzer to transmit a 5 volt, 40
nanosecond signal.
•
External Trigger Pulse LOW - Sends an output signal with a Pulse Low
format through the output ports on the back of the CATC 10K. Pulse Low
causes the analyzer to transmit a 0 volt, 40 nanosecond signal.
•
External Trigger Pulse TOGGLE -This format causes the analyzer to
transmit a signal that will toggle with each trigger event between a
continuous 5 volt signal and a continuous 0 volt signal.
Add Counter - Displays the Event Properties dialog with the Counter selected and ready
to accept the count value. The menu item is not shown if the counter is not applicable to
the selected event. If the counter is already specified this menu item is replaced with
Don’t Use Counter and Change Counter Value.
Move Event To - Moves selected event to a different position in the Recording Rules
window.
Copy Event To - Copies selected event to a different position in the Recording Rules
window.
Delete this Event - Deletes the selected Event. Alternatively, you can use the Delete
button on the toolbar or keyboard to delete events.
Properties - Opens a dialog box and lets you specify further sub-types (for example,
types of errors) and additional conditions for the selected event.
56
LeCroy Corporation
SATASuite User Manual
Action
Pop-up
Menu
Version 6.25
If you click on an Action button, you will get the following pop-up menu:
Trigger - Sets or clears Trigger action.
Filter In - Sets or clears Filter In action. This option precludes the use of Filter Out.
Global State Cell.
Action menu for event in
Actions menu for event in
Sequence cell.
Filter Out - Sets or clears the Filter Out action. This option precludes the use of Filter In.
LeCroy Corporation
57
Version 6.25
SATASuite User Manual
Restart All - Restarts any sequences or counts you may have set on other buttons. The
example on the right illustrates how the Restart All action works. This example reads
"Look for a sequence of five SSP Frames and then trigger. If, however, an Error occurs
any time before the fifth SSP frame has occurred, restart the count".
Restart example. In this configuration,
SATracer will restart its search for a
sequence of 5 SSP frames if an error is
encountered.
Second restart example. In this
configuration, SATracer will restart
its search for the above sequence of
events if a SCSI command is found.
External Trigger Pulse HIGH, Pulse LOW, Pulse TOGGLE - Causes the event send an
external signal out through the External Out port on the back of the CATC 10K. The
shape of the signal (Pulse HIGH, Pulse LOW or Pulse TOGGLE) must be the same for
all events sending out such signal. This means that if you change the output signal for
one event, it will automatically change the signal for all other events sending output
signals.
Properties - Displays the Action Properties dialog for the selected state.
58
LeCroy Corporation
SATASuite User Manual
Version 6.25
New Events Menu
To add new Event buttons to the Available Events area, click the New Events button. A
menu opens with the following categories:
•
•
•
•
•
•
•
•
LeCroy Corporation
Primitives
FIS
ATA Commands
Data Pattern
Bus Conditions and OOB Signals
Errors
Breakout Board Data
Timer
59
Version 6.25
SATASuite User Manual
Types of Properties Dialog Boxes
Each cell and button has a properties dialog box that allows refinement of the options
being set.
Properties dialog boxes can be opened by:
•
•
•
Double-clicking a button or cell.
Right-clicking a button and selecting Properties from the pop-up menu.
Clicking the Properties button
on the toolbar.
Properties dialog boxes exist for all items in the Recording Rules page: the event
buttons, action buttons, Global State cell and Sequence cells.
Properties
Properties Dialog boxes share several features: an Icon preview, a Label Icon, Channel
Dialog Box - Settings, Negation, Counter, a Pin button and a Descriptive String.
General
Features
Icon Preview - The Icon Preview shows what the button currently looks like. If you make
changes to the Channel settings or the Icon Label, these changes will immediately
display in the Preview.
Icon Label - A text box for labeling the button. Whatever is typed here will appear on the
button.
Channels - These controls allow you to select the channel(s) that the analyzer should
search when it is looking for the event.
Counter - A counter tells the analyzer to search for x instances of the selected event. For
example, if you enter "10," the analyzer will count 10 instances of the selected event
before it performs whatever action you assign. There are only two counts available in the
hardware so if you try to assign more than two, you will get a warning.
Note:
Counters can not be applied to events with Filter Actions. The maximum
counter value is 65,535.
Negation - Tells the hardware to match the opposite of the event. For example, if you
select NOT for Errors Event, the match will occur on Error types that are not checked. If
you select NOT for a SCSI command, the match will occur on any FCP_CMND except
for the selected one, and also on the selected one if the additional parameters do not
match.
60
LeCroy Corporation
SATASuite User Manual
Version 6.25
Pin Button - Allows you to "pin" the Properties dialog box to the application so that it does
not go away when another object appears such as an event, state or action.
Description String - This area contains a textual description of the event.
Specific Event Settings - The largest part of the Event Properties dialog box. By
selecting one or more events from the list, you narrow the range of events for which the
analyzer searches.
The options presented in this area vary depending on the selected event. There are three
basic formats:
•
•
•
Checkboxes
List
Pattern Editor
Checkboxes and Lists present options for you to select from. Selecting one or more
option tells the analyzer which event(s) the analyzer should search for. Examples are
shown below:
The Pattern Editor, on the other hand, presents a series of text boxes in which you can
enter a data pattern (in 8 bit codes) that the analyzer can use as a trigger pattern search.
LeCroy Corporation
61
Version 6.25
SATASuite User Manual
The Pattern Editor has two components: the text boxes themselves, in which a pattern
can be entered, and pull-down menus. Pull-down menus are available for some fields.
By clicking on any field header, users will either be presented with a drop down menu
(below) or they can enter values in decimal or hex and the string will be converted to
binary after clicking on a different field.
Actions Tab - The Actions tab opens a page of options for setting triggers and other
actions on the selected events.
62
LeCroy Corporation
SATASuite User Manual
Version 6.25
Event Properties Dialog Boxes - Descriptions
Each Event button has a different Properties dialog box and each Properties dialog box
has a different set of options.
This section describes the Event Properties dialog boxes and their options.
To see a menu of events, click the New Events button. The events are:
Category
Event
Primitives
Primitive Categories
Primitives
Frames
Open Address Frames
Identify Address Frames
SSP Frames
SMP Frames
SCSI Commands
SCSI Primary Command set
SCSI Block Command set
SCSI Media Changer Command set
SCSI Stream Command set
SATA FIS
Register Host to Device
Register Device to Host
Set Device Bits
DMA Activate
DMA Setup
BIST Activate
PID Setup
DataRoute
Vend FIS: 0xFF
ATA Commands
All ATA commands
ATAPI Commands
All ATAPI 6/7 commands
SSP Header Fields
Command
Data
Response
Task
Vendor
Reserved
SSP Information Units
Command
Data
Response
Task
SMP Request/Response
SMP Request
SMP Response
Errors
Breakout Board Data
Timer
Bus Conditions and OOB
Signals
The descriptions below follow the order of events listed in the table above.
LeCroy Corporation
63
Version 6.25
SATASuite User Manual
Primitives
There are two types of primitive events: Primitive Categories and Primitives.
Primitive
Categories
Properties
Dialog
Presents options for triggering or filtering on various Primitive categories. If NOT is
checked, any unchecked primitive category will generate an event match.
Primitives
Properties
Dialog
Presents a menu of Primitive types. If NOT is checked, any unchecked primitive will
generate an event match.
64
LeCroy Corporation
SATASuite User Manual
Version 6.25
SATA FIS
There are ten SATA FISs that can be selected from the New Events menu: Register Host
to Device, Register Device to Host, Set Device Bits, DMA Setup, BIST Activate, PIO
Setup, Data, Route, and Vend FIS: 0xFF.
The Properties dialogs for these FISs are similar to one another. They display data fields
for entering data patterns on a bit-by-bit basis. Entering a data pattern tells the analyzer
to search for the specified pattern. If NOT is checked, any pattern other than the one
specified will generate an event match. The Properties dialog below is for Register Host
to Device.
Note that some of the data fields have drop-down menus. To see which fields have
menus, position your mouse pointer over the blue field headings. If the pointer changes
into a hand, then the heading will present a menu if it is clicked.
LeCroy Corporation
65
Version 6.25
SATASuite User Manual
ATA Commands
ATA Commands are presented in a single dialog box.
ATA
Commands
Properties
Dialog
Presents several options:
Commands - Presents a long list of ATA Commands. Selecting a command will cause
the analyzer to search for the selected command.
Features - A text box for entering a value.
Sector Count - A text box for entering a Sector Count value.
LBA Mode - Select the radio button, then enter a value.
Sector/Cylinder/Dev/Head Mode - Select the radio button, then enter values into the
text boxes.
If NOT is checked, any unchecked primitive will generate an event match.
66
LeCroy Corporation
SATASuite User Manual
Version 6.25
ATAPI Commands
Individual ATAPI 6/7 commands can be selected as a trigger event. Resource limitations
restrict ATAPI triggering to a single channel and to a single ATAPI event.
ATAPI
Command
Properties
Dialog
To specify ATAPI commands as the recording event, select the command using the
Operation Code or Command name. Additional ATAPI parameters can be specified by
entering bit-level pattern in binary or decimal including LUN, transfer length and LBA.
Bus Conditions and OOB Signals
Bus Conditions and Out of Band Signals are presented in a single dialog box.
Bus
Conditions
and OOB
Signals
LeCroy Corporation
Select from the check boxes to specify the type of Bus Condition or OOB Signal that you
want the analyzer to search for.
If NOT is checked, any unchecked primitive will generate an event match.
67
Version 6.25
SATASuite User Manual
Errors
Errors are presented in a single dialog box.
Errors
Properties
Dialog
Select from the checkboxes to specify the type(s) of errors you want the analyzer to
search for. If NOT is checked, any unchecked primitive will generate an event match.
Breakout Board Data
Breakout board data are entered into a single dialog box.
Breakout
Board Data
Properties
Dialog
68
The Breakout Board Data properties dialog box lets you specify a bit pattern from a
breakout board that can be used for triggering. If NOT is checked, an event match will
be created for any pattern other than the one specified.
LeCroy Corporation
SATASuite User Manual
Version 6.25
State Properties Dialog
The State Properties dialog allows you to specify the Global state’s caption. To access
this dialog box, click in the Global State Cell (but not on an Event button).
Timer
Properties
Dialog
LeCroy Corporation
Specify the value for the timer in seconds, milliseconds, microseconds, and
nanoseconds. The actual timer value is shown below the edit controls and reflects the
hardware precision capabilities. The time is rounded up to the next 7.519 nanosecond
sample, which corresponds to the 1.33 MHz internal clock frequency.
69
Version 6.25
SATASuite User Manual
Actions Tab in the Properties Dialog
The Actions tab at the top of Event Properties dialog boxes lets you set the type of action
that the analyzer will perform once an event has been found.
Assigning Actions
As shown above, you can double-click an Event or Action button to open the Properties
dialog box, and then select the Actions tab. You can then select an action from one of
the options.
The assigned action will be represented by a button to the right of the
Event button.
You can also assign an action by right-clicking on an Event or Action
button and selecting an action from the pop-up menu.
70
LeCroy Corporation
SATASuite User Manual
Version 6.25
The following table shows the types of Actions you can select.
LeCroy Corporation
Action
Comment
TRIGGER
Triggers the end of the recording.
The end point of the recording is
determined by the buffer settings in
the Recording Options General
page.
FILTER OUT
Filters traffic in or out of the
recording - thereby conserving
recording buffer space.
FILTER IN
Can not be assigned to the events
with Counters.
RESTART ALL
Reinitializes counters.
71
Version 6.25
SATASuite User Manual
Setting Conditions: The Role of the Global State Cell
The Global State cell is the arena in which you
create triggering and/or filtering conditions.
The cell is called the Global State cell because
the conditions you create are active at all
times. You can think of these conditions as the
default conditions. You use the Global State
cell to create simple condition such as "Trigger when you see an xxx error," or "filter out
all xyz primitives."
Example - Creating a Simple Event Trigger
To create a simple condition that is active at all times, place an event button in the Global
State cell:
Step 1 Click the New Event button. An Events
menu opens (shown right).
Step 2 Select an event from the menu. The
event will appear as a button in the
Available Events area on the left.
Step 3 Drag the event button to the cell
marked "Global State."
Step 4 Right-click on the button (i.e., not the
Global State cell). A pop-up menu
appears.
Step 5 Select Trigger from the menu. An
arrow will project from the error button
and point to a cell marked Trigger.
72
LeCroy Corporation
SATASuite User Manual
Version 6.25
Creating Multiple Event Conditions in the Global State Cell
When multiple buttons are placed in the Global Cell, it creates an "AND" condition or an
"OR" condition depending on the actions selected.
Creating an OR Condition - When two or more buttons in the Global State cell are
assigned the same action, the analyzer will search for all of the events and perform the
action on which ever event it sees first. The example below illustrates. It reads "Trigger
if an error or a primitive occurs".
Creating an AND Condition - When multiple events are placed in the Global State cell
and assigned different actions, an AND statement is created. The example below reads
"Trigger if an error occurs AND filter out any primitives that occur."
Filter In and
Filter Out
A filter causes the analyzer to filter in or out specified events from the recording. If events
are filtered out of the recording, they are excluded and not simply hidden from the trace.
The purpose of filtering is to preserve recording memory so you can conduct longer
recording sessions and exclude events that do not interest you.
To Filter In or Out traffic,
Step 1 Click the New Event button. The New Event menu opens.
Step 2 Select an event from the menu.
Step 3 Drag the event into the Global State cell.
Step 4 Right-click on the button. A pop-up menu opens.
Step 5 Select Specify Action(s)
Step 6 Select Filter Out (for example).
The analyzer is now configured to filter out the selected event.
LeCroy Corporation
73
Version 6.25
SATASuite User Manual
Filter In or
Out
Everything
The options Filter Out Everything or Filter In Everything allow you to filter all traffic in
or out of the trace. These options are intended for a future release to allow you to
selectively exclude and include traffic from a recording.
Counting
Events
In addition to setting triggers and filters, you can also set counters. A counter is an action
that allows you to set a trigger based on a count of events. For example, you could use
a counter to "Trigger following the 16th occurrence of an error."
To use a counter, follow these steps:
Step 1 Select an event from the Select Event menu and drag it to the Global
State Cell in the center of the dialog box.
Step 2 Click the small channel buttons on the selected Event button to select
the channels for the actions.
Step 3 Right-click the event and select Add Counter. A dialog box opens.
Step 4 In the text box to the right of the label Count enter a value.
Step 5 Make sure the checkbox to the left of the label Count is checked.
Step 6 Click the X in the top right corner of the dialog box to close the dialog. A
counter button should appear below your selected event.
74
LeCroy Corporation
SATASuite User Manual
Version 6.25
Creating Event Sequences
Event sequences are chains of events leading to some action. A sequence is a
multi-event "if, then" condition: "If x followed by y followed by z occurs, trigger." Event
sequences are created by dragging two or more buttons into the Sequence cell. The
Sequence cell is a faintly marked cell just below the Global State cell. The Sequence cell
contains the text Drag an event here to add a new sequence.
Note:
States
Event sequences can only be created in the Sequence cell. You cannot
create a sequence in the Global State cell.
Sequences are made up of cells called States. A state is a stage within a sequence that
specifies what events the analyzer should look for and what actions to apply when the
event occurs.
In the example below, the Sequence is composed of two states. The maximum number
of states a sequence can support is 255.
The foregoing example reads: "Trigger if you see a Primitive followed by an error."
LeCroy Corporation
75
Version 6.25
How to
Create an
Event
Sequence
SATASuite User Manual
To create an event sequence, you drag event buttons to the Sequence cell, link them
with the action Advance the Sequence, then apply a trigger or other action to the end of
the chain. The following steps illustrate how to create an event sequence.
Step 1 Click the New Event button. The New Event menu opens.
Step 2 Select an event type from the menu, for example an error. A button
appears in the Available Events area.
Step 3 Click the New Event button and select a second event type, for example
a Primitive. At this point, you should see two buttons in the Available
Events area.
Step 4 Drag the first button to the cell marked "Drag an event here to create a
sequence." When you finish, notice how two new cells appear in the
window as shown below the cell where you placed your button.
Step 5 Double-click on the button. A Properties dialog box opens.
Step 6 Select desired options from the dialog box, for example an error
sub-type. The options apply immediately.
76
LeCroy Corporation
SATASuite User Manual
Version 6.25
Step 7 Close the Properties dialog box by clicking the X in the top right corner.
The Properties dialog box closes.
Step 8 Drag the second event button to the cell immediately below the cell
occupied by your first event button. Note that an additional cell appears
marked "Drag an event here to add a sequence."
Step 9 Right-click on the first event button. A pop-up menu appears.
Note:
Be sure to click on the button itself and not the cell. If you click the cell,
you will get a different menu with fewer options.
Step 10 Select Specify Actions. Notice
how this menu differs slightly from
the menu shown earlier in this
chapter. You will see three
options for advancing or restarting
a sequence:
•
Advance the Sequence - Draws an
arrow that connects the selected
event button to the event button
below it. This option creates a
sequence.
•
Restart the Sequence - (Not visible in the menu above.) This option restarts
the entire sequence. This option appears once you have linked two or more
buttons in a sequence. This option draws an arrow upward from the selected
event button to the beginning of the sequence.
•
Restart All - Restart all sequences and counts. This option creates an arrow
pointing a cell marked "Restart All."
Step 11 Select Advance the Sequence. An arrow will appear that connects
the first button to the second.
Step 12 Right-click the second button and select Specify Actions. A
sub-menu appears.
LeCroy Corporation
77
Version 6.25
SATASuite User Manual
Step 13 Select Trigger. A cell will appear to the right of the second button
saying "Trigger." Your sequence configuration is now complete and
should look like this:
Using a
Timer
Timers let you set a time-delay for a trigger or other action. The following example
illustrates how timers work.
This example reads "Look for a Primitive. When you see one, wait three seconds then
trigger."
To create the example shown above, perform the following steps:
Step 1 Click the New Event button to open the Event menu.
Step 2 Select an event such as Primitive from the menu. An event button
appears in the Available Events area.
Step 3 Drag the event button into a Sequence cell marked "Drag an event here
to add another state." Once the button is added, the cell turns blue and
acquires a title like "Sequence 1, State 1." Below the cell, a new cell
appears marked "Drag an event here to add another state."
Step 4 Click the New Events button. The Events menu opens.
Step 5 Select Timer. A Timer button appears in the Available Events list.
Step 6 Drag the Timer Button to the cell marked "Drag an event here to add
another state." The cell turns blue and acquires a title like "Sequence
1, State 2."
Step 7 To link the two events into a sequence, right-click on the first event (in
our example, the Primitive event button). Be sure to click on the event
button and not on the cell. A pop-up menu appears.
78
LeCroy Corporation
SATASuite User Manual
Version 6.25
Step 8 Select Specify Action(s). A sub-menu opens.
Step 9 Select Advance the Sequence. The menu closes and an arrow
appears that connects this cell to the State cell below.
Step 10 Right-click on the Timer button. A pop-up menu appears.
Step 11 Select Specify Action(s). A sub-menu opens.
Step 12 Select Trigger. The menu closes and an arrow appears that connects
the Timer button to a new cell to the right marked Trigger.
Step 13 To set the duration of the Timer, double-click on the Timer button. A
dialog box appears.
Step 14 Enter a time value in the boxes.
Step 15 Click the x to close the dialog box. The timer is now set.
LeCroy Corporation
79
Version 6.25
SATASuite User Manual
Sequential Events and Timers
The recording option above shows an example of using a Loop and Timer to trigger on
Open Timeout violation. This reads "Wait for an OPEN ADDRESS on I1; If OPEN
ACCEPT or an OPEN REJECT occurs on T1 within 1ms, restart the loop; ELSE IF 1 ms
elapses (without detecting an OPEN ACCEPT or an OPEN REJECT on T1) then trigger
the analyzer".
80
LeCroy Corporation
SATASuite User Manual
Version 6.25
Recording Options - Channels
The Channels page allows the channel names to be customized. To change a channel
name, select the channel, then click the edit button and enter the new text, then click OK.
Once the options are set, the analyzer will update the open trace and all future traces with
the new channel names.
Note:
Where
Custom
Channel
Names
Appear
LeCroy Corporation
You can also change channel names by clicking on the first cell of a
trace (the channel cell) and selecting Rename Channel from the
pop-up menu.
Custom channel names appear in three places:
•
•
•
The trace itself
Link Tracker window
Bus Usage window
81
Version 6.25
SATASuite User Manual
Custom Channel Names in the Trace - Custom channel names do not appear right
away in the trace: the original names continue to display. To see the custom channel
names, click in the first cell of the trace (the channel cell) and select Format from the
pop-up menu, then select Custom.
The custom names will then appear in the trace.
Channel I2 renamed as Init_2.
Custom Channel Names in the Link Tracker Window - The Link Tracker window will
automatically show custom channel names as soon as they have been customized.
82
LeCroy Corporation
SATASuite User Manual
Version 6.25
Custom Channel Names in the Bus Usage Window - Custom Channel names
automatically appear in the Bus Usage window as soon as they have been customized.
The easiest way to see this is to open the Bus Usage window and then to open the
Properties dialog for the window. It will list the custom channel names.
To open the properties dialog box for the Bus Usage window, right-click in the window,
then choose Properties from the pop-up menu.
LeCroy Corporation
83
Version 6.25
84
SATASuite User Manual
LeCroy Corporation
SATASuite User Manual
Version 6.25
Chapter 5: Display Options
Use the Display Options menu to specify the way data file information is displayed.
From the Setup menu, select Display Options.
LeCroy Corporation
85
Version 6.25
SATASuite User Manual
General Display Options
Use the General Display Options to specify the basic appearance of a view.
•
Zoom Level: Adjustable in discrete increments from 10% to 200%
percent.
•
Enable Tips: Select to enable Tool Tips with explanation text to pop up
when you position your cursor over various fields in the Trace View.
•
Wrap: Causes packets to wrap within the window if their length exceeds
the width of the window.
•
Hierarchy Lines: Adds faint lines (shown
right) to the left side of the trace showing the
hierarchical relationship of the Frames,
Transactions etc within the trace. When this
option is enabled, the lines display any time
you cascade higher level decodes.
•
Right click cell context menu: Activates
the right mouse button for opening cell
context menus.
•
Timestamp At The Beginning: Moves the timestamp from the end of
the Frame to near the beginning.
•
Trace Viewing Level: Allows you to select the hierarchical level at
which traffic is displayed.
•
Display Configuration Name: Comment field associated with the *.opt
file containing the current Display Options values. You can also create
and store your unique Display Options for future use.
To create a new Display Options file, follow these steps:
Step 1 Enter a comment for the new file in the Display Configuration
Name field.
Step 2 Click Save...
Step 3 Specify a filename (*.opt).
Step 4 Click Save.
86
LeCroy Corporation
SATASuite User Manual
Version 6.25
Setting Color, Formatting, and Hiding Options
Click the Color/Format/Hiding tab on the Display Options screen.
Use this window to customize the colors and formats associated with each field in the
Trace view. You can also use this window to hide fields within the trace.
Setting
Color
Display
Options
To change the colors of elements in the trace, select an item in the Group and Color
column and use the color pallet screen on the right to make the desired changes.
Note:
The color of an Invalid Data (packet error) field cannot be changed;
it is permanently set to red.
Use this window to customize the colors associated with each field in the trace. You can
experiment with these options to achieve the color combination best suited to a particular
graphic system.
LeCroy Corporation
87
Version 6.25
SATASuite User Manual
You can also customize the colors by using the options in the Custom tab.
Changing
Field
Formats
To change field formats, select an item under the Group and Color column. This action
will enable the formats radio buttons on the right. The format types change with respect
to the item selected under the Group and Color column. For example, if Display Units is
selected, the following displays:
The following formats are available:
Note:
88
Not every format is available for every item.
LeCroy Corporation
SATASuite User Manual
Hiding
Display
Options
Version 6.25
To hide one or more fields in the trace, select the appropriate item
from the Group and color column, click the checkbox marked Hidden,
and click the Save button.
You can also hide Frames from a trace by selecting the desired options from the
checkboxes.
Level Hiding Options
The Level Hiding tab allows you to hide various types of traffic. To hide traffic, select one
or more items from the Events Group list and from the list on the right, then click OK.
LeCroy Corporation
89
Version 6.25
SATASuite User Manual
Saving Display Options
To complete your display options settings, use the features at the bottom of the Display
Options window. These features remain the same no matter which of the four Display
Options windows you are working in.
90
•
Click Save to save the currently specified display options for use in
future sessions. Any file name can be specified, but you must use the
.opt extension. If no extension is specified, .opt is added by default.
•
Click Load to load a previously saved *.opt file, thus restoring a
previous set of display options.
•
The Save as Default function is equivalent to the Save function,
specifying the file name default.opt. Whenever you start up the
Analyzer, it automatically loads the default.opt file if one exists.
•
Click OK to apply any changes you have made to Display Options and
close this dialog box.
•
Click Cancel to cancel any immediate changes you have made and exit
the Display Options menu.
•
Click Apply to apply your changes while keeping the Display Options
window open.
LeCroy Corporation
SATASuite User Manual
Version 6.25
Chapter 6: Reading a Recording
Recording View Features
SATASuite viewing software displays make extensive use of color and graphics to fully
document the captured traffic. Frames (for SATracer files) or commands (for SATracker
files) are shown on separate time-stamped rows, with their individual fields both labeled
and color coded. Data fields can be collapsed to occupy minimal space in the display
(which can in turn be zoomed in and out to optimize screen utilization). Pop-up Tool Tips
annotate Frame fields with detailed information about their contents.
The display software can operate independent of the hardware and so can function as a
stand-alone Viewer that may be freely distributed.
Frame, FIS, ATA Command and OOB Views
The default display mode for recorded traces is Frame view. The trace can also be
viewed in FIS, ATA Application Layer and OOB views.
Changing Display Levels
To switch between the Frame, FIA, ATA Command and
OOB application views, click the respective buttons on the
Tool Bar.
LeCroy Corporation
91
Version 6.25
SATASuite User Manual
Frame Layer
Frame Level view is the default decode level. Frame Level view displays traffic as shown
below:
FIS Layer
When you click the FIS button, the FIS Layer traffic is decoded and presented as shown
below. To see FIS Layer transactions, you may need to scroll through the trace or use
the Find command (under Search).
ATA Application Layer
When you click the ATA button, ATA Application Layer traffic is decoded and presented.
You can "open" any of these decode levels to reveal the components by clicking the small
triangular in the first cell. The following is an example of an expanded Management Level
view showing its constituent Transport Layer Transactions and Frames:
You can also get additional information on fields by holding your mouse over selected
fields as shown in the following example:
92
LeCroy Corporation
SATASuite User Manual
Version 6.25
OOB (Out of Band) Signaling View
The OOB view combines OOB scenarios (establishing link, speed negotiation, etc.) into
a simplified and integrated view. These scenarios typically occur at power on and after
hardware resets as devices initialize and initiate communications.
The trace view below shows the default trace display as a target and host attempt to
initiate communication. The target powers on first, and starts sending COMINIT
repeatedly (in fact, in this example, over 1400 times). When the initiator powers on it also
sends COMINIT and then (in this example, which uses SAS devices) both devices
immediately respond with COMSAS to identify themselves as SAS devices. and then
proceed to speed negotiation. [For SATA devices, no COMSAS OOB will be seen.]
Clicking on the "OOB" button simplifies this long stream of OOB signals into a higher level
summary, as follows:
LeCroy Corporation
93
Version 6.25
SATASuite User Manual
As with other views, you can get additional information on the event by holding your
mouse over selected fields or you can "open" any decode level to reveal the components
by clicking the small triangle in the upper left corner of the cell.
Opening the decode levels will first bring you to a list of all OOB signals, and further
opening the COMINIT events will show the actual times of the traffic bursts that comprise
the COMINIT, as shown below.
This example shows the power of the SATASuite software in being able to summarize
details at a very high level, while allowing the user to easily "drill down" into the details
that comprise each displayed event to find more and more detail on events of interest.
94
LeCroy Corporation
SATASuite User Manual
Version 6.25
Setting Hierarchical View Level Using the Display Options Window
You can also set the hierarchical view by selecting checkboxes in the Trace Viewing
Level Options in the Display Options window.
LeCroy Corporation
95
Version 6.25
SATASuite User Manual
View Raw Bits
SATracer allows you to view low-level 8B/10B values for SATA traffic. You can expand a
specific Frame to view the raw bits by right clicking on the Frame number and selecting
Show Raw Bits.
To view Raw Bits, follow these steps:
Step 1 Click on the first cell of a Frame.
Note:
Raw Bits can be viewed only in Frames.
Step 2 Select Show Raw 10b Codes.
The data 8b and 10b field can be displayed in several formats, as
shown below.
Data Appearance - To change the format of the data, select from following options:
•
•
96
8b - Click the column heading to show hexadecimal values.
10b - Click the column heading to show hexadecimal values.
LeCroy Corporation
SATASuite User Manual
Version 6.25
Navigation - To move to the previous or next packet in the trace, click one of the two
buttons at the bottom of the window:
•
•
Prev - Displays data for the previous Frame in the trace.
Next - Moves to the next Frame in the trace.
Running Disparity Error - If SATracer detects Running Disparity Errors it will display in
red and have exclamation marks before and after the value.
The 8-bit codes change to 10-bit codes before they get transmitted.
Running
Disparity
Running Disparity is a binary parameter with either the value negative (-) or the value
positive (+). After receiving any encoded character, the receiver shall determine whether
the encoded character is valid using the running disparity parameter as a checksum. The
receiver will then calculate a new value that is either the opposite of the previous
character or neutral. The ability to view changes in Running Disparity polarity is an
important part of the debug process. The raw bits view displays the running disparity of
the 10bit code in the column following the raw bits.
Expanding and Collapsing Fields
Many of the fields shown in each display may be expanded (to display additional detail)
or collapsed (to reduce extraneous information) with a single click. Fields which allow
expansion or collapse are indicated by a small solid white triangle located in the upper
left corner of the field, as shown below:
>>expands to>>
As an example, if the Transport Layer is selected, typically individual frames are
collapsed into Transactions, as shown in the example below. If you wish to see further
detail about any specific transaction, simply click the white triangle next to any
Transaction number, and the Frames which compose that Transaction are displayed.
>>expands to>>
LeCroy Corporation
97
Version 6.25
SATASuite User Manual
Expanding a You can expand a Data Payload field to view it in greater detail or collapse it when you
Data
want a more compact view. SATASuite allows you to expand and collapse the data
Payload
payload information in four ways:
•
Clicking the small triangular arrows on the left side of the data payload
field
•
Clicking and holding down the mouse button on the triangular button on
the left side of a data payload field. This action will expand or collapse
data fields for all Frames throughout the trace
•
Double-clicking anywhere in the payload field
•
Clicking in the data payload field and selecting Expand/Collapse Data
in the pull-down menu.
When you select "Expand Data," only the first 100 dwords are shown. To view all of the
dwords, select "View Data Block."
This section describes expanding or collapsing data payload by using the menu:
Step 1 In the Serial ATA trace, click in a Data Payload box.
Step 2 In the Data Field menu, select Expand Data.
The Data Payload box expands to show more detailed description of
the data:
To collapse data, follow the same steps described above, and select
Collapse Data.
You can also expand or collapse all data payload fields within a trace by
using the above menu.
98
LeCroy Corporation
SATASuite User Manual
Version 6.25
View Data Block Window
The View Data Block command opens a dialog box that lets you display and navigate the
data within Frames and Transport Layer transactions. This dialog box gives you several
format choices for the data: binary, hexadecimal, ASCII and decimal. It also gives you
the ability to navigate through data fields within different Frames and Transport Layer
transactions.
To access the View Data Block window,
Step 1 Decode to the level of interest by pressing
or
.
Step 2 Locate a Frame or Transport Layer transaction with a data field
such as the one shown below:
Step 3 Click in the Data field to open a pop-up menu.
Step 4 Choose View Data Block from the menu. The View Data Block
window opens.
Description The View Data Block window (henceforth called the View window) displays the raw data
of View Data for the selected Data field. Data is displayed in up to four formats, a column per format.
Block
The window has several options for navigating through Data blocks.
Window
Save. Saves the currently displayed data block into a text file.
Previous and Next. These buttons cause the View window to
jump to the next Frame that has a data block and display that
data block.
Data Format Display. Creates a column for the specified data
format and then displays the currently selected data block in
that format.
MSB/LSB Format. Begins the data string with the Most
Significant Bit (MSB) or Least Significant Bit (LSB).
Format Line. Opens a dialog box for setting DWORD length.
The default is 4 dwords.
Synchronize Options. Configures the mouse's scrolling
behavior within the View window.
LeCroy Corporation
99
Version 6.25
SATASuite User Manual
The menu presents three scrolling options:
•
Update only on request - Locks whatever data block currently is on display
in the Data window unless overridden by a direct request. There are two ways
to make a request -- by clicking on the buttons or by right-clicking in the trace
on a data block and selecting View Data Block from the pop-up menu.
•
Update on click - Repositions the Data window to whatever data block you
click on in the trace window.
•
Update on scroll - Synchronizes trace scrolling with the Data window. As
you scroll the trace, the Data window will reposition to show the data block for
the Frame at the top of the trace window.
Scroll to Offset. Repositions the Data window to whatever offset you
enter in the Offset box. You can enter an offset value in decimal or
hexadecimal.
Incomplete Frames Handling and Display
If SATracer captures a frame that was not transmitted properly according to the protocol,
it records the frame as an Incomplete Frame. This includes STP(SATA) frames without
Start Of Frame and/or End Of Frame, or frames with shorter payload that is dictated by
the protocol.
The Incomplete frames are marked specifically in the Trace View. Here are some
examples of Incomplete Frames display:
Incomplete Address frames
Incomplete SATA frame
100
LeCroy Corporation
SATASuite User Manual
Version 6.25
When incomplete frames are displayed, no field decoding takes place, only the raw
payload recorded for the incomplete frame is presented. However, in the Link Tracker
some field decoding can be performed, if possible (part of the frame header is received
intact). Here are some examples:
Link Tracker shows some decoded fields for incomplete Identify Address
frame
Link Tracker shows some decoded fields for incomplete SMP frame
LeCroy Corporation
101
Version 6.25
SATASuite User Manual
Split Frames Some frames - mostly STP (SATA) - can take a very long time on the bus. For SATA
frames it happens when Host and target go into long Hold periods while writing or reading
the data. In this case it is not viable for SATracer to record the whole traffic sequence as
one frame, and the Split Frame approach is used. The long frame is broken into a
sequence of smaller frames, which are marked as Starting frame, zero or more Middle
frames and an Ending frame. This is highlighted in the Trace View like this:
A frame transmitted by SATA initiator is split into three frames.
SATA frames both on Transmitter and Receiver sides are split
The frames that are split get assembled together at the Transport level of
decoding/display. For example:
102
LeCroy Corporation
SATASuite User Manual
Version 6.25
In the example above, although SATA frames both on Transmitter and Receiver sides are
split, they are assembled together in the Transport Layer transaction. The payload, that
was split into 6564 and 1632 bytes is assembled together in one 8192 bytes buffer.
Compact View
Some traces contain field headers which repeat from line-to-line (frame-to-frame) even if
the content of the fields are changing. The repeated display of the same header
information can occupy space on the screen that would be more useful if presented in a
tabular form.
The compact view provides a means of condensing repeating header information into
one line of headers, with the data arranged below in "spreadsheet" fashion. Compact
view automatically condenses repeating headers, but when the next header that is
different appears it will be shown as a new header.
Compact view can be selected in any of the following ways:
•
•
•
From the View Menu, select Compact.
Use the Ctrl-Q keyboard shortcut.
With the mouse pointer positoned over the display area, right-click the mouse
and select "Compact" for the menu that displays.
To change back, repeat either the menu selection or the keyboard shortcut.
The following screens illustrate the use of compact view mode. In the screen below
(shown in normal view), the same header information repeats for each frame:
LeCroy Corporation
103
Version 6.25
SATASuite User Manual
When View>Compact (or Ctrl-Q) is selected, the trace file is now shown as follows, which
allow far more data to be displayed in the same screen:
104
LeCroy Corporation
SATASuite User Manual
Version 6.25
Note that the occurance of just one frame in the display with a different header ("Idle"
instead of "Time Delta") results in the header row being redisplayed.
LeCroy Corporation
105
Version 6.25
SATASuite User Manual
Export Options
Trace data captured by SATracer can be exported for other uses, including uses outside
the system. These options are accessed through the File menu by selecting Export, as
shown below.
There are four export options supported. The data fields which will be present in the
exported files are determined by the current screen view. Please select the appropriate
data fields before exporting the data to ensure that the correct information is present in
the exported file.
106
LeCroy Corporation
SATASuite User Manual
Packets to
Text (Packet
View
Format)
Version 6.25
This option is used to create a text version of the trace (e.g., for use when emailing a trace
section). Selecting this option brings up a screen to allow you to define the range of
events that you want to include in the text file. The range can be defined by frame
number, by markers, or by time.
Define the range of events (by frames, markers or time) that you would like in the
exported file and click "OK". A screen will appear for you to provide a filename for the
exported file, and allow you to navigate to the folder where you wish to store the file. The
exported file will have a ".txt" extension.
Export to
Generator
File Format
A feature of the SATrainer is the ability to use a trace captured by the SATracer as the
basis for traffic to be generated by the SATrainer. In order to use this feature, the
captured trace must first be exported by using the "Export to Generator File Format"
command. See Generating Traffic on page 154 for a discussion on how to use this
feature with the SATrainer.
Packets to
EAS Format
This option creates EAS files based on the open trace. Selecting this option will bring up
a screen allowing you to name the files and navigate to the folder that you would like to
store the files. There are three files created, one file with a ".ecs" extension and two files
(one for each channel) with a ".eas" extention. The ".eas" files will have "_000_ch1" and
"_000_ch2" appended to the file name you provided.
Export to
CSV Format
Many users might wish to have the trace data exported into a formatted file (e.g., for
import into databases or spreadsheet programs such as Microsoft Excel). The "Transport
to CSV Format" option provides a means of generating a structured file from trace data
captured by SATracer.
Selecting this option will bring up a screen allowing the user to specify the information
from the current file to be exported and the destination file for the exported data.
LeCroy Corporation
107
Version 6.25
SATASuite User Manual
Select the destination folder and enter the destination filename for the exported data.
Select the layer to export (either Transport or ATA Application Layer). Indicate whether
you would like hidden packets to be included in the exported file or just displayed packets.
Define the range of events (by frames, markers or time) that you would like in the
exported file and click "Save".
The exported file will have a ".csv" extension. The first line (or record) in the .csv file will
be a header indicating the name of each variable included in the file. Each following line
(or record) will contain only data.
If opening the exported file from within Microsoft Excel, in the Open File window under
"Files of Type:" select "Text Files (....; *.csv)". When the file is opened, a spreadsheet is
shown with a large number of columns (each column representing one data type) and a
number of rows on the trace which was selected for export. A typical spreadsheet is
shown on the next page. Once opened, the file can be later saved as any supported
Excel file type.
108
LeCroy Corporation
SATASuite User Manual
LeCroy Corporation
Version 6.25
109
Version 6.25
110
SATASuite User Manual
LeCroy Corporation
SATASuite User Manual
Version 6.25
Chapter 7: Searching Recordings
SATASuite has several search commands that enable you to navigate a recording in
search of key events such as errors and triggers. These commands are launched from
the Search menu.
To view the search options, click Search in the Menu bar.
Go to Trigger
To display a Trigger Event, select Go to Trigger from the Search menu.
The Trace View is repositioned with the first Frame following the Trigger event (or the
Frame that caused the Trigger) at the top of your screen.
Go to Event ...
To display a specific Frame or higher decode level, follow these steps:
Step 1 From the Search menu, select Go to Event ...
The Go to Event window appears.
Step 2 From the Go To pull-down menus,
select Frame, Time, or Markers (if
present).
If you select Frame, a menu of
decode levels will appear.
Select the decode level of
interest (if it does not appear,
you may have to press a decode button on the toolbar). Then
enter an event number in the text box to the right.
If you select Time, a text box will appear prompting you to enter
a time value.
If you select Marker, a list of Markers in the trace will appear.
Select a Marker from the list.
Step 3 Click OK.
The trace view is repositioned with the selected item at the top of your
screen.
LeCroy Corporation
111
Version 6.25
SATASuite User Manual
Go to Marker
To instruct the Analyzer to display a marked Frame, follow these steps:
Step 1 From the Search menu, select Go to Marker.
Step 2 Select the desired Frame from the displayed list.
The Trace View is repositioned with the selected item at the top of your
screen.
Selecting Search > Go to Marker > All Markers will cause a dialog box
to open with a list of all markers in the trace. The dialog box offers
options for editing, deleting, and copying markers.
Note:
112
The Go to Marker feature functions in conjunction with the Set
Marker feature. The comments within the parentheses following
each marked Frame are added or edited with the Set Marker
feature. Please refer to Set Marker in Reading a Recording.
LeCroy Corporation
SATASuite User Manual
Version 6.25
Go To
The Go To feature takes you directly to an event in a recording by allowing you to search
by a specific criteria. Only the items present in a recording will be displayed in the Go to
menu. If an item is not present in the recording, it is greyed out in the menu.
To apply the previous Find parameters to the next search, select Find Next from the
Search menu.
LeCroy Corporation
113
Version 6.25
SATASuite User Manual
Find
Find is a utility for conducting searches of one or more events within a recording. In
SATracer trace files, Find allows you to search different hierarchical levels within the trace
- Frames, Transactions, SCSI Operations, and Mgt Transactions. To start find,
• Select Find... under Search on the Menu Bar
OR
Click
in the Tool Bar.
You see the User-Defined Find Events screen:
The Find window divides into three areas:
Left area -- Display options for setting the search level, direction and origin. The top left
box is context-sensitive. In order for the Transactions, SCSI Operations, and
Management Transactions to be active, you will need to decode these levels in the
trace.
The left area includes two options at the bottom:
•
•
Find All - Finds all specified events and extracts the results to a new window.
Search in Hidden - Searches for specified events in all of the trace including in traffic currently hidden from the display via the Hide buttons.
Center area -- Controls the event groups to be searched. The selection you make will
display further choices on the right side of the Find window. At the bottom are three
options called Union, Intersection, and Exclusion that are used with multi-criteria
searches. These options are explained below.
114
LeCroy Corporation
SATASuite User Manual
Version 6.25
Right area -- Controls the specific events to be searched within the trace. The box in this
right section displays events from the selected Event Group.
The right area is context sensitive - the Event Group selected in the Center Area
determines what types of events display on the right. For example, if "Primitive Type" is
selected, the right area will display a list of Primitive types. Bold entries indicate items that
actually occurred in the trace.
In the example shown above, Primitive Types is selected. The right side of the screen
shows all of the Primitive Types that occurred in the displayed trace.
Complex
Searches
When conducting complex searches in the Find dialog box,
you first push a decode button in the toolbar to enable
Frames, Transactions, SCSI Operations, or Management
Transactions in the Search for... box.
In this example, all of the Search for choices are enabled, and
Frames is selected. The Event Groups box in the Find dialog
contains available choices based on the selection.
After you have selected a choice in the Event
Groups, the box on the right of the Find window will
present choices based on your selection. In the
following example, the box displays the primitive
types that are available in the trace:
Event
Groups
Event Groups are categories of events that can occur in a trace. Clicking on an Event
Group will display a list of Event types on the right side of the Find window that occur
within each Event Group.
Union,
Intersection,
and
Exclusion
If multiple events are selected, use the options Union or Intersection to conduct the
search.
Union is used to search for any selected event: "Find x or y." Union lets you tell the
Analyzer to search the trace for any of any of the selected items.
Intersection is used to search for all selected events: "Find x and y." Intersection lets you
tell the Analyzer to search the trace for any packet having all of the selected events.
Exclusion is used to exclude selected traffic from the trace. Exclusion is used with Union
and Intersection --i.e., you select Exclusion with Union or Intersection.
• Exclusion + Union -- Exclude packets with any of the specified events.
• Exclusion + Intersection -- Exclude packets with all of the specified events.
LeCroy Corporation
115
Version 6.25
Using Find
SATASuite User Manual
Step 1 Select the display level to be searched from the Search For box on the
left side of the window.
For example, to search through Commands, select Commands.
The display level affects options presented in the Events Group
box.
Step 2 Select a search direction and origin.
Step 3 Select one or more events from the Events Group box.
Your choices will affect options displayed on the right side of the
dialog.
Step 4 If you have selected two or more criteria, then select either:
•
Union: Find all packets that match ANY of the specified events.
•
Intersection: Find all packets that match ALL of the specified events.
If you want to selected events from the trace, then select:
•
Exclusion: Exclude all packets that match any of the specified events.
Step 5 Click OK. The search then occurs, and the results display.
116
LeCroy Corporation
SATASuite User Manual
Find Next
Version 6.25
To apply the previous Find parameters to the next search,
Select Find Next (or F3) under Search on the Menu Bar
OR
Click
on the Tool Bar.
When Link Tracker is open and Find Next is used, the software repositions the
LinkTracker (and other views) on the next frame containing the same primitive. For
example, when using Find Next to search for SATA_SYNC primitives - the display will
select the next primitive in time starting from the specified origin (top of the screen,
beginning of the file, last match), regardless of which frame and which recording channel
it occureds.
Figure 11: When using Find Next for primitives, the search order will be as shown
LeCroy Corporation
117
Version 6.25
118
SATASuite User Manual
LeCroy Corporation
SATASuite User Manual
Version 6.25
Chapter 8: External Interface for Trigger
In /Out
With each CATC 10K analyzer, LeCroy includes two mechanisms for low latency
communications with general purpose test and measurement equipment:
•
BNC Trigger in / out - This connection can be used to send clocking
information and recording commands from one analyzer to another
(see Setup for Cascaded Multiple Analyzer Use in Chapter 10). The
BNC interface can also be used for transmitting and receiving trigger in
/ out signals from general purpose instruments such as a LeCroy
Oscilloscope or an InFusion Error Injection system.
•
Break out board - The break-out board utilizes a LV TTL level signal
which can provide a simple trigger in/out interface to the analyzer. It
can also be used to configure the analyzer to trigger on a specific bit
pattern received on the break out board data pins.
BNC External Trigger In / Out
The BNC External Trigger Out capability allows users to specify protocol level events as
Trigger Out signals to external instruments. This provides a mechanism for SATA link
layer errors detected on the analyzer to trigger an attached oscilloscope. The BNC
Trigger In provides a similar mechanism allowing physical layer instruments to signal the
analyzer to start capture at a specific instant.
Using the
BNC Trigger
Out
Step 1 Attach the BNC Trigger Out connector to an appropriate BNC
Trigger In connector on a general purpose test instrument using
the provided BNC cable
Step 2 In the SATASuite software, under Recording Options, select
the Recording Rules Tab
LeCroy Corporation
119
Version 6.25
SATASuite User Manual
Step 3 Select the New Event button and specify the protocol level
event desired to initiate the external Trigger Out signal
Step 4 Under the Actions Tab, Select the type of External Trigger
signal suitable for the external instrument. The 10K chassis
support three external trigger-out signal types:
•
•
•
Pulse High
Pulse Low
Pulse Toggle
Note:In each case, the BNC signal transmits an LV TTL level signal
Step 5 Select Trigger Analyzer on the Actions Tab if you intend to
record protocol level traffic simultaneously while using the BNC
External Trigger Out signal
Step 6 Press the Record button to arm the analyzer. Trigger indicator
on the analyzer faceplate will indicate when the trigger condition
has been detected by the analyzer system.
120
LeCroy Corporation
SATASuite User Manual
Using the
BNC Trigger
In
Version 6.25
Step 1 Attach an appropriate BNC Trigger Out connector on a general
purpose test instrument to the BNC Trigger In connector using
the provided BNC cable.
Step 2 In the SATASuite software, under Recording Options, select the
General Tab and click the radio button Event Trigger under
Recording Type.
Step 3 Select the Recording Rules Tab. Remove all triggering events
from the Recording rules (Filtering options can be retained - see
Recording Rules screen image below)
Step 4 Press Record > Start button to arm the analyzer. The analyzer
will indicate it is waiting for a trigger. Any edge detected on the
Trigger In signal will stop the recording and fill the buffer on the
analyzer.
Note:: Voltage required on the edge condition is 0 to.8V low, 2.0V to 3.3V high. 40nS
is the approximate detection threshold for the BNC Trigger In feature.
Note:: There is also a trigger indicator on the analyzer front panel that will indicate
when the trigger condition has been detected by the analyzer.
LeCroy Corporation
121
Version 6.25
SATASuite User Manual
Breakout Board Trigger In / Out
The Breakout Board connects via a 25 pin
serial interface cable to the Data In/Out
connector located on the rear of the analyzer
unit. Each signaling pin is isolated by a 100Ω
series resistor and a buffer inside the Analyzer
unit. Six ground pins and one 5-volt pin are
provided.
122
Data In/Out Connector (on cable)
LeCroy Corporation
SATASuite User Manual
Version 6.25
Pin-Outs for the Data In/Out Connector
The following table lists the pin-out and signal descriptions for the Data In/Out connector
on a cable that connects to the Breakout board.
Data In/Out Connector – Pin-Out
Pin
Signal Name
Signal Description
1
RSV
Reserved
2
GND
Ground
3
GP OUT
General Purpose Output
4
TRG IN 1
Trigger In 1
5
GND
Ground
6
DATA 6
Data 6
7
DATA 4
Data 4
8
DATA 3
Data 3
9
DATA 1
Data 1
10
GND
Ground
11
RSV
Reserved
12
RSV
Reserved
13
+5V
+5 Volts, 250 mA DC Source
14
RSV
Reserved
15
GND
Ground
16
TRG OUT
Trigger Out
17
TRG IN 0
Trigger In 0
18
DATA 7
Data 7
19
DATA 5
Data 5
20
GND
Ground
21
DATA 2
Data 2
22
DATA 0
Data 0
23
GND
Ground
24
RSV
Reserved
25
RSV
Reserved
Note:
(*) Pins 4 and 17 have the same function: they allow external signals
to be used to cause triggering or recording. Pins 3 and 16 are used
to transmit output signals. Pins 6, 7, 8, 9, 18, 19, 21, and 22 (data
pins) are used to define data patterns for external input signals. See
External Input Signals in Chapter 6.
LeCroy Corporation
123
Version 6.25
SATASuite User Manual
External Interface Breakout Board
Prototype
Rework
Area
124
The Breakout Board contains a prototype rework area for making custom circuits for rapid
development. The area consists of plated-through holes, 20 columns wide by 27 rows
long. The top row of holes is connected to GND and the bottom row is connected to +5V.
The remaining holes are not connected. Use the rework area to insert custom
components and wire-wrap their respective signal, power, and ground pins.
LeCroy Corporation
SATASuite User Manual
Version 6.25
Configuring Input Signaling through the Breakout
Board
To configure the analyzer to trigger on an input signal from the breakout board, perform
the following steps:
Step 1 Select Setup > Recording Rules to open the Recording
Options dialog. The Recording Rules page will display.
Step 2 Click the New Events button to open the New Events menu.
Step 3 Select Breakout Board Data from the New Events menu. This
will cause a button to appear in the Available Events area. The
button will be labeled Breakout Board.
Step 4 Drag the new button to the Global State Cell or to the cell faintly
marked Drag an event here to add another state. The Global
State Cell allows you to set conditions that are globally true (i.e.,
always enabled). The cell marked Drag an event here to add
another state is used to create event sequences - i.e., chains
of events leading to a trigger or other action. For further
explanation, see “Assigning an Action” on page 53.
Step 5 Right-click on the Breakout Board button to open a pop-up
menu.
LeCroy Corporation
125
Version 6.25
SATASuite User Manual
Step 6 Select Properties from the pop-up menu. The Properties dialog
opens.
Step 7 If you want to configure the analyzer to trigger on a specific bit
pattern, enter it in the box marked Byte0. Alternatively, you can
enter a hex pattern and mask into the boxes marked Mask and
Match. If no pattern is specified, the analyzer will trigger on ANY
input signal.
Step 8 Click the tab marked Actions.
Step 9 In the Internal Triggering section, select Trigger Analyzer. The
analyzer is now configured to trigger on an input signal.
126
LeCroy Corporation
SATASuite User Manual
Version 6.25
Chapter 9: Reports
The Report menu provides several reports to assist you in analyzing traffic recorded by
the Analyzer.
File Information
To display data on a trace, select Report >File Information from the menu.
The File Information dialog opens and provides information about the recording such as
when it was made and version of the Analyzer Firmware and BusEngine.
Perhaps the most useful information listed in the dialog is the Recording Option settings
used to create the open trace. These settings are shown in the above screenshot. Also
shown in the screenshot is a hypertext link to the Recording Option settings themselves.
The link is marked with the text Open Recording Options in a dialog. Clicking this link
causes the software to open the Recording Options dialog and automatically populate the
dialog with the settings used to create the open trace.
LeCroy Corporation
127
Version 6.25
SATASuite User Manual
Traffic Summary
The Traffic Summary displays a report of traffic in the data file and appears at the bottom
of the SATASuite main window. The left side contains a tree view where you can expand
or collapse types of data you want displayed to the right of the Traffic Summary window.
You can print, e-mail, save to disk, or display data in a two-column table by using the
buttons in the Traffic Summary tool bar.
From the Report menu, select Traffic Summary.
Navigating
The Traffic Summary window also functions as a trace navigation tool. If you click one of
the numbers in the right side of the window, the trace will jump to the first instance of your
selection. Afterwards, click the up or down arrows at the top of the Traffic Summary
window to navigate forward or backward through the display.
Buttons
Buttons at the top of the Traffic Summary window serve to format the display and export
summarized data to email, file, or the printer:
The buttons have the following functions:
Save As - Saves Traffic
Summary results into an
HTML format
Displays results tabular text format
Email - Creates an
email with a *.html file
attachment of the
graphs
Displays drop-down menu with:
Grid Lines - Displays/Hides grid lines
Row Selection - Allows entire rows to be
selected
Tight Columns - Reformats column widths to
match data
Print
128
LeCroy Corporation
SATASuite User Manual
Version 6.25
Error Summary
The Error Summary button opens the Traffic Summary window and displays a list of
errors analyzed throughout the recording.
Step 1 From the Report menu, select Error Summary.
The Traffic Summary window appears with Error information displayed.
Step 2 Navigate to an error within the recording by clicking the number
of the Frame containing the error.
Step 3 Use the arrows to cycle though each occurrence of a particular
error.
Timing Calculations
The timing calculation measures timing between any two specified frames or markers.
The timing calculator feature is designed for tracking bus utilization and I/O performance
in current or previously captured trace files. By default the statistics will be calculated on
a complete capture file or one bounded between markers or between any two frames.
To run the Timing Calculator, perform the following steps:
Step 1 From the Report menu, select Timing Calculations.
Step 2 Select the range, and click the Calculate button. The results will
then display in the window.
LeCroy Corporation
129
Version 6.25
SATASuite User Manual
Bus Utilization
The Bus Utilization window displays information on bandwidth use.
To open the Bus Utilization window, select Report >Bus Utilization or click the button
marked
. A window opens like the one shown below:
Window Layout
The Bus Utilization window divides into two areas:
• Graph Area - Displays graphs. Initially, no graphs will be displayed.
To display one or more graphs, click
and make a selection from
the menu. See “Graph Areas Menu” on page 133 for an explanation
of the types of graphs listed in this menu.
• Min/Max/Avg Area - Displays the minimum, maximum, and average
values for several parameters. Data is available only after you have
displayed the relevant graph. After displaying a graph, the
Min/Max/Avg information is calculated and is thereafter available to
the user even if the graph is closed. The user can close this section
by clicking
and deselecting Statistics Accumulation from the
menu.
130
LeCroy Corporation
SATASuite User Manual
Version 6.25
Bus Utilization Buttons
The Bus Utilization window has a row of buttons for changing the format of the displayed
data and for exporting data:
The buttons have the following functions:
Save As - Saves the
graphs as a bitmap file
(*.bmp)
Vertical zoom in
Email - Creates an email
with a *.bmp file
attachment of the graphs
Vertical zoom out
Print
Click and Drag zoom - Click diagonally to
select and zoom in on part of the graph.
The initial direction you begin dragging
the cursor determines whether the
horizontal or vertical axis is magnified.
Full Screen
Select Range
View Settings - opens a
sub-menu with options for
formatting the display.
See “View Settings Menu”
below
Sync and Graph areas - If two or more
graphs are displayed, this button will
synchronize the graphs to one another.
Once synchronized, the positioning
slider of one graph will move the other
graphs
Horizontal zoom in
Graph Areas - Presents a menu of
graphs for various types of bus data
Horizontal zoom out
LeCroy Corporation
131
Version 6.25
SATASuite User Manual
View Settings Menu
Clicking the View settings button
causes a menu to open
with options for formatting the display.
•
Orient Horizontally - changes the orientation
of bus usage to horizontal. After selecting
this option, the menu will say "Orient
Vertically."
•
Tile Vertically - tiles the two graphs vertically
(i.e., side by side).
•
Show Markers - Places "tick" marks along
the x axis of each graph.
•
Show Plumb Line - Displays a vertical line
that connects your cursor to the horizontal
axis. As the mouse is moved, the status bar will show the packet and
time frame to which the cursor is pointing.
•
Status - Opens a sub-menu with the following options:
— Bar - Displays a status bar at bottom of graph.
— Tooltip - Causes a tooltip to appear if you position your mouse pointer
over part of the graph and leave it there for a couple of seconds.
— None - Turns off tooltips and the status bar.
•
Grid Lines - Opens a sub-menu with the following options:
— Both - Displays both X and Y axis gridlines
— X Axis - Displays X axis gridlines
— Y Axis - Display Y axis gridlines
— None - Turns off gridlines
•
•
132
Grid on Top - Moves the grid lines above the graph.
Fonts and Colors - Opens a dialog box for setting the colors and fonts
used in the graphs:
LeCroy Corporation
SATASuite User Manual
Version 6.25
Graph Areas Menu
The Graph Areas menu allows you to view different information in the Bus Utilization
window.
Step 1 Click the
button.
The Graph Areas menu opens.
Step 2 Select a graph type from the menu. Repeat for additional
graphs.
Note:
LeCroy Corporation
Some graphs will only be available after decoding the logical SCSI or
ATA layer operations.
133
Version 6.25
SATASuite User Manual
Modifying the Appearance of Graphs
To modify a Bus Usage graph, follow these steps below.
Step 1 With a graph displaying in the Graphs Area, right-click anywhere
in the graph and choose Properties from the pop-up menu.
The following dialog box opens.
Step 2 Select an a data type from the box on the left, then edit the Title,
Appearance, Type, or Color boxes as appropriate.
Step 3 Click OK to apply the changes.
Creating a New Graph
To create a new graph,
Step 1 Click
.
Step 2 From the menu, select New ...
Step 3 From the Title, Appearance, and Type boxes, select the
desired options.
134
LeCroy Corporation
SATASuite User Manual
Version 6.25
Link Tracker Window
The Link Tracker window displays a detailed chronological view of events. Events are
shown on a primitive-by-primitive basis within columns within the window, each column
represents a single upstream or downstream channel. Time is presented as rows. Idle
time is shown by empty rows in the window. Idles can be collapsed into gray strips
running across the window.
Each time slot in the vertical axis represents the minimum time required by a dword to
traverse the bus.
The time slots are not fixed in size: they vary depending on how zoomed out the display
is. When the Link Tracker is fully zoomed in, time slots for 1.5 G traffic measure 26.66
ns and time slots for 3.0 G traffic measure 13.33 ns.
When the Link Tracker window is fully zoomed out, the grid lines disappear and the scale
changes to 1 dword equaling a line measuring one pixel in height.
Opening the Link Tracker Window
To open the Link Tracker window, select Report > Link Tracker or click the button
marked
. A window opens like the one shown below:
Window Layout
The Link Tracker window divides into two areas:
• Toolbar - Presents buttons for changing data format.
• Main Display Area - Displays traffic chronologically as it occurred in
the recording. The window divides into columns: the first column
shows time and traffic is shown on a channel by channel basis in the
columns on the right.
LeCroy Corporation
135
Version 6.25
SATASuite User Manual
Link Tracker Buttons
The Link Tracker window has a row of buttons for changing the format of the displayed
data and for exporting data:
The buttons have the following functions:
Full Screen
Synchronize Trace View.
Synchronizes the Trace View and
Link Tracker windows so that a
move in one window repositions
the other. Because of the
differences in scale and logic
between the Link Tracker and
Trace view windows, scrolling
produces different effects
depending on which window is
being scrolled. Scrolling in the
trace window causes the Link
Tracker window to rapidly jump
from event to event. Long periods
of idle time are skipped. Scrolling
in the Link Tracker window, in
contrast, causes small moves in
the trace window. Scrolling in the
Link Tracker window causes the
trace window to pause until the
start of a packet is displayed. At
that point, the trace window
repositions itself. While scrolling
through idle periods or the
contents of a packet, the trace
window will not move.
View Options. Opens a menu with
three options: Collapsible Idle
Time, Tooltip Display, and Reset
Column Widths. See View Options
Menu below for descriptions.
136
Show Values
Show Scrambled Values
Show 10b Codes
Zoom In
Show Symbols
Zoom Out
Show text decoding of frame
header fields
Collapse Idles
Collapse Idles plus. Further
condenses Link Tracker
display to show only first 5
DWORDs of each frame.
LeCroy Corporation
SATASuite User Manual
Version 6.25
View Options Menu
Clicking the View Options button
the display.
causes a menu to open with options for formatting
•
Collapsible Idle Time - Opens a dialog box for setting the Idle time
value. By setting a value, you tell the analyzer when to collapse Idle
times and display them as grayed out strips within the Link Tracker
window. For example, if you had set the Idle time to value x then any
time an Idle time exceeded x it would be displayed as a gray strip across
the Link Tracker window.
•
Tooltip Display - Opens a menu with options for adding content to
tooltips. Tooltips will display when you position the mouse pointer over
an item in the Link Tracker window. The options are:
•
•
•
•
•
Tooltip Display Values
Tooltip Display Scrambled Values
Tooltip Displays 10 bit Codes
Tooltip Displays Symbols
Tooltips Displays Text Decoding
The following screenshot shows a tooltip in which all five options have
been enabled:
•
Reset Column Widths - This option resets column widths to their
defaults.
Docking and Undocking the Window
You can undock the Link Tracker window by double-clicking on the blue title bar along the
left side of the window. Once undocked, the window can be dragged anywhere in the
application. To redock, double-click again on the title bar.
LeCroy Corporation
137
Version 6.25
SATASuite User Manual
Setting Markers
Markers can be set on any dword on any event within the Link Tracker window. To set a
marker, right-click on an event, then select Set Marker from the pop-up menu. Once
marked, events can be easily navigated to via the Go to Marker command in the Search
menu.
Calculating Time between Dwords
You can calculate time between dwords by clicking on a specific cell and then positioning
your mouse pointer over a second cell. A tooltip will display the time delta between the
two cells.
Step 1 Click on the cell for the first event to select it.
Step 2 Scroll down through the trace to the second event and position
the mouse pointer over the event. A tooltip will appear showing
the time interval between the first and second events.
More about Cell Selection
When searching for a frame or primitive within Link Tracker, the found cell will become
the selected cell. When a cell is selected, it will remain selected even if it's off the screen.
Keyboard actions in LinkTracker (scrolling, arrow key, etc...) will not affect the selection.
Once a cell is selected, it can only be deselected by switching the selection to another
cell.
Searching
When the Trace view and Link Tracker windows are synchronized, the Find and Go To
options in the Search menu will apply to the Link Tracker window. The Trace and Link
Tracker windows can be synchronized by selecting the Synchronize button
.
138
LeCroy Corporation
SATASuite User Manual
Version 6.25
Hiding Traffic
You can hide Aligns, Channels and other data from the Link Tracker window by clicking
the Hide buttons on the toolbar in the Trace window
or by
selecting one or more of the various Hide options in the Display Options dialog box.
Zooming In and Out
Zooming out can give you a quick, high-level view of a trace. A fully zoomed out trace
will only show columns and colored lines. Using the colors you can see what types of
traffic running through the trace - for example, brown represents data, and dark green is
a Start of Frame.
Further information can be obtained on any point of interest in the trace by positioning
your mouse pointer over it. Tool tips provide detailed description of events.
Note that when fully zoomed out, the smallest graphical unit is the dword, represented by
a single line. Zooming out makes the trace appear smaller and increases the time scale
in the first column.
LeCroy Corporation
139
Version 6.25
SATASuite User Manual
Collapsing Idle Time, Enabling Tooltips, and Resetting Column
Widths
Click the View Options button
to open a menu with options for formatting the
display. Three options are presented:
Collapsible Idle Time - Opens a dialog box for setting the Idle time thresholds. Setting
a value tells the analyzer when to collapse Idle times and display them as grayed out
strips within the Link Tracker window.
Tooltip Display - Opens a menu with options for adding content to tooltips. Tooltips will
display when you position the mouse pointer over an item in the Link Tracker window.
The options are:
•
•
•
•
•
Tooltip Display Values
Tooltip Display Scrambled Values
Tooltip Displays 10 bit Codes
Tooltip Displays Symbols
Tooltips Displays Text Decoding
The following screenshot shows a tooltip in which all five options have been enabled:
Reset Column Widths - This option resets column widths to their defaults and enables
columns to resize themselves automatically any time the application window is resized.
Normally, columns will automatically resize themselves if the application window is made
larger or smaller. However, if you manually resize any columns in the Link Tracker
window, column widths become static. Thereafter, if you resize the application window,
the Link Tracker columns will not adjust automatically. Reset Column Widths
re-enables this automatic resizing capability.
140
LeCroy Corporation
SATASuite User Manual
Version 6.25
Frame Tracker Window
The Frame Tracker window displays a detailed chronological view of traffic on a
Frame-by-Frame basis. Events are shown within columns within the window, each
column representing a channel. Time is presented as rows. Idle time is shown by empty
rows in the window.
Each time slot in the vertical axis represents the elapsed time required by the Frame to
traverse the bus.
Opening the Frame Tracker Window
To open the Frame Tracker window, select Report > Frame Tracker or click the button
marked
. A window opens like the one shown below:
Window Layout
The Frame Tracker window divides into two areas:
• Toolbar - Presents buttons for changing data format.
• Main Display Area - Displays traffic chronologically as it
occurred in the recording. The window divides into
columns: the first column shows time and traffic is shown
on a channel by channel basis in the columns on the right.
LeCroy Corporation
141
Version 6.25
SATASuite User Manual
Frame Tracker Buttons
The Frame Tracker window has a row of buttons for changing the
format of the displayed data and for exporting data:
The buttons have the following functions:
Full Screen
Zoom In
Synchronize Trace View.
Synchronizes the Trace View
and Frame Tracker windows
so that a move in one window
repositions the other.
Zoom Out
View Options. Opens a menu
with three options: Collapsible
Idle Time, Tooltip Display, and
Reset Column Widths. See
View Options Menu below for
descriptions.
View Options Menu
Clicking the View Options button
the display.
•
causes a menu to open with options for formatting
Time Format- Opens a menu with options for setting the time format.
There are two options:
• Seconds
• Clocks
•
Reset Column Widths - This option resets column widths to their
defaults.
Normally, columns will automatically resize themselves if the application
window is made larger or smaller. However, if you manually resize any
columns in the Frame Tracker window, column widths become static.
Thereafter, if you resize the application window, the Frame Tracker
columns will not adjust automatically. Reset Column Widths
re-enables this automatic resizing capability.
Docking and Undocking the Window
You can undock the Frame Tracker window by double-clicking on the blue title bar along
the left side of the window. Once undocked, the window can be dragged anywhere in the
application. To redock, double-click again on the title bar.
142
LeCroy Corporation
SATASuite User Manual
Version 6.25
Calculating Time between Frames
You can calculate time between cells within Frame Tracker by clicking on an event and
then positioning your mouse pointer over a second event and reading the ensuing tooltip.
Step 1 Click on the time value for the first event.
Step 2 Scroll down through the trace to the second event and position
the mouse pointer above its time value. A tooltip will appear
showing the time interval between the first and second events.
Hiding Traffic
You can hide Aligns, Channels and other data from the Frame Tracker window by clicking
the Hide buttons on the toolbar in the Trace window
or by
selecting one or more of the various Hide options in the Display Options dialog box.
Searching
When the Trace view and Frame Tracker windows are synchronized, the Find and Go To
options in the Search menu will apply to the Frame Tracker window. The Trace and
Frame Tracker windows can be synchronized by selecting the Synchronize button.
Zooming In and Out
Zooming out provides a high-level view of a trace. This allows users to display more
events on screen. Cell coloring can be used to distinguish between different types of
traffic on the bus.
LeCroy Corporation
143
Version 6.25
144
SATASuite User Manual
LeCroy Corporation
SATASuite User Manual
Version 6.25
Chapter 10: Networking
SATASuite has networking and cascading functions that are described in this chapter.
•
Cascading -- Allows two to four SATracer analyzers be linked (or
"cascaded") together into a single, synchronized, logical unit in order to
increase the number of ports that can be monitored. To enable synchronized
multi-analyzer recording, the analyzers are connected together via their BNC
connectors on the back of the analyzers. This connection is used to send
clocking information and recording commands are sent from one analyzer to
another.
•
Networking -- SATASuite can support analyzers connected remotely over
an IP LAN. Using the Network browse dialog, you can remotely control one
or more analyzers.
Working with Multiple Analyzers
Multiple analyzers can be set up in three ways:
Directly Connected by USB - Two or more analyzers can be connected to a single host
PC via USB. In this setup, no additional cables are used (as they are in a Cascaded
setup) and the analyzers function as non-cascaded, standalone units. Users toggle back
and forth between the units.
Cascaded - Two or more local SATracer analyzers linked by BNC. One (or all) of the
analyzers then connect via USB to a host PC.
The BNC cable functions to transmit clocking and control information between the
analyzers, thereby allowing the analyzers to function as a cascade - i.e., a single, logical
analyzer. Cascading analyzers allows them to perform synchronized, multi-analyzer
recordings.
Connected Remotely over an IP Network - A PC connected to analyzers across an IP
network.
LeCroy Corporation
145
Version 6.25
SATASuite User Manual
Hardware Setup for Direct USB Connections
Connecting multiple analyzers to a single PC by USB gives you the convenience of being
able to control multiple analyzers from a single SATASuite application. The application
provides you with a means of toggling back and forth between the analyzers.
To set up multiple analyzers via USB, you attach
USB cables between the analyzers and the host
PC as shown in the illustration on the right. If you
do not intend to group the analyzers together for
synchronized multi-analyzer recordings, no
further hardware setup is required. If you do
intend to group the analyzers, then you will need
to add BNC cables as described in the section below under "Setup for Multiple Analyzer
Use." Once the analyzers are connected and started, you can browse to the analyzers
via the command Setup > Analyzer Network ...
Note:
The SATASuite software will allow you to toggle between the
analyzers but not run two copies of SATASuite software on your
screen simultaneously.
Setup for Cascaded Multiple Analyzer Use
If you add a BNC connection between the
SATracer analyzers shown, you create a
cascade which allows the analyzers to
function together as a logical unit.
Cascading increases the numbers of ports
that can be simultaneously recorded.
To set up a cascade, you connect a BNC
cable between the External Output port on the back of one
analyzer to the input port on the second. The first analyzer will
serve as the controlling or master analyzer. It will transmit clocking
information, Recording Option commands and other data to the
other analyzers. If you plan to group three or four analyzers
together, daisy-chain the remaining analyzers together, and then
loop the output of the last analyzer to the input of the first analyzer
as shown in the figure on the right.
146
LeCroy Corporation
SATASuite User Manual
Version 6.25
Set Up for Remote Access over an IP LAN
Analyzers can be run remotely
over an IP network. In an IP
network, the analyzers connect
their respective hosts via USB and
the hosts, in turn, connect to each
other via IP.
Setup involves installing
SATASuite software on each analyzer host, then enabling IP LAN connectivity between
the hosts.
When the remote analyzer is powered on, you connect remotely control the analyzer via
its host. Your connection will be Local host => Remote host => Analyzer.
Use the command Setup > Analyzer Network to browse to the remote host.
You can cascade IP-connected analyzers by adding BNC connections between the
analyzers as described above in “Setup for Cascaded Multiple Analyzer Use” on
page 146.
LeCroy Corporation
147
Version 6.25
SATASuite User Manual
Configuring the Connection
Once you have completed the physical setup, you are ready to configure the analyzer
connection.
USB
Connected
Analyzers
Configuration for two or more USB connected analyzers is minimal.
In the following example, two SATracer analyzers are linked via USB to a host PC. You
connect to one of the two analyzers.
Step 1 Start the SATracer analyzers and the SATASuite software.
Step 2 From the menu, select Setup > All Connected Devices.
The Analyzer Network dialog box opens. To select an analyzer, check
the relevant checkbox on the left.
Step 3 Click Close.
The dialog box closes and the analyzer is selected. The SATASuite
software on your screen will now control the selected analyzer.
Note:
148
You can update the Firmware, BusEngine and License from this
dialog by checking an analyzer and then clicking the appropriate
button on the right. You can also directly open and set Recording
Options for any of the analyzers by checking one or more analyzers
and then clicking the Recording Options button. The Recording
Options dialog will open. The settings you create will apply to all
selected analyzers.
LeCroy Corporation
SATASuite User Manual
Remote
Analyzers
Over an IP
Network
Version 6.25
To configure SATASuite to remotely control an analyzer over an IP LAN, you will need to
use the Analyzer Network dialog to browse to the host controlling the analyzer and add
both the host and its PC to the dialog.
Step 1 From the menu, select Setup > Analyzer Network.
The Analyzer Network dialog box opens. This dialog lists host PCs and
their analyzers. The listed devices are either currently connected or
were connected at some point previously.
Step 2 Remove any host (other than the Local Machine) from the list by
selecting the host and then clicking Remove.
You should keep in the list only the host(s) that you are planning to
immediately use.
Step 3 To add a host and analyzer to the list, click Add.
A browse dialog box opens.
Step 4 Browse to the host that has an analyzer attached to it and
double click on it.
Step 5 The host will be added to the Analyzer Network dialog.
Step 6 Click Close to close the dialog box.
LeCroy Corporation
149
Version 6.25
SATASuite User Manual
Step 7 Select Setup > All Connected Devices ... to open the Analyzer
Devices dialog box.
Step 8 Uncheck all boxes except for the one for the remote analyzer
that you wish to connect to.
Step 9 Click Close to close the dialog box and establish a connection
to the selected analyzer.
Configuring
Cascaded
Multiple
Analyzers
To configure SATracer analyzers to work as a group (i.e., into a cascade), attach BNC
cables as described in “Setup for Cascaded Multiple Analyzer Use” on page 146, then
perform the following steps:
Step 1 Perform Steps 1 and 2 as described above in “USB Connected
Analyzers” on page 148.
The Analyzer Devices dialog box will open.
Step 2 In the Analyzer Devices dialog box, verify that the checkboxes
are checked for the cascaded analyzers.
Step 3 Click Close.
The dialog closes and the analyzers are selected.
Step 4 Test the setup by recording some traffic.
If the analyzers are not connected by the BNC cables, an error message
will appear prompting you to correct the problem.
150
LeCroy Corporation
SATASuite User Manual
Version 6.25
Network Chat
Analyzer Network Chat is a utility that allows users to conduct chat sessions over an IP
LAN.
In order to send and receive electronic text messages, each user must be working with a
PC that is attached to an analyzer. And each PC must, in turn, be connected to an IP
LAN.
To start a chat session,
Step 1 Select View > Analyzer Network Chat Bar from the menu. The
following dialog opens.
Step 2 Click in the cell at the bottom of the window and type some text.
Step 3 Click Send. The sent text will appear in the top of the window
next to your prompt.
LeCroy Corporation
151
Version 6.25
152
SATASuite User Manual
LeCroy Corporation
SATASuite User Manual
Version 6.25
Chapter 11: Traffic Generation with
SATrainer
SATrainer is a traffic generator that can emulate SATA host or SATA device. Traffic
generation enables engineers to test designs under realistic conditions and to transmit
known errors, allowing engineers to observe how devices handle faulty link conditions.
Traffic generation is performed via the execution of text-based scripts. These scripts
contain statements about the types of traffic to be generated.
SATA Exerciser Hardware
LeCroy SATrainer requires both the SATA Analyzer module and the SATA Exerciser
module that plugs into the right slot of the CATC 10K chassis. Installing the SATracer
Exerciser module will require that you remove ports 3&4 (if equipped with a 4 port
analyzer) or the blank face plate (if equipped with a 2 port analyzer).
Figure 12: SATracer/Trainer 2 port Analyzer with Exerciser option installed
Setting Up SATA Exerciser for Initiator Emulation
Connect the cable from the SATA
Exerciser To Target port to the Target
port on the unit under test. This
transmits the Traffic Generator stream
from the To Target port on the
SATracer/Trainer to the target-side port
on the unit under test.
LeCroy Corporation
153
Version 6.25
SATASuite User Manual
Setting Up SATA Exerciser for Target Emulation
Connect the cable from the SATA
Exerciser To Initiator port to the
Initiator-side port on the unit under test.
This transmits the Traffic Generator
stream from the To Initiator port on the
SATracer/Trainer to the initiator-side port
on the unit under test.
Generating Traffic
Generating traffic using SATASuite is a two step process. First, a text-based Traffic
Generator file must be created. This file can be created through a special conversion
command in SATASuite that converts a trace file captured by a SATracer analyzer into a
traffic generator file. Alternatively, you can edit an existing file or write your own.
This text file is named with an .ssg extension. Once the file has been created, in can be
opened and displayed in the SATASuite application. You can invoke the SATASuite
application to transmit the traffic generation file by using the Traffic Signal button
.
Creating a
Traffic
Generation
File with
SATASuite
154
The easiest way to create a Traffic Generation file is to convert an SATracer trace file
(*.sata) into a *.ssg file. This is done with the Export function in SATASuite.
Step 1 Open a trace file.
LeCroy Corporation
SATASuite User Manual
Version 6.25
Step 2 From the menu, select File>Export>to Generator File Format
(.ssg). The Export to Generator Text screen appears (.ssg).
There are several options .
File Name - Enter a user-defined file name.
Save As Type - There is but one option: SASTrainer Generator Files
(.ssg).
Link and Direction - Select the source and direction of the traffic you
are going to export into a traffic generation file. You can only export a
single uni-directional link (for example, I1).
Do not export hidden packets - If selected, will only export traffic that
is currently displayed onscreen. Traffic hidden via the various hide
buttons will not be exported into the traffic generation file.
Use Auto Alignment - If selected, exports Auto Aligns to the traffic
generation file.
From - (Optional) Enter the range of traffic (in Frames, Markers, or Time)
to be exported. The default is to export all traffic in the open trace.
Step 3 Select the desired options, the click Save.
A Generator file (*.ssg) has now been created and can be read with the SATASuite
application.
LeCroy Corporation
155
Version 6.25
SATASuite User Manual
Opening a Traffic Generation File
Once the Traffic Generation file (*.ssg) file has been created, you can then open it in the
SATASuite application.
To open a Traffic Generation file,
Step 1 Select Open under File on the Menu Bar
OR
Click
on the Tool Bar.
Step 2 Select a Generator text file (*.ssg) and click Open. If needed,
navigate to the install directory. For samples, see the install
directory. The Generator file appears in a Trace view, shown
below:
Layout
The .ssg file will show several colored bars across the screen that represent global
settings. The bars serve to show how the generation file is currently configured. These
settings include the link speed (1.5 Gbps vs. 3.0 Gbps), the type of device (for example,
SATA Host or SATA Device), COMINIT, COMWAKE and some other settings. As
changes are made and saved to the traffic generation file, the bars will immediately
update.
The actual traffic pattern that is about to be generated appears below the bars as a series
of Frames. In the generation file shown in the above screenshot, the first generation
Frame is a Start of Address Frame labeled as Frame 8.
You can edit the traffic generation file to add, edit or remove frames.
156
LeCroy Corporation
SATASuite User Manual
Version 6.25
Starting the Script Editor
To edit an .ssg file, use the Script Editor. The Script Edit is an editing tool that will display
the .ssg file and its supporting Include files.
To launch the Script Editor: click the Script Editor button on the toolbar
in the trace window and choose Edit as Text.
or right-click
The Script Editor window will open and display in the lower portion of the trace window.
The Script Editor divides into three areas: the toolbar, the script window, and the file tabs
at the bottom of the window. If errors occur, a log will open at the bottom of the window.
LeCroy Corporation
157
Version 6.25
Toolbar
SATASuite User Manual
The toolbar contains buttons for saving your edits, navigating, searching and other
functions.
The buttons have the following functions:
Save. Saves your edits and
immediately updates the
setting bars and Frames
shown in the trace window.
View Options. Opens a menu
with three options: Enable
Outlining, Toggle Outlining,
and Line Numbers. See View
Options Menu below for
descriptions.
158
Go to next bookmark.
Go to previous bookmark.
Cut.
Clear all bookmarks.
Copy.
Find.
Paste.
Find and Replace.
Undo.
Print.
Redo.
Go to Definition.
Add/Remove bookmark.
Allows markers to be set or
removed to aid in navigation.
Open File Under Cursor.
Opens whatever file has
been pointed to with the
mouse in the script. This
command works with
Include statements.
LeCroy Corporation
SATASuite User Manual
Version 6.25
View Options Menu
The View Options button has a menu with three options:
•
Enable Outlining - Adds an expandable/collapsible tree
structure to the left side of the Script Editor showing the
hierarchical relationship of the script lines.
•
Show Line Numbers - Adds line numbers to the left side of the
Script Editor window.
•
•
Show Tooltips - Displays tooltips in the editor window.
Toggle Outlining - Toggles the outline tree between collapsed and expanded states.
Pop-up Menu
Right click anywhere in the script
window to open a pop-up menu with the
following options:
Cut - Cuts selected text.
Copy - Copies selected text.
Paste - Pastes selected text.
Go to Definition of - Repositions the
script window to whatever definition
has been selected.
Open File - Opens whatever file has been pointed to with the mouse in the script. This
command works with Include statements - for example, "%include
"Generation\Include\PrimitivesDecl.inc".
Close File - Closes whatever script file is currently being displayed.
Enable Outlining, Toggle Outlining, and Line Numbers - Enables the three options
described above under View Options Menu.
File Tabs
At the bottom of the window are a series of tabs that allow the .ssg file and its supporting
Include files to be opened and edited. The Include files open automatically when the
software first reads the script.
Error Log
Whenever you create a scripting error, a log will open at the bottom of the application
window. When the error is corrected, the window automatically closes.
LeCroy Corporation
159
Version 6.25
SATASuite User Manual
Overview of Generation and Global Settings Files
Sample .ssg files and Include files reside in two directories called
\Samples and \Include that are typically installed in:
C:\Program Files\LeCroy\SATracer\Generation.
Traffic
Generation
(*.ssg) Files
The .ssg traffic generation files are text files consisting of include statements, a
generation block and, optionally, global statements.
The generation block is the code responsible for the actual traffic generation. It is marked
by the tag "Generation." The composition and format of the generation block is described
later.
The include statements provide links to the Include files which, in turn, provide the
definitions for primitives, frames, and "global settings" - i.e., settings that hold for most or
all of the generation session.
The definitions for SATA traffic are contained in five LeCroy-provided Include files:
Settings.inc, PrimitivesDecl.inc, AddressFramesDecl.inc, SSPFrames.inc,
SMPFrames.inc and SSPFrames.inc.
160
LeCroy Corporation
SATASuite User Manual
Settings.inc
File
Version 6.25
The Settings.inc file contains global statements about the link, the type of device being
emulated, and other conditions that are to exist throughout part or all of the traffic
generation. This file must be included in the traffic generation file.
There are fifteen groups of settings in this file:
•
•
•
•
•
•
•
•
•
•
AutoMode
COMINIT/COMRESET OOB Signal
COMWAKE OOB Signal
COMSAS OOB Signal
Generation Commands
Link Speed
SATA Link Initialization
SAS Speed Negotiation
SATA Speed Negotiation
Autowait:
•SAS After
•SAS Before
•SATA After
•SATA Before
•
•
Wait Command Timeout
Scrambling Mode
Details about each group of settings are described in the following chapter Traffic
Generation Language.
LeCroy Corporation
161
Version 6.25
SATASuite User Manual
Editing Settings.inc
Text in the Settings.inc file can be edited directly or copied into the beginning of the traffic
generation file and edited there. Many users opt for this latter approach.
When editing global settings, keep in mind the following rule:
•
The last line encountered before the generation block takes precedence. Thus,
if the following two lines about the device emulation were added just above the
generation block, the second would take effect:
set GenerationMode = GEN_MODE_SATA_HOST
set GenerationMode = GEN_MODE_SATA_DEVICE
162
LeCroy Corporation
SATASuite User Manual
Version 6.25
The Global Setting "AutoAlign"
AutoAlign is a global setting that may be on or off depending on the type of device
you are emulating. There is an AutoAlign setting for SAS and one for SATA - for
example, "set AutoAlignSAS = ON" and "set AutoAlignSATA=OFF."
SAS - Sends AutoAligns every 2048 dwords.
SATA - Sends AutoAligns every 256 dwords.
If you plan to set and reset AutoAlign in the middle of traffic generation, then you need to
know what the defaults are for AutoAlign. The defaults are as follows:
For SATA host/device emulation, then
•
•
AutoAlignSATA is assumed to be ON
AutoAlignSAS is assumed to be OFF.
For SAS emulation, then the assumptions are opposite:
•
•
AutoAlignSATA is assumed to be OFF
•
AutoAlignSAS and AutoAlignSATA are assumed to be ON
AutoAlignSAS is assumed to be ON
For STP,
LeCroy Corporation
163
Version 6.25
SATASuite User Manual
Placing Global Settings in the Generation Block
Some global settings such as AutoAlign = On/Off can be set and reset in the generation
block. For example, a user might want to set SASAutoAlign = ON prior to traffic
generation and then have it change to OFF half way through the generation session.
When placed within the generation block and then viewed in the trace window, global
settings appear as colored bars interspersed amidst the traffic.
164
LeCroy Corporation
SATASuite User Manual
Version 6.25
While most global settings can be set in the generation block, three will be ignored if
placed within the generation block:
set Link Speed =
set GenerationMode =
set SSC =
These commands should be configured either in the Setting.inc file or at the beginning of
the traffic generation file as a global statement.
Primitive and Frame Definitions
Five other Include files are provided that define the most of the known templates for
Primitives and Frames. The five are:
•
•
•
•
•
PrimitivesDecl.inc
AddressFramesDecl.inc
SSPFramesDecl.inc
SMPFramesDecl.inc
STPFramesDecl.inc.
Each of the Frame templates defines header and field structure.
The default value for all Frame fields is zero.
Special
Conditions
for Frames
There are three conditions about Frames that need to be kept in mind when configuring
Frame generation:
1. Frame delimiters need to agree - At the present time, when defining a Frame, make
sure that the Frame Prologue and Frame Epilogue agree. Do not mix types. For
example, do not mix a SAS Start of Frame (SOF) with a SAS End of Address Frame
(EOAF).
A SAS SOF should be matched to a SAS EOF, a SAS SOAF should be matched to a SAS
EOAF. If generating SATA traffic, a SATA_SOF should be matched to a SATA_EOF.
At the present time, if you mix different types of prologues and epilogues for any given
Frame, the Frame will be ignored.
LeCroy Corporation
165
Version 6.25
SATASuite User Manual
2. Data Length Fields can be fixed-length or variable - By default, data frames are
of a fixed length. If you want to generate variable length frames, then place an asterisk
in the Data definition field in the SSPFramesDecl.inc file:
Data : *
If you replace the asterisk with a value, then the field becomes fixed length.
3. CRC Calculations will be calculated by SATASuite unless told otherwise - If the
CRC is not explicitly set in the traffic generation file, SATASuite will assume that you want
it and will calculate and display it in front of the generated frames.
If the user provides a CRC value, SATASuite will use that value even if it is incorrect. This
gives the user the option of configuring the generator to create errors.
If the generation file was created through the Export command (i.e., File > Export > To
Generator File Format ...), the CRC is calculated but commented out. If the source trace
has a bad CRC, the CRC is exported into the generation file and is not commented out.
Primitives
Decl.inc
The PrimitivesDecl.inc file defines Primitives. The file consists of a declarations (left) and
the corresponding byte stream (right).
To generate Primitives, copy relevant portions of text on the left (i.e., not the bytes shown
right) from this file into the generator block section of the .ssg file.
For examples of usage, see primitives.ssg in the Samples directory.
Address
FramesDecl
.inc
The AddressFramesDecl.inc file defines Address Frames.
SSPFrames
.inc
The SSPFrames.inc file defines SSP Frames.
SMPFrames
.inc
The SMPFrames.inc file defines SMP frames
STPFrames
.inc
The STPFrames.inc file defines STP frames
166
For examples of usage, see AddressFrames.ssg in the Samples directory.
For examples of usage, see SSPFrames.ssg in the Samples directory.
For examples of usage, see SMPFrames.ssg in the Samples directory.
For examples of usage, see STPFrames.ssg in the Samples directory.
LeCroy Corporation
SATASuite User Manual
Version 6.25
Working with Generation Files
The easiest way to generate traffic is to start with one of the sample generation files and
edit the settings to see how the script file behaves. As you make and save changes, the
trace view of the generation file is automatically updated.
The following screenshots shows the sample file SSPFrames.ssg as it appears in the
script editor and trace window.
LeCroy Corporation
167
Version 6.25
SATASuite User Manual
In the lower screenshot, global settings make up the eight bars at the top of the window.
Below that are five frames. If you look at the script itself, you will see that there are six
frame commands, five active and one commented out.
Generating Traffic
Once the .ssg file has been opened onscreen, recording and traffic generation can begin
at any time.
Step 1 Click
to begin the recording.
Step 2 If the script does not have a connect block built into it, connect
the exerciser to the DUT by clicking the Connect Link button
. Clicking this button will cause the generator to invoke the
various settings in your script (for example, the global settings)
and then establish a connection.
Step 3 Click the Start Generation button
on the Tool Bar.
While generating traffic, a bar appears on the right of the trace view, indicating that traffic
generation is taking place (The green light on the Traffic signal button also blinks during
traffic generation).
Stop Traffic
Generation
Normally, traffic generation stops automatically when SATASuite reaches the end of the
Generator file.
To manually stop traffic generation, Click the Stop Generation button
Resume
Traffic
Generation
168
.
If traffic generation is stopped prior to the end of the script, it can be resumed.
To resume traffic generation, Click the Stop Generation button
.
LeCroy Corporation
SATASuite User Manual
Version 6.25
Chapter 12: SATrainer Generation
Language
The SATrainer File Generation Language is an API that allows you to separate traffic into
text commands. These commands are used construct primitives and frames that are sent
to the host or the device.
File Structure
Traffic Generation files (*.ssg) should have the following structure:
Declarations
•
Global generation settings
•
Constants
•
Data patterns
•
Chain of symbols (primitives, raw data, etc)
•
Packet templates
Note:
Generation
blocks
•
List of generation instructions
Note:
LeCroy Corporation
Some declared objects could be used in further declarations as long
as they are previously declared. No forward declarations are
allowed at this time.
It is possible to create many generation blocks - but at current time
only a block with the name 'Generation' will be executed. (Calls of
some blocks from another blocks are not currently allowed)
169
Version 6.25
SATASuite User Manual
Language
Comments:
'#' - Comment symbol. The line remainder after this symbol will be ignored.
'/*' '*/' - Comment Block. All the text between '/' '*' and '*' '/' is ignored.
/*
This is an example of a block of comments.
*/
Includes:
%include "FileName.inc" - This directive includes the file "FileName.inc". This lets the
user add common definitions and templates into new scripts.
Language parser makes sure the same file is not included more than once.
EXAMPLE:
%include "SomeInc.inc" # This directive will actually include file 'SomeInc_1.inc'
%inline - The same as %include, but without the Language parser check.
Settings
Using the "Set "Constant Name" = Value" statement, users can set different
constants/modes using the following value types:
•
Predefined constants (TRUE/FALSE/ON/OFF/INFINITE/etc)
•
Numbers
EXAMPLES:
Set AutoAlignSATA=ON
Set WaitTimeOut=239
Constants
Only unsigned integers can be defined as constants. Some constants are predefined in
SATrainer.
EXAMPLES:
Const SOME_HEX_DATA = 0xAABBFFEE # defines hexadecimal
constant
Const SOME_DEC_DATA = 12
Const "SOME DEC DATA" = 64
# defines decimal constant
# defines decimal constant
Const "Some Hex Data" = 0xCDCDBEBE
Predefined
Constants
170
•
TRUE
•
FALSE
•
ON
•
OFF
•
INFINITE
LeCroy Corporation
SATASuite User Manual
Data
Patterns
Version 6.25
Data patterns are streams of hexadecimal values. Using '['']' lets the user include
constants or predefined data pattern in another pattern.
EXAMPLES:
DataPattern PATTERN_1 = AAAABBBB [SOME_HEX_DATA] EEEEFFFF
1210ABB1 AAAABBBB 1210ABB1 AAAABBBB 1210ABB1 AAAABBBB
1210ABB1 ["SOME DEC DATA"] 1210AB
DataPattern PATTERN_2 = 00000000 11111111 22222222 33333333
AAAABBBB 55556666 FEFEFEFE CDCDCDCD 9999BBBB 12343434
6767676B 56BBFF
DataPattern PATTERN_3 = [PATTERN_1] FFFFFFFF EEEEEEEE
[SOME_HEX_DATA]
DataPattern SOME_PATTERN = BBBBBBBB DDDDDDDD
Primitives
Primitives can be defined using the following:
•
Byte values ('k' indicates control symbol). The 10b codes are calculated
based on the current running disparity
•
Primitives are completely interchangeable with SymChains.
EXAMPLE:
Primitive "CHAIN (ONE)" = kBC 1E 1E 1E kBC 1A 0F
SymChain ChainTwo = k28.5 D12.3 D10.2 D11.6
SymChain ChainThree = k28.3 3EA 25 k18 IFA
Primitive SOF = kBC 18 E4 67
Primitive EOF = kBC 18 F0 9B
•
Raw 10 bits codes. This definition might cause running disparity errors.
EXAMPLE:
Primitive "CHAIN (TWO)" = 305 2D4 1E4 362
•
Mixed bytes and 10b codes. This definition might cause running disparity
errors.
EXAMPLE:
Primitive "CHAIN (TWO)" = 305 2D4 1E4 362 ["CHAIN (ONE)"]
LeCroy Corporation
171
Version 6.25
Packets/
Frames
SATASuite User Manual
Using the "Frame" or "Packet" keyword, user can define a frame of traffic to be used in
the generation stream. Declarations of prolog and epilog may be mixed with field
declarations.
Frame "name" : "parent name"
{
Field Definition 0: "Field Name : Field Length = Default Value"
…
Field Definition n: "Field Name : Field Length = Default Value"
Primitive Definition 0: "Primitive name, offset, count"
…
Primitive Definition m: "Primitive name, offset, count"
Prolog = "primitive name"
Epilog = "primitive name"
}
•
Field Definition
•
Field length is in bits, '*' means that the length is variable and will be set
based on the assigned value
•
Field starting offset is calculated from frame start based on the length of
the previous fields
EXAMPLES:
Field32
: 32 = 0xAABBFFEE
FrameType : 8 = 12
HashedDest : 24 = HEX_DATA
•
•
172
Reserved1
: 8 = 0xDA
Field16
: 16 = 0xAAAA
Reserved2
: 8 = 0xAD
CRC
: 32
Data field Definition
•
"Data = { pattern }" - Pattern is assigned to Data
•
"Data = count, value" - A pattern of "count" times "value" is assigned to
Data
•
"Data = count, start value, step" - A pattern of values starting with "start
value" with steps of "step" and a length of "count" is assigned to Data
Primitive definition. Primitives are inserted into the frame payload. Primitive
definitions are inherited by descended frame templates
•
Assigning '*' clears all previous settings (maybe from parent frame
template).
•
Offset specifies the dword offset where this primitive will be inserted in
the Frame
•
Count specifies how many times to repeat the primitive
LeCroy Corporation
SATASuite User Manual
Version 6.25
EXAMPLES:
Primitive : *
Primitive : SOF, 48 # where 48 = offset
Primitive : "CLOSE (NORMAL)", 36, 5 # where 5 = repeat
•
Prolog and Epilog define Primitive chains to be used at the beginning
and end of the frame
EXAMPLES:
Prolog = SOF # For this frame primitive 'SOF' is used as a Prolog.
Epilog = EOF # For this frame primitive 'EOF' is used as a Epilog.
•
Frames can be derived from other Frames, therefore inheriting the layout of
the parent Frame. In this case, the user may:
•
Change Prolog and Epilog
•
Change default field values
•
Add new fields
FRAME EXAMPLES:
Frame Some_Frame
{
Field32
: 32 = 0xAABBFFEE
FrameType : 8 = 12
HashedDest : 24 = HEX_DATA
Reserved1
: 8 = 0xDA
Field16
: 16 = 0xAAAA
Reserved2
: 8 = 0xAD
Data
: * = PATTERN_1
CRC
: 32
Primitive : *
Primitive : SOF, 48
Primitive : SOF, 96
Primitive : "CLOSE (NORMAL)", 36, 5
Prolog = SOF
Epilog = EOF
}
LeCroy Corporation
173
Version 6.25
SATASuite User Manual
Frame Some_Frame_1 : Some_Frame
{
Field32 = "Some Hex Data"
Data = { 11111111 22222222 33333333 44444444 55555555 }
Opcode
: 128, 8, 0x2A
LBA
: 64
Primitive : *
Primitive : "CLOSE (NORMAL)", 24, 48
Prolog = "CHAIN (ONE)"
Epilog = "CHAIN (ONE)"
}
Generation Block
SATrainer will generate the stream that is defined in this block.
Generation
{
Chain Definition (Repeat = N, Idle = M)
Chain Definition (N, M)
Chain Definition
Frame Definition
Frame Definition (RunningDisp = ON/OFF)
Frame Definition
{
Field Definition
Data Definition
} (Repeat = N, Idle = M, RunningDisp = ON/OFF)
}
174
LeCroy Corporation
SATASuite User Manual
Version 6.25
Definitions
•
Chain Definition:
•
•
Without any parameters, the chain is sent once
•
With "Repeat" and "Idle" parameters, the chain is sent N times and then
nothing is sent (idle) M times. "Repeat" and "Idle" are optional.
Frame Definition
•
Without any parameters, send the frame based in default values
•
With "RunningDisp" ON, send the frames based on default values and
insert a running disparity error.
•
With parameters overriding or adding to a template frame, with or
without injection of an overriding or adding to a template frame, with or
without injection of running disparity error.
Field
You can declare a variable (var_name) as a frame of type (frame_type)
Variable
$var_name = frame_type
Declarations
Note:
Changing
Frame
Fields
Preprocess
or integer
arithmetic
Frame variables can be declared/re-declared and used many times.
You can change some fields in a frame variable
Change var_name { field_name = value }
The user can declare DWORD variables, make arithmetic operations and use them in
field and parameters assignments
Note: Arithmetic expressions are allowed only in numeric variable assignments.
EXAMPLES:
Legal Operations
x=2
y = ( z = 12 ) + ( SOME_DEC_DATA + 36 ) / 8
z = 0x1 << 5
s = "Some Hex Data" # constant may be used in operations
x++
y-z += ( x + y )
x = ( ( y & 0xFF ) >> 5 ) / 12
SOF ( Repeat = x, Idle = y )
X
LeCroy Corporation
175
Version 6.25
SATASuite User Manual
{
Field16 = 0xEEEE # Example of the data payload assignment which uses
both integer variables, constants, hex literals and data patterns
Data = { y y y y 7a7a7a7a "Some Hex Data" "Some Hex Data" 8b8b8b8b
z z z z [PATTERN_3] }
}
( Repeat = 10, Idle = y ) # uses integer variable for parameter/setting
Illegal operations
x=y+2
SOF ( Repeat = (x+y)*7 ) # - illegal, use z = (x+y)*7 SOF ( Repeat = z ) instead
Loops
Loops can be used in two modes:
1. Using an integer number, loop a specified number of loops. This number has to be
smaller than 64K.
2. Using the word "infinite", loops for ever.
Loops ( loop_count/Infinite )
{
send instructions
assignments
change values
send instructions
}
EXAMPLE:
LOOP( 50 )
{
"CHAIN (ONE)"
"CHAIN (TWO)"
Some_Frame
$Y = Some_Frame { Data = 256, 0xFEFEFEFE }
Y
Change Y { Field32 = x }
Y
Y
}
176
LeCroy Corporation
SATASuite User Manual
Version 6.25
SATrainer Generation Commands
General
Commands
IDLE (n)
Generator will insert n idle dwords into gen stream
CLEAR_CREDIT_AVAIL
This commands clears the credit established with the command
WF_CREDIT_AVAIL. (See WF_CREDIT_AVAIL in following section
on Wait Commands for explanation).
RD_POS
Generator will insert one idle dword into gen stream, which will bring
current RD to positive level
RD_NEG
Generator will insert one idle dword into gen stream, which will bring
current RD to negative level
RD_ERROR
Generator will insert one idle dword into gen stream, which will
intentionally break RD sequence creating RD error
CONNECT
Generator will go through connection sequence using current
GenFile settings (gen mode, speed e.t.c.) Generation will not
resume until connection is established
DISCONNECT
Generator will break existing connection to DUT
PAUSE
Generator will come to a break and the user will be able to resume
generation by pressing Resume button on Generation toolbar.
Generator shall transmit idle dwords while in the Pause.
OUTPUT_ON
Takes the Trainer out of Electric Idle state. If it is already out of
Electric Idle, this is a NOP.
OOB Commands
LeCroy Corporation
COMINIT
Generator will send COMINIT OOB signals using current COMINIT
settings.
COMRESET
Generator will send COMRESET OOB signals using current
COMRESET settings.
COMWAKE
Generator will send COMWAKE OOB signals using current
COMWAKE settings.
COMSAS
Generator will send COMSAS OOB signals using current COMSAS
settings.
SATA_ALIGN
Generator will go through SATA_ALIGN stage of SATA SpeedNeg
process using current SATA_ALIGN settings.
SATA_D10_2
Generator will go through SATA_D10_2 stage of SATA SpeedNeg
process using current SATA_D10_2 settings.
SPEED_NEG_RCDT
Generator will go through SPEED_NEG_RCDT stage of SAS
SpeedNeg process using current SPEED_NEG_RCDT settings.
177
Version 6.25
SATA
Commands
178
SATASuite User Manual
SPEED_NEG_ALIGN0
Generator will go through SPEED_NEG_ALIGN0 stage of SAS
SpeedNeg process using current SPEED_NEG_ALIGN0 settings.
SPEED_NEG_ALIGN1
Generator will go through SPEED_NEG_ALIGN1 stage of SAS
SpeedNeg process using current SPEED_NEG_ALIGN1 settings.
Look at STP sample file for syntax.
•
SEND_SATA_FRAME
•
SendSATAFrame
•
SATAData
•
SATA_Data
•
SATACRC
•
SATA_CRC
•
SATAXXXX
•
SATA_XXXX
LeCroy Corporation
SATASuite User Manual
Primitive
Commands
LeCroy Corporation
Version 6.25
The following is a list of SAS and SATA primitives declared in "Primitives.Decl.inc" as
Symbol Chains. If you want to use these primitives in your script you must also include
"Primitives.Decl.inc" in your script.
•
SOF
•
EOF
•
SOAF
•
EOAF
•
ALIGN (0)
•
ALIGN (1)
•
ALIGN (2)
•
ALIGN (3)
•
NOTIFY (ENABLE SPINUP)
•
NOTIFY (RESERVED 0)
•
NOTIFY (RESERVED 1)
•
NOTIFY (RESERVED 2)
•
ACK
•
NAK (CRC ERROR)
•
NAK (RESERVED 0)
•
NAK (RESERVED 1
•
NAK (RESERVED 2)
•
CREDIT_BLOCKED
•
RRDY (NORMAL)
•
RRDY (RESERVED 0)
•
RRDY (RESERVED 1)
•
SATA_SOF
•
SATA_EOF
•
SATA_CONT
•
SATA_DMAT
•
SATA_HOLD
•
SATA_HOLDA
•
SATA_PMACK
•
SATA_PMNAK
•
SATA_PMREQ_P
•
SATA_PMREQ_S
•
SATA_R_ERR
•
SATA_R_IP
•
SATA_R_OK
•
SATA_R_RDY
•
SATA_SYNC
•
SATA_WTRM
•
SATA_X_RDY
179
Version 6.25
180
SATASuite User Manual
•
SATA_ERROR
•
AIP (NORMAL)
•
AIP (RESERVED 0)
•
AIP (RESERVED 1)
•
AIP (RESERVED 2)
•
AIP (RESERVED WAITING ON PARTIAL)
•
AIP (WAITING ON CONNECTION)
•
AIP (WAITING ON DEVICE)
•
AIP (WAITING ON PARTIAL)
•
BREAK
•
BROADCAST (CHANGE)
•
BROADCAST (RESERVED 0)
•
BROADCAST (RESERVED 1)
•
BROADCAST (RESERVED 2)
•
BROADCAST (RESERVED 3)
•
BROADCAST (RESERVED 4)
•
BROADCAST (RESERVED CHANGE 0)
•
BROADCAST (RESERVED CHANGE 1)
•
CLOSE (CLEAR AFFILIATION)
•
CLOSE (NORMAL)
•
CLOSE (RESERVED 0)
•
CLOSE (RESERVED 1)
•
ERROR
•
HARD_RESET
•
OPEN_ACCEPT
•
OPEN_REJECT (BAD DESTINATION)
•
OPEN_REJECT (CONNECTION RATE NOT SUPPORTED)
•
OPEN_REJECT (NO DESTINATION)
•
OPEN_REJECT (PATHWAY BLOCKED)
•
OPEN_REJECT (PROTOCOL NOT SUPPORTED)
•
OPEN_REJECT (RESERVED ABANDON 0)
•
OPEN_REJECT (RESERVED ABANDON 1)
•
OPEN_REJECT (RESERVED ABANDON 2)
•
OPEN_REJECT (RESERVED ABANDON 3)
•
OPEN_REJECT (RESERVED CONTINUE 0)
•
OPEN_REJECT (RESERVED CONTINUE 1)
•
OPEN_REJECT (RESERVED INITIALIZE 0)
•
OPEN_REJECT (RESERVED INITIALIZE 1)
•
OPEN_REJECT (RESERVED STOP 0)
•
OPEN_REJECT (RESERVED STOP 1)
•
OPEN_REJECT (RETRY)
LeCroy Corporation
SATASuite User Manual
LeCroy Corporation
Version 6.25
•
OPEN_REJECT (STP RESOURCES BUSY)
•
OPEN_REJECT (WRONG DESTINATION)
•
DONE (ACK/NAK TIMEOUT)
•
DONE (CREDIT TIMEOUT)
•
DONE (NORMAL)
•
DONE (RESERVED 0)
•
DONE (RESERVED 1)
•
DONE (RESERVED TIMEOUT 0)
•
DONE (RESERVED TIMEOUT 1)
•
SAS Specific Script-Defined Constants
•
SAS_AF_DT_NO_DEVICE_ATTACHED
•
SAS_AF_DT_END_DEVICE
•
SAS_AF_DT_EDGE_EXPANDER_DEVICE
•
SAS_AF_DT_FANOUT_EXPANDER_DEVICE
•
SAS_AF_FT_IDENTIFY
•
SAS_AF_FT_OPEN
•
SAS_AF_PROTOCOL_SMP
•
SAS_AF_PROTOCOL_SSP
•
SAS_AF_PROTOCOL_STP
•
SAS_AF_PROTOCOL_UNKNOWN
•
SAS_AF_RATE_1_5_GBPS
•
SAS_AF_RATE_3_GBPS
•
SMP_FRAME_TYPE_REQUEST
•
SMP_FRAME_TYPE_RESPONSE
•
SMP_REPORT_GENERAL
•
SMP_REPORT_MANUFACTURER_INFO
•
SMP_DISCOVER
•
SMP_REPORT_PHY_ERROR_LOG
•
SMP_REPORT_PHY_SATA
•
SMP_REPORT_ROUTE_INFO
•
SMP_CONFIGURE_ROUTE_INFO
•
SMP_PHY_CONTROL
•
SSP_FRAME_TYPE_DATA
•
SSP_FRAME_TYPE_XFER_RDY
•
SSP_FRAME_TYPE_COMMAND
•
SSP_FRAME_TYPE_RESPONSE
•
SSP_FRAME_TYPE_TASK
•
SSP_FRAME_TYPE_VENDOR
181
Version 6.25
Wait
Commands
SATASuite User Manual
Syntax: WAIT_FOR { <command1> <command2> ... <group1> <group2> ... }
WaitCommand Name
WF_TIMEOUT
Description
Timeout Credit Available
When WF_TIMEOUT is requested in WAIT_FOR command
the wait session will be released after timeout has elapsed.
The Timeout value can be set two different ways:
1. Through the global WaitTimeout setting that can appear
anywhere in generation. Default value is 1000 microseconds.
Syntax:
Set WaitTimeout = <value> (in microseconds)
2. Through local WaitTimeout value for this specific wait
session.
Syntax:
WAIT_FOR ( <number_of_microseconds> ) {
WF_TIMEOUT <other_wait_commands> }
In this case wait for other commands will be released no
later then after number_of_microseconds, but global WaitTimeout value remains unchanged for future use.
See Generation\Include\
WaitCommands.inc in your SASTracer program folder for
the samples of syntax.
182
WF_SOF
primitive
WF_EOF
primitive
WF_SOAF
primitive
WF_EOAF
primitive
WF_ACK
primitive
WF_NAK_CRC_ERROR
primitive
WF_NAK_RESERVED_0
primitive
WF_NAK_RESERVED_1
primitive
WF_NAK_RESERVED_2
primitive
LeCroy Corporation
SATASuite User Manual
Version 6.25
WaitCommand Name
WF_CREDIT_AVAIL
Description
Credit Available
This function is based on a 10-bit counter whose value can
range from -512 to +511 (twos-complement). This counter
is cleared by sending or receiving an OPEN_ACCEPT
primitive, or by execution of a CLEAR_CREDIT_AVAIL
command in the script.
This counter is incremented by receiving any SAS RRDY
primitive and is decremented by sending SAS SOF. The
wait_for command will wait for this counter to have a positive value between +1 and +511. This wait_for condition is
intended to be used before sending a SAS frame within a
connection.
ClEAR_CREDIT_AVAIL clears this credit function.
WF_CREDIT_BLOCKED_R CreditBlocked Received
ECEIVED
This function is based on a flip-flop which is cleared by
sending or receiving an OPEN_ACCEPT primitive. It is set
by receiving a CREDIT_BLOCKED primitive. It is intended
to be used in conjunction with wf_credit_avail to prevent
script hangs in those cases where there is not going to be
any more credit granted.
WF_CREDIT_BLOCKED
primitive
WF_RRDY_NORMAL
primitive
WF_RRDY_RESERVED_0
primitive
WF_RRDY_RESERVED_1
primitive
WF_BREAK
primitive
WF_CLOSE_CLEAR_
AFFILIATION
primitive
WF_CLOSE_NORMAL
primitive
WF_CLOSE_RESERVED_0
primitive
WF_CLOSE_RESERVED_1
primitive
WF_DONE_ACK_NAK_
TIMEOUT
primitive
LeCroy Corporation
183
Version 6.25
SATASuite User Manual
WaitCommand Name
184
Description
WF_DONE_CREDIT_
TIMEOUT
primitive
WF_DONE_NORMAL
primitive
WF_DONE_RESERVED_0
primitive
WF_DONE_RESERVED_1
primitive
WF_DONE_RESERVED_
TIMEOUT_0
primitive
WF_DONE_RESERVED_
TIMEOUT_1
primitive
WF_ERROR
primitive
WF_HARD_RESET
primitive
WF_AIP_NORMAL
primitive
WF_AIP_RESERVED_0
primitive
WF_AIP_RESERVED_1
primitive
WF_AIP_RESERVED_2
primitive
WF_AIP_RESERVED_WAIT
_ON_PART
primitive
WF_AIP_WAIT_ON_CONN
primitive
WF_AIP_WAIT_ON_
DEVICE
primitive
WF_AIP_WAIT_ON_
PARTIAL
primitive
WF_IDENTIFY_FRAME
Identify Address Frame
WF_OPEN_FRAME
Open Address Frame
WF_SMP_REQUEST
SMP Request Frame
WF_SMP_RESPONSE
SMP Response Frame
LeCroy Corporation
SATASuite User Manual
Version 6.25
WaitCommand Name
Description
WF_REC_RESOURCES_
OUTPUT_A
Advanced Wait Condition A
This command causes generation to wait for Event "A" to
occur that you defined in the Generation Options dialog
described at the end of this chapter.
WF_REC_RESOURCES_
OUTPUT_B
Advanced Wait Condition B
This command causes generation to wait for Event "B" to
occur that you defined in the Generation Options dialog
described at the end of this chapter.
WF_REC_RESOURCES_
OUTPUT_C
Advanced Wait Condition C
This command causes generation to wait for Event "C" to
occur that you defined in the Generation Options dialog
described at the end of this chapter.
WF_REC_RESOURCES_
OUTPUT_D
Advanced Wait Condition D
This command causes generation to wait for Event "D" to
occur that you defined in the Generation Options dialog
described at the end of this chapter.
WF_REC_RESOURCES_
OUTPUT_E
Advanced Wait Condition E
This command causes generation to wait for Event "E" to
occur that you defined in the Generation Options dialog
described at the end of this chapter.
WF_REC_RESOURCES_
OUTPUT_F
Advanced Wait Condition F
This command causes generation to wait for Event "F" to
occur that you defined in the Generation Options dialog
described at the end of this chapter.
WF_COMRESET_COMINIT
COMRESET OOB Signals
WF_COMSAS
COMSAS OOB Signals
WF_COMWAKE
COMWAKE OOB Signals
WF_BLOCK1_MISC_
RESERVED_0
reserved
WF_BLOCK1_MISC_
RESERVED_1
reserved
WF_BLOCK1_MISC_
RESERVED_2
reserved
WF_BLOCK1_MISC_
RESERVED_3
reserved
LeCroy Corporation
185
Version 6.25
SATASuite User Manual
WaitCommand Name
186
Description
WF_BLOCK1_MISC_
RESERVED_4
reserved
WF_SATA_CONT
primitive
WF_SATA_DMAT
primitive
WF_SATA_EOF
primitive
WF_SATA_ERROR
primitive
WF_SATA_HOLD
primitive
WF_SATA_HOLDA
primitive
WF_SATA_PMACK
primitive
WF_SATA_PMNAK
primitive
WF_SATA_PMREQ_P
primitive
WF_SATA_PMREQ_S
primitive
WF_SATA_R_ERR
primitive
WF_SATA_R_IP
primitive
WF_SATA_R_OK
primitive
WF_SATA_R_RDY
primitive
WF_SATA_SOF
primitive
WF_SATA_SYNC
primitive
WF_SATA_WTRM
primitive
WF_SATA_X_RDY
primitive
WF_OPEN_ACCEPT
primitive
WF_OPEN_REJECT_
BAD_DESTINATION
primitive
WF_OPEN_REJECT_
CONN_RATE_NOT_
SUPPORTED
primitive
WF_OPEN_REJECT_
NO_DESTINATION
primitive
WF_OPEN_REJECT_
PATHWAY_BLOCKED
primitive
LeCroy Corporation
SATASuite User Manual
Version 6.25
WaitCommand Name
Description
WF_OPEN_REJECT_
PROTOCOL_NOT_
SUPPORTED
primitive
WF_OPEN_REJECT_
RETRY
primitive
WF_OPEN_REJECT_
STP_RESOURCES_BUSY
primitive
WF_OPEN_REJECT_
WRONG_DESTINATION
primitive
WF_OPEN_REJECT_
RESERVED_ABANDON_0
primitive
WF_OPEN_REJECT_
RESERVED_ABANDON_1
primitive
WF_OPEN_REJECT_
RESERVED_ABANDON_2
primitive
WF_OPEN_REJECT_
RESERVED_ABANDON_3
primitive
WF_OPEN_REJECT_
RESERVED_CONTINUE_0
primitive
WF_OPEN_REJECT_
RESERVED_CONTINUE_1
primitive
WF_OPEN_REJECT_
RESERVED_INITIALIZE_0
primitive
WF_OPEN_REJECT_
RESERVED_INITIALIZE_1
primitive
WF_OPEN_REJECT_
RESERVED_STOP_0
primitive
WF_OPEN_REJECT_
RESERVED_STOP_1
primitive
WF_ALIGN_0
primitive
WF_ALIGN_1
primitive
WF_ALIGN_2
primitive
WF_ALIGN_3
primitive
LeCroy Corporation
187
Version 6.25
SATASuite User Manual
WaitCommand Name
188
Description
WF_NOTIFY_ENABLE_
SPINUP
primitive
WF_NOTIFY_RESERVED_0
primitive
WF_NOTIFY_RESERVED_1
primitive
WF_NOTIFY_RESERVED_2
primitive
WF_BROADCAST_
CHANGE
primitive
WF_BROADCAST_
RESERVED_0
primitive
WF_BROADCAST_
RESERVED_1
primitive
WF_BROADCAST_
RESERVED_2
primitive
WF_BROADCAST_
RESERVED_3
primitive
WF_BROADCAST_
RESERVED_4
primitive
WF_BROADCAST_
RESERVED_CHANGE_0
primitive
WF_BROADCAST_
RESERVED_CHANGE_1
primitive
WF_BLOCK2_MISC_
RESERVED_0
reserved
WF_BLOCK2_MISC_
RESERVED_1
reserved
LeCroy Corporation
SATASuite User Manual
Wait
Command
Groups
Version 6.25
Wait Command Group
Group Contents
WF_TIMEOUT
WF_TIMEOUT_BLOCK_ONE
WF_TIMEOUT_BLOCK_TWO
WF_ALL_SOF
WF_SOF
WF_SOAF
WF_ALL_EOF
WF_EOF
WF_SOAF
WF_NAK
WF_NAK_CRC_ERROR
WF_NAK_RESERVED_0
WF_NAK_RESERVED_1
WF_NAK_RESERVED_2
WF_RRDY
WF_RRDY_NORMAL
WF_RRDY_RESERVED_0
WF_RRDY_RESERVED_1
WF_CREDIT_OK
WF_CREDIT_AVAIL
WF_CREDIT_BLOCKED_RECEIVED
WF_CLOSE
WF_CLOSE_CLEAR_AFFILIATION
WF_CLOSE_NORMAL
WF_CLOSE_RESERVED_0
WF_CLOSE_RESERVED_1
LeCroy Corporation
189
Version 6.25
SATASuite User Manual
Wait Command Group
WF_DONE
Group Contents
WF_DONE_ACK_NAK_TIMEOUT
WF_DONE_CREDIT_TIMEOUT
WF_DONE_NORMAL
WF_DONE_RESERVED_0
WF_DONE_RESERVED_1
WF_DONE_RESERVED_TIMEOUT_0
WF_DONE_RESERVED_TIMEOUT_1
WF_AIP
WF_AIP_NORMAL
WF_AIP_RESERVED_0
WF_AIP_RESERVED_1
WF_AIP_RESERVED_2
WF_AIP_RESERVED_WAIT_ON_PART
WF_AIP_WAIT_ON_CONN
WF_AIP_WAIT_ON_DEVICE
WF_AIP_WAIT_ON_PARTIAL
WF_REC_RESOURCES
WF_REC_RESOURCES_OUTPUT_A
WF_REC_RESOURCES_OUTPUT_B
WF_REC_RESOURCES_OUTPUT_C
WF_REC_RESOURCES_OUTPUT_D
WF_REC_RESOURCES_OUTPUT_E
WF_REC_RESOURCES_OUTPUT_F
WF_RCV_STATUS
WF_SATA_R_ERR
WF_SATA_R_OK
WF_PM_REQ
WF_SATA_PMREQ_P
WF_SATA_PMREQ_S
190
LeCroy Corporation
SATASuite User Manual
Version 6.25
Wait Command Group
WF_PM_STATUS
Group Contents
WF_SATA_PMACK
WF_SATA_PMNAK
WF_OPEN_REJECT
WF_OPEN_REJECT_BAD_DESTINATION
WF_OPEN_REJECT_CONN_RATE_NOT_SUPPORTED
WF_OPEN_REJECT_NO_DESTINATION
WF_OPEN_REJECT_PATHWAY_BLOCKED
WF_OPEN_REJECT_PROTOCOL_NOT_SUPPORTED
WF_OPEN_REJECT_RETRY
WF_OPEN_REJECT_STP_RESOURCES_BUSY
WF_OPEN_REJECT_WRONG_DESTINATION
WF_OPEN_REJECT_RESERVED_ABANDON_0
WF_OPEN_REJECT_RESERVED_ABANDON_1
WF_OPEN_REJECT
(continued...)
WF_OPEN_REJECT_RESERVED_ABANDON_2
WF_OPEN_REJECT_RESERVED_ABANDON_3
WF_OPEN_REJECT_RESERVED_CONTINUE_0
WF_OPEN_REJECT_RESERVED_CONTINUE_1
WF_OPEN_REJECT_RESERVED_INITIALIZE_0
WF_OPEN_REJECT_RESERVED_INITIALIZE_1
WF_OPEN_REJECT_RESERVED_STOP_0
WF_OPEN_REJECT_RESERVED_STOP_1
WF_OPEN_RESPONSE
WF_OPEN_ACCEPT
WF_OPEN_REJECT
WF_ALIGN
WF_ALIGN_0
WF_ALIGN_1
WF_ALIGN_2
WF_ALIGN_3
LeCroy Corporation
191
Version 6.25
SATASuite User Manual
Wait Command Group
WF_NOTIFY
Group Contents
WF_NOTIFY_ENABLE_SPINUP
WF_NOTIFY_RESERVED_0
WF_NOTIFY_RESERVED_1
WF_NOTIFY_RESERVED_2
WF_BROADCAST
WF_BROADCAST_CHANGE
WF_BROADCAST_RESERVED_0
WF_BROADCAST_RESERVED_1
WF_BROADCAST_RESERVED_2
WF_BROADCAST_RESERVED_3
WF_BROADCAST_RESERVED_4
WF_BROADCAST_RESERVED_CHANGE_0
WF_BROADCAST_RESERVED_CHANGE_1
192
LeCroy Corporation
SATASuite User Manual
Version 6.25
Predefined
Constants
Predefined Constant
LeCroy Corporation
Internal Value
GEN_MODE_ERROR
0
GEN_MODE_SATA_HOST
1
GEN_MODE_SATA_DEVICE
2
GEN_MODE_SAS_INITIATOR
3
GEN_MODE_SAS_TARGET
4
GEN_LINK_SPEED_1_5G
0
GEN_LINK_SPEED_3G
1
SCRAMBLING_MODE_NONE
0
SCRAMBLING_MODE_SAS
1
SCRAMBLING_MODE_SATA
2
193
Version 6.25
SATASuite User Manual
Generation
Settings
Setting
Default
Value
Description
Global Settings
GenerationMode
>>>>>
Generation Mode - must be defined or no
generation will take place. Possible Values:
GEN_MODE_SATA_HOST
GEN_MODE_SATA_DEVICE
GEN_MODE_SAS_INITIATOR
GEN_MODE_SAS_TARGET
Default Value: GEN_MODE_ERROR undefined mode
SSC
0
Spread Spectrum Clocking mode for SATA.
Can only be set outside Generation block.
MultiSpeedMode
0
When set, the change of speed within
Generation block is allowed with following
syntax: set Speed = LINK_SPEED_1_5G /
LINK_SPEED_3G.
Output Disable
0
This very poorly named register bit forces the
Trainer to output data. It is a little like the
output_on script command except that its
effect cannot be undone for the duration of the
script. If this is turned on, none of the
out-of-band commands will work, as the output
enable is forced on.
AutoOOBMode
0
When set, the generator will go through the
stages of bringing up the link automatically,
including waiting for and responding to the
device or host it is connected to.
AutoHoldMode
0
When set, the generator will respond
automatically to Hold requests. Not supported
for version 1.1 (reserved).
AutoDMAT
0
When set, the generator will respond
automatically to DMAT requests. Not
supported for version 1.1 (reserved).
AutoHandshake
0
When set, the generator will respond
automatically to TBD commands. Not
supported for version 1.1 (reserved).
AutoMode Settings
194
LeCroy Corporation
SATASuite User Manual
Version 6.25
Setting
Default
Value
Description
AutoSpeedNeg
0
When set, the generator will automatically go
throughthe speed negotiation process, for the
speed set in the PINTERFACEC_SERDES
register for the Trainer.
AutoAlignSATA
0
When set, the generator will automatically
inserting the stream 2 Align(0) primitives every
254 dwords, as specified in the SATA spec.
AutoAlignSAS
0
When set, the generator will automatically
inserting the stream Align primitives every
2048 dwords, as specified in the SAS
spec.Two Align modes can be turned on
simultaneously, to support STP
COMINIT_NegLen
800
The number of bursts to send as part of this
OOB type.Each Burst is followed by an Idle.
The Burst-Idle pairs are repeated the
requested number of times, and then followed
by the Negation_length of Idle.
COMINIT_IdleLen
480
Burst time between each OOB idle in
OOBIs.During the specified period, the
generator will send ALIGN(0) at the specified
speed.
COMINIT_BurstLen
160
Idle time between each OOB burst in
OOBIs.During the specified period, the
generator will keep the line at electric idle.
COMINIT_NumBursts
6
Negation time at the end of the OOB signal in
OOBIs.During the specified period, the
generator will keep the line at electric idle.
COMINIT Settings
LeCroy Corporation
195
Version 6.25
SATASuite User Manual
Setting
Default
Value
Description
COMWAKE Settings
COMWAKE_NegLen
280
The number of bursts to send as part of this
OOB type.Each Burst is followed by an Idle.
The Burst-Idle pairs are repeated the
requested number of times, and then followed
by the Negation_length of Idle.
COMWAKE_IdleLen
160
Burst time between each OOB idle in
OOBIs.During the specified period, the
generator will send ALIGN(0) at the specified
speed.
COMWAKE_BurstLen
160
Idle time between each OOB burst in
OOBIs.During the specified period, the
generator will keep the line at electric idle.
COMWAKE_NumBursts
6
Negation time at the end of the OOB signal in
OOBIs.During the specified period, the
generator will keep the line at electric idle.
COMSAS_NegLen
2400
The number of bursts to send as part of this
OOB type.Each Burst is followed by an Idle.
The Burst-Idle pairs are repeated the
requested number of times, and then followed
by the Negation_length of Idle.
COMSAS_IdleLen
1440
Burst time between each OOB idle in
OOBIs.During the specified period, the
generator will send ALIGN(0) at the specified
speed.
COMSAS_BurstLen
160
Idle time between each OOB burst in
OOBIs.During the specified period, the
generator will keep the line at electric idle.
COMSAS_NumBursts
6
Negation time at the end of the OOB signal in
OOBIs.During the specified period, the
generator will keep the line at electric idle.
COMSAS Settings
196
LeCroy Corporation
SATASuite User Manual
Version 6.25
Setting
Default
Value
Description
SATA Link Init Settings
OOB_SATA_D102_Time
100000
D10.2 time for SATA link synchronization in
OOBIs.During the specified period, the
generator will transmit D10.2 symbols.
OOB_SATA_Align_Time
100000
ALIGN(0) time for SATA link synchronization in
OOBIs.During the specified period, the
generator will transmit ALIGN(0) primitives.
SAS Speed Negotiation Settings
OOB_SAS_Align1_Time
81920
ALIGN(1) time for SAS speed negotiation in
OOBIs.During the specified period, the
generator will transmit ALIGN(1) primitives.
OOB_SAS_Align0_Time
81920
ALIGN(0) time for SAS speed negotiation in
OOBIs.During the specified period, the
generator will transmit ALIGN(0) primitives.
OOB_SAS_Interspeed_
Time
750000
Interspeed time for SAS speed negotiation in
OOBIs.During the specified period, the
generator will keep the line at electric idle.
SATA Speed Negotiation Settings
OOB_SpeedNeg_RCDT
750000
Maximum time in OOBIs during the speed
negotiation window for a transmitter to reply
with ALIGN(1).
OOB_SpeedNeg_SNTT
163840
Time in OOBIs during which ALIGN(0) or
ALIGN(1) is transmitted at each physical link
rate during the speed negotiation sequence.
OOB_SpeedNeg_SNLT
153600
Time in OOBIs during which the transmitter
shall transmit idle between rates during speed
negotiation.
Speed
>>>>>
Link Speed Possible Values:
LINK_SPEED_1_5G LINK_SPEED_3G
Default Value: LINK_SPEED_1_5G
RateMatching
0
When set, the generator will automatically
inserting the stream Align(0) primitive after
every dword.
Speed Settings
LeCroy Corporation
197
Version 6.25
SATASuite User Manual
Setting
Default
Value
Description
Scrambling Mode Settings
ScramblingMode
>>>>>
Raw Data Scrambling Mode - Only those raw
dwords will be scrambled that contain only
data bytes (no 10bit symbols or 'K' bytes.
Scrambling is reset by changing
ScramblingMode or by any valid SAS or SATA
frame. Possible Values:
SCRAMBLING_MODE_NONE
SCRAMBLING_MODE_SAS
SCRAMBLING_MODE_SATA Default Value:
SCRAMBLING_MODE_NONE
1000
Sets global WaitTimeout value in
microseconds
Wait Timeout Settings
WaitTimeout
AUTO_WAIT_SAS_AFTER Settings
198
AUTO_WAIT_SAS_
AFTER_
CLOSE_FOR_CLOSE
FALSE
When set, the generator will insert WAIT_FOR
CLOSE command immediately after each
CLOSE primitive.
AUTO_WAIT_SAS_
AFTER_EOF_FOR_ACK
FALSE
When set, the generator will insert WAIT_FOR
ACK command immediately after each EOF
primitive.
AUTO_WAIT_SAS_
AFTER_EOF_FOR_
ACK_OR_NAK
FALSE
When set, the generator will insert WAIT_FOR
ACK or NAK command immediately after each
EOF primitive.
AUTO_WAIT_SAS_
AFTER_OPEN_FOR_
OPEN_ACCEPT
FALSE
When set, the generator will insert WAIT_FOR
OPEN_ACCEPT command immediately after
each Open Address Frame.
AUTO_WAIT_SAS_
AFTER_OPEN_FOR_
OPEN_REJECT
FALSE
When set, the generator will insert WAIT_FOR
OPEN_REJECT command immediately after
each Open Address Frame.
AUTO_WAIT_SAS_
AFTER_IDENTIFY_
FOR_IDENTIFY_
FRAME
FALSE
When set, the generator will insert WAIT_FOR
Identify Frame command immediately after
each Identify Address Frame.
AUTO_WAIT_SAS_
AFTER_SMP_REQ_
FOR_RESP
FALSE
When set, the generator will insert WAIT_FOR
SMP Response Frame command immediately
after each SMP Request Frame.
LeCroy Corporation
SATASuite User Manual
Version 6.25
Setting
Default
Value
Description
AUTO_WAIT_SAS_BEFORE Settings
AUTO_WAIT_SAS_
BEFORE_
CLOSE_FOR_CLOSE
FALSE
When set, the generator will insert WAIT_FOR
CLOSE command right before each CLOSE
primitive.
AUTO_WAIT_SAS_
BEFORE_
SOF_FOR_CREDIT
FALSE
When set, the generator will insert WAIT_FOR
CREDIT command right before each SOF
primitive.
AUTO_WAIT_SAS_
BEFORE_
IDENTIFY_FOR_
IDENTIFY_FRAME
FALSE
When set, the generator will insert WAIT_FOR
Identify Frame command right before each
Identify Address Frame.
AUTO_WAIT_SAS_
BEFORE_OPEN_
ACCEPT_FOR_OPEN
FALSE
When set, the generator will insert WAIT_FOR
Open Frame command right before each
OPEN_ACCEPT primitive.
AUTO_WAIT_SAS_
BEFORE_OPEN_
REJECT_FOR_OPEN
FALSE
When set, the generator will insert WAIT_FOR
Open Frame command right before each
OPEN_REJECT primitive.
AUTO_WAIT_SAS_
BEFORE_AIP_FOR_
OPEN
FALSE
When set, the generator will insert WAIT_FOR
Open Frame command right before each
primitive of AIP group.
AUTO_WAIT_SAS_
BEFORE_
SMP_RESP_FOR_REQ
FALSE
When set, the generator will insert WAIT_FOR
SMP Request Frame command right before
each SMP Response Frame.
AUTO_WAIT_SATA_AFTER Settings
LeCroy Corporation
AUTO_WAIT_SATA_
AFTER_X_RDY_FOR_
R_RDY
FALSE
When set, the generator will insert WAIT_FOR
SATA_R_RDY command immediately after
each case of SATA_CONT primitive following
SATA_X_RDY primitive.
AUTO_WAIT_SATA_
AFTER_
WTRM_FOR_STATUS
FALSE
When set, the generator will insert WAIT_FOR
SATA_R_ERR or SATA_R_OK command
immediately after each case of SATA_CONT
primitive following SATA_WTRM primitive.
AUTO_WAIT_SATA_
AFTER_PMREQ_S_
FOR_RESPONSE
FALSE
When set, the generator will insert WAIT_FOR
SATA_PMACK or SATA_PMNAK command
immediately after each case of SATA_CONT
primitive following SATA_PMREQ_S primitive.
199
Version 6.25
SATASuite User Manual
Setting
Default
Value
Description
AUTO_WAIT_SATA_
AFTER_PMREQ_P_
FOR_RESPONSE
FALSE
When set, the generator will insert WAIT_FOR
SATA_PMACK or SATA_PMNAK command
immediately after each case of SATA_CONT
primitive following SATA_PMREQ_P primitive.
AUTO_WAIT_SATA_
AFTER_
SYNC_FOR_SYNC
FALSE
When set, the generator will insert WAIT_FOR
SATA_SYNC command immediately after
each case of SATA_CONT primitive following
SATA_SYNC primitive.
AUTO_WAIT_SATA_BEFORE Settings
200
AUTO_WAIT_SATA_
BEFORE_
PMACK_FOR_PMREQ
FALSE
When set, the generator will insert WAIT_FOR
SATA_PMREQ_S or SATA_PMREQ_P
command right before each SATA_PMACK
primitive.
AUTO_WAIT_SATA_
BEFORE_
PMNAK_FOR_PMREQ
FALSE
When set, the generator will insert WAIT_FOR
SATA_PMREQ_S or SATA_PMREQ_P
command right before each SATA_PMNAK
primitive.
AUTO_WAIT_SATA_
BEFORE_
RERR_FOR_WTRM
FALSE
When set, the generator will insert WAIT_FOR
SATA_R_ERR command right before each
SATA_WTRM primitive.
AUTO_WAIT_SATA_
BEFORE_
ROK_FOR_WTRM
FALSE
When set, the generator will insert WAIT_FOR
SATA_R_OK command right before each
SATA_WTRM primitive.
AUTO_WAIT_SATA_
BEFORE_RIP_FOR_
SOF
FALSE
When set, the generator will insert WAIT_FOR
SATA_R_IP command right before each
SATA_SOF primitive.
AUTO_WAIT_SATA_
BEFORE_
R_RDY_FOR_X_RDY
FALSE
When set, the generator will insert WAIT_FOR
SATA_X_RDY command right before each
SATA_R_RDY primitive.
LeCroy Corporation
SATASuite User Manual
Version 6.25
Setting Complex "Wait For" Conditions
The Generation Options dialog lets users define complex "Wait For" events and assign a
letter value ("A" through "F") to the definition so that you can refer to the definition by letter
instead of by textual name.
Once a letter value has been assigned to an event, the letter is referred to in your
generation script using the following command syntax:
Wait_For {WF_REC_RESOURCES_OUTPUT_A}
where "A," in this case, is the defined condition.
Setting
Conditions
with the
Generation
Options
Dialog
To set a complex condition, open the Generation Options dialog:
Step 1 Select Generate > Generation Options from the menu. The
Generation Options dialog opens. The Generation Options
dialog looks very similar to the Recording Rules dialog:
Step 2 Click the New Events button and select an event from the menu.
The selected event should appear in the Available Events area
along the left side of the dialog box.
Step 3 Drag the new event button to the Global State cell.
LeCroy Corporation
201
Version 6.25
SATASuite User Manual
Step 4 Right-click on the new event button and select Specify Action(s). A
menu appears showing the letters A through F and the option "No
action."
Step 5 Select a letter from the menu.
The menu closes. The event
button should now point to a
neighboring button that has the
letter value you assigned.
Step 6 Once the condition has been defined, you can then add the Wait
For command line (with whatever letter you assigned) to your
script. For example:
Wait_For {WF_REC_RESOURCES_OUTPUT_A}
202
LeCroy Corporation
SATASuite User Manual
Version 6.25
Chapter 13: SATracker Systems
The SATracker Command Analyzer option for SATracer systems is designed to track
commands in a SATA network that can involve up to 8 initiators and up to 128 targets.
Within this matrix, SATracker will track all commands issued and completed, included
queue depths up to 16 bits.
Product Configurations
SATracker capability is supported on the same hardware modules that support SATracer
systems (see “Analyzer Hardware Description” on page 7). Running the SATracer option
uses a different BusEngine and cannot operate simultaneously with SATracer on the
same CATC 10K system. A simple menu selection converts back and forth between the
two capabilities.
Theory of Operation
The SATracker Command Analyzer option monitors traffic and identifies all new
commands issued and command completions sent in an active SATA environment.
Every command issued is tracked, and when any command exceeds a user-defined
timeout (which can vary based on command type), the system triggers and provides a
Command Log File of up to the last 8 million commands issued.
SATracker monitors live traffic in a SATA network, and each time a command is issued
SATracker records information on that command and begins to track that command to
determine when it is completed, how it is completed, and to trigger on any command that
fails to complete within user-defined timeout periods.
The Command Log File generated by SATracker will contain information about every
command initiated and completed during the session. In addition, the Command Log File
will contain "command fragments" of two types:
Incompletes: Command Start Events that were not completed during the recording
session. These may include commands which exceeded the
user-defined timeout, or simply commands that were issued near the
end of the recording and did not have time to complete before
recording was stopped.
Orphans:
Command End Events that do not correspond to any issued command
that is present in the recording. Called "orphans", these typically occur
when recording is started during live traffic, resulting in command
completions being observed for commands that were issued prior to
the start of recording. Orphans also occur in recordings that "wrap",
where the available memory space has been exceeded and the user
has specified that the recording should continue until a trigger
condition is encountered.
For command timeout purposes, the SATracker Analyzer actively tracks all commands
which have been issued, but for which no Command End Event has yet occurred. Once
a Command End Event that terminates that command has occurred, the command is no
LeCroy Corporation
203
Version 6.25
SATASuite User Manual
longer actively tracked, but the information on that command will still be present in the
Command Log File (provided the Command Log File does not wrap and overwrite the
data).
Note that Command End Events may not all be successful command completions.
Events such as CHECK_CONDITION result in termination of a command in a way
consistent with the SCSI protocol, and will result in the command being terminated
without generating a timeout trigger condition.
When a trigger condition is reached (or when the desired recording size is reached when
in "snapshot" mode), the recording will stop and the Command Log File will be available
for viewing.
Note:
Catastrophic events such as Bus Resets which result in all
commands being terminated are not supported by SATracker.
Installing the SATracker Command Analyzer
The SATracker Command Analyzer option is installed and connected to systems in
exactly the same way as the SATracer Protocol Analyzer (see “Installation” on page 7).
Both systems reside in the traffic pathway on a SATA link.
If not already installed, the SATASuite software should be installed on the host PC as
described in “Installing the SATASuite Software” on page 15.
Changing
the
BusEngine
If the system is being operated as both a SATracer Protocol Analyzer and a SATracker
Command Analyzer, the BusEngine will need to be changed each time the unit is
converted between the two functions. As noted previously, the same hardware can
support both functions, but the two functions cannot coexist at the same time. If both
tracing and tracking are required simultaneously, two separate CATC 10K platforms must
be used.
To check which BusEngine is currently loaded, select the About... option from the Help
menu.
To switch from one BusEngine to the other, select the Switch ... to ... option under the
Setup menu. This option will display whenever a SATrainer or SATracker System is
connected to the host PC. If multiple systems are connected, a selection will show for
each connected analyzer. Make sure that the analyzer you wish to update is connected
to the host PC and is turned on.
204
LeCroy Corporation
SATASuite User Manual
Version 6.25
Once selected, a screen will appear asking you to confirm the choice. Select "Yes".
A progress bar will show the progress of the update.
When the update completes, the analyzer will be restarted and a screen will appear
confirming the update process. Click on "OK".
LeCroy Corporation
205
Version 6.25
SATASuite User Manual
Preparing to Track a Command Sequence
Before starting to track commands with the SATracker Command Analyzer, you should
first set up the recording options by selecting Tracker Options under the Tracker menu
(or under the Setup Menu--but do not use "Recording Options", that selection applies to
SATracer only).
206
Note:
If you have more than one SATracker System attached, you will see
a submenu allowing you to choose whether to set the Tracker
Options for all systems, or for a specific system only.
Note:
In this and the following sections, the menu selections available in
the Tracker menu are also available as icons in the Tracker Toolbar,
as follows:
LeCroy Corporation
SATASuite User Manual
Version 6.25
Tracker Buttons
Start Tracking
Tracker Options (if multiple SATracker
systems are connected, this button is
used for "All Devices" by default).
Stop Tracking
Selecting the Tracker Options menu selection brings up the following screen:
LeCroy Corporation
207
Version 6.25
SATASuite User Manual
Tracking
Type
There are two types of tracking, differentiated by the way the recording is terminated, as
listed below.
•
Manual Trigger: In this mode, recording continues until Stop Tracking is
selected in the Tracker menu. If the recording memory (defined in the
Tracker Archive Memory Size selection) is exceeded, the recording wraps
and recording continues, overwriting the oldest contents of the recording
memory. The recording will continue to wrap (multiple times if necessary)
until the manual trigger is pressed or recording is otherwise stopped.
•
Timeout Trigger: In this mode, recording normally continues until one of the
commands issued fails to complete within the user-defined Trigger Timeout
period. In this mode, recording can also be stopped by using the Stop
Tracking selection in the Tracker menu.
Misc.
Options
Under Miscellaneous Options, there is an option for the SATracker to provide a beep to
alert the user when a trigger occurs.
Tracker
Archive
Memory
Size
Under Tracker Archive Memory Size, the user may decide how large a recording file to
generate by specifying the maximum file size in MB. The maximum value for this setting
is roughly 1024 MB (1 GB). This setting affects when recording is terminated while using
snapshot mode, and affects when recording wraps when using either trigger mode. Each
1MB of recording memory represents information on approximately 10,000 completed
commands.
Time Out
Triggering
Options
Under Time Out Triggering Options, the user may specify the trigger timeout to use with
each of seven command classes. This value in each class may vary from 0 to 32
seconds, and can be specified in integer units of seconds, milliseconds, microseconds or
nanoseconds. Very small values are likely to result in almost immediate termination of
the recording when Timeout Trigger mode is selected.
The seven command classes are as follows:
•
•
•
•
•
•
•
SSP Read
SSP Write
SSP Other (any SSP command other than Read or Write)
SATA Read
SATA Write
SATA Other (any SATA command other than Read or Write)
SMP
Any of the seven command classes can be included as a trigger condition by selecting
the checkbox to the left of the command class. Each selected command class is treated
as a trigger condition such that any command timeout violation in any selected class will
result in the system triggering.
For example, the user may specify that SSP Read commands that fail to complete within
100 microseconds are a trigger condition, but that SSP Write commands are allowed 1
second to complete. This allows the user to "fine tune" the trigger conditions to focus on
specific command classes.
When the system triggers, tracking is stopped and the user is informed that a trigger has
occurred.
208
LeCroy Corporation
SATASuite User Manual
Version 6.25
Command
Log
Filename
Under Command Log Filename & Path, the user can define the name of the file to be
used for storing the recording when completed.
Saving
Tracker
Option
Settings
When a specified set of Tracker Options has been established, the conditions may be
saved by giving the options a name (under Options Name) and then choosing "Save..."
or "Save as Default". A previously saved set of options can be reloaded by selecting the
"Load..." button.
By selecting the "Channel Settings" tab, the following options are displayed:
Speed
Settings
LeCroy Corporation
The SATracker system supports Autodetect Link Rate which is designed to pass through
the speed negotiation signaling allowing the initiator and device to determine the link
speed using the method defined in the SATA specification. In general, this is the most
convenient setting to use because it ensures the traffic will get recorded at the negotiated
rate. Alternatively, users may force the analyzer to record at the 1.5G or 3G rate.
However, if the negotiated link speed is higher or lower than the speed selected in this
tab, SATracker will not decode the traffic properly. The user will know if devices are
negotiating successfully by getting clean recordings.
209
Version 6.25
Channel
Settings
SATASuite User Manual
These options allow you to inhibit recording on a channel by channel basis.
Inhibit - Inhibits recording of traffic from selected channels. For example, if you check
the option for T1, it means "record all channels except for Target channel 1 (T1)."
By selecting the "Advanced Options" tab, the following screen is displayed:
Tracker
Sweeping
Under Tracker Sweeping, the user may select whether to enable sweeping and the
sweeping interval. "Sweeping" refers to the rate at which SATracker checks for
incomplete commands which have exceeded the timeout trigger period. The SATracker
BusEngine divides available processing time between the tasks of (a) processing
incoming commands and command terminations, and (b) monitoring for any commands
that have exceeded the trigger timeout period. If the incoming traffic has a large number
of very short commands with little data interspersed, or has a large number of complex
command termination situations where multiple commands are ended with a single
event, more time may be needed for command processing in order to keep up with the
command flow. In such situations, the user can increase the interval of tracker sweeping
to allow a larger portion of processing time to go towards command processing.
Note:
210
If Tracker Sweeping is disabled but the Timeout Trigger mode is
selected, the SATracker system will still trigger when a Command
End Event occurs that exceeds the defined Timeout Trigger value.
However, in this situation the system will not be able to detect a
timeout trigger due to commands that never receive a Command
End Event (i.e., lost commands).
LeCroy Corporation
SATASuite User Manual
Version 6.25
Viewing Command Log Files
Command Log Files are displayed by SATASuite in a format very similar to trace displays
captured by SATracer (discussed in “Reading a Recording” on page 91).
A typical SATracker Command Log File is shown below.
In this file, we can see a simple set of events (commands and completions) taking place
between one initiator and one target device. The value under the "CMD START" and
"CMD COMPLETE" headings is the Command ID which is assigned by SATracker (when
the command is first issued) as a unique ID number for that particular command.
A more useful way to view this file (and many other SATracker Command Log Files) is to
select the transaction-oriented view by selecting Transport Layer under the View menu.
The resulting view is as follows:
LeCroy Corporation
211
Version 6.25
SATASuite User Manual
In this view, related events are grouped together as commands, and each command can
be expanded to show the Command Start Event and Command End Event, as has been
shown above in Command 2. To expand (or combine) commands, click on the small
arrow in the upper left corner of the "Command XX" box.
When grouped as commands, the command completion time is shown for each
command.
In this display, command fragments (see “Theory of Operation” on page 203) are shown
as individual events that are not grouped into commands. However, if a command has
caused the timeout trigger condition to be violated, that trigger event will be shown as a
command in which the second "event" is a special trigger condition summary. This
situation is illustrated in the following display:
A Command End Event is inserted by the SATracker System when timeouts are detected
and no Command End Event was recorded.
212
LeCroy Corporation
SATASuite User Manual
Version 6.25
In this Command Log File, the command initiated in "Event 12" did not complete, and as
a result the system has indicated this by flagging the event as "TIMED OUT". Expanding
the transaction shows the result as "CMD TIMEOUT" to indicate that no command
completion for this event was present in the Command Log File. A Command End Event
is inserted by the SATracker System to indicate that the trigger condition was violated.
A command may complete with an execution time longer than the trigger timeout period,
but before the system has stopped recording. These late commands will have both a
Command Start Event and a Command End Event, but the execution time still exceeds
the trigger timeout. An example of this is shown in the display below:
This display shows that the Command End Event was recorded, but since the execution
time exceeded the trigger timeout, the command was flagged as "TIMED OUT".
When viewing a large number of commands to determine a timeout violation, use of the
Compact View is helpful. Select Compact from the View menu, or use the Ctrl-Q
keyboard shortcut. The resulting display is shown below.
LeCroy Corporation
213
Version 6.25
SATASuite User Manual
Command Log File Reports
As with trace files collected with SATracer, command log files generated by SATracker
have access to reporting capabilities within the SATASuite program.
One of the more useful reports available for SATracker Command Log Files is the "Bus
Utilization" report, which in the case of SATracker files will show the following:
•
The number of pending commands at all times during the period that the
Command Log File was recording. This display is useful to determine the
outstanding commands that existed at any point in time, and to determine
times at which the number of pending commands was larger than usual for
the system.
•
The command duration for all completed commands contained within the
command log file, shown against the time they occurred within the recorded
trace. This display highlights commands which were taking unusually long
times to complete, and by having this data aligned with the pending
command data mentioned above, the user can determine whether long
command completion times are related to the number of pending commands,
or due to some other effect.
To display the Bus Utilization report, select the Bus Utilization menu selection in the
Report menu, or click the Bus Utilization button
in the Analysis toolbar.
The following graphs are displayed in the bottom half of the screen:
The graph display can be customized to focus on areas of particular interest using the
tools provided in the icons at the top of the graph. By double-clicking at any point within
the graph area, the Command Log File display in the top half of the screen will jump to
that section of the file. For more information on manipulating this display, see “Bus
Utilization” on page 130.
214
LeCroy Corporation
SATASuite User Manual
Version 6.25
Exporting Command Log Files
As with trace files, Command Log Files from SATracker can be exported for use by other
data analysis programs (such as MicroSoft Excel). The data that is exported depends,
to an extent, on the data displayed on the screen.
In the default SATracker display, the timestamps for each event are combined (for
convenience in reading the log file) with the command number, as shown below.
If timestamps are desired in the exported data file, the first step in exporting the data is
to separate the timestamp into its own field. To do this, select Display Options... from
the Setup Menu. Under the "General" tab, change the field marked "Time Stamp
Position" to be "At the beginning", and click "OK". The display will now appear as follows:
In a similar fashion, the user can have some control over the data which is exported by
expanding and/or contracting data files as described in “Expanding and Collapsing
Fields” on page 97.
To export the Command Log File, select Export.. to CSV Format... in the File menu.
The next screen will allow you to specify a filename and location for the exported file, and
also to limit the data exported to some portion of the file if only a portion is required.
LeCroy Corporation
215
Version 6.25
Working
with
Exported
Data Files
SATASuite User Manual
The file type which is exported from SATASuite is a generic text data file (.csv) which can
be imported into many applications. In this example, we will use Microsoft Excel, but the
same procedure can be used with many database and spreadsheet applications.
Once the file has been saved, open Microsoft Excel. Select Open.. from the File menu,
which will bring up a screen allowing you to navigate to the folder in which you saved the
file. (If you have forgotten where you saved the file, go back to the SATASuite program
and select File... Export to CSV Format... again and note which directory and folder
contains the exported file.)
At the bottom of this screen, under "Files of Type:", select "Text Files". This will produce
a display of all .csv files contained in the folder. Click on the correct file to highlight it,
then click on Open.
216
LeCroy Corporation
SATASuite User Manual
Version 6.25
When the file is opened, a large spreadsheet similar the following will appear:
This spreadsheet will have a large number of columns (most of which are blank). This
format is used for all SATASuite data exports, and many of the columns will not have
application to SATracker data files.
The first row of the spreadsheet contains the titles for each column. Remaining rows
contain information on each completed command that was present in the exported data.
Since there are many blank columns (for data values which are not used in SATracker
Command Log Files), these columns can be deleted to simplify the spreadsheet. If a very
large number of events has been exported, it may be difficult to be sure that no data exists
anywhere in a column. In such cases, insert an extra row just below the column titles and
enter a formula similar to "=1000 - COUNTBLANK(A3:A1002)", and copy this value
across all columns. In this example (which assumes 1000 exported events), all blank
columns will show "0" as the result of this function and may be deleted. Any column with
data will show the number of cells that contain data in that column.
Some data is exported as text fields which represent numeric values. For example, the
command completion time will be exported as fields such as "234.245 us" or "3.456 ms".
In order to convert these text fields to values which can be sorted and otherwise
manipulated, create a new column next to the "COMPL TIME" column and enter a
formula such as the following into the first data row of the new column:
=IF(P2="","",IF(RIGHT(P2,2)="ms",1000*VALUE(LEFT(P2,LEN(P2)-3)),
VALUE(LEFT(P2,LEN(P2)-3))))
This formula assumes that the original data value is in cell P2. The formula first checks
to see if P2 contains any data (if not a blank value will be inserted--this is typically the
case for command fragments such as incomplete commands or orphans). If data exists,
the formula determines whether the units used are millisecs ("ms"), in which case it
extracts the numeric value of the cell and multiplies it 1000. If the units are not ms, then
the formula extracts the numeric value as microseconds. The result (for data that
contains only millisec and microsec values), is a column with completion times all in
microseconds.
LeCroy Corporation
217
Version 6.25
SATASuite User Manual
Copy this formula down the length of the column, and all original text data is converted
to numeric data expressed in microseconds.
Note:
If the data fields contain other units such as seconds or nanseconds,
the formula will need to be modified to account for all units used.
The commands in the file can now be sorted in increasing or decreasing order of
command completion time by selecting all rows containing data, then selecting Sort from
the Data menu in Microsoft Excel. Choose the column which contains the numeric
completion times, and select "Ascending" or "Descending".
Creating a
Histogram
using
Microsoft
Excel
Microsoft Excel and other database and spreadsheet programs often have sophisticated
statistical functions useful for analyzing the data produced by SATracker. For example,
it may be useful to have a histogram of command completion times for a Command Log
File, to show the range and the pattern of variation of the command completion times. A
histogram is a chart which shows the frequency of occurance of values within a specified
data range, and allows the user to easily see which completion times cluster around
certain values, and which are unusual.
One way to create this chart is to begin by converting all command completion times into
data values as described above. Once this column is created, some basic statistic values
can be determined using Excel formulas, such as the following (in this example, the data
is contained in column Q, rows 2 through 512):
•
The number of valid datapoints can be determined by using the formula "=511
- COUNTBLANK(Q2:Q512)"
•
The maximum value in the range of command completion times can be
determined by the formula "=MAX(Q2:Q512)"
•
The minimum value in the range of command completion times can be
determined by the formula "=MIN(Q2:Q512)
Once the minimum and maximum values are known, the histogram can be prepared by
deciding on the "buckets" to be used to collect the data.
An example is shown below. In this example, the measured command completion times
varied from 1.645 microseconds to 36,852 microseconds. Data "buckets" were set up for
the following ranges:
•
•
•
•
•
•
•
•
Less than 2 us
2-3 us
3-5 us
5-10 us
10-100 us
100-1,000 us
1,000-10,000 us
10,000-50,000 us
These values were entered in cells Q519 through Q526.
To create the histogram, first select all cells which will contain the data, in this case cells
R519 through R526. Type in the following formula:
=FREQUENCY(Q2:Q512,Q519:Q526)
218
LeCroy Corporation
SATASuite User Manual
Version 6.25
but instead of pressing ENTER to enter the formula, press CTRL+SHIFT+ENTER. This
enters this formula into the entire array of cells you selected. The values shown are the
number of datapoint that fall between each "bucket" value.
You can produce a graph of this data by using the Excel Chart Wizard. Select the cells
containing the histogram data. Click on the Chart Wizard icon and follow the instructions.
On the second step, click on the "Series" tab, then on the "Category (X) axis labels:" field,
select the list of "buckets" in Q519 through Q526, and enter them as axis labels.
The result is the graph shown below:
This graph shows an interesting bimodal distribution in command completion times, with
a large set of commands completing within less than 5 microsecond, and another set of
commands requiring 1-20 milliseconds to complete. By sorting and analyzing this
pattern, the user can more easily understand which commands are resulting in long
completion times and causing performance degradation.
LeCroy Corporation
219
Version 6.25
220
SATASuite User Manual
LeCroy Corporation
SATASuite User Manual
Version 6.25
Chapter 14: Updates and Licensing
From time to time as modifications are made to the SATASuite Analyzer Software, it may
become necessary to update the SATASuite software. You can obtain new software from
the LeCroy website:
www.LeCroy.com
When you download new SATASuite software, firmware and BusEngine files are included
as part of the software package. Occasionally, LeCroy will update these files. The new
files will install automatically following installation of the new analyzer software. If you
prefer, however, you can manually update firmware and BusEngine. This chapter
describes both automatic and manual updates.
Note:
LeCroy SATA analyzers include downloads of new SATASuite
software releases that are made available during the 12 months
after purchase. Following that time, software releases are included
when the LeCroy Maintenance Agreement is purchased. Contact
LeCroy for details.
Software, Firmware and BusEngine Versions
The Readme.txt file on the installation CD and on the installed directory on your hard
drive gives last-minute updates about the current release. Included with each release are
the most recent downloadable images of the Firmware and the BusEngine.
Once the SATASuite Analyzer has completed the self diagnostics and is connected to the
PC, you can check the latest version of the software and BusEngine.
To check information about the current software, select
About SATASuite… from the Help menu.
The About SATASuite window appears.
LeCroy Corporation
221
Version 6.25
SATASuite User Manual
About SATASuite details revisions of the following software and hardware:
• SATASuite Software Version, Build Number
• Firmware Version of Analyzer (if connected)
• BusEngine Version, Build Number (if connected)
• Unit Serial Number (if connected)
Note:
When contacting LeCroy for technical support, please have available all
the revisions reported in the About SATASuite window.
Software Updates
When a new software release is available, it is posted on the Support page of the LeCroy
website at www.LeCroy.com/support.html.
To update the software, follow these steps:
Step 1 Find the latest released software version on the LeCroy website
under Support.
If you are running the latest version of the software, no further action is
needed.
If you are not running the latest version, continue to Step 3.
Step 2 Download the installer file from the website.
Step 3 Unzip the files into your choice of directory (if required).
Step 4 Click Start, then Run, and browse to where you unzipped the
files.
Step 5 Select the program named Setup and click Open.
Step 6 Click OK to run the Setup and begin the installation.
Step 7 Follow the on-screen instructions to complete the installation.
Step 8 Read the Readme file for important information on changes in
the release.
222
LeCroy Corporation
SATASuite User Manual
Version 6.25
Automatic BusEngine and Firmware Updates
BusEngine and Firmware updates often need to be performed when you update the
SATASuite software. These updates can be performed automatically or manually. Both
processes are described.
Updating
the
BusEngine
The BusEngine core is the heart of the LeCroy SATA Analyzer. Using FPGA technology,
it incorporates both the high speed recording engine and the configurable building blocks
that implement data/state/error detections, triggering, capture filtering, external signal
monitoring, and event counting and sequencing. Both the BusEngine program and the
Firmware that manages the internal microcontroller are fully field updateable.
Within a new software release, it may be necessary to update the Analyzer’s BusEngine
hardware for proper operation. The Readme file lets you know if this is necessary.
Updating
the
Firmware
Within a new software release, it may also be necessary to update the Analyzer’s
firmware for proper operation. The Readme file informs you if this is necessary.
Automatic
Updates
When the SATASuite software is updated, the software may become incompatible with
the BusEngine and Firmware. If a recording is attempted, SATASuite displays an error
message and then automatically begins an update process for the BusEngine and
Firmware.
To perform an automatic BusEngine and Firmware update, follow these steps:
Step 1 If needed, update the SATASuite software, following the steps
outlined in "Software Updates."
Step 2 Turn on the Analyzer.
Step 3 Select Start > Record from the menu.
Because the BusEngine and/or the Firmware are incompatible with the
current SATASuite software version, an error message appears
showing your current versions and indicating what versions you need to
install.
LeCroy Corporation
223
Version 6.25
SATASuite User Manual
Step 4 Click Yes.
The Analyzer Setup window appears.
Step 5 Click Update.
You can select only one item at this point. If both the BusEngine and the
Firmware need to be updated, the update will complete for the first item
and then return to the above window so the second update can be
performed.
Note:
Once you have started updating the BusEngine or Firmware, do not
interrupt the update!
When the second update has finished, the following message appears
and tells you that the update is complete.
Step 6 To complete the update, power cycle the SATASuite (turn the
unit off then back on).
If you are running Windows 2000, the Analyzer will automatically
reboot, and the following message will appear:
224
LeCroy Corporation
SATASuite User Manual
Version 6.25
Step 7 Click OK.
In this instance, you do not need to power cycle the Analyzer (turn off
then back on).
License Information
Licensing information for SATASuite can be viewed by selecting Display License
Information from the Help menu. The License window provides maintenance expiration
for SATASuite.
LeCroy Corporation
225
Version 6.25
SATASuite User Manual
Updating the Software License
A current License agreement with LeCroy entitles the analyzer owner to continued
technical support and access to software updates as they are published on the LeCroy
website.
If your license expires, a License Key must be obtained by LeCroy (refer to the contact
information at the back of this manual.)
Once the License Key is obtained, follow these steps to install it:
Step 1 From the Help menu, select Update License. The Update
License dialog appears.
Step 2 Enter the path and filename for the License key or use the Browse button
to navigate to the directory that contains the License Key.
Step 3 Select the *.lic file, and then click Update Device.
226
LeCroy Corporation
SATASuite User Manual
Version 6.25
Limited Hardware Warranty
How to Contact LeCroy
Type of Service
Contact
Call for technical
support…
Fax your questions…
Write a letter…
US and
Canada:
1 (800) 909-2282
Worldwide:
1 (408) 653-1260
Worldwide:
1 (408) 727-6622
LeCroy
Protocol Solutions Group
Customer Support
3385 Scott Blvd.
Santa Clara, CA 95054
USA
Send e-mail…
[email protected]
Visit LeCroy’s web site…
http://www.lecroy.com/
Limited Hardware Warranty
So long as you or your authorized representative ("you" or
"your"), fully complete and return the registration card
provided with the applicable hardware product or peripheral
hardware products (each a "Product") within fifteen days of
the date of receipt from LeCroy or one of its authorized
representatives, LeCroy warrants that the Product will be free from defects in materials
and workmanship for a period of three years (the "Warranty Period"). You may also
complete your registration form via the internet by visiting
http://www.lecroy.com/support/register/. The Warranty Period commences on the earlier
of the date of delivery by LeCroy of a Product to a common carrier for shipment to you or
to LeCroy's authorized representative from whom you purchase the Product.
What this Warranty Does Not Cover
This warranty does not cover damage due to external causes including accident, damage
during shipment after delivery to a common carrier by LeCroy, abuse, misuse, problems
with electrical power, including power surges and outages, servicing not authorized by
LeCroy, usage or operation not in accordance with Product instructions, failure to perform
required preventive maintenance, software related problems (whether or not provided by
LeCroy), problems caused by use of accessories, parts or components not supplied by
LeCroy, Products that have been modified or altered by someone other than LeCroy,
Products with missing or altered service tags or serial numbers, and Products for which
LeCroy has not received payment in full.
Coverage During Warranty Period
During the Warranty Period, LeCroy or its authorized representatives will repair or replace
Products, at LeCroy's sole discretion, covered under this limited warranty that are
returned directly to LeCroy's facility or through LeCroy's authorized representatives.
LeCroy Corporation
227
Version 6.25
SATASuite User Manual
How to Obtain Warranty Service
To request warranty service, you must complete and return the registration card or
register via the internet within the fifteen day period described above and report your
covered warranty claim by contacting LeCroy Technical Support or its authorized
representative.
LeCroy Technical Support can be reached at 800-909-7112 or via email at
[email protected]. You may also refer to LeCroy's website at http://www.lecroy.com for
more information on how to contact an authorized representative in your region. If
warranty service is required, LeCroy or its authorized representative will issue a Return
Material Authorization Number. You must ship the Product back to LeCroy or its
authorized representative, in its original or equivalent packaging, prepay shipping
charges, and insure the shipment or accept the risk of loss or damage during shipment.
LeCroy must receive the Product prior to expiration of the Warranty Period for the
repair(s) to be covered. LeCroy or its authorized representative will thereafter ship the
repaired or replacement Product to you freight prepaid by LeCroy if you are located in the
continental United States. Shipments made outside the continental United States will be
sent freight collect.
Please remove any peripheral accessories or parts before you ship the Product. LeCroy
does not accept liability for lost or damaged peripheral accessories, data or software.
LeCroy owns all parts removed from Products it repairs. LeCroy may use new and/or
reconditioned parts, at its sole discretion, made by various manufacturers in performing
warranty repairs. If LeCroy repairs or replaces a Product, the Warranty Period for the
Product is not extended.
If LeCroy evaluates and determines there is "no trouble found" in any Product returned
or that the returned Product is not eligible for warranty coverage, LeCroy will inform you
of its determination. If you thereafter request LeCroy to repair the Product, such labor
and service shall be performed under the terms and conditions of LeCroy's then current
repair policy. If you chose not to have the Product repaired by LeCroy, you agree to pay
LeCroy for the cost to return the Product to you and that LeCroy may require payment in
advance of shipment.
General Provisions
THIS LIMITED WARRANTY GIVES YOU SPECIFIC LEGAL RIGHTS. YOU MAY HAVE
ADDITIONAL RIGHTS THAT VARY BY JURISDICTION. LECROY'S RESPONSIBILITY
FOR DEFECTS IN MATERIALS AND WORKMANSHIP IS LIMITED TO REPAIR AND
REPLACEMENT AS SET FORTH IN THIS LIMITED WARRANTY STATEMENT.
EXCEPT AS EXPRESSLY STATED IN THIS WARRANTY STATEMENT, LECROY
DISCLAIMS ALL EXPRESS AND IMPLIED WARRANTIES FOR ANY PRODUCT
INCLUDING, BUT NOT LIMITED TO, ANY IMPLIED WARRANTIES OF AND
CONDITIONS OF MERCHANTABILITY AND FITNESS FOR A PARTICULAR
PURPOSE, AND ANY WARRANTIES THAT MAY ARISE FROM ANY COURSE OF
DEALING, COURSE OF PERFORMANCE OR TRADE USAGE. SOME
JURISDICTIONS MAY NOT ALLOW LIMITATIONS ON HOW LONG AN IMPLIED
WARRANTY LASTS, SO THE PRECEDING LIMITATION MAY NOT APPLY TO YOU.
LECROY DOES NOT ACCEPT LIABILITY BEYOND THE REMEDIES SET FORTH IN
THIS LIMITED WARRANTY STATEMENT OR FOR INCIDENTAL OR
CONSEQUENTIAL DAMAGES INCLUDING, WITHOUT LIMITATION, ANY LIABILITY
FOR THIRD PARTY CLAIMS AGAINST YOU FOR DAMAGES, PRODUCTS NOT
228
LeCroy Corporation
SATASuite User Manual
Version 6.25
BEING AVAILABLE FOR USE, OR FOR LOST DATA OR SOFTWARE. LECROY'S
LIABILITY TO YOU MAY NOT EXCEED THE AMOUNT YOU PAID FOR THE
PRODUCT THAT IS THE SUBJECT OF A CLAIM. SOME JURISDICTIONS DO NOT
ALLOW THE EXCLUSION OR LIMITATION OF INCIDENTAL OR CONSEQUENTIAL
DAMAGES, SO THE PRECEDING EXCLUSION OR LIMITATION MAY NOT APPLY TO
YOU.
The limited warranty on a Product may be transferred for the remaining term if the then
current owner transfers ownership of the Product and notifies LeCroy of the transfer. You
may notify LeCroy of the transfer by writing to Technical Support at LeCroy, 3385 Scott
Blvd., Santa Clara, CA 95054 USA or by email at: [email protected]. Please include
the transferring owner's name and address, the name and address of the new owner, the
date of transfer, and the Product serial number.
LeCroy Corporation
229
Version 6.25
230
SATASuite User Manual
LeCroy Corporation
SATASuite User Manual
Version 6.25
Appendix A: Specifications
LeCroy SATA analyzers are hardware modules that install into the CATC 10K platform.
The following specifications describe a combined SATA 10K based system.
Package
Dimensions:
CATC 10K: 12.2 x 12.2 x 3.5 inches
(31.1 x 31.1 x 8.9 cm)
Single-wide Plug-in: 4.5 x 6.7 x 1.3 inches
(11.3 x 17.0 x 3.2 cm)
Double-wide Plug-in: 9.5 x 6.7 x 1.3 inches
(24.1 x 17.0 x 3.2 cm)
Rear Connectors:
CATC 10K:
AC power connection
External trigger connection (TRIG IN/OUT, BNC)
PC connection (USB 2.0 Hi-Speed, type "B")
Break-out board (type "D")
Weight:
CATC 10K: 9.5 lbs (4.3 kg)
Single-wide Plug-in: 1 lb 11.4 oz (.77 kg)
Double-wide Plug-in: 3 lb 3 oz (1.45kg)
Power Requirements
90-254VAC, 47-63Hz (universal input), 120W maximum
Environmental Conditions
Operating Range:
Storage Range:
Humidity:
Operating Altitude:
0 to 40 °C (32 to 104 °F)
-20 to 80 °C (-4 to 176 °F)
10 to 90%, non-condensing
Up to 2,000 meters (6,560 feet)
Probing Characteristics (Model SS002MAA & SS003MAA)
LeCroy Corporation
Connector Type:
One Port Model - Single Pair of Internal Connectors (Initiator and
Target; Serial ATA Standard)
Two Port Model - Dual Pair of Internal Connectors (Initiator and
Target; Serial ATA Standard)
Four Port Model - Single Pair of Internal Connectors (Initiator and
Target; Serial ATA Standard)
SATrainer Connection
Type:
Single Initiator and Target connectors
(for transmission only)
231
Version 6.25
SATASuite User Manual
Probing Characteristics (Model SS004MAA)
Connector Type:
2 pairs SAS External 4 lane Connector:
Non-intrusive tap - samples the signal without re-driving the
differential lines (high value resistors contribute to reduction in
amplitude ˜ 15%).
Repeater tap - re-drives the signal at either SAS (high swing) or
SATA (low swing) voltages; does not re-time the signal.
Recording Memory Size
2 GBytes for trace capture, timing and control information.
Host PC Requirements
Operating System:
Windows 98SE, Windows 2000, Windows ME or Windows XP
Switches
Power:
Manual Trigger:
On/off
When pressed, triggers the end of the recording
LEDs
CATC 10K:
Status (STATUS):
Recording (REC):
Triggered (TRG):
UPloading (UPLD):
SATracer Plug-in
Module:
Status (STATUS):
232
Illuminated when the analyzer is powered on.
Illuminates for approximately 25 seconds during
initialization/power up of the CATC 10K base unit. If this LED
blinks following initialization, this is an indication that initialization
failed.
Illuminated when the analyzer is actively recording traffic data
Illuminated during power-on testing and when the analyzer has
detected a valid trigger condition.
Illuminated when the analyzer is uploading its recording memory
to the Host PC for displaying the CATC trace
Illuminates when there is traffic on both the host and device
sides. Blinks when there is traffic on one side only.
LeCroy Corporation
SATASuite User Manual
Version 6.25
Basic SATracer Trigger Events
Frames:
Primitives:
Errors:
SCSI Operations:
SSP Command, Data, Response, Task, X_RDY and Vendor
Unique, SMP Request, Response, Report, Discover and
Configure;
ACK, CREDIT_BLOCKED, DONE
(ACK/NAK TIMEOUT), NAK, RRDY, SOF, AIP,
BREAK, BROADCAST, CLOSE, OPEN_ACCEPT,
OPEN_REJECT, and more task management functions
Invalid 10b codes, CRC Errors, Running Disparity Errors,
Time-outs, Alignment errors, Code Violation
Pending SCSI I/Os, SCSI I/O Response, SCSI I/O Latency,
SCSI I/O Throughput, Frame Length, Data Throughput,
Link Utilization (%), Frame Count
SATracer Traffic Summary Reports
Data Frames
Primitives
Connects/Disconnects
Errors
ATA Commands
Read Response (min, max, avg.)
Write Response (min, max, avg.)
LeCroy Corporation
233
Version 6.25
SATASuite User Manual
The following tables are supplied in compliance with China’s Restriction of Hazardous
Substances (China RoHS) requirements:
234
LeCroy Corporation
SATASuite User Manual
Version 6.25
Index
A
AC connector 9
Action Pop-up Menu 57
Actions Tab 62, 70
Adding Comments 38
Address FramesDecl.inc 166
Analyzer Network Chat 151
AND Condition 73
Assigning Actions 70
ATA Application Layer 92
ATA Commands 63, 66
ATAPI Commands 63, 67
AutoAlign 163
Autodetect Link Rate 49, 209
B
Beep When Trigger Occurs 44
BNC Connectors 9
BNC External Trigger 119
Breakout Board 7, 9, 68, 119, 122, 124
Buffer Size 45
Bus Conditions 67
Bus Utilization 33, 130
Bus Utilization Buttons 131
Byte Value in 10b Raw Bits 96
C
Cascaded Multiple Analyzer 146
Cascading 145
CATC 10K Platform 7
Changing Display Levels 91
Changing Field Formats 88
Changing the BusEngine 204
Changing the Color of the Data Fields 35
Channel Settings 49, 210
Channels 81
Clear Marker 41
Collapse Data 35
Collapsing Data Fields 97
Color Display Options 87
Command Completion Time 212
command completion time 212
Command End Events 203
LeCroy Corporation
Command Fragments 203
command fragments 203
Command Log File 203, 204, 211, 213
Command Start Events 203
Comments 38
Compact View 103, 213
Complex "Wait For" Conditions 201
Complex Searches 115
Configuring Input Signaling 125
Connected Remotely over an IP Network 145
Connecting Devices 11
Connectors 8
Contact LeCroy 227
Conventional Recording 44, 45
Counters 56, 74
Counting Events 74
CRC Calculations 166
Creating a Traffic Generation File 154
Ctrl-Q Keyboard Shortcut 103
Custom Channel Names 81
D
Data Block Window 99
Data In/Out Connector 123
Data Output Connector 9
Data Payload 98
Decode Buttons 33, 207
Descrambling 49
Dimensions 231
Disparity error 97
Display Options 32, 85, 89, 90, 95
DWORD Display 4
E
Edit Comment 38
Environmental Conditions 231
Error Report 33
Error Summary 34, 129
Errors Properties Dialog 68
Event Properties Dialog Box 63
Event Sequences 75
Event Trigger 44
Exerciser Hardware 153
235
Version 6.25
Expand Data 35
Expanding and Collapsing Fields 97
Expanding Data Fields 97
Export 27
Export Options 106
Export Packets to EAS Format 107
Export Packets to Text 107
Export to CSV Format 107
Export to Generator File Format 107
External Connector Module 12, 13, 23
External Interface for Trigger 119
External Trigger 58
F
Features 4
File Information Report 33
Filter 57, 73
Find 114
Frame Level view 92
Frame Tracker 33, 141, 142
Frame View 91
Frames 63, 65
Front Panel LEDs 8
G
Generating Traffic 154, 168
Generation Commands 177
Generation Files 167
Generation Language 169
Global State Cell 50, 53, 56, 72, 73
Go to Event 111
Go to Marker 39, 112
Go to Trigger 111
Graph Areas Menu 133
Graphs 134
SATASuite User Manual
Incompletes 203
Infiniband Connectors 8, 11
Initiator Emulation 153
Input Signal Equalization 21
Installation 7
Installing Software 15
Internal SATA Connectors 14
Internal SATA-style module 23
L
LeCroy BusEngine 4, 223
LED Descriptions 8
LEDs 232
Left Mouse Button 35
Level Hiding 89
Link Tracker 33, 101, 135, 136
M
Management View 91
Manual Trigger 8, 44, 208
Markers 138
Menu Bar 27
MSB/LSB Format 99
Multiple Analyzers 145
Multisegment Toolbar 47
Multisegment Trace 34, 46
N
Navigation Tools 38
Network Chat 151
Networking 145
New Events Menu 59
Non-intrusive Tap 11
Normal Swing 24
H
O
Hardware Description 7
Hardware Warranty 227
Hide Buttons 33
Hierarchy Lines 86
High Swing 24
Host Computer Connector 9
Host PC Requirements 232
OOB Idle Sensitivity 24
Open File 32
Opening Trace Files 26
OR Condition 73
Orphans 203
Out of Band Signals 67
Output Power 21
Output Pre-emphasis 21
I
Idle Time 137
Incomplete Frames 100
236
P
Passive Tapping 11
LeCroy Corporation
SATASuite User Manual
Pattern Editor 61, 62
PC Requirements 7
Pop-up Menu 35, 54, 56
Pop-up Menus 50
Power Cord Set 5
Power Requirements 231
Primitive and Frame Definitions 165
Primitives 63, 64
Primitives Decl.inc 166
Probe Control Setting dialog 20
Probe Control Settings 19
Probing Characteristics 231
Progress Bar 36
Progress Indicator 36
Properties Dialog Box 55, 60
Version 6.25
Raw 10b Codes 96
Rear Connectors 231
Record Options 32
Recording Activity 37
Recording Data 16
Recording Memory Size 232
Recording Multi-Trace Files 150
Recording Options 16, 43, 81
Recording Progress 36
Recording Rules 50
Recording Rules Page 52
Recording Rules Toolbar 51
Recording Scope 44
Recording Status 37
Recording Type 44
Recording Type Option 45
Remote Access over an IP LAN 147
Remote Analyzers Over an IP Network 149
Repeater Tap 12
Reports 127
Right Mouse Button 35
RS-232 Connector 9
Rule Status Indicator 50
Running Disparity 97
Running Disparity Error 97
Save As... 3, 32
Saving Display Option 90
Saving the Trace 18
Script Editor 157
SCSI Commands 63
SCSI View 91
Search 138, 143
Search Status 37
Searching Traces 111, 203
Segmented Files 46
Self-diagnostics 10
Sequence Cell 50, 53, 56
Sequential Events 80
Serial ATA Connectors 8
Serial ATA Protocol 2
Set Marker 39
Setting Up 10
Settings.inc File 161
Show Data Block 33
Show Raw Bits 96
SMP Request/Response 63
SMPFrames.inc 166
Snapshot 44
Software License 226
Software Updates 221, 222
Specifications 231
Split Frames 102
Spooled Recording 44, 45, 48
SSP Header Fields 63
SSP Information Units 63
SSPFrames.inc 166
Start Recording 32
State Properties 69
States 75
Status Bar 36
Status indicator 8
Status LED 10
Stop Recording 32
Stopping a Recording 16
STP Decoding 96
STPFrames.inc 166
Switches 232
System Components 7
S
T
Sample Traces 25
SAS analysis ports 4
SATA connectors 12
SATA FIS 63, 65
SATASuite Trace Viewing Software 2
Target Emulation 154
Technical Support
Email 227
Phone Numbers 227
Web Site 227
R
LeCroy Corporation
237
Version 6.25
Time between Dwords 138
Time between Frames 143
Time from Marker 42
Timeout Trigger 208
Timer Properties 69
Timers 80
Timestamp 86
Timing and Bus Usage Calculations 33
Timing Calculations 42, 129
Tool Tips 26
Toolbar 32
Trace Viewing Level Options 95
Tracker Archive Memory Size 208
Tracker Options 206
Tracker Sweeping 210
Tracker Toolbar 206
Trademarks ii
Traffic Generation 34, 153
Traffic Generation (*.ssg) Files 154, 156, 160
Traffic Summary 33, 128
Traffic Summary Reports 233
Transport Layer 92, 211
Transport View 91
Trigger 57, 72
Trigger Events 3, 233
Trigger Position 36, 45
trigger timeout 208
Triggering Options 208
Truncate Data Payload 44
SATASuite User Manual
Z
Zoom 139, 143
Zoom In 32, 38
Zoom Level 86
Zoom Out 32, 38
U
UPAS 10K Platform 5
Updating
Firmware 223
Upload Process 17
USB Connected Analyzers 148
USB Connections 146
User-Defined Find Events 114
Using a Timer 78
V
View Options Menu 137
View Settings Menu 132
W
Warranty 4, 227
Weight 231
Wrap 32, 38, 86
238
LeCroy Corporation