1
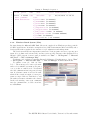
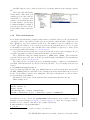
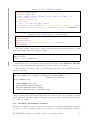
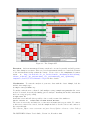
• Statistical call graph: Profiles with low overhead to detect where time is spent in your
application
• Predefined profile configurations: Prepared profiles e.g. “loop analysis on Intel Nehalem
CPUs”
• Data Access Profiling: Identifies memory hotspots and relates them to code hotspots
• Heap Profiler: Identifies dynamic memory usage by application. Can help identify memory leaks
• ... and many more features.
More information about intel PTU is available here:
http://software.intel.com/enus/articles/intel-performance-tuning-utility/
After you started the PTU GUI by ptugui, choose a place where the workspace will
be stored. Then click File →New →Project and choose New Intel PRU Project, click Next,
type a project name and click Next. Choose an executable file (Application), type application
command line parameters (if there are any) and working directory. A new project will be
created by clicking on Finish.
To perform some profiling, right-click on the new project in the left Tuning Navigator pane,
go to Profile as and choose a predefined profile. The application will be launched (maybe more
than one time) and after some analysis you should see a new pane with profiling results on the
right.
By right-clicking on the project in the left Tuning Navigator pane and choosing Profile, a
new profile can be defined.
Alongside with the GUI, the Intel Performance Tuning Utility has a diverse set of command
line utilities, including displays, e.g. vtsarun and vtsaview.
8.3
Intel Thread Profiler (Lin / Win)
The Intel Thread Profiler is the second part of the Intel Threading tools, along with the Intel
Thread Checker. It helps developers to analyze the thread level performance of applications
that use Windows, POSIX or OpenMP threads.
The usage of the Thread Profiler is similar to the Thread Checker (see section 7.4.2 on
page 69). It also has two different modes: the source instrumentation mode and the binary
instrumentation mode.
To load the Intel Threading Tools module on Linux, you have to use
$ module load intelitt
On Windows, the Thread Profiler is only available on the cluster frontend machines.
Source instrumentation mode: Compile your program using the Intel compilers with
-tprofile on Linux or /Qtprofile on Windows. On Linux you can use -openmp-profile to
enable analysis of OpenMP applications.
On Linux you have to extend your command line with the $itt_link option as well.
On Windows you have to link with the /fixed:no option. Then run your program as usually.
After the program has finished, a short overview of the run is shown and the files tp.tp and
tp.tpd are written. If you enabled the analysis of OpenMP applications by -openmp-profile,
a plain text file guide.gvs will be written.
Linux Example:
$ $PSRC/pex/831|| $CC $FLAGS_DEBUG $FLAGS_OPENMP -tprofile $PSRC/C-omr-pi/pi.c
-lm $ITT_LINK
$ $PSRC/pex/831|| a.out
The RWTH HPC-Cluster User's Guide, Version 7.2, November 2010
75