1
has a default sampling rate of 16 kHz (however, the waveforms portrayed in this
document were sampled at 11.025 kHz).
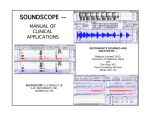
Once recorded, the time data is normalized to maximum amplitude of 0.99 and displayed
on the upper plot in the GUI window. In addition to the time domain waveform, a
spectrogram is computed using Matlab’s built in specgram function (part of the signal
processing toolbox).
An example recording of the sentence, “We were away a year ago” is shown below.
“We were away a year ago”
Zooming in on the Waveform:
One can examine a region of interest in the waveform using the Zoom in button. When
Zoom in is clicked, the cursor will change to a cross hair. Clicking the left mouse button
and dragging a rectangle around the region of interest in the time domain waveform will
select a sub-section of data. In the example below we have zoomed in on the region from
about 1 to 1.2 seconds.