1
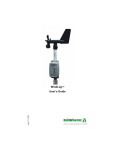
Electronic Recording
Rain/Precipitation Gauge
Yamily Veloz
Bradd Konert
CDA 4170 Data Acquisition and Control Systems
Florida Gulf Coast University
Professor Janusz Zalewski
April 23, 2009
1. Introduction
The RainWise rain/precipitation gauge is an in-the-field data acquisition device which can be placed at a
remote location to measure rainfall totals and later retrieved to extract the recorded data. This data can
then be used in a variety of different applications such as meteorological studies and irrigation system
analysis.
2. Problem Description
The purpose of this project is to use LabView and its included VI’s to extract the data from the
RainWise rain/precipitation gauge that has already been acquired in the field. Due to the nature of the
rain/precipitation gauge, we are unable to implement a real time application, but instead we must focus
on displaying the data which has already been recorded.
Our goal is to replicate and enhance the logger reading software that is included with the RainWise
rain/precipitation gauge. The included logger reading software is limited in that it lacks a graphical user
interface and is strictly command line driven. This command line format does not lend itself to user
friendliness.
Figure 1. Physical Diagram of the System.
3. Proposed Solution
As previously stated, we look to use LabView to replicate and enhance the included logger reading
software, which is strictly command line driven. To overcome this limitation we look to develop a
graphical user interface through LabView. LabView is a perfect candidate for this problem as it heavily
favors a graphical structure.
4. Implementation
We are using LabView to implement the logger reading software. The logger communicates with the
computer via traditional serial connection (RS-232). This is beneficial as LabView supports serial
communication rather easily through the VISA component. We have been able to modify one example
[2] in particular to effectively communicate with our rain/precipitation gauge. This has been quite
encouraging as we have essentially replicated the logger reading software that is included with the
rain/precipitation gauge; however, as we stated in our proposed solution, our goal is not to simply
replicate the included software but rather to replicate and enhance.
Refer to figure 2 for a screen shot of the application we have developed to communicate with the logger
attached to the rain/precipitation gauge. By selecting one of the radio buttons, a command is sent to the
logger (refer to the user manual for a list of commands). Depending on the command, the information is
displayed in the read window.
Figure 2. Application to communicate with the RainWise rain gauge.
SAMPLE OUTPUT – Output stored data, full form was selected >"Rainlogger #1" "RF Unit: inches" "DATE", "TIME", "RATE", "TOTAL" "04/06/94", "00:00", 0.00, 0.00 "04/06/94", "00:06", 0.00, 0.00 "<SYSTEM POWERED DOWN>" "04/06/94", "00:00", 0.00, 0.00 "04/06/94", "00:00", 0.00, 0.00 "<SYSTEM POWERED DOWN>" "04/06/94", "00:00", 0.00, 0.00 "04/06/94", "01:05", 0.00, 0.00 "<SYSTEM POWERED DOWN>" "04/06/94", "00:00", 0.00, 0.00 "04/06/94", "00:00", 0.00, 0.00 "<SYSTEM POWERED DOWN>" "04/06/94", "00:00", 0.00, 0.00 "04/06/94", "00:35", 0.00, 0.00 "<Clock set>" "09/28/08", "18:52", 0.00, 0.00 "09/28/08", "18:54", 0.00, 0.00 "<SYSTEM POWERED DOWN>" "04/06/94", "00:00", 0.00, 0.00 "04/06/94", "00:00", 0.00, 0.00 "<Clock set>" "09/28/08", "19:05", 0.00, 0.00 "09/28/08", "20:00", 0.00, 0.00 "<SYSTEM POWERED DOWN>" "04/06/94", "00:00", 0.00, 0.00 "04/06/94", "00:06", 0.00, 0.00 "<Clock set>" "10/01/08", "16:57", 0.00, 0.00 "10/01/08", "18:01", 0.06, 0.06 "10/01/08", "18:02", 0.02, 0.08 "10/01/08", "18:11", 0.00, 0.08 "<SYSTEM POWERED DOWN>" "04/06/94", "00:00", 0.00, 0.08 "04/06/94", "00:00", 0.00, 0.08 "<Clock set>" "10/01/08", "18:12", 0.00, 0.08 "10/01/08", "18:12", 0.00, 0.08 "<SYSTEM POWERED DOWN>" Figure 3. Output of stored data, full form
5. User Manual
Previous knowledge required:
It is assumed throughout this manual that you already have a basic understanding of LabView and that
you have read through chapters 1 and 2 of the LabView book. In addition, it assumed that you are a
computer science major and that you have a basic understanding of terms such as serial port, USB, and
command line. It is also assumed that you have LabView 8.2 or higher installed on your Windows
machine.
Hooking up and understanding the rain gauge:
The rain gauge comes with a data logger box which connects to the rain gauge itself, as shown in Figure
4. In order for the rain gauge to work, this data logger must be connected to the rain gauge and have
power applied to it. The data logger has the option of two different power sources: a battery for when it
is out in the field and an AC adapter when it is inside. Figure 4. RainWise rain gauge (first) and logger (middle and right).
To start working with your rain gauge:
1. Plug the AC adapter into the wall and plug the other end into the back of the data logger, marked
"Power."
2. Plug the plug from the rain gauge in the back of the data logger marked "Rainfall."
3. Finally, plug the serial port cable into the front of the data logger, marked "Serial Port" and connect
it to the PC.
4. Most likely you will need a serial to USB converter if you do not have an older PC or a newer PC
with legacy ports. This is not provided with the rain gauge.
5. Now that you have it hooked up to the computer you are ready to start reading data from the rain
gauge!
Reading data from the Rain Gauge:
Good news is you do not need a driver for the rain gauge as it uses basic serial communication.
Although the commands below are already programmed into the LABVIEW application included with
this manual, it is good to know the command line letters so that you may rewrite the application if you
wish.
Command Function
:
Initiate communication with rain gauge. Rain gauge will respond with a >
signaling it is ready for the next command. **This is needed before each
and every command!
D
Dump current data. Uploads the current date, time, and total rainfall.
C
Clears RAM.
M
Toggle measurement units. Responds with 00 for inches or 01 for
millimeters after the setting is changed. (note: the data logger does not
provide a command to retrieve the units without toggling it.)
O
Outputs data in the full form. Data from all recording intervals is uploaded.
S
Outputs data in the short format. Only data from recording intervals where
rainfall was recorded is uploaded.
L
Outputs the logging interval in minutes. 01, 02, 05, 10, 20, 30, or 60
I
Increments the data logging interval. Uploads the new interval after being
incremented
K
Sets the logger's date in the format YYMMDDHHmm (year, month, day,
hour in the 24 hour format, and minute respectively) followed by a carriage
return.
To work with the LabView application included with this manual, follow the following steps:
0. It is assumed you already followed the steps above in hooking up the rain gauge to the computer
1. Double click on the RainGauge.vi file on a computer that already has LabView installed. Refer to
the image below.
2. Once the application opens, choose the appropriate port name for which the rain gauge is connected.
To find the com number, right click on "My Computer" in Windows and select Manage. From there
open the Device Manager and expand Ports. Under it, it should tell you the COM numbers for
various devices. Most likely the one assigned to the rain gauge will be named Communication; this
is what is needed for step 2 above.
3. Now click on the run button in LabView to run the application.
4. From the list of radio buttons, choose the operation you wish to perform. NOTE: It is best if you
start with Short Form Data Output. Using Clear Data Ram is not suggested at this point. Refer to
the images below for expected or similar output in each of the cases.
Figure 5. Dump current data.
Figure 6. Clear data RAM.
Figure 7. Toggle metric unit setting.
Figure 8. Output stored data, short form.
Figure 9. Output stored data, full form
5. Stop the application whenever you have finished the experiment.
Building your own rain gauge reader:
Congratulations! You have run your first RainWise rain gauge LabView run. Now, are you ready to
design your own LabView application? What's that? Of course you are ready! Let's Go!
1. Open LabView
2. On the top menu bar, click on Help -> Find Examples
3. In the search, type "Serial read"
4. From the results, double click on "Basic Serial Read Write 1"
5. This will open a VI that is designed for basic serial communication, perfect for the rain gauge!
Refer to Figure 10.
Figure 10. Basic Serial Write and Read example.
6. Choose the appropriate settings for the rain gauge (Figure 10). Baud Rate is 2400 and everything
else should be pretty standard, besides the COM port selection. This will change based on the port
that the rain gauge is plugged into. Refer to Figure 10.
To find the com number, right click on "My Computer" in Windows and select Manage. From there
open the Device Manager and expand Ports. Under it, it should tell you the COM numbers for
various devices. Most likely the one assigned to the rain gauge will be named Communication.
7. In the Write text box, write :D ... No that is not a smiley face that is a colon and a D. This tells the
rain logger to dump the current rain fall data.
8. Run the application in LabView.
9. Once the program runs, you will have the response from the rain gauge in the read box.
Figure 11. Current data displayed after issuing command.
10. That's all!
Exercises:
1. Modify the steps above to output the rain fall data in short form. (Hint: you will need to look at the
command table on page 2. Also, you will need to change the delay to something greater than 500ms
as it takes longer for the rain gauge to respond to this command).
Feeling brave? Attempt to make it so that the serial read write application does not stop after every
write and read. (Hint: you will need to add a loop to the underlying structure).
6. Conclusion
The RainWise rain/precipitation gauge can be used in a variety of different applications such as
meteorological studies and irrigation system analysis.
The newer versions of the rain gauge make it even easier to collect and get data, with a wireless version
also. They meet NWS specifications for statistical accuracy.
7. References
[1] WeatherLog Weather Monitoring System – Electronic Recording Rain/Precipitation Gauge,
RainWise, Inc., User Manual, Maine, 1994.
[2] Basic Serial Write and Read.vi, LabView 8.6 example