1
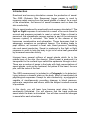
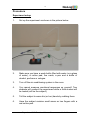
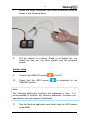
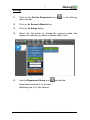
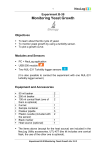
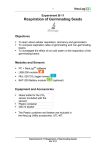
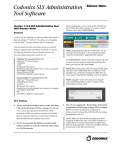
1 Experiment B-37 Emotional Stress Measurement Objectives To learn about the fight or flight response. To examine how stimulation of the human system (by touch, smell, sight or sound) causes the sweat glands in the hand to secrete sweat. To understand the principles of a polygraph (lie detector). Modules and Sensors PC + NeuLog application USB-200 module NUL-217 GSR (Galvanic Skin Response) logger sensor Equipment and Accessories Wash bottle (or a glass) Cotton pad Pen The wash bottle and the cotton pad are included in the NeuLog Utility accessories, UTL-KIT. Materials Blank card 5 Water for wash bottle Bottle of alcohol, perfume or cologne Experiment B-37 Emotional Stress Measurement Ver 3.2.6 2 Introduction Emotional and sensory stimulation causes the production of sweat. The GSR (Galvanic Skin Response) logger sensor is used to measure sweat coming from the sweat glands of a hand. As a result of the stimulation, the amount of sweat increases and so does the skin conductivity. Why is sweat produced by emotionally and sensory stimulation? The fight or flight response is activated as a result of an acute threat to survival and prepares animals to react or retreat. When a threat is perceived, the sympathetic nervous system (a part of the autonomic nervous system) is activated. This leads to the release of the hormones noradrenaline and adrenaline. These hormones bind to adrenergic receptors on peripheral tissues. The binding leads to pupil dilation, an increase in heart rate, blood pressure, breathing rate and sweat production. Sweat is produced in the fight or flight response in order to help the body to get rid of extra heat generated by increased muscular activity. Humans have several millions of sweat glands which lie in the middle layer of the skin (the dermis). When sweat is produced it is transported to the surface layer called the epidermis through a duct. There are a number of areas in the body with high concentrations of sweat glands, such as the forehead, the palms of the hand, the arm pits, and the soles of the feet. The GSR measurement is included in a Polygraph (a lie detector). Lying induces a stressful state on the body, which is manifested via physiological responses. Except for skin conductivity, a polygraph is capable of simultaneously recording changes in blood pressure, pulse rate, respiration and others, while the subject is asked a series of questions. In this study, you will learn how humans react when they are emotionally stimulated. You will observe that the hand produces sweat when the brain is stimulated. You will also record the changes in sweat after each stimulation. Experiment B-37 Emotional Stress Measurement Ver 3.2.6 3 Procedure Experiment setup 1. Set up the experiment as shown in the picture below. 2. Make sure you have a wash bottle filled with water (or a glass of water), a cotton pad, five cards, a pen and a bottle of alcohol, perfume or cologne. 3. Turn off the air-conditioning system in the room. 4. You cannot measure emotional responses on yourself. Two students will conduct the experiment while a third student will be tested (will be the subject). 5. Tell the subject to warm his (or her) hands by rubbing them. 6. Have the subject moisten small areas on two fingers with a wet cotton pad. Experiment B-37 Emotional Stress Measurement Ver 3.2.6 4 7. Attach the finger electrodes over these moistened areas as shown in the following figure. 8. Tell the subject to sit down. Stand or sit behind him. He should not see you, the other student and the computer screen. Sensor setup 9. Connect the USB-200 module 10. Check that the GSR sensor USB-200 module. to the PC. is connected to the Note: The following application functions are explained in short. It is recommended to practice the NeuLog application functions (as described in the user manual) beforehand. 11. Run the NeuLog application and check that the GSR sensor is identified. Experiment B-37 Emotional Stress Measurement Ver 3.2.6 5 Settings 11. Click on the On-line Experiment icon main icon bar. in the NeuLog 12. Click on the Sensor's Module box. 13. Click on the Range button. 14. Select the Arb button to change the sensor's mode (the response in arbitrary numbers is clearer than in ɥS). 15. Use the Experiment Setup icon and set the: Experiment duration to 10 minutes Sampling rate to 10 per second Experiment B-37 Emotional Stress Measurement Ver 3.2.6 6 Testing and measurements 17. People depend so heavily upon their sight and hearing that the action of these senses must minimize before maximal attention can be paid to the other sensory inputs. Stimulation by touch and smell is easier without sound and sight. The sensory organs of touch and smell then become more sensitive in their activity. Tell the subject to sit quietly for a few moments with his eyes closed, head down, legs uncrossed and arms resting on the supports of an armchair or on his lap. He should not exert any pressure on the finger electrodes. 18. Refrain from talking so that the subject will not be stimulated by any external sounds. These conditions should be kept throughout the measurement. 19. Observe the measured response value in arb. units on the sensor. This value varies from subject to subject and also according to the subject's emotion condition. 20. Click on the GSR sensor module box and set the Y axis limits to be approximately 6000 above and below the measured value. 21. One student will perform the stimulations and the other will document the time of each event and the arbitrary value. 22. Click on the Run Experiment icon measurement. 23. The graph may continue to move up and down. Wait silently until you get only small changes on the graph. to start the Experiment B-37 Emotional Stress Measurement Ver 3.2.6 7 24. Event 1: Lightly touch the subject's ear and observe the response on the graph. The production of a small amount of sweat will cause the measured value to change. The more sweat produced, the greater the change. Note: There is a time delay between stimulation and a response from the sensor. It takes 0.8 to 4 seconds for the hand to produce sweat after stimulation occurs. 25. Event 2: Again, stimulate the subject by lightly touching the other ear and observe the response. 26. Event 3: When the subject becomes habituated to touching, try blowing across the subject's ear or face to see if he or she responds to air movements. Habituation is a decrease in an elicited behavior resulting from repeated stimulations. 27. Event 4: Put your hand on the subject's head. 28. Event 5: Open a bottle of alcohol, cologne or perfume one meter from the subject's nose, allowing him or her to smell the aroma. The subject should not know in advance what you plan to do. The response will let you know when the subject smells the aroma. 29. Save your graph and analyze it. Experiment B-37 Emotional Stress Measurement Ver 3.2.6 8 Lie Detecting 30. Give the subject 5 blank cards and ask him to write a name on each card. One name should be a name of someone that is very close to him such as his mother, father, brother etc. The other four names should be names of people he is not familiar with at all (male or female according to the first name). 31. Prepare the subject for testing as in sections 17-20 and define the Y-axis limits as before. 32. Scramble the cards and tell the subject to answer 'no' for each of the following questions until you tell him that the experiment is over. 33. Wait at least 15 seconds between questions and ask the subject questions as follows: 'Is Paul your brother?' 'Is Sam your brother?' And so on. 34. Observe the subject's response on the graph for each question. 35. Change the way of questioning, for example: 'I think that Paul is your brother' 'So, Charles is your brother' 36. Locate the highest response for a certain name or two names, keep asking in different ways and observe the responses. 37. Tell the subject that the experiment is over and select the name with the highest response as your guess. Experiment B-37 Emotional Stress Measurement Ver 3.2.6 9 38. This is an example of a part of a graph in which the subject was asked a question about the person that he is close to: The subject was asked the question 39. The subject answered 'no' (and was lying) The arbitrary GSR values were increased Save your graph and analyze it. Conclusions 40. Emotional and sensory (by five classic senses) stimulation causes the production of sweat. The sweat production is part of the fight or flight response. 41. We can see on the graph above that when the subject is under stress, sweat is released and can be measured by the GSR logger sensor. 42. There are a number of areas in the body that have high concentrations of sweat glands, such as the forehead, the palms of the hand, the arm pits, and the soles of the feet (measurements of sweat in areas such as the forehead, back or chest are more difficult to obtain). Experiment B-37 Emotional Stress Measurement Ver 3.2.6 10 43. A change in the sweat level occurs 0.8-4 seconds after a person has been stimulated. 44. The GSR measurement is included in a polygraph (a lie detector). Except for skin conductivity, a polygraph is capable of measuring changes in blood pressure, pulse rate, respiration and others. Summary questions 1. What can you conclude from your results? 2. Except for skin conductivity, a polygraph (lie detector) is capable of simultaneously recording changes in blood pressure, pulse rate and respiration. Explain how these physiological variables are connected to the fight or flight response; how do they change during acute stress? How do these changes help us (or animals) when threat is perceived? 3. Give an example of habituation in animal behavior. 4. Which animal class has an ability to produce sweat? Point out another unique characteristic of this class. Experiment B-37 Emotional Stress Measurement Ver 3.2.6