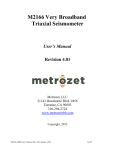
1
STS-1 Very Broadband Seismometer
Calibration Analysis Software
CALEX-MZ (MSEED)
Suite
User’s Manual
Version 4.000
Metrozet, LLC
21143 Hawthorne Blvd. #456
Torrance, CA 90503
866-823-0339
www.metrozet.com
www.metrozetvbb.com
Copyright, 2011
CALEX-MZ (MSEED) User’s Manual, Rev 5.000
1 of 32
Table of Contents
Limitations…………………………………………………………………………..
p. 3
Introduction and Software Description..…………………………………………
p. 4
Basic Nature of STS1-E300 Velocity SWEEP Data…………………………….
pp. 4-5
Software Design..…………………………………………………………………..
pp. 5-6
Hardware and Operating System Requirements ……………………………….
p. 6
CALEX-MZ (MSEED) Software Installation and Data Formats……………...
pp. 7-9
CALEX-MZ (MSEED) Operation…………………………………………………
pp. 9-32
Contact Metrozet…………………………………………………………………….
p. 33
Visit www.metrozetvbb.com for the latest version of this manual
CALEX-MZ (MSEED) User’s Manual, Rev 5.000
2 of 32
Limitations
The CALEX-MZ (MSEED) Calibration Analysis Software Suite has been developed to allow
users of Metrozet’s STS1-E300 Electronics Modules to analyze velocity-equivalent SWEEP data
for calculation of STS-1 transfer functions (and poles and zeros). It is set up for use with the
internal “SWEEP” command provided by these modules. It is presently not designed or
supported for use with other calibration signals.
The calibration analysis relates strictly to RELATIVE calibrations. That is, it provides a
calculation of the unity-gain frequency response from the sensor. It does NOT provide a
derivation of sensor scale factors. In fact, no sensor calibration method that uses an independent
calibration coil (as in the STS-1 sensor) can provide an accurate absolute value for the scale
factor of the sensor. Other techniques (e.g., shake tables or step tables) are required.
The analysis assumes that the calibration data quality, and signal-to-background ratio, are
sufficient. Note that noisy data, or data from unstable or unsettled sensors, may lead to
erroneous analysis.
CALEX-MZ (MSEED) fits both the low frequency (2nd order fit) and high frequency (userselectable 2nd, 4th, or 6th order fit) corners of the sensor response. The addition of higher order
terms to the high frequency corner fits are meant to more accurately model the complex
behavior of the sensor at these frequencies. By no means does it EXACTLY model this high
frequency system response. Depending upon the details of specific STS-1 sensor (and line driver
filters within the electronics), the high frequency corner may or may not be well approximated
by the chosen order of system. In general, the misfits will be somewhat higher at the high
frequency corner than they are at the low frequency corner. However, to many STS-1 users, the
fit accuracy at high frequency is of secondary importance, relative to that of the low frequency
corner.
The user of CALEX-MZ (MSEED) Suite assumes all liability and responsibility for the
generation and use of its data products.
CALEX-MZ (MSEED) User’s Manual, Rev 5.000
3 of 32
Introduction and Software Description
Metrozet’s CALEX-MZ (MSEED) Suite is a complete software package that is designed to apply a
temporal, forward convolution method to calibration data recorded from STS-1 seismometers that are
connected to Metrozet’s STS1-E300 electronics. The same software is applicable as well to calibration
data recorded from Metrozet's M2166-VBB seismometers. The suite is developed in the LabVIEW
programming language (LabVIEW 2009, National Instruments, Austin, TX). The program is
designed to work with data from a specific calibration mode within the STS1-E300 electronic
module: a velocity-equivalent SWEEP calibration. Specifically, the electronics should be
operated in “INTCALVELOCITY” mode and the BRB data should be generated from a
“SWEEP” signal. See the STS1-E300 User’s Manual for a detailed description of these modes.
There are two specific applications in the Suite: CALEX-MZ which works with ASCII data, and
CALEX-MZ-MSEED which works with Mini-SEED data.
The current version of the CALEX-MZ program (Rev 4.000) assumes that the data is in tab-delimited,
columnar ASCII format, with one column representing the SWEEP stimulus signal and another
column representing the sensor response signal.
The current version of the CALEX-MZ-MSEED program (Rev 4.000) assumes that the data is in MiniSEED format, with one file representing the single channel SWEEP stimulus signal and another file
representing the single channel sensor response signal.
Both programs then provide separate and independent fits to both the sensor’s low frequency (LF)
corner (nominally at 360 second period with damping that is 0.7 of critical) and high frequency (HF)
corner (between 10 and 15 Hz with damping between 0.4 and 0.7 of critical). The software reports
corner frequency and damping ratio (i.e., the descriptive components of an ideal 2nd order fit), as well
as poles and zeros. The HF fit has been enhanced to include 4th and 6th order fits (adding a second and
third conjugate pole pair to the response) in order to more accurately model the upper corner of the
instruments.
Basic Nature of STS1-E300 Velocity SWEEP Data
The STS1-E300 SWEEP signal (generated by an internal DAC in the module) consists of a long period
swept pseudosine (lasting approximately 1283 seconds and covering instantaneous periods from
approximately 128 seconds to well over 1500 seconds), followed by a high frequency stepped
pseudosine sequence (82 second duration, covering frequencies from 0.5 Hz to 40 Hz). The stimulus
signal is shown at the top of Figure 1. When the signal is used to excite an STS-1 sensor in
“INTCALVELOCITY” mode, the typical BRB response is shown in the bottom panel of Figure 1. The
important point to understand, vis-à-vis CALEX-MZ (MSEED), is that the low frequency portion of
the data can be used to determine the sensor’s low frequency corner parameters (2nd order high-pass),
while the high frequency portion can be used to determine the sensor’s high frequency corner
parameters (assumed 2nd order low pass). Note that the curvature of the signal level near the end of the
high frequency sequence is common (although non-ideal) with original STS-1 sensors. It is believed to
be related to a fundamental non-linearity in the sensor.
CALEX-MZ (MSEED) User’s Manual, Rev 5.000
4 of 32
Figure 1. STS1-E300 SWEEP Stimulus signal (top panel). Typical BRB output response to
SWEEP shown in bottom panel. The calibration was performed in velocity-equivalent mode
(“INTCALVELOCITY”).
Software Design
CALEX-MZ (MSEED) Suite is calibration analysis software which uses a brute-force grid search,
coupled with a LabVIEW-based linear fit (least square method), to find the poles/zeros which best
describe the sensor’s transfer function. There are separate, independent fits performed for both the low
and high frequency corners of the sensor response. The grid search approach is fairly simple: modern
PC processing power is used to step through all possible pole values, and to determine the best-fit
values for the recorded data. The process is iterated over a smaller and smaller parameter space in
order to provide a final fit of sufficient precision. The CALEX-MZ algorithm convolves a tentative
response function with the stimulus waveform, and compares this synthetic calibration response with
the measured one, in the time domain. The relative amplitude is adjusted and optimized via a simple
linear fit. The system pole values that provide the smallest mean-square error are deemed to be the
best-fit ones. The program starts with a very coarse search to find an initial set of best-fit values. Over
CALEX-MZ (MSEED) User’s Manual, Rev 5.000
5 of 32
subsequent iterations, the fit is narrowed until a near-exact solution is obtained. The use of multiple
iterations (say 21) of a grid search, with a fairly small number of steps (also, say 21), allows for a fine
solution in a very short time. Two parameters of the grid search control this iterative process. The
"Coarseness" is the number of iterations the search performs. The "Grid Search Dimension" is the
number of steps that each iteration goes through. Within each subsequent iteration the number of steps
remain the same, however the step size is reduced. This allows the algorithm to reach a fine solution
that nearly universally represents a global minimum in the mean square error. The exact values of the
Coarseness and Grid Search Dimension can be adjusted (optionally) via the “LF Data Rate Input
Window 1.vi” screen (Figure 5). However, during normal operation, this should not be necessary.
The 2nd order LF and HF grid search routines each have a pair of input parameters and ranges. The
parameters for both are damping and corner period, with an LF range of 0.00 to 0.99 (fraction of
critical) and 50 to 550 (seconds) respectively. The HF ranges are 0.00 to 0.99 (fraction of critical) and
0.01-1.00 (seconds) respectively. Both parameters are varied (stepped) independently to generate the
best-fit transfer function. Naturally, the corner period and damping can also be expressed as a pair of
conjugate poles. CALEX-MZ provides both forms of the solution to the user. A similar process
governs the 4th and 6th order grid search, but it no longer searches using the corner damping and corner
period formalism. Rather, the real and imaginary values of conjugate poles are used within the fit. This
generates the best fit values for the 2nd and 3rd poles, and their conjugates. The 4th and 6th order grid
search parameters are varied over a relatively wider range of real and imaginary values than those of
the second order. The same forward convolution process is employed in generating these higher order
fits. The program generates a synthetic calibration waveform from the measured stimulus signal and
then adjusts the transfer function parameters iteratively to best fit the recorded response waveform.
Interested users should contact Metrozet to discuss their specific needs, or if they have any questions
about this methodology.
Hardware and Operating System Requirements
CALEX-MZ (MSEED) is designed for use on standard PC computers running Microsoft Windows
(XP Media Center, XP Professional, Vista, and Windows 7). It has been tested on both types of XP
operating systems. Limited computer memory and/or CPU may slow the operation of CALEX-MZ
(MSEED) when processing large files.
CALEX-MZ (MSEED) User’s Manual, Rev 5.000
6 of 32
CALEX-MZ and CALEX-MZ-MSEED Software Installation
The CALEX-MZ and CALEX-MZ-MSEED software is available for download from Metrozet’s web
site (www.metrozetvbb.com). The software is contained in zipped folders:
“CALEX-MZ Rev 4.000 Software.zip” and “CALEX-MZ-MSEED Rev 4.000 Software.zip”
This directories contain two items, respectively:
“CALEX-MZ Rev 4.000 Installer” Folder
“256 Hz Velocity SWEEP Demonstration Data” Ascii Data File
and
“CALEX-MZ-MSEED Rev 4.000 Installer” Folder
“Single-channel Stimulus and Response SWEEP Demonstration Data” Mini-SEED Files
The Installer folders contain a Windows setup utility that installs an executable version of the software
to the target PC. The ASCII test data is a velocity-equivalent SWEEP from an actual STS-1 sensor
connected to Metrozet’s STS1-E300 electronics; the pair of Mini-SEED files are a stimulus and
corresponding response signal from a velocity-equivalent SWEEP from an actual STS-1 sensor. They
can be used for initial evaluation of the software. (The MSEED data is courtesy of Don Anderson at
Albuquerque Seismological Laboratory).
Download the zip file and expand it to a dedicated directory on the PC’s disk.
Software Setup
Enter the “CALEX-MZ” or “CALEX-MZ-MSEED” Rev 4.000 Installer folder and click on the
“setup” program. Follow the instructions to install CALEX-MZ Rev 4.000 or CALEX-MZ-MSEED
Rev 4.000 on the PC. A dedicated shortcut to the program will appear under the standard “start/All
Programs” listing.
CALEX-MZ-MSEED Installation Notes: CALEX-MZ-MSEED must be installed to the default
directory designated in the installer prompt, C:\Program Files (x86)\CALEX-MZ-MSEED.
To run CALEX-MZ-MSEED the user must make a permanent path setting for the java runtime
environment. Be very careful because the user system could crash if you make a mistake.
Proceed with extreme caution!
Go to the Windows Control Panel, choose "System," click on the "Advanced" tab, click on the
"Environment variables" button. In the lower list, "System variables," click on “Path:”
Click "Edit" and enter the path to the "bin" where the Java runtime environment (JRE) is located. On
some PCs this may be in : "C:\Program Files\Java\jdk1.5.0_09\bin". In others, it may be at "
C:\Program Files (x86)\Java\jre6\bin". The user should identify the actual path for the JRE on their
system, and enter this at the PATH line in the "System variables" box.
Do not put spaces before the appended path string.
Click OK on the path edit box and OK on the Environment Variables box. The new setting will go into
effect next time you run Command Prompt.
CALEX-MZ (MSEED) User’s Manual, Rev 5.000
7 of 32
Java runtime environment path designation:
Data File Format
CALEX-MZ
Data used by CALEX-MZ must be ASCII format, arranged in tab-delimited columns. The stimulus
signal must appear in one column and the response in a separate column. The data file may contain
multiple columns (containing, for example, data from other sensors), and the order of the columns is
unimportant. The program will ask the user to select the appropriate column number indices as part of
its operation. In general, the program can work with files that contain headers. That is, these headers
should not cause significant problems in its operation. The current version of the program does not
parse any header. It will simply try to load the header as if it is data. This may cause a small number of
erroneous points to be included within the stimulus and/or response data arrays within the program.
However, due to the fact that the program allows the user to define processing time windows, this is
unlikely to cause a problem.
The safest approach is to remove all headers from the file. The text file “256 Hz Velocity SWEEP
Demonstration Data” provides an example of a suitable data file format. Open it using Wordpad to
view its contents. It is simple and stark!
CALEX-MZ-MSEED
Data used by CALEX-MZ-MSEED must be in Mini-SEED format. Note: Mini-SEED file names
CAN NOT have spaces. Each file must contain a single channel of data; the first file selected being
the stimulus data, the second file selected being the response data. The program will use the ASCII
header generated by the Mini-SEED java conversion routine to determine the data-rate and data length
CALEX-MZ (MSEED) User’s Manual, Rev 5.000
8 of 32
used for the fitting routine. The program assumes “standard” Mini-SEED header content which will be
written to the ASCII file header after conversion
as follows:
Channel Name
Station Name (sometimes not shown)
Data Rate
Timestamp
Number of Points
Note: If the header does not display in the format described above or is missing from the indicator
window(s), then there is either a problem with the Mini-SEED file(s) or a problem with your
Window’s user Program Files (x86) folder permissions. The latter issue can be solved by right
clicking on the folders in question (C:\Program Files (x86)\CALEX-MZ-MSEED), selecting
Properties, selecting the Security tab, selecting the Advanced button, selecting the Owner tab, and
determining who is the current owner? If it is a name other than your user account, then you must
change the owner name to that of your user account, to do this select the Edit button, highlight your
user account, check the box labeled “Replace owner on subcontainers and objects,” click Apply, and
click Ok. Now close all properties windows. Right click on the folder in question’s properties again,
select the Security tab, click Edit, then highlight your user account and check the box labeled "Full
control," click OK. This should allow write and delete functions for your user in the Program Files
(x86) folder.
Efficient operation of the program requires that the data rate be sufficient for the specific fitting task:
a. Low Frequency Corner determination requires a data rate of at least 1 Hz. Data at rates
below this will not be processed. The program will stop. Data at rates between 1 Hz and 2
Hz will be used as-is in the analysis. Data at rates in excess of 2 Hz will be automatically
decimated (with an integer decimation factor) to a rate as close to 2 Hz as possible.
b. High Frequency Corner determination requires a data rate of at least 50 Hz. Data at rates
below this will not be processed. The program will stop. Data at rates between 50 Hz and
80 Hz will be used as-is in the analysis. Data at rates in excess of 80 Hz will be
automatically decimated (with an integer decimation factor) to a rate as close to 80 Hz as
possible. The raw data is also high-passed filtered (with a 0.5 Hz cutoff) prior to analysis of
the high frequency corner.
For CALEX-MZ the user will need to know (and provide) the exact sample rate for the raw data. As a
general rule, this needs to be known to an accuracy that is equal to the desired fit accuracy (e.g., a few
tenths of a percent).
CALEX-MZ Operation
Executable LabVIEW programs are very simple to operate. The user selects the program by navigating
to the CALEX-MZ Rev 4.000 shortcut visible under the Windows “start/All Programs” buttons. The
program will start upon opening. Normal operation will involve use of specific windows that are
opened (and closed) dynamically. At program start, the window “CALEX-MZ Main Rev 4.000.vi”
will be open. This is shown in Figure 3. Note that at the top of the panel there is a right-facing arrow
CALEX-MZ (MSEED) User’s Manual, Rev 5.000
9 of 32
that is colored black. This is a start arrow which can be used to start or re-start a suspended program.
The arrow is black when the program is executing and white when it is stopped. To its right is a stop
sign symbol. This can be used to stop the program. Under normal operation of CALEX-MZ, the user
should not need to access these “hard-start” and “hard-stop” buttons. That is, all operations of the
program can be controlled by buttons that appear within the panels. Figure 3 shows three such buttons:
1. “Fit Low Frequency Corner”. This begins a fit to the long period (swept pseudosine) portion
of the SWEEP stimulus. It starts a process that ultimately determines the LF Corner Period, LF
Damping Ratio, LF Conjugate Pole Pair, and LF Zero Pair for the sensor.
2. “Fit High Frequency Corner”. This begins a fit to the short period (stepped pseudosine)
portion of the SWEEP stimulus. It starts a process that ultimately determines the HF Corner
Period, HF Damping Ratio, and HF Conjugate Pole Pair.
3. “STOP”. This stops the program. It performs the same function as the stop sign symbol above.
A stopped program can be re-started by pushing the arrow to the left of the stop sign symbol.
“Fit Low Frequency Corner” Operation
When this button is selected, the following sequences occur:
a. A dialog box appears that asks the user to verify that the data is in the proper format and
that its meets the minimum data rate requirements as described above. This dialog box is
shown in Figure 4. The user verifies this information and hits “OK” to continue.
b. A dynamic window “LF Data Rate Input Window 1.vi” opens. This is shown in Figure 5.
The user enters the proper raw data rate and hits the “ENTER and Proceed” button when it
is correct. The user also has option to alter the filtering and grid search parameters, though
this is not recommended during normal analysis.
c. A dynamic window “Data Column Number Input 1.vi” opens. This is shown in Figure 6.
The user enters the proper column numbers for the stimulus and response data. Note that 0
(and not 1) is the first column index, per LabVIEW’s protocols. The user enters the
proper column numbers and hits the “ENTER and Proceed” button when they are correct.
d. A windows file dialog box “Choose file to read” opens. Navigate to the proper directory
and select the data file. This is shown in Figure 7.
e. A dynamic window “LF Input Data and Decimate 1.vi” will appear. At first, the top
indicator light (“Reading Raw Data”) will be illuminated. This will be the case for the time
it takes to read in the data (up to tens of seconds in some cases). This version of the window
is shown in Figure 8.
f. After the data has been read, a decimated form is plotted in the window. The middle
indicator light (“Displaying Decimated Data”) is illuminated. The decimated data frequency
is displayed next to this light. The decimated stimulus and response data is plotted. An
information box at the bottom of the window instructs the user to verify that the proper data
has been selected. Note that the decimated data (at or near 2 Hz, but as low as 1 Hz) may
look significantly different than the raw data in the region of the high frequency stepped
sine portion of the SWEEP. If the data looks appropriate, the user presses the button
marked “ACCEPT and Proceed”. This version of the window is shown in Figure 9.
g. The “Setting LF Analysis Window” light is then illuminated. Two data boxes appear, as do
green (start) and red (stop) cursors on the plots. The information box at the bottom of the
CALEX-MZ (MSEED) User’s Manual, Rev 5.000
10 of 32
window instructs the user as to the required steps. They can adjust the starting time of the
window (green cursor) by changing the value in the box marked “Starting Time for LF
Analysis (Seconds)”. The ending time for the window (“Ending Time for LF Analysis
(Seconds) can also be adjusted. The default window width is 1800 seconds, as is
appropriate for the low frequency portion of the SWEEP stimulus. The user should move
the window near the beginning of the LF sweep, taking care to avoid any localized
perturbations near the start or end of the sweep. When the window has been set, the user
presses the button marked “ACCEPT and Proceed”. This version of the window is shown in
Figure 10.
h. A new window (“CALEX-MZ LF Corner Rev 2.03.vi”) appears. The window is shown in
Figure 11. The indicator “Iterating Fit” is illuminated. A display of the iteration number
appears to the right of this indicator. Two plots appear. The top plot shows the measured
response signal (in white) superimposed with the synthetic fit data (in red). The lower plot
shows the misfit. As the iterations progress, the fit should improve and the misfit should
reduce. Note that both plots are auto-scaling. The routine continues for the number of
iterations set by the "Coarseness" variable (21 nominally). Typically, the relative misfit
should fall to well below 1% of the response signal before the process is completed. After
each iteration, the current value of the low frequency corner period and damping ratio is
displayed. Also displayed are the calculated poles for this corner. The zeros for this corner
are also listed as a reminder, but they are simply fixed at zero frequency. When the
iterations are finished, the “Finished” indicator is illuminated. The user can record the final
fit parameters and then hit the button “RETURN to MAIN Program”. This ends the LF Fit
process.
Figure 3. Screen shot of CALEX-MZ Main Rev 4.000.vi
CALEX-MZ (MSEED) User’s Manual, Rev 5.000
11 of 32
Figure 4. Screen shot of dialog box for “Fit Low Frequency Corner”.
CALEX-MZ (MSEED) User’s Manual, Rev 5.000
12 of 32
Figure 5. Screen shot of “LF Data Rate Input Window 1.vi”
CALEX-MZ (MSEED) User’s Manual, Rev 5.000
13 of 32
Figure 6. Screen shot of “Data Column Number Input 1.vi”.
CALEX-MZ (MSEED) User’s Manual, Rev 5.000
14 of 32
Figure 7. Selection of input data file.
CALEX-MZ (MSEED) User’s Manual, Rev 5.000
15 of 32
Figure 8. Screen shot of “LF Input Data and Decimate 1.vi”, during period that that raw data is
being read.
CALEX-MZ (MSEED) User’s Manual, Rev 5.000
16 of 32
Figure 9. Screen shot of “Displaying Decimated Data” step.
CALEX-MZ (MSEED) User’s Manual, Rev 5.000
17 of 32
Figure 10. Screen shot of “Setting LF Analysis Window” step.
CALEX-MZ (MSEED) User’s Manual, Rev 5.000
18 of 32
Figure 11. Screen shot of “CALEX-MZ LF Corner Rev 2.03.vi”
CALEX-MZ (MSEED) User’s Manual, Rev 5.000
19 of 32
“Fit High Frequency Corner” Operation
When this button is selected, following sequences occur:
i. A dialog box appears that asks the user to verify that the data is in the proper format and
that its meets the minimum data rate requirements as described above. This dialog box is
shown in Figure 12. The user verifies this information and hits “OK” to continue.
j. Figure 12b prompts the user to choose the order of filter to fit, i.e number of poles to find;
1, 2, or 3 pairs of conjugate poles.
k. A dynamic window “HF Data Rate Input Window 1.vi” opens. This is shown in Figure 13.
The user enters the proper raw data rate and hits the “ENTER and Proceed” button when it
is correct. The user also has option to alter the filtering and grid search parameters, though
this is not recommended during normal analysis.
l. A dynamic window “Data Column Number Input 1.vi” opens. This is shown in Figure 14.
The user enters the proper column numbers for the stimulus and response data. Note that 0
(and not 1) is the first column index, per LabVIEW’s protocols. The user enters the
proper column numbers and hits the “ENTER and Proceed” button when they are correct.
m. A windows file dialog box “Choose file to read” opens. Navigate to the proper directory
and select the data file. This is shown in Figure 15.
n. A dynamic window “HF Input Data and Decimate 1.vi” will appear. At first, the top
indicator light (“Reading Raw Data”) will be illuminated. This will be the case for the time
it takes to read in the data (up to tens of seconds in some cases). This version of the window
is shown in Figure 16.
o. After the data has been read, a decimated form is plotted in the window. The middle
indicator light (“Displaying Decimated Data”) is illuminated. The decimated data frequency
is displayed next to this light. The decimated stimulus and response data is plotted. An
information box at the bottom of the window instructs the user to verify that the proper data
has been selected. Note that the decimated data (at or near 80 Hz, but as low as 50 Hz) may
look significantly different than the raw data in the region of the high frequency stepped
sine portion of the SWEEP. Note also that the raw data is high-passed filtered (0.5 Hz
cutoff) in addition to being decimated. If the data looks appropriate, the user presses the
button marked “ACCEPT and Proceed”. This version of the window is shown in Figure 17.
p. The “Setting HF Analysis Window” light is then illuminated. Two data boxes appear, as do
green (start) and red (stop) cursors on the plot. The information box at the bottom of the
window instructs the user as to the required steps. They can adjust the starting time of the
window (green cursor) by changing the value in the box marked “Starting Time for HF
Analysis (Seconds)”. The ending time for the window (“Ending Time for LF Analysis
(Seconds) can also be adjusted. The default window width is 200 seconds, as is appropriate
for the high frequency portion of the SWEEP stimulus. The user should move the window
near the beginning of the HF stepped sine, taking care to avoid any localized perturbations
near the start or end of the steps. When the window has been set, the user presses the button
marked “ACCEPT and Proceed”. This version of the window is shown in Figure 18.
q. A new window (“CALEX-MZ HF Corner Rev 2.00.vi”) appears. The window is shown in
Figure 19. The indicator “Iterating Fit” is illuminated. A display of the iteration number
appears to the right of this indicator. Two plots appear. The top plot shows the measured
response signal (in white) superimposed with the synthetic fit data (in red). The lower plot
shows the misfit. As the iterations progress, the fit should improve and the misfit should
CALEX-MZ (MSEED) User’s Manual, Rev 5.000
20 of 32
reduce. Note that both plots are auto-scaling. The routine continues for the number of
iterations set by the "Coarseness" variable (21 nominally). Typically, the relative misfit
should fall to below a few percent of the response signal before the process is completed.
(If the fit accuracy is not sufficient, then the user can re-run the program and implement a
higher order fit.) After each iteration, the current value of the high frequency corner period
and damping ratio is displayed. Also displayed are the calculated poles for this corner. The
iterations are significantly slower here, owing to the higher data rates (larger number of
points) used in the analysis. When the iterations are finished, the “Finished” indicator is
illuminated. Also shown are screen shots (Figure 20 and 21) of the 4 Pole and 6 Pole fit.
The user can record the final fit parameters and then hit the button “RETURN to MAIN
Program”. This ends the HF Fit process.
CALEX-MZ (MSEED) User’s Manual, Rev 5.000
21 of 32
Figure 12. Screen shot of dialog box for “Fit High Frequency Corner”.
Figure 12b. Screen shot of dialog box for “CALEX-MZ Choose Order”.
CALEX-MZ (MSEED) User’s Manual, Rev 5.000
22 of 32
Figure 13. Screen shot of “HF Data Rate Input Window 1.vi”
CALEX-MZ (MSEED) User’s Manual, Rev 5.000
23 of 32
Figure 14. Screen shot of “Data Column Number Input 1.vi”
CALEX-MZ (MSEED) User’s Manual, Rev 5.000
24 of 32
Figure 15. Selection of input data file.
CALEX-MZ (MSEED) User’s Manual, Rev 5.000
25 of 32
Figure 16. Screen shot of “HF Input Data and Decimate 1.vi”, during period that that raw data is
being read.
CALEX-MZ (MSEED) User’s Manual, Rev 5.000
26 of 32
Figure 17. Screen shot of “Displaying Decimated Data” step.
CALEX-MZ (MSEED) User’s Manual, Rev 5.000
27 of 32
Figure 18. Screen shot of “Setting HF Analysis Window”
step.
Figure 19. Screen shot of “CALEX MZ HF 2Pole Corner Rev2.02.vi”
CALEX-MZ (MSEED) User’s Manual, Rev 5.000
28 of 32
Figure 20. Screen shot of “CALEX MZ HF 4Pole Corner Rev2.02.vi”
Figure 21. Screen shot of “CALEX MZ HF 6Pole Corner Rev2.02.vi”
CALEX-MZ (MSEED) User’s Manual, Rev 5.000
29 of 32
CALEX-MZ-MSEED Operation
The subtle difference between CALEX-MZ and CALEX-MZ-MSEED are the file selection prompts.
In CALEX-MZ the user selects a single ASCII file containing both data channels, while the CALEXMZ-MSEED version prompts the user twice for separate SEED files, stimulus and the response
channels. The prompt can be seen below as Figure 22.
Figure 22. Screen shot of Mini-SEED file prompt
Once the user has selected two Mini-SEED files with standard header information the below prompt
should appear, Figure 23. If for some reason one or both channel indicators do not display header
information as shown below it is most likely that one or both files did not convert correctly and/or do
not contain the standard Mini-SEED header information.
Figure 23. Screen shot of Mini-SEED file prompt with active file information displayed
CALEX-MZ (MSEED) User’s Manual, Rev 5.000
30 of 32
Upon successful conversion and header display of the Mini-SEED files, there are then options for each
channel’s count resolution, low or high. Low represents the standard case (e.g., Q330) in which the
40V input range is mapped into 24 bits (bit weight = 2.38 micro-Volts). High represents a high
resolution case (e.g., Q330HR) in which the 40V input range is mapped into 26 bits (bit weight = 0.596
micro-Volts. Once the desired resolution is chosen, the user selects both data channel buttons “Select
Stimulus Channel to Plot” and “Select Response Channel to Plot,” and then clicks “PRESS START
WHEN READY”.
The next prompt, Figure 24, should be a familiar prompt, it is almost identical to Figure 5 and Figure
13 of the previous CALEX-MZ examples, but missing from the prompt in Figure 24 is the data rate
input control; the data rate in CALEX-MZ-MSEED has been determined by that of the ASCII header
in each file and can be seen in the header display in the previous window, Figure 23.
Figure 24. CALEX-MZ-MSEED Data Input Window
Once past the file selection stages in CALEX-MZ-MSEED, the program operation is identical to that
of CALEX-MZ and the user may proceed as noted in the CALEX-MZ examples above.
CALEX-MZ-MSEED Note: CALEX-MZ-MSEED uses a temporary storage for its Mini-SEED and
ASCII files which can be found in C:\Program Files (x86)\CALEX-MZ-MSEED\data. If CALEX-MZMSEED is stopped at any time in between the program’s initial load and the completion of the fitting
routine, it is possible that this temporary folder will retain Mini-SEED and ASCII files which may
need to be manually flushed, as desired by the user.
CALEX-MZ (MSEED) User’s Manual, Rev 5.000
31 of 32
Contact Metrozet
If there are any questions, problems, or further needs regarding the CALEX-MZ (MSEED) suite,
please contact us.
Metrozet
21143 Hawthorne Blvd. #456
Torrance, CA 90503
424-201-5424
855-529-5550 toll free
[email protected]
www.metrozet.com
www.metrozetvbb.com
CALEX-MZ (MSEED) User’s Manual, Rev 5.000
32 of 32