1
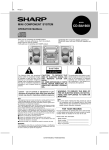
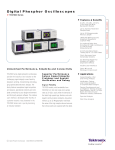
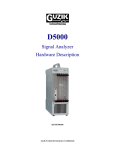
Bit Error Rate Tester
BitAlyzer® BA Series Datasheet
BER contour with automatic mask creation to measure and view the
eye diagram opening as a function of BER
Forward error correction emulation for built-in verification of FEC
performance on your communication system design
Error mapping provides you with the debugging support to identify the
cause and location of signaling errors
Applications
Semiconductor characterization
Production eye mask, BER, and jitter testing
Satellite communications system functional testing
DS_FeaturesBenefitsContainer
The BitAlyzer Bit Error Rate Testers BA Series are the industry's best
solution to the challenging signal integrity and BER issues faced by
designers verifying, characterizing, debugging, and testing sophisticated
electronic and satellite communication system designs.
Key performance specifications
Up to 1.6 Gb/s Pattern Generator/Error detector for fast, accurate
characterization of digital communications signaling systems
PRBS or 8 Mb user-defined patterns provide the versatility to debug or
verify any combination of digital signaling
ANSI jitter measurements (RJ, DJ, and TJ) to measure the impact of
random and deterministic jitter on the total jitter at BER of 10–12
Key features
Built-in clock source for extremely accurate timing
Wireless communications system functional testing
Fiber optic system and component testing
Forward error correction evaluation
Unmatched performance for greater insight
into your design to get your work done faster
The BitAlyzer series bit error rate testers are the industry’s best solution to
the challenging signal integrity and BER issues faced by designers
verifying, characterizing, debugging, and testing sophisticated electronic
and communication system designs.
The family features exceptional performance in signal generation and
analysis, operational simplicity, and unmatched debugging tools to
accelerate your day-to-day tasks. The most comprehensive suite of
physical-layer test tools available and the intuitive user interface provide
easy access to the maximum amount of information.
Adjustable amplitude, offset, logic threshold, and termination enable
signaling variations to stress test your receiver designs
Differential and single-ended I/O ensuring connectivity for a variety of
communications bus standards
BitAlyzer error analysis to rapidly understand your BER performance
limitations, assess deterministic versus random errors, perform detailed
pattern-dependent error analysis, perform error burst analysis, and
error-free interval analysis
Eye diagram display with automatic measurements and fast eye mask
testing for quick signal integrity analysis of the device under test
Q-factor measurement to swiftly analyze the vertical eye opening in
terms of BER
www.tektronix.com 1
Datasheet
Simple user interface
TThe BA1500 and BA1600 have the most advanced user interface found
on any bit error rate tester. The display offers easy-to-press control buttons
and generous status readouts. From the Home page view, users can learn
how to get started with the instrument. Convenient links to the internet,
technical support e-mail, and network and printer setup can be accessed as
well.
An intuitive user interface allows easy access to the impressive flexibility of the pattern
generator and internal clock source.
Factory presets are included for commonly used logic families. Moreover,
clock and data can be independently adjusted for amplitude and offset
levels for both differential and single-ended outputs.
Pattern detector
The Home view is the starting point for the BA1500 and BA1600. Use the touch-screen
buttons on the right-hand side to select the view, operating mode, and configuration of
the analyzer.
Users also receive the Quick Start user manual with simple step-by-step
tutorials that introduce the analyzer and some of the new analysis features.
Within an hour, users are performing instrument setup, making error
measurements, and studying bit error statistics.
Errors are identified using bit-by-bit comparison of the incoming data
stream with the expected sequence. Errors found in the received sequence
can be analyzed in real time by the internal processor and/or recorded to
the internal hard disk drive for later analysis or archive. The receiver will
automatically synchronize with one of five true or inverted pseudo-random
sequences or 8 Mb user patterns.
Pattern generator
The BA1500 and BA1600 include an internal data generator capable of
generating any one of five pseudo-random data streams, or a user-defined
sequence up to 8 Mb. Data generation is controlled by either the standard
internal clock source or an externally supplied clock input. Variable delay is
supported with 0.1% resolution within a bit period to adjust output skew.
User data patterns can be imported or created in the built-in editor.
Differential and single-ended inputs are supported and adjustments for threshold level
and termination voltage are allowed. Convenient logic family name setups can also be
used.
Differential and single-ended inputs are supported and are fully adjustable
for threshold and termination, with factory presets included for common
logic families. Auto Scale can find eye center in under two seconds.
2 www.tektronix.com
Bit Error Rate Tester -- BitAlyzer BA Series
User pattern editor
User data patterns for the generator and detector pattern memories can be
created or changed using the built-in pattern editor. Users can capture data
into the pattern editor from the error detector input and create reference
patterns. The pattern editor supports PRBS keywords, repeat loops, and
variable assignments. Users can work in either hexadecimal, decimal, or
binary.
The user interface for BER logging is very straightforward. Users set the BER threshold
and define what to log. The logging interval is the same interval used when measuring
BER in the Detector view.
Log files can be printed or archived and are an easy way to validate system
performance or to quickly see when time errors came in.
Basic BER statistics
This example user data pattern was captured from the incoming data stream and then
altered manually before being sent to the pattern generator as the output data sequence.
Pattern files are stored on the Windows file system and can be imported or
accessed through the provided network interface. Patterns can easily be
shared between BA1500s and BA1600s.
Error Location analysis is the patented method of allowing the available
computer processing power to study the exact bit locations of errors found
during a test. With the exact bit locations, the BitAlyzer can uncover error
dependencies and correlations far better than when using simple error
rates. Error Location analysis is included in the Physical Layer Test Suite
option.
Error log
A common application for BER monitoring requires logging error
measurements and other significant events during an extended test. The
BA1500 and BA1600 has a built-in logging feature that can be set to log
BER values worse than a programmable threshold at an interval set by the
user. Along with monitoring the BER value, other events including
synchronization loss or settings changes are also logged.
The individual error rates and counts for bit versus burst errors are displayed on the
Basic BER view. This simple separation can focus debugging efforts in the right area.
www.tektronix.com 3
Datasheet
Tabular results of separate bit and burst error statistics are also monitored,
giving the user convenient access to the number of burst events as well as
error counts and rates. All error location analysis data can either be
analyzed in real time or be recorded to an internal hard disk drive for later
analysis or archive. The analysis engine has controls to allow setting file
names, error recording modes, and other settings.
Error-free intervals
Error-free Interval analysis shows how often different error-free intervals
have occurred in the system under test. Error-free intervals that occur more
often than others indicate systematic, rather than random, error behavior.
At the same time, the length of a repetitive error-free interval points to the
frequency of interference, giving an excellent clue as to what might
correlate to the unwanted errors.
Strip chart of BER
Trends are very important when studying error rates. Strip charts have
commonly been used to monitor measurements versus time. The built-in
Strip Chart view on the BitAlyzer allows users to watch bit, burst, and total
error rates versus time. The speed of the time axis can be set by adjusting
the number of bits to be included in each bit error rate measurement.
Additionally, the zoom level of the display can be set.
Error-free intervals that are repetitive are a sure sign of a systematic error. Finding spikes
such as these during a measurement can quickly indicate the interfering frequency.
Bit error rate trends are easily seen on a strip chart. Thermal cycling or changing
conditions that affect communications can be tracked.
Repetitive errors that occur at low frequencies can be isolated with this
view. For example, a burst of errors that happens every 6 seconds would
be easy to spot. Strip charts also work on live or recorded error data sets.
The Strip Chart view is included in the Physical Layer Test Suite option.
4 www.tektronix.com
Error-free interval information can accumulate very quickly, so it does not
take a lot of data or long tests to isolate error interferences. The BA1500
and BA1600 error-free interval analyzer can be set to study short or long
error-free intervals by adjusting the starting and stopping point of the
histogram view. Error-free Interval analysis is included in the Physical Layer
Test Suite option.
Pattern sensitivity
The Pattern Sensitivity analysis capability is an outstanding way of
identifying data-dependent errors. This histogram shows the number of
errors for every bit position of the test pattern used. Test patterns can be
either the built-in PRBS patterns, or user-defined patterns. The cursors can
be used to find the data values at and around the locations of patterndependent errors.
Bit Error Rate Tester -- BitAlyzer BA Series
Digital processing errors will often cause a repetitive error length, while
interference will often have some variation in error length. This analysis is
often used with the Error-free Interval analysis to get a better understanding
of both the size and frequency of errors. Burst length histograms are
included in the Physical Layer Test Suite option.
Error correlation
Finding correlations between system architectures or physical happenings
and bit error statistics is the key to identifying the cause of many errors.
The techniques in Error Location analysis are designed to find these
correlations. The correlation analysis lets users set a block size as either a
fixed number of bits (a data bus width or a packet size), or as an interval
defined by an external marker input (a sector marker on a disk drive, or a
rotation marker in an engine), to see how errors correlate to these blocks.
In this case, a 127-bit PRBS7 pattern was used and the detected errors correlated
strongly to the data pattern. Notice the NRZ data display below the histogram that shows
the highlighted data bit values at the cursor location.
Extended tests with long PRBS patterns may fail because of a few errors.
By using this analysis, it is easy to see if all the errors were due to the
same bit sequence in the test pattern or were randomly distributed in the
pattern. Pattern Sensitivity analysis is included in the Physical Layer Test
Suite option.
Burst length histogram
Bit and burst errors are typically caused by different physical phenomena.
The BitAlyzer can measure burst error lengths up to 32,000 bits and show
them in a histogram, allowing the user to quickly distinguish between error
types. Users define the requirements that must be met to have a burst
error. Burst length histograms are helpful as signatures for "normal"
operation as well as when designing error correction coding systems.
When testing MUX/DEMUX circuits, correlation to the multiplexer width can show if
errors happen in the serial domain or in the parallel domain.
When all bit positions within the block size have an equal number of errors,
then no correlation is found; however, if specific offsets within the block
have abnormally higher error rates, then a correlation exists. Error
Correlation is included in the Physical Layer Test Suite option.
This is a typical burst length histogram in a Viterbi-protected communications channel.
Cursors can be used to measure the number of bursts.
www.tektronix.com 5
Datasheet
Block error analysis
Many popular systems have performance that is more related to block error
rates rather than bit error rates. The BA1500 and BA1600 allow the user to
define a block size to display a histogram of the number of times blocks
occur that have various numbers of errors in them.
The optional eye diagram can be used to visually check the data input waveform quality
before bit error rate tests are performed.
Block error statistics are often more important to system operation than exact bit error
measurements. Block sizes can be adjusted and histograms show how many times
blocks occur with different numbers of errors in them.
Cursors can conveniently be used to find out how many blocks have
occurred with more than some specific number of errors inside. The
maximum block size is 4 billion bits, making this a very powerful analysis
for common block sizes. Block Error analysis is included in the Physical
Layer Test Suite option.
Eye diagram
Automatic measurements of rise/fall times, jitter, amplitude, noise levels,
and eye-opening ratio are provided. Users can pan or zoom around the eye
diagram to understand the exact behavior of the signal being used for bit
error rate testing. The eye display shows the combination of effects from
the user's signal and the BER decision circuit.
Mask test
Eye mask testing is a part of the Physical Layer option. Fast eye mask
testing is a key element in test productivity. Common oscilloscope methods
operate at a fixed effective sampling rate requiring mask tests to run for
many, many seconds. By using BER-based methods, mask perimeters
inside, above, and below the eye can be tested to far greater confidence in
a few seconds.
The Eye Diagram display is part of the Physical Layer option. This display
shares the same sampling electronics as the BER function and provides
convenient eye diagrams without the need for swapping cables among
instruments.
Industry-standard and custom masks are tested many times faster using built-in BERbased methods.
6 www.tektronix.com
Bit Error Rate Tester -- BitAlyzer BA Series
Standard mask templates are available and the built-in editor can be used
to create custom ones. Masks can also be automatically created from the
BER Contour analysis, allowing users to create a golden mask at a
prescribed BER level. Masks can be scaled and repositioned.
Q-factor analysis
BER contour
Bit Error Rate Contour measurement is part of the Physical Layer option.
This analysis computes the bit error rate around the perimeter of the eye
opening and fits these results to the expected bit error rate response curves
predicted by additive noise. The depth of the contours can then be
extrapolated to lower levels than the actual measurement would allow.
Q-factor analysis is part of the Physical Layer option. Q-factor is to the
amplitude domain what jitter is to the time domain. Q-factor is a measure of
the signal-to-noise ratio of the amplitude. It says how clean the vertical eye
opening is. This relates to how easily you will be able to make a 1 or 0 logic
decision.
The accuracy of the BER contour improves as the test runs longer. This example took
1.5 minutes to collect. The best predicted BER and sampling location are also shown.
BER contours are used to identify how much headroom may be present in
a system after considering the amount of decision-point variation that might
occur. BER contours can also be exported as golden masks for mask
testing against a known good sample.
This Q-factor display was done in 13 seconds. The best decision level is shown by the
cursor. Note this is not in the center of the opening, as the voltage rail around 100 mV
has a wider standard deviation.
The BitAlyzer can do this most efficiently because of its naturally high
sample rate but, most importantly, it can do it for only those waveform
transitions that are nearest to the middle of the eye - the ones that would be
first to be mistaken and cause bit errors.
The results of Q-factor analysis show the best predicted BER value
expected, along with the optimum decision-level voltage.
Jitter peak
Jitter testing is part of the Physical Layer option. It provides Random Jitter
(RJ), Deterministic Jitter (DJ) and Total Jitter (TJ) measurements
automatically, using the fast BER-scan technique. Jitter measurement
accuracy is a function of the sample size used, and no competing jitter
measurement technique can match the data gathering efficiency of using
BERT scan data. More comprehensive BER measurements mean that
there are more significant data points to use when extrapolating BER to
make precise jitter measurements.
www.tektronix.com 7
Datasheet
One-dimensional correctors allow users to set the number of symbols in an
FEC block and the number of possible corrections. One-dimensional
correctors can be preceded by a two-dimensional interleave, allowing
improved burst error correction capability.
Two dimensions of correction can also be used to implement product-array
correctors. In this case, the user specifies the number of rows and columns
in the product array, along with the correction strength in both dimensions.
As errors are found during the test, they are placed into the emulating table
according to the interleaving configuration and, as the table fills, each
enabled corrector is checked for cases where the number of errors exceeds
the correction strength in any FEC codeword.
In the case of two-dimensional correctors, users can also set a
configuration to use inner code failures as an outer code erasure. In this
mode, single large burst correction capability can be doubled.
To get better results, BER data above 1e -4 BER are not used when predicting deep BER
values. The longer the test runs, the more precise the measurements become.
The left-hand and right-hand sides of the jitter distribution are measured
separately. The center green area shows the deterministic jitter between
the two outermost gaussian distributions.
Forward error corretion emulation
Forward Error Correction Emulation analysis is included in the Physical
Layer Test Suite option. Because of the patented error location ability, the
BitAlyzer knows exactly where each error occurs during a test. By
emulating the memory blocks typical of block error correcting codes such
as Reed-Solomon architectures, bit error rate data from uncorrected data
channels can be passed through hypothetical error correctors to find out
what a proposed FEC approach would yield.
FEC parameters are defined and can be used on live or recorded error data sets. Many
different FEC architectures can be tested quickly on a single error data set.
Users can set up error correction strengths, interleave depths, and erasure
capabilities to match popular hardware correction architectures.
8 www.tektronix.com
During FEC processing, users can see the number of times each code is
used and the number of failures. Code efficiency is calculated and
displayed as well.
Using the FEC analysis tools of the BA1600 on a digital channel enables
FEC designers to tune the architecture for the actual error statistics present
in the channel. If a channel suffers from pattern sensitivity or burst
interferences, then these conditions will be presented to the FEC exactly.
This is significantly better than software error correction simulations that
often base their errors on white noise.
2D error mapping
2D error mapping is included in the Physical Layer Test Suite option. This
analysis creates a two-dimensional image from errors found during the test.
Users specify a blocking factor, often chosen based on architectural
parameters of the communications system or physical interactions.
2D error maps conveniently show hours or microseconds of data collection. Blocks of
user data are lined up column-by-column to show error correlations.
Bit Error Rate Tester -- BitAlyzer BA Series
Pattern synchronization
Burst and nonburst errors are shown in different colors. In this display, a background
burst problem is superimposed on other nonburst error types. A distinct nonburst error
problem exists around 24,500 bits into the packet.
The error map is a vertical raster-scan image where errors cause pixels to
illuminate on the display. Errors that are from bursts are shown in a
different color to allow easy visual separation of burst and nonburst errors.
Blocking factors may correspond to any size, including packet sizes,
multiplexer widths, or interleave depths. Blocking factors can also be
determined by external marker signals. For instance, index markers from
rotating disk drives can be used to make 2D maps that show repeating
reads of a disk cylinder across the display. Errors repetitively found at the
same location on the disk would cause horizontal streaks in the error map.
Error mapping based on packet size or multiplexer width can show if errors
are more prone to particular locations in the packet or particular bits in the
parallel bus connected to the multiplexer. This visual tool allows for human
eye correlation, which can often illuminate error correlations that are
otherwise very difficult to find - even with all the other error analysis
techniques.
Error maps can be quickly panned and zoomed throughout hours of data
collection. Cursors define regions, and the number of errors found inside
the region is displayed. This tool provides the ultimate in visualizing how
errors occur in systems.
The BA1500 and BA1600 support synchronizing to both PRBS and userdefined patterns (up to 8 Mb). Unlike other BER testers, user-defined
patterns can be synchronized using two methods - one for speed and one
for accuracy. For speed, user-pattern synchronization can be done by
learning a repeating pattern from the incoming data. This typically takes
only a few passes through the user pattern to gain synchronization, and is
typically done fast enough to allow user-defined patterns during fiber
recirculating loop experiments, or other applications where fast resynchronization is required. For accuracy, the BitAlyzer can be preloaded
with the expected user pattern such that a hardware-accelerated search
can be done to find synchronization.
External control of pattern generator and
error detector
BER experiments often require gating error measurement, precise timing of
re-synchronizations and bursty packet-like data. The BitAlyzer has user
blank inputs to gate where errors are counted and to control external resynchronization. Marker signals can be provided to customize analysis
results for specific applications.
Unique to the BitAlyzer Family, the pattern generator can be externally
triggered to restart the pattern sequence. This allows transmitting packettype data under external control, or synchronizing multiple pattern
generators.
Differential inputs
Many modern high-speed communications systems employ differential
signaling to improve common-mode noise rejection. For this reason, it is
important to make bit error rate measurements using a true-differential
receiver. At the same time, variable threshold for logic decisions is also a
must for analysis techniques such as jitter measurements, eye diagrams,
and mask tests.
The BA1500 and BA1600 have a new input technology that allows variable
thresholds with settable DC termination voltages on differential input
signals at very high data rates, while maintaining excellent return-loss
performance.
Typical data and clock outputs of the BA1600 at 1.5 Gb/s with 2 V p-p amplitude settings.
www.tektronix.com 9
Datasheet
Automatic delay calibrations
Precise variable-delay settings are critical to analysis such as jitter, mask
testing, and eye diagrams. Past variable-delay technology has either been
slow or was not able to maintain delay calibrations over long time periods
or at different frequencies.
The BitAlyzer includes a new technology for automatically calibrating the
entire variable-delay element with sub-picosecond resolution capability in
less than a second. Because this is so fast, it is convenient to allow recalibration when changes in temperature or frequency occur that might
cause delay error.
Automatic eye masks
Mask templates for eye diagram testing often come from industry-standard
definitions; however, these masks are usually only good for go/no-go type
testing. More precise masks that circumscribe the details of a particular
device output waveform can be used to monitor minor variations to
production practices.
The Bit Error Rate Contour analysis is the first bit error rate tester that
automatically exports eye diagram masks created from bit error rate data
taken around the perimeter of the eye.
Error location analysis
The BitAlyzer family of bit error rate testers have the added capability to
study and archive the exact bit location of each error in the data stream.
10 www.tektronix.com
This proven method has been used in applications over the last 10 years to
isolate error causes, find correlations, identify interference and, in general,
to solve problems. Error Location analysis can be done easily using the
same test setups typically used for regular bit error rate testing.
EyeDiagraming
Eye diagrams are efficiently collected and correspond precisely to the bit
error rate test data taken with the same device.
Pixel-by-pixel sampling, achieved by quickly positioning the decision
window voltage and time to each pixel in the display, creates eye diagrams.
Output drivers
The output drivers in the BitAlyzers come from technology developed for
10 Gb/s communications systems. Precise designs provide for low jitter
outputs with fast edge rates, and allow flexibility to change voltage
amplitudes and offsets to cover all popular logic families. As current
sources, the user interface allows setting the destination impedance and
termination voltage to maintain calibrated voltage swings.
Bit Error Rate Tester -- BitAlyzer BA Series
Specifications
All specifications apply to all models unless noted otherwise.
Pattern generator specifications
Maximum frequency
BA1500
1500 MHz (1.5 GHz)
BA1600
1600 MHz (1.6 GHz)
Minimum frequency
Internal clock
800 kHz
External clock
100 kHz
External clock/pattern start
SMA
Configuration
Single ended
Threshold
–2 V to +4 V
Termination
–2 V to +3.3 V
Clock/data output
SMA
Configuration
Differential
Amplitude
70 mV to +2 V
Offset
-1.85 V to +3.85 V
Logic families
PECL/LVPECL/LVDS LVTTL/CML/ECL
Rise/Fall
≤130 ps 1
Delay range
30 ns or 1 UI
Delay resolution
1% UI or 1 ps
Trigger output
BNC
Type
CLK/64 or pattern
Pattern position
Programmable
Amplitude
>1 V
A/B pattern switch
BNC
Threshold
TTL
Data types
Pseudo-random
x7 + x6 + 1
x15 + x14 + 1
x20 + x17 + 1
x23 + x18 + 1
x31 + x28 + 1
User defined
96 bits - 8 Mb
2-4 Mb A/B pages
32-bit word size
1
Rise/Fall times are measured 20% to 80% with PECL logic family settings.
www.tektronix.com 11
Datasheet
Pattern generator specifications
Error insertion
Length (bits)
1, 2, 4, 8, 16, 32, 64, 128
Frequency
Single or repetitive
Error detector specifications
Maximum frequency
1600 Mb/s
Minimum frequency
BER measurements
100 Kb/s
Auto-optimize eye
70 Mb/s
Physical-layer tests
70 Mb/s
Clock/Data Inputs
SMA
Configuration
Differential or single
Threshold
-2 V to +4 V
Termination
-2 V to +3.3 V
Delay range
30 ns or 1 UI
Delay resolution
0.1% UI or 1 ps
Sampling edge
Rising or falling clock
Sensitivity - Single
60 mVp-p (typical)
Sensitivity - Differential
40 mVp-p (typical)
Start detect
SMA
Configuration
Single ended
Threshold
-2 V to +4 V
Termination
-2 V to +3.3 V
Function
Trigger data grab
Trigger output
BNC
Type
CLK/64 or pattern
Pattern position
Programmable
Amplitude
>1 V
Error output
BNC
Function
32-bit pulse at error
Amplitude
>1 V
Marker input
BNC
Threshold
TTL
Function
Error analysis locator
Maximum frequency
4 kHz recommended
Blank input
BNC
Threshold
TTL
Function
Ignore errors at active
Re-synchronization
Opt. triggered by edge
Minimum resolution
32 bits
12 www.tektronix.com
Bit Error Rate Tester -- BitAlyzer BA Series
Error detector specifications
Data types
Pseudo-random
x7 + x6 + 1
x15 + x14 + 1
x20 + x17 + 1
x23 + x18 + 1
x31 + x28 + 1
User defined
96 bits - 8 Mb
32-bit word size
Re-synchronization
Manual
Push-button or blank
Automatic
Programmable error threshold
User grab
Find repeating pattern
User shift
Hardware pattern search
Data capture
Up to 8 Mb capture
Measurements
BER, bit, re-sync PG/ED clock frequency
Views
Home view
Starting page
Generator
Generator settings
Detector
Detector settings
Editor
Edit patterns, masks
System
Utility tools
Log
Long-term BER log
Error analysis views
Standard
Basic BER
Table of BER statistics
Burst length
Histogram of burst size
Error-free interval
Histogram of intervals
Correlation
Error position histogram
Pattern sensitivity
Errors within pattern
Block mode
Errors per block histogram
Strip chart
BER versus time chart
Physical layer test views
Optional
Eye diagram
Display eye diagram
BER contour
Map BER around eye
Mask test
Perform mask tests
Jitter analysis
DJ/RJ/TJ jitter measurement
Q-factor analysis
Setup and display Q
Error location capture
Live analysis
Continuous
Error logging capacity
Maximum 2 GB file size
www.tektronix.com 13
Datasheet
Error detector specifications
Error events
10,000
Maximum burst length
32 kb
General specifications
TFT display
640 × 480 VGA, 8.4"
Touch sensor
Analog resistive
Self-test
On power up
Processor
1.66 GHz N455
USB 2.0
On instrument rear side
Hard disk drive
160 GB or higher
Keyboard
65 key USB
DRAM
1 GB
Operating system
Windows 7
Monitor output
DB-15 VGA
Mouse
USB
Remote control
IEEE-488 or TCP/IP
Network interface
10/100/1000 MB Ethernet
Weight
16.34 kg (36 lbs.)
Power
285 W, 100-240 VAC
Size
218.4 mm × 419.1 mm × 488.9 mm (8.6 in. × 16.5 in. × 19.25 in.)
14 www.tektronix.com
Bit Error Rate Tester -- BitAlyzer BA Series
Ordering information
Models
BA1600
BA1500
Standard instrument
1.6 Gb/s Pattern Generator and Error Analyzer
Option PL
Add Physical Layer Test Suite, MAP (Error Mapping analysis), and ECC (Error Correction
Coding emulation)
Standard instrument
1.5 Gb/s Pattern Generator and Error Analyzer
Option PL
Add Physical Layer Test Suite, MAP (Error Mapping analysis), and ECC (Error Correction
Coding emulation)
www.tektronix.com 15
Datasheet
ASEAN / Australasia (65) 6356 3900
Belgium 00800 2255 4835*
Central East Europe and the Baltics +41 52 675 3777
Finland +41 52 675 3777
Hong Kong 400 820 5835
Japan 81 (3) 6714 3010
Middle East, Asia, and North Africa +41 52 675 3777
People's Republic of China 400 820 5835
Republic of Korea 001 800 8255 2835
Spain 00800 2255 4835*
Taiwan 886 (2) 2722 9622
* European toll-free number. If not accessible, call: +41 52 675 3777
Austria 00800 2255 4835*
Brazil +55 (11) 3759 7627
Central Europe & Greece +41 52 675 3777
France 00800 2255 4835*
India 000 800 650 1835
Luxembourg +41 52 675 3777
The Netherlands 00800 2255 4835*
Poland +41 52 675 3777
Russia & CIS +7 (495) 6647564
Sweden 00800 2255 4835*
United Kingdom & Ireland 00800 2255 4835*
Balkans, Israel, South Africa and other ISE Countries +41 52 675 3777
Canada 1 800 833 9200
Denmark +45 80 88 1401
Germany 00800 2255 4835*
Italy 00800 2255 4835*
Mexico, Central/South America & Caribbean 52 (55) 56 04 50 90
Norway 800 16098
Portugal 80 08 12370
South Africa +41 52 675 3777
Switzerland 00800 2255 4835*
USA 1 800 833 9200
Updated 10 April 2013
For Further Information. Tektronix maintains a comprehensive, constantly expanding collection of application notes, technical briefs and other resources to help engineers working on the cutting edge of technology. Please visit www.tektronix.com.
Copyright © Tektronix, Inc. All rights reserved. Tektronix products are covered by U.S. and foreign patents, issued and pending. Information in this publication supersedes that in all previously published material. Specification and
price change privileges reserved. TEKTRONIX and TEK are registered trademarks of Tektronix, Inc. All other trade names referenced are the service marks, trademarks, or registered trademarks of their respective companies.
26 Feb 2014
www.tektronix.com
65W-25538-5