1
A
B
C
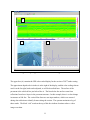
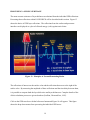
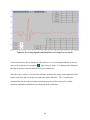
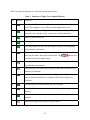
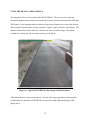
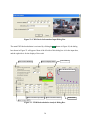
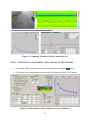
Figure 6. Opening PAVECHECK Screen Showing US77 Data.
The upper box (A) contains the GPR color-coded display for the section of US77 under testing.
The approximate depth scale in inches is at the right of the display, and the color-coding scheme
used is at the far right; both can be adjusted, as will be described later. The surface of the
pavement is the solid red line just below Box A. The lines below the surface come from
reflections from lower layers in the pavement structure. In this example, there is a clear change
in structure at 200 feet. The vertical blue lines are user input markers, which were entered
during data collection to identify features along the section. The operator maintains a log of
these marks. The black “tick” marks at the top of this box indicate locations where a video
image was taken.
11