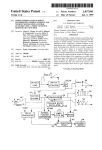
1
User Manual
www.simapp.com
for Windows 2000/XP/Vista
Version 2.6
END USER LICENSE AGREEMENT
The software product “SimApp” with its editions “Light”, “Workstation” and “Server” is owned by Buesser Engineering
(BE) and is protected by copyright law and international copyright treaty. BE owns all the intellectual property rights, title,
copyright and associated trademarks. The software is licensed for use, not sold.
Upon your acceptance and conformance to allthe terms and conditions of this End User License Agreement (EULA),
Buesser Engineering grants you the right to use the Software in the manner provided below.
The right to use the SimApp software editions (Software) Light and Workstation is limited to the installation and use on a
single computer (client), no matter if it is a stand-alone computer, a workstation in a local area network or any other kind
of multi-station computer system. Each instance of a virtual machine counts as one client. If you want to install these
editions on more than one computer you must obtain the appropriate number of licenses.
The right to use SimApp Software Server edition on a local area network or any kind of other multi-station computer systems includes the right to install the software on a single network server computer and to load it into the main memory of
the number of clients connected to the server allowed by the license. The installation and use on more than one network
is prohibited unless the appropriate number of licenses is obtained.
ACADEMIC EDITIONS
Academic users and students must provide proof of qualified status prior to registering for a license. The Student license
expires one year from the date of installation.
TRANSFER: If you change the hardware where SimApp is installed, you must completely remove the Software from the
mass storage attached to that computer. Simultaneous installation and use of the Software on more than one computer
(stand-alone workstation or network server) is prohibited. You may make a one time transfer of your license to another
person. The transfer must include all the Software, documentation, upgrades and media associated with the Software.
That person must re-register in his/her name, and accept the terms of this EULA. After the transfer, you must completely
remove the Software from the computer in which it was originally installed. You are authorized to keep one copy of the
Software as a backup copy.
It is prohibited to decompile, disassemble or reverse engineer the Software or to try to get the source code of the Software by any other means. It is prohibited to change or translate the Software or to produce derived products.
You may not rent, lease to others, or commercially host this Software.
Use of documentation and help information is for internal, non-commercial use only. You may use information
you create with SimApp (such as model diagrams, time and frequency plots) in your documentation or published works provided you give credit to SimApp in a reasonably visible manner.
LIMITED WARRANTY
Buesser Engineering (BE) warrants for sixty days (60) from delivery to the end-user the media on which the Software is
furnished will be free of defects in materials and workmanship under normal use. This limited warranty extends only to
the original licensee. Customer's sole and exclusive remedy and the entire liability of BE and its suppliers under this limited warranty will be replacement of the defective media, or an updated download. BE reserves the right to provide an
updated edition of the Software instead of the original version.
The Software is provided AS IS without warranty. In no event does BE warrant that the Software is error free or that
Customer will be able to operate the Software without problems or interruptions. In addition, due to the continual development of new techniques for intruding upon and attacking networks, BE does not warrant that the Software or any
equipment, system or network on which the Software is used will be free of vulnerability to intrusion or attack.
LIMITATION OF LIABILITY AND REMEDIES
In no case shall Buesser Engineering, its agents, contractors or suppliers, be liable for any indirect, incidental, special,
punitive, or consequential damages or losses, including, without limitation, lost profits or the inability to use equipment or
access data, due to the use of the Software.
Notwithstanding any damages you may incur for any reason, your exclusive remedy hereunder shall be limited to the
lesser of 5 Swiss Francs, or the amount actually paid by you for the Software. You agree to indemnify and defend BE
against any lawsuits or claims resulting from your use of the Software.
User Manual
SimApp
Version 2.6
for Windows 2000/XP/Vista
This manual and the SimApp software are protected by copyright. All rights are reserved by Buesser Engineering.
Copying or reproduction in whole is permitted if the copy is complete and unchanged (including this copyright statement). Copying or reproduction in part is forbidden.
Claims against Buesser Engineering that are above and beyond the warranty are invalid. Specifically
Buesser Engineering accepts no responsibility for the validity of the contents of this manual. Changes to the
software can be made at any time without notice.
All trademarks are named exclusively for information purposes.
Edition: February 2009
Copyright © 1998-2009 by Buesser Engineering
SimApp
Contents
Contents
1
Introduction............................................................................................................................................... 1
1.1
1.2
1.3
What is SimApp for? ........................................................................................................................... 1
Who can or should use SimApp?........................................................................................................ 1
Using help ........................................................................................................................................... 1
1.3.1
1.3.2
1.4
2
Launch help application............................................................................................................................... 1
Context-sensitive help ................................................................................................................................. 1
Technical support................................................................................................................................ 2
Installation................................................................................................................................................. 3
2.1
2.2
2.3
License terms...................................................................................................................................... 3
System requirements .......................................................................................................................... 3
Installation ........................................................................................................................................... 3
2.3.1
2.3.2
3
Internet Download ....................................................................................................................................... 3
CD ............................................................................................................................................................... 3
SimApp Main Window .............................................................................................................................. 4
3.1
3.2
Overview ............................................................................................................................................. 4
Menus.................................................................................................................................................. 4
3.2.1
3.2.2
3.3
Main menu................................................................................................................................................... 4
Pop-up menus ............................................................................................................................................. 4
Toolbars and controls.......................................................................................................................... 4
3.3.1
3.3.2
3.3.3
3.3.4
3.4
3.5
4
File toolbar................................................................................................................................................... 4
Palette ......................................................................................................................................................... 4
Moveable toolbars ....................................................................................................................................... 5
Library toolbars............................................................................................................................................ 5
Status bar ............................................................................................................................................ 5
Error bar .............................................................................................................................................. 5
Introductory Example............................................................................................................................... 6
4.1
4.2
4.3
Launch SimApp................................................................................................................................... 6
Views and page arrangements ........................................................................................................... 6
System modeling................................................................................................................................. 6
4.3.1
4.3.2
4.3.3
4.4
From real system to block diagram.............................................................................................................. 6
Connecting objects ...................................................................................................................................... 7
Changing block parameters......................................................................................................................... 7
Simulations.......................................................................................................................................... 8
4.4.1
4.4.2
4.4.3
5
Time simulation ........................................................................................................................................... 8
Frequency simulation .................................................................................................................................. 9
Simulation list box...................................................................................................................................... 10
Drawing Functions ................................................................................................................................. 12
5.1
5.2
Introduction ....................................................................................................................................... 12
Drawing objects................................................................................................................................. 12
5.2.1
5.2.2
5.2.3
5.2.4
5.2.5
5.2.6
5.2.7
5.2.8
5.2.9
5.2.10
5.3
5.3.1
5.3.2
5.3.3
5.4
5.4.1
5.4.2
5.4.3
5.4.4
5.5
Lines.......................................................................................................................................................... 12
Rectangles and squares............................................................................................................................ 12
Rounded rectangles and squares.............................................................................................................. 12
Ellipses and circles .................................................................................................................................... 12
Polylines .................................................................................................................................................... 12
Polygons.................................................................................................................................................... 13
Signal lines ................................................................................................................................................ 13
Text ........................................................................................................................................................... 14
Pictures ..................................................................................................................................................... 14
Arrow ......................................................................................................................................................... 14
Formatting objects............................................................................................................................. 14
Format toolbar ........................................................................................................................................... 15
Format properties ...................................................................................................................................... 15
Default formatting attributes ...................................................................................................................... 16
Rearranging and changing objects ................................................................................................... 16
Flip and rotate objects ............................................................................................................................... 16
Ordering objects ........................................................................................................................................ 16
Snap objects to grid................................................................................................................................... 17
Grouping objects ....................................................................................................................................... 17
Important auxiliary keys .................................................................................................................... 17
II
Contents
6
Simulation Objects ................................................................................................................................. 18
6.1
6.2
Description ........................................................................................................................................ 18
Connecting objects............................................................................................................................ 18
6.2.1
6.2.2
6.3
Addition, subtraction and inversion............................................................................................................ 18
Branches ................................................................................................................................................... 19
Fast editing........................................................................................................................................ 19
6.3.1
6.3.2
6.4
Edit block titles .......................................................................................................................................... 19
Changing parameters ................................................................................................................................ 19
Simulation properties ........................................................................................................................ 20
6.4.1
6.4.2
6.4.3
6.4.4
7
Parameter properties................................................................................................................................. 20
Units .......................................................................................................................................................... 21
Options ...................................................................................................................................................... 21
Labeling objects and signal lines ............................................................................................................... 21
Frequency Simulation ............................................................................................................................ 23
7.1
7.2
7.3
7.4
7.5
System modeling............................................................................................................................... 23
Frequency probes ............................................................................................................................. 23
Simulation properties ........................................................................................................................ 24
Start frequency simulation................................................................................................................. 25
Results .............................................................................................................................................. 26
7.5.1
7.5.2
7.5.3
7.5.4
7.5.5
8
Plots .......................................................................................................................................................... 26
Special effects ........................................................................................................................................... 26
Eigenvalues............................................................................................................................................... 27
Data table .................................................................................................................................................. 28
Report........................................................................................................................................................ 28
Time Simulation...................................................................................................................................... 29
8.1
8.2
8.3
8.4
8.5
8.6
8.7
System modeling............................................................................................................................... 29
Insertion of signal sources and use of time probes .......................................................................... 29
Further remarks about time simulation ............................................................................................. 30
XY Graphs......................................................................................................................................... 31
Simulation Properties ........................................................................................................................ 31
Start the time simulation.................................................................................................................... 33
Simulation results.............................................................................................................................. 33
8.7.1
8.7.2
8.8
Time diagram ............................................................................................................................................ 33
Data tables ................................................................................................................................................ 33
Time simulation examples................................................................................................................. 34
8.8.1
9
Numerical solutions of differential equations ............................................................................................. 34
Parameter Variation ............................................................................................................................... 35
9.1
Properties of parameter variation...................................................................................................... 35
9.1.1
9.1.2
9.1.3
9.2
10
Block property dialog ................................................................................................................................. 35
Input table for varying parameter values ................................................................................................... 36
Simulation properties................................................................................................................................. 36
Starting parameter variation.............................................................................................................. 36
Custom Blocks.................................................................................................................................... 38
10.1
10.2
Creating simple custom blocks by selection ................................................................................. 38
Creating custom blocks in the block folder.................................................................................... 39
10.2.1
10.2.2
10.2.3
10.2.4
10.2.5
10.2.6
10.2.7
10.2.8
10.2.9
10.2.10
10.2.11
10.2.12
10.2.13
11
11.1
Introductory example ................................................................................................................................. 39
Summary ................................................................................................................................................... 42
Relationship between the symbol and structure window............................................................................ 42
Parameter table......................................................................................................................................... 42
Enter the system ....................................................................................................................................... 42
Formula editor ........................................................................................................................................... 43
Testing the inner system ........................................................................................................................... 43
Inserting node objects and block nodes .................................................................................................... 43
Designing block symbols ........................................................................................................................... 44
Joining system and symbol (exporting).................................................................................................. 45
Using and saving blocks........................................................................................................................ 45
Block revision ........................................................................................................................................ 45
More remarks on the design of custom blocks ...................................................................................... 45
Palette .................................................................................................................................................. 46
Creating, deleting and renaming palette pages ............................................................................ 46
© Buesser Engineering
- III -
Contents
11.2
11.3
Moving pages and buttons ............................................................................................................ 46
Storing objects in palette ............................................................................................................... 46
11.3.1
11.3.2
11.4
Working with the palette buttons ................................................................................................... 47
11.4.1
11.4.2
11.5
12
Storing objects from drawings ................................................................................................................... 46
Storing objects from libraries ..................................................................................................................... 46
Properties of palette buttons...................................................................................................................... 47
Designing button images with Microsoft Paint ........................................................................................... 47
Loading, saving and restoring ....................................................................................................... 47
Libraries............................................................................................................................................... 48
12.1
13
Example......................................................................................................................................... 48
Catalog of Standard Elements .......................................................................................................... 49
13.1
13.1.1
13.1.2
13.1.3
13.1.4
13.1.5
13.1.6
13.1.7
13.1.8
13.1.9
13.1.10
13.1.11
13.1.12
13.2
13.2.1
13.2.2
13.2.3
13.2.4
13.2.5
13.2.6
13.2.7
13.2.8
13.2.9
13.2.10
13.2.11
13.2.12
13.2.13
13.2.14
13.2.15
13.3
13.3.1
13.3.2
13.3.3
13.3.4
13.3.5
13.3.6
13.3.7
13.3.8
13.3.9
13.3.10
13.3.11
13.3.12
13.3.13
13.3.14
13.3.15
13.3.16
13.4
13.4.1
13.4.2
13.5
13.5.1
13.5.2
13.5.3
13.5.4
13.5.5
Sources.......................................................................................................................................... 49
Constant .................................................................................................................................................... 49
Ramp......................................................................................................................................................... 50
Step........................................................................................................................................................... 50
Oscillator ................................................................................................................................................... 51
Pulse ......................................................................................................................................................... 51
Pulse width modulator (PWM) ................................................................................................................... 52
Timer ......................................................................................................................................................... 52
Trigger ....................................................................................................................................................... 53
Driving curve ............................................................................................................................................. 54
Noise, random number generator.......................................................................................................... 54
User source ........................................................................................................................................... 55
File source............................................................................................................................................. 56
Linear elements ............................................................................................................................. 57
Adder / Summer ........................................................................................................................................ 57
Proportional element (P element) .............................................................................................................. 58
Integrator ................................................................................................................................................... 59
Derivative element..................................................................................................................................... 60
Derivative lag element (DT1) ..................................................................................................................... 61
First order lag element (PT1)..................................................................................................................... 62
Second order lag element (PT2) ............................................................................................................... 63
Non oscillating second order lag element (PT1T2).................................................................................... 64
Nth order lag element (PTn) ...................................................................................................................... 65
Lead/Lag element.................................................................................................................................. 66
Rational transfer element (G(s)) ............................................................................................................ 67
Dead time (PTt) ..................................................................................................................................... 68
First order all-pass element (PTa1) ....................................................................................................... 70
Second order all-pass element (PTa2) .................................................................................................. 71
Linear differential equation system ........................................................................................................ 72
Nonlinear elements........................................................................................................................ 73
Square....................................................................................................................................................... 74
Square-root ............................................................................................................................................... 74
Inverter ...................................................................................................................................................... 74
Multiplier (Product) .................................................................................................................................... 74
Divider ....................................................................................................................................................... 75
Arithmetic element with multiple inputs...................................................................................................... 76
Function element with single input............................................................................................................. 76
Function element with double input ........................................................................................................... 77
User characteristic..................................................................................................................................... 77
Saturation .............................................................................................................................................. 77
Dead zone ............................................................................................................................................. 78
Preload (Offset) ..................................................................................................................................... 78
Backlash................................................................................................................................................ 78
Minimum/Maximum (MinMax)................................................................................................................ 79
Peak detector ........................................................................................................................................ 79
Stiction................................................................................................................................................... 80
Actuators........................................................................................................................................ 82
Rate limiter ................................................................................................................................................ 82
Constant rate............................................................................................................................................. 82
Controllers ..................................................................................................................................... 83
2-point step controller ................................................................................................................................ 83
3-point step controller ................................................................................................................................ 83
Ideal PI controller (PI-i).............................................................................................................................. 84
Modified PI controller (PI-m)...................................................................................................................... 85
Ideal PD controller (PD-i)........................................................................................................................... 86
© Buesser Engineering
- IV -
Contents
13.5.6
13.5.7
13.5.8
13.5.9
13.5.10
13.5.11
13.5.12
13.5.13
13.5.14
13.6
Discrete time transfer elements..................................................................................................... 96
13.6.1
13.6.2
13.6.3
13.6.4
13.6.5
13.6.6
13.6.7
13.6.8
13.6.9
13.6.10
13.6.11
13.7
Introduction................................................................................................................................................ 96
Sampler ..................................................................................................................................................... 97
Zero order hold (ZOH) ............................................................................................................................... 98
Sample and hold (S/H) .............................................................................................................................. 99
Discrete time integrator (Iz) ..................................................................................................................... 100
Discrete time differentiator (Dz)............................................................................................................... 101
Unit delay (z element).............................................................................................................................. 102
Discrete time PID controller (PIDz).......................................................................................................... 103
Rational discrete time transfer element (G(z))......................................................................................... 104
Discrete time filter (z-Filter) ................................................................................................................. 104
Linear difference equation system....................................................................................................... 105
Converters ................................................................................................................................... 106
13.7.1
13.7.2
13.7.3
13.7.4
13.7.5
13.8
Analog to digital converter (ADC) ............................................................................................................ 106
Digital to analog converter (DAC) ............................................................................................................ 107
Analog to binary converter (ABC) ............................................................................................................ 108
Binary to analog converter (BAC) ............................................................................................................ 108
Quantizer................................................................................................................................................. 109
Logic ............................................................................................................................................ 110
13.8.1
13.8.2
13.8.3
13.8.4
13.8.5
13.8.6
13.8.7
13.8.8
13.8.9
13.8.10
13.8.11
13.9
GND (Ground, logic 0, false) ................................................................................................................... 110
V+ (logic 1, true) ...................................................................................................................................... 110
AND gate................................................................................................................................................. 110
OR gate ................................................................................................................................................... 111
Exclusive-OR gate (XOR, non-equivalence)............................................................................................ 111
Inverter (NOT gate) ................................................................................................................................. 111
SR flip-flop............................................................................................................................................... 112
JK flip-flop................................................................................................................................................ 112
D flip-flop ................................................................................................................................................. 113
Monoflop.............................................................................................................................................. 113
On/off delay ......................................................................................................................................... 114
Miscellaneous.............................................................................................................................. 115
13.9.1
13.9.2
13.9.3
13.9.4
13.9.5
13.9.6
13.9.7
13.9.8
13.9.9
13.9.10
13.10
13.10.1
14
Real PD controller (PD-r)........................................................................................................................... 87
Ideal PID controller type I (PID-I)............................................................................................................... 88
Adaptive PID controller.............................................................................................................................. 89
Industrial PID controller ............................................................................................................................. 90
Ideal PID controller type II (PID-II)......................................................................................................... 92
Real PID controller (PID-r)..................................................................................................................... 93
Modified PID controller (PIDm) .............................................................................................................. 94
Generalized PID controller (PID-a) ........................................................................................................ 95
Lead/Lag controller................................................................................................................................ 95
1:2 Switch................................................................................................................................................ 115
2:1 Switch................................................................................................................................................ 115
1:n output switch (demultiplexer) ............................................................................................................. 116
n:1 Input switch (multiplexer) ................................................................................................................... 116
Triggered sample and hold...................................................................................................................... 116
Controllable delay element ...................................................................................................................... 117
Relation ................................................................................................................................................... 117
Window comparator................................................................................................................................. 118
Zero crossing detector............................................................................................................................. 118
Step ramp............................................................................................................................................ 119
Special ......................................................................................................................................... 120
Transmitter and Receiver .................................................................................................................... 120
Bibliography ...................................................................................................................................... 121
© Buesser Engineering
-V-
SimApp
Acknowledgments
About this Manual
This manual contains a comprehensive introduction to the use of SimApp and a catalog of all standard simulation elements. If you are new to SimApp, we recommend that you read it carefully. Simulation programs
are not as widely standardized as text or drawing programs. Many important details will only be discovered
by reading this manual. The primary aim of this manual is to present you with the concepts, the main tools,
and the equipment for successful simulations.
Reference information about the use of special tools and commands is only available in the online help. Use
if you need information about buttons, property sheets, and dialog boxes or
the context-sensitive help
search in contents and index in the Help (?) menu.
We assume that you have basic knowledge of Microsoft Windows and using computer programs. Furthermore, this manual is not a textbook about modeling dynamic systems or automatic control systems. Please,
refer to the bibliography at the end of this manual for references on these subjects..
Acknowledgments
I would like to thank the following persons for their valuable contribution to the success of SimApp:
Prof. Dr. Ing. Ivan Vaclavik
Haute Ecole d'Ingénierie et de Gestion (HEIG-VD),
Institut d’Automatisation industrielle (iAi), www.iai.heig-vd.ch
Route de Cheseaux 1
CH-1401 Yverdon-les-Bains, Switzerland
for his long lasting technically competent, commercial and last but not least moral support of the project.
Prof. Michel Etique, ing. dipl. EPFL
Haute Ecole d'Ingénierie et de Gestion (HEIG-VD) www.heig-vd.ch
Département des Technologies Industrielles (TIN)
Route de Cheseaux 1
CH-1401 Yverdon-les-Bains, Switzerland
for translating the program texts to French, which enabled the first French user interface of version 2.
Prof. Michel Huguet agrégé de mécanique
Lycée Jacques Amyot d'Auxerre, lyc89-amyot.ac-dijon.fr/
Classes Préparatoires aux Grandes Ecoles (PCSI-PSI)
3 rue de l’étang St Vigile
F-89015 Auxerre, France
for translating the manual to French and the revision of all French texts from version 2.5. Thanks to his great
work, SimApp can now be provided entirely in French.
Peter Way SimApp Marketing & Sales
VentiMar, LLC, www.ventimar.com
1112 Oakridge Dr. Suite 104
Fort Collins, CO 80525
for his active support in all issues of the project and the revision of the English text.
Spring, 2009
Bruno Buesser
VI
SimApp User Manual
Introduction
What is SimApp for?
1 Introduction
1.1
What is SimApp for?
SimApp is a software tool for the analysis and optimization of dynamic systems based on block diagrams. It
does not assume any predefined structures. You can draw and simulate any kind of equations that can be
represented by block diagrams and by using the available functional elements. SimApp may be used to
model systems that can be represented by ordinary linear differential equations. It is especially useful for
simulation of feedback systems or automatic control systems.
Linear and nonlinear, time invariant and time variant systems or subsystems can be simulated in the time
domain and the results displayed as time and XY plots. In addition, linear and time invariant systems or subsystems can be investigated in the frequency domain with Bode and Polar (Nyquist, Black) plots and their
eigenvalues. The plots and data tables can be printed out or exported to other applications with using the
Windows clipboard.
The modeling of the systems, i.e. the drawing of the block diagrams, is done graphically by placing functional
elements into the drawing and connecting them with signal lines. The most important parameters (gain, time
constants, delays, etc.) can be entered directly in the drawing without the need to open dialog boxes. Additional graphic forms (lines, rectangles, circles, etc.) and text are helpful for documenting the block diagrams.
The object palette of SimApp consists of more than 80 functional elements. Often used subsystems can be
grouped and saved into the palette or libraries. You can also create your own specialized blocks – custom
blocks - that consist of the available functional elements and other custom blocks. They can be used in the
same way as standard elements and let you adapt SimApp to your special needs
The time and frequency response can be captured and analyzed at any system node. Special time and frequency probes are available for extended tasks. For example, you can capture and compare the frequency
response of the open and closed loop of a control system in one run. Another special probe allows twodimensional displays in the time domain.
SimApp has a multiple document interface. This means that you can open more than one document at the
same time to run simultaneous simulations.
1.2
Who can or should use SimApp?
SimApp is suitable for students, technicians, engineers and scientists who want study dynamic systems and
would like easy, intuitive operation. SimApp is very simple to use, and enables beginners to quickly obtain
usable results within minutes.
1.3
Using help
SimApp has several supporting help mechanisms. You can call the SimApp online help application that gives
you information in structural form or you can use context-specific help on the various interactive components
(menus, controls and toolbars). You will also find this manual in the online help.
1.3.1
Launch help application
Start the online help by using the content and index command in the help menu (?) and search the required
information in the contents list. This help resource is best for general information. For detailed information
about buttons and entry controls use the context-sensitive help instead.
1.3.2
Context-sensitive help
Contextual information is available anywhere where you discover the ? symbol in a window's title bar or the
help button
somewhere in the window. First click the ? symbol or the help button and then the object you
need more information about. This opens a help pop-up window for that object which delivers detailed information about the subject. Alternatively you may also press the F1 key if the corresponding control has the
input focus. You can also pull up a manual page by right-clicking on the object.
There are controls with comprehensive information but also such with nothing at all. The amount of information depends of the actual need for additional comments.
© Buesser Engineering
-1-
SimApp User Manual
1.4
Introduction
Technical support
Technical support
If you have problems or questions first use this manual or the online help. Additional support is available
through support contracts.
If you need more information email us at:
[email protected]
Please do not hesitate to contact us if you have any questions, suggestions or criticism. We pride ourselves
in our customer care.
Do not forget to visit our website regularly. There you will find the latest information about SimApp.
www.simapp.com
As a registered user you can always freely download the latest release of your SimApp version. Use your
username and password received on purchasing.
Our address for mailed letters:
Buesser Engineering
Wacht 28
CH-8630 Rueti ZH
Switzerland
© Buesser Engineering
-2-
SimApp User Manual
Installation
License terms
2 Installation
2.1
License terms
Before installing SimApp, please carefully read the license terms at the beginning of this manual and check if
you agree.
Please note: Technical programs have only a limited user community and they are
costly to develop and support. By licensing your product properly you will motivate
us to constantly improve the product and adapt it to your evolving needs. Please
help us in that task!
2.2
System requirements
SimApp runs on Windows 2000, XP and Vista and has no special system prerequisites. But for long and
high resolution simulations it is preferable to use a newer PC with significant main memory.
2.3
Installation
Before you can run SimApp, you must first install it by launching the setup program. There are two ways to
obtain the installation files:
•
•
By downloading over the Internet
By Purchasing the optional CD-ROM
2.3.1
Internet Download
You can download SimApp from our homepage www.simapp.com. Please use the credentials you received
during purchase. It is not possible and also prohibited to simply copy the executable file from another computer. The easiest way to do this is to copy the installation file to your desktop and to launch the program by
clicking on the newly created icon. Alternatively, you can also use the Run command in the Windows start
menu.
2.3.2
CD
If you purchased SimApp on CD, all you have to do is put the CD in your CD drive, and the setup program,
setup.exe, will start automatically. If this does not happen, you must run setup.exe manually.
The easiest way to do this is to use the Run command, found by pressing the Windows Start button. Run
presents a dialog that prompts you for the name of the program you want to run. If you placed the SimApp
CD in Drive D, just type:
D:\SETUP
Follow the directions displayed by the Setup program.
© Buesser Engineering
-3-
SimApp User Manual
SimApp Main Window
Overview
3 SimApp Main Window
3.1
Overview
After launching, SimApp opens the main window. In the program options (menu Extras+Options) you can
select whether you want SimApp to reopen all drawings of the last session. Otherwise it opens a new empty
drawing.
Figure 1: SimApp main window
3.2
Menus
3.2.1
Main menu
In the menu bar across the top of the SimApp application window you will find most of the commands. Some
contextual or object specific commands reside only in specific pop-up menus.
3.2.2
Pop-up menus
Right-clicking an object opens its pop-up menu. Objects can be anything you see in the application window:
palette, buttons, toolbars, panels and even objects in your drawings. By means of pop-up menus you can
access the operations of these objects. Pop-up menus are displayed at the pointer's current location so they
eliminate the need to move the pointer to the menu bar or a toolbar.
3.3
Toolbars and controls
3.3.1
File toolbar
The file toolbar is in the top left corner of the SimApp main window. It has some buttons for the most important file operations, such as saving, opening, printing, and a button to exit SimApp. This toolbar is not moveable, but you can hide it along with the palette.
3.3.2
Palette
The palette is a multiple page toolbar that contains all standard simulation objects and some drawing tools.
Select a page by clicking on a tab.
© Buesser Engineering
-4-
SimApp User Manual
SimApp Main Window
Status bar
Figure 2: The palette
There two types of objects:
1. Functional elements:
These objects are the building blocks of your block diagrams, i.e. the models of the systems you want to
analyze by simulation. Examples are sources, actuators, controllers, signal lines.
2. Shapes, lines and text (Page Drawing):
In SimApp you can draw simple shapes and lines. These objects are not primary objects because they
are not needed for simulations. You can use them if you want to illustrate your drawings and draw the
symbol of custom blocks.
The most important tools for drawing manipulation (selection, zoom and drag) are on the left side of the palette.
3.3.3
Moveable toolbars
The toolbars contain buttons for the most important commands and selections. Each toolbar offers a distinct
category of commands. Toolbars are moveable or can be docked along the inner edge of the SimApp main
window. They can be individually shown and hidden (View + Toolbars menu). Double-click a toolbar to
quickly change between docking and moving mode.
3.3.4
Library toolbars
Library toolbars (see chapter libraries) are user configurable and can be saved on disk. They are primarily
dedicated as containers for custom blocks, but you can also store shapes, text and any kind of object
groups. Library toolbars are the visual representation of object libraries. They behave like common toolbars
with buttons to select the objects for insertion in your drawings. Open libraries with the menu command Extras + Library + Open.
3.4
Status bar
The status bar is at the bottom of the SimApp main window. It displays information about the current drawing
state.
Cursor position
Object name
Object position
Object size
Figure 3: Status bar
3.5
Error bar
The error bar flashes in red if an error is encountered. It has a brief error message.
The lines in the error bar may be associated with the block where the error occurred. Some errors may allow you to find the block where the error occurred by clicking the error message.
© Buesser Engineering
-5-
SimApp User Manual
Introductory Example
Launch SimApp
4 Introductory Example
This chapter contains a small project to demonstrate step-by-step creation of a block diagram and the simulation of the time and frequency responses. More advanced features are described in the next chapters.
4.1
Launch SimApp
Locate the SimApp icon in the Windows program folder of the Start menu and click it. The SimApp main
window opens and contains an empty, maximized drawing window. The SimApp main window is an MDI
(Multiple Document Interface) parent window that can contain several child windows.
The drawing windows are fully independent of each other. In every window, you can model a system and run
simulations. Systems cannot be distributed over several windows. However a drawing can cover several
print pages in portrait or landscape orientation. New drawings are always in landscape mode. The page
margins are displayed as blue dashed lines.
4.2
Views and page arrangements
There are various commands to manage the view (size and position) of your drawings. You will find all these
commands in the standard toolbar. Three buttons in particular need further explanation
Snap to grid
Align lines
Page composition
Figure 4: Changing the view
Snap to grid should almost always be selected. It makes it easy to align and connect objects
properly. You may use Alt-Drag to move objects off the grid.
Align lines ensures that new line segments are placed in 45 degree increments. Once placed,
the angles can be modified without restrictions.
Page composition allows models to grow beyond a single page. Each page represents one
page of printed output. You can select a range of boxes and then work with the larger area as one
unit.
4.3
System modeling
Block diagrams (or block schemes) represent the real system. A block diagram mainly consists of blocks
and signal lines. The blocks represent the transfer elements that change system data or create new data.
The signal lines interconnect the blocks and enable the system's data flow. Each line stands for a system
data item with direction indicated by the arrow head.
4.3.1
From real system to block diagram
You are fortunate if your system is already represented by a mathematical description (differential equations)
or even by a block diagram. You can just start drawing. Otherwise, you still have a lot to do: Analyze the
system, find interfaces to other systems, break it into subsystems and find suitable mathematical equations.
If you have found a mathematical description, you can present it in a graphical form by using objects from
the palette and simulate it. However, the translation from the real system to a block diagram representation
is not part of this manual. Refer to the literature about automatic control systems, control engineering,
nonlinear control, dynamic simulation, etc. See the bibliography at the end of this manual.
All basic elements are divided into categories in the palette. As a simple tutorial project we draw the following block diagram:
© Buesser Engineering
-6-
SimApp User Manual
Introductory Example
Step
P
PT2
Error
PT2
P
H 1
TD 0 s
System modeling
K 2
K 1
T 1 s
d 0.3
Figure 5: Control loop with step stimulation
in the drawing palette). Get the objects out of the palette by
Be sure that automatic snap is on. (Button
first clicking the tab of the page that contains the category the desired object belongs to and then click the
button showing the symbol of the object (release the mouse button again). Position the mouse at the location
where you want to paste the object and press the mouse button. If you do not release the button immediately, you see the shape of the object at the pointer's location. You can now exactly position the object by
dragging and then releasing the mouse button. When drawing a block diagram it is helpful to place the
blocks first, and then connect them.
4.3.2
Connecting objects
The signal line tool can be activated by the corresponding button on the left and fixed part of the palette. This
button is seldom used as the wiring tool is automatically activated by moving the mouse over a node of an
unselected functional element. If the element is selected, first click beside the element to unselect it.
Draw the line to another node and release the mouse button. The end of the new signal line will automatically be linked to the target node. Do not draw signal lines across elements. For the sake of order only draw
horizontal and vertical segments by inserting corners. Create corners by momentarily releasing the mouse
button while drawing. It is also possible to insert or delete corners afterwards when the line is already finished. (See chapter: Polylines). If you are drawing a line from an object or from the middle of another line
click and hold the mouse then drag to the first line segment endpoint. After that you may click anywhere on
the diagram to make subsequent segments until you reach a node on a block.
If the endpoint of the line is not a node (red dot) the line will not be finished by just releasing it. In this case
you have to double click to finish the line. Note: Blocks are directional as shown by the arrow in the block.
Make sure the block is pointing in the desired direction before you connect it to others. This will make it easier to get a correct model the first time. Some lines end in a summer. To change the sign at the summer,
right click on the arrow and select “change sign”. The sign will only change when it is appropriate for that
connection.
4.3.3
Changing block parameters
After drawing the block diagram, change the damping parameter d of the PT2 block to 0.3.
There are two ways to achieve this:
Fast editing in the drawing
Click the numeric value of d. (Not the letter). An input box appears with the old value selected. Enter the new
value and press Enter.
Figure 6: Changing parameters
Changing d in the block properties dialog box
© Buesser Engineering
-7-
SimApp User Manual
Introductory Example
Simulations
Double click the PT2 element or right click on it select Simulation properties in the element's pop-up menu.
Locate the input control for the damping, enter the new value and press Enter. Note that there are more parameters in the dialog box than are visible in the drawing.
Figure 7: Properties dialog box of the PT2 element
4.4
Simulations
After drawing a block diagram without error, you can perform time and frequency simulations.
4.4.1
Time simulation
First, we are interested in the system's step response. Press the start button for the time simulation
.A
new window consisting of several pages appears. On the top page you see the plot of the step response at
the system's output nodes. By default, output nodes are named for the blocks that generate those outputs.
© Buesser Engineering
-8-
SimApp User Manual
Introductory Example
Simulations
Figure 8: Time plot
On the second page you find the simulated values in tabular form. The third page shows the parameters of
the current simulation. Tables and plots can be printed out or exported to other applications with the Windows clipboard.
The plot contains a vertical measurement line that may be moved by dragging with the mouse or by navigation buttons at the bottom of the page. The point of time is always displayed in the navigator and the corresponding signal values are displayed in the legend. Zoom any diagram area by dragging a zoom frame with
the mouse. The curves can be edited by right-clicking the curve or the corresponding legend item.
The data in the tables can be selected and copied to other applications by means of the Windows clipboard.
Columns are adjustable with the mouse.
4.4.2
Frequency simulation
Frequency simulations are only defined for linear systems, since they are based on the superposition principle. If you have a system model that has non-linear blocks, consider the system at a particular operating
point and replace the blocks with a linear approximation of that block – if possible. You may wish to save
your model in two versions – one with non-linear elements, and one without. Since the sample block diagram contains only linear elements you can also simulate it in the frequency domain without any changes.
The frequency simulation assumes the input of the simulation is the single source node; if you have more
than one source, you will need to explicitly define the input as shown later in this manual. Do not close the
window of the preceding time simulation for the sake of practice
Press the start button for the frequency simulation
ing one.
© Buesser Engineering
-9-
. A new window appears that is very similar the preced-
SimApp User Manual
Introductory Example
Simulations
Figure 9: Frequency response
The window contains several pages with various plots, a table of all simulation data and the eigenvalues
(characteristic values) of the system.
Figure 10: Data table
4.4.3
Simulation list box
Each individual simulation run produces a new output window. You can leave it open or close it instantly. If
you close it, all its simulation data will be lost. You can hide it temporarily so that it will not obscure the main
window. The name in the title bar can be changed. This is often useful if you print out the plots.
A small list box always on the top of the main window shows the names of all currently open simulation windows. Click a corresponding list item when you want to move a certain window into the foreground.
© Buesser Engineering
- 10 -
SimApp User Manual
Introductory Example
Figure 11: Simulation list box
© Buesser Engineering
- 11 -
Simulations
SimApp User Manual
Drawing Functions
Introduction
5 Drawing Functions
5.1
Introduction
SimApp also contains a simple drawing application. You can draw shapes, lines and text. You may illustrate
and comment your block diagrams with these drawing functions. They are also used for drawing the block
symbol of custom blocks.
5.2
Drawing objects
Draw simple shapes, lines and text by selecting the appropriate tool in the Drawing page of the palette.
Figure 12: Drawing tools
Many objects such as rectangles or lines are made by clicking and dragging the mouse. They finish automatically where the left mouse button is lifted. Then they display blue handles that you can drag to resize
the shape. You may also move the shape by clicking near the middle and dragging it to a new place. Polygons and Polylines behave differently as described below. Each object has a pop-up menu that can be
found by right clicking on it.
5.2.1
Lines
Draw lines by simply pressing and dragging the mouse.
5.2.2
Rectangles and squares
Rectangles and squares are also simply drawn by pressing and dragging. To draw precise squares, press
the Shift-key while dragging.
5.2.3
Rounded rectangles and squares
Rounded rectangles and squares are drawn like normal rectangles and squares. You can convert a normal
rectangle or square to a rounded rectangle or square and vice versa by clicking the Rounded corners menu
item in the object's pop-up menu.
5.2.4
Ellipses and circles
Draw ellipses and circles by simply pressing and dragging. To draw a true circle, press the Shift-key while
dragging.
5.2.5
Polylines
Polylines consist of multiple straight segments connected by corners or nodes. A Polyline can be closed to
form a polygon.
Signal lines, the wires to interconnect the functional elements, behave very similarly to polylines. The endpoints are shaped as nodes.
Start drawing a polyline by pressing the left mouse button and dragging the first segment. At the end of the
first segment where you want to insert a corner, release the button. To make the next segments, you may
move the mouse to the next corners and click again. Double-click at the end of the last segment to finish the
line. Select the pop-up menu item Close Shape to close the shape to a polygon and to open it again.
When you have finished the polyline, you can choose between two processing modes:
In the first mode the object is selected as a whole. You can change size and move it. However, individual
corners and endpoints are not accessible.
The second mode allows the processing of the corners and endpoints. Right click on the shape and select
“Edit Points”. Then corners can be individually moved and deleted. In this mode you can also insert new
corners.
Switch between these two modes in the object's pop-up menu.
© Buesser Engineering
- 12 -
SimApp User Manual
Drawing Functions
Drawing objects
The following remarks refer to the point processing mode:
Move a endpoint or a corner by clicking the mouse and moving it to a new location.
Move a single segment by first pressing the Ctrl-key and then clicking it with the mouse. Drag it to a new
location and release mouse button and key. Note: The line is doubled if you press the Ctrl-key after pressing
the mouse button.
Insert new corners or split segments by first selecting the line. Then press the shift-key, press on the location
where you want to split a segment and drag the new corner to a new location. Note that the new corner is
immediately removed if you do not move it significantly.
Remove any corners by pressing the Shift-key and clicking the corners.
Slanted segments can be replaced by vertical/horizontal segment pairs by pressing Shift and clicking the
segment.
5.2.6
Polygons
Follow the same rules as for polylines. You can convert polygons into polylines and vice versa through the
object's pop-up menu item Close shape.
5.2.7
Signal lines
Data is led from block to block through signal lines. They are like lines, but their end nodes adhere to other
nodes. Blocks remain attached to signal lines as they are moved on the drawing but signal lines do not drag
blocks. By default, signal lines are detached when moved from a block. This behavior can be changed in
Program Options as shown below. The following graphics explain the behavior of signal lines and connections more precisely.
Initial Example Diagram
Default mode
Point A has been moved and lines stay
connected to each other.
B
A
C
A
P
P
K 1
K 1
E
B
C
P
P
K 1
K 1
D
F
D
P
I
Reset
Hold
P
Block E has moved and
lines stay connected
K 1
E
F
Ti 1 s
I
Reset
Hold
Shift M ode
Ti 1 s
When a line is s elected circles appear at vertices and endpoints .
As the m ous e hovers over the line two pos s ible icons appear
You may change the default behavior to disconnect lines from each
other by going to: Extras -- Options -- Signal Lines and checking
"Detach single lines by dragging"
Drag the line to m ake a new vertex.
Move the line
Shift Toggles the icon s o you can s elect the des ired effect.
Once the m ove icon appears , you can drag without s hift to keep line
connections as before, or s hift-drag to dis connect the lines and m ove the
s elected s egm ent to a new place. You will s ee a blue das hed line that indicates
what the res ult will be. Segm ent G was m oved with dis connect by us ing Shift-Drag
G
B
C
A
P
P
K 1
K 1
E
D
I
F
Reset
Ti 1 s
P
K 1
Hold
Line F was s elected, then the icon
was toggled with Shift to m ake a new vertex
© Buesser Engineering
K 1
When dragging Line F from block D
it always disconnects. If the mouse is close
to the endpoint it disconnects from the block.
Otherwise the entire line moves.
- 13 -
SimApp User Manual
5.2.8
Drawing Functions
Formatting objects
Text
Click the drawing at the starting location of the text object and enter text. Press Enter to terminate the input.
Line breaks are achieved by pressing Ctrl+Enter. Press Escape to abort the text entry. To edit existing text,
select it and click the text button, or double-click the text.
Note: For element titles a single click is sufficient.
5.2.9
Pictures
You can paste bitmaps (*.bmp *.jpg), metafiles (*.wmf; .emf) or icons (.ico) into your drawings through picture objects. These objects can come from files or from the Windows clipboard. With pictures you can display graphics which you cannot create with SimApp (pixel graphics and sophisticated vector drawings). You
may create the pictures in a powerful graphics editor and paste it into your SimApp drawing. In SimApp you
can only change the size (except icons). Metafiles may be converted into native SimApp objects.
5.2.9.1 Paste pictures from the Windows clipboard
Create the picture in a graphics editor and copy it into the Windows clipboard. Back in SimApp, paste the
picture with the menu command Edit > Paste or by clicking the paste button .
Applications store data into the Windows clipboard in multiple formats. The paste command always prefers
the native format of the pasting application. If it cannot find its own format, it selects the most similar one.
SimApp prefers the .sap format. When it cannot find its native format, it selects the metafile format and the
bitmap format.
If you do not want the preferred format or if you do not know which format will be pasted, select Edit > Paste
special.... You will see a list of all known formats in the clipboard. After pasting, the objects are generally
shown in original size (if scale is set to 100%).
5.2.9.2
Insert pictures from a file
Click the picture button
on the palette and place an empty picture into the drawing.
Figure 13: Empty picture
In the picture's pop-up menu you find the following commands:
1. Paste picture: Pastes the contents of the clipboard into the empty picture. This corresponds to the paste
command as explained above.
2. Load picture...: A file dialog box is opened and lets you load a wmf-, emf-, bmp- or ico-file.
5.2.9.3 Edit picture
You cannot edit the contents of the picture. But you can change its size. For restoring the original size select
Restore original size in its pop-up menu.
5.2.9.4 Convert a picture
You can convert metafiles (wmf, emf) into native SimApp objects by selecting Convert picture. Objects unknown to SimApp are ignored.
5.2.10
Arrow
The arrow is a special object and is used for the symbol of a custom block. It shows the direction of the data
flow. Other arrows of any shape and size can be created with the polygon tool.
5.3
Formatting objects
Each drawing object has format attributes (e.g. line style, font, fill, etc.). New objects have default format
attributes that you can change. Changes to format attributes apply to all currently selected objects. If nothing
is selected, the default attributes are changed.
© Buesser Engineering
- 14 -
SimApp User Manual
5.3.1
Drawing Functions
Formatting objects
Format toolbar
There is a special toolbar for formatting.
Figure 14: Format toolbar
This toolbar contains controls for the most important attributes. The changes are instantly applied to the selected objects. If no objects are selected, the toolbar changes the default format.
5.3.2
Format properties
All format properties are accessible on the format property sheet. You can open it in the main menu Format
or in the object's pop-up menu Format properties.
Figure 15: Format properties for lines
The format property sheet always shows the current attributes of the selected objects. You can keep it open
as long as you like. After changing any attributes, the new values are not immediately applied. You must first
click the Apply button. If you click the Ok button, the changes are applied and the property sheet is closed.
Press the Close button to discard any changes and close the property sheet.
5.3.2.1 Options
The options page contains the processing options for the selected objects. Options can be enabled or disabled. These options are especially important for building the symbol of custom blocks. (See chapter
Custom blocks.)
© Buesser Engineering
- 15 -
SimApp User Manual
Drawing Functions
Rearranging and changing objects
Figure 16: Options for a rectangle
The check boxes can have three states:
The mixed-value state (grayed check mark) indicates that the values for an option of a multiple selection
differ (e.g. for a text selection that is partly editable). If you press Ok, that option is not changed for all selected objects. If you click a check box that is in the mixed-value state, the associated value is set and a
check mark is placed in it. This implies that the property of all objects in the multiple selection will be set to
the associated value when it is applied.
5.3.3
Default formatting attributes
New objects receive default format attributes. Change default format attributes in the attribute property sheet
while no object is selected.
5.4
Rearranging and changing objects
There are various commands to change and rearrange objects in the main menu, in the object's pop-up
menu or in the drawing toolbar. The toolbars begin on the left side of the drawing surface, and they can be
moved to other menus by dragging the comb-like symbol.
The drawing toolbar contains the most important commands:
Figure 17: Drawing toolbar
5.4.1
Flip and rotate objects
Rotate selected objects by steps of 90 degrees to the left
horizontally .
5.4.2
or to the right
or flip them vertically
or
Ordering objects
A drawing also has a third dimension - into the page - because objects can overlap. Objects can be placed
on top of each other as you start closest to you and move back "into" the screen. The last object inserted is
brings a selected object to the front and
the front object. Change the order for individual objects:
sends it to the back.
© Buesser Engineering
- 16 -
SimApp User Manual
5.4.3
Drawing Functions
Important auxiliary keys
Snap objects to grid
If you draw signal lines and insert simulation blocks, it is rather difficult to keep the object on a line. To simplify the precise placing of objects and drawing of exact vertical and horizontal lines use the grid. Choose
whether all objects drawn or pasted into the drawing should snap automatically to the grid. This feature is
very helpful for drawing block diagrams since you do not need the high resolution SimApp offers. The connecting of nodes is much simplified and you do not need to constantly align line segments.
), if the grid is too wide for special drawing
You can temporarily switch off the snap-to-grid function (with
operations. But if you forget to switch it on again, your subsequent objects may not align with the grid. If then
you switch snap-to-grid back on and try to attach the objects to each other, you will realize that it does not
work. The objects will lie on different grids.
SimApp differentiates between a global and an object-oriented grid. The global grid corresponds to the dots
in the drawing. The object-oriented grid refers its origin to the location of the object. But the grid width is the
same. Thus, if you move an object without snapping, its grid will not match the global grid any longer
To move selected objects to the grid, press the Lock into grid button .
Tip: Never switch off the snap-to-grid function. Press the Alt-key temporarily while dragging an object if you
want to place an object more precisely. While the Alt-key is pressed, snap is off.
5.4.4
Grouping objects
Grouping objects can simplify the task of working with several objects simultaneously. Select all objects you
want to put in a group and press the Group button . Ungroup a group by pressing the Ungroup button .
5.5
Important auxiliary keys
When you draw block diagrams you usually use the mouse. For some actions, however, you also need one
or two keys. SimApp uses the following extra keys:
Alt-key
The effects of the Alt-key depend on the current operation:
• Pressing the Alt-key while drawing, inserting or moving objects, the snap function is temporarily off. This
is useful if you want to place some objects more precisely.
• Press the Alt-key before pressing the mouse button if you want to move palette pages or palette buttons.
Ctrl-key
The effects of the Ctrl-key depend on the current operation:
• When moving of objects: Causes an object to be copied. To copy or double an object, press the Ctrl-key
before releasing the mouse button. This is also valid for copying objects to the palette or to a library.
• When inserting objects from the palette: Reverses the default setting in the program options "Select
object after insertion"
Shift-key
The Shift-key can be used when drawing lines or other objects to cause alignment along 45 degree lines. It
is also helpful in drawing exact squares or circles. If this mode is turned on permanently through
switches it off temporarily.
the shift
Normally, a selection of multiple signal lines and blocks can be moved as a unit while other signal lines remain attached. Hold the shift key while dragging the selected objects in order to disconnect them from the
rest of the model while moving them to a new place. In the program options you may set that signal lines
always mutually detach.
Esc-key
The Esc-key is an abort key when drawing polylines, signal lines and text.
Space-bar
Press the space bar to suppress auto scrolling. This is useful if you want to move an object to the palette.
© Buesser Engineering
- 17 -
SimApp User Manual
Simulation Objects
Description
6 Simulation Objects
6.1
Description
Simulation objects are the building blocks of the block diagrams. They consist of standard functional elements, the custom blocks and the signal lines. The arrow inside the block symbol indicates the data flow
direction through the object. The outputs are generally on the right and the inputs on the left edge. For feedback loops, blocks can be flipped with the flip command .
You can also create custom blocks that consist of a system of basic blocks or any other user defined blocks.
The basic blocks usually have two different symbols. The default symbol is a schematic representation of the
time or frequency response. The second symbol shows the mathematical transfer function in the time or
frequency domain.
Figure 18: Symbols of the PT2-block
Choose the default symbol in the options dialog box (menu Extras + Options). Switch between symbols individually in the object's pop-up menu.
The transfer function of a block is controlled by its parameters. Each block has its own set of parameters.
Some of them are displayed just below the block in the drawing and can be edited by simply clicking; others
can only be changed in the block's simulation properties dialog box. You can determine which parameters
appear directly in the drawing. Every parameter has a default value. Parameters of which there actual value
differs to the default value are displayed anyway.
6.2
Connecting objects
Signal lines connect blocks to enable data flow. Signal lines behave like polylines, except that polylines do
not have nodes with connecting capabilities. The differences between signal lines and polylines are described as follows:
The tool button for drawing signal lines is in the static part (left side) of the palette. However, the drawing tool
is also automatically activated if you place the mouse just on the node of an unselected block. A new signal
line is started by a mouse click. Create corners by temporarily releasing the mouse button. A signal line is
finished by double-click or by releasing the mouse just over the target node. Note: Improperly mouse movements may lead to useless corners and very short segments.
Signal lines have the same processing modes as polylines, whereas the point processing is selected by
default.
The formatting of signal lines is set in the program options and can not be changed individually.
Signal lines can transport data only in the direction indicated by their arrowhead. In fact, you can connect the
outputs of two blocks with each other. SimApp recognizes such collisions, changes the color of the signal
line to yellow, and does not draw the arrowhead. Yellow lines and nodes generally display false connections.
If you see a red dot at the intersection of two lines or objects, they are not connected.
Change the arrow and thus the direction of the dataflow with the Turn arrow command in the signal line's
pop-up menu or with the End- and Home-key.
6.2.1
Addition, subtraction and inversion
Add, subtract or invert signals by means of summer blocks:
© Buesser Engineering
- 18 -
SimApp User Manual
Simulation Objects
Fast editing
Figure 19: Addition, subtraction and inversion
Summer blocks may have multiple inputs and outputs. Multiple outputs are for convenience and their values
are all equal.
The polarity of a signal is determined by the sign. You can change the sign with the signal line's pop-up
menu or by pressing the - and + key on the numeric key pad. Press the Alt-key if you have difficulties in connecting a signal line to a summer block.
6.2.2
Branches
You need branches if you want to distribute a signal to more than one input.
Figure 20: Branches
Create branches by placing a node of a signal line on a corner or a vertical or horizontal segment of another
signal line. Remove a branch by dragging a node away from the branch location while pressing the Shift-key.
Also press the Shift-key if you want to move a block without pulling the signal lines.
When making a branch the new signal line must be started at the branch point. Signals always flow out of
the branch in the direction of the arrow. If you need to change the direction of a signal line, select the line,
then right-click it to open the properties dialog and select Change direction. Note that if the change in direction is not allowed,, the line will disconnect, and a red dot will appear.
6.3
Fast editing
You can edit block parameters and titles in the drawing without opening a dialog box.
6.3.1
Edit block titles
By clicking the title, the whole text is selected. Position the cursor by a second click on the desired location.
Press Enter if you have finished. Insert line breaks with Ctrl + Enter.
To move the title, click the text and hold down the Alt-key.
Note: After changing text, the title is repositioned automatically. (Presupposed this feature is switched on in
the elements properties.)
6.3.2
Changing parameters
Simply click the parameter value. Move the whole parameter table by clicking and pressing the Alt-key.
Note: After changing values in the parameter table, the table is repositioned automatically. (Presupposing
this feature is switched on in the properties dialog of the element.)
© Buesser Engineering
- 19 -
SimApp User Manual
6.4
Simulation Objects
Simulation properties
Simulation properties
This dialog box contains all properties and options that concern object specific simulation settings. You can
open it with the Simulation properties command in the object's pop-up menu or by double clicking.
Figure 21: Simulation properties of the PT1 element
The dialog box contains two pages. All or most parameters appear on the Parameters page. On the Options
page, you can change display options. Some elements may have more pages for additional settings.
The number of parameter sets and Edit parameter set as well as the multiple check boxes refer to parameter
variation. (See chapter Parameter variation.)
6.4.1
Parameter properties
On the Parameters page you can only change the numerical values of the parameters. But it's also possible
to change name, unit, symbol, etc. Press the Parameter properties button.
© Buesser Engineering
- 20 -
SimApp User Manual
Simulation Objects
Simulation properties
Figure 22: Parameter properties
There is no value limitation if you enter zero for minimum and maximum input. The Option always visible in
drawing determines whether a parameter is displayed in the drawing.
The item Formula is used when blocks are part of a custom block. It defines the relationship of the block
parameters to the virtual parameters of the custom block (see more information later in this manual).
6.4.2
Units
SimApp uses the following default units:
ps
ns
ms
Time
μs
ps-1
ns-1 μs-1
ms-1
Slope
Frequency μrad/s μHz mrad/s mHz
s
s-1
rad/s
min
min-1
Hz
h
d
h-1
d-1
krad/s kHz
a
a-1
Mrad/s
MHz Grad/s
GHz
The default units are bold.
SimApp recognizes these units and uses internally the appropriate conversion factors.
A up/down button pair appears if the unit edit box contains a default unit. Simply press the keys to change
between default units of the same type.
If SimApp encounters an unknown unit, it uses the value as it is. For example, if you type "y" instead of "a"
for year, SimApp uses the basic time unit "s" (seconds).
Pay attention to capitalization! For example if you enter "h" instead of "H" (Henry) for magneto-electric induction, the value is evaluated as hours and SimApp multiplies it internally by factor 3600 (one hour). As "H" is
an unknown unit, SimApp uses the value as it is.
Micro is represented either by μ or u for convenience. This unit represents 1E-6
6.4.3
Options
Set the object title and determine which parameter items are displayed in the parameter list in the drawing.
As default, mathematical symbol, value and unit are displayed.
6.4.4
Labeling objects and signal lines
It is important that you label your block diagrams carefully. The names of objects and signal lines are also
used in the plots and data tables.
Each element has a name that is displayed as title just above the block symbol. The default name corresponds to the native function of the block. Change the name so that it describes the real operation it performs in the system. A water tank can be modeled by an integration block. Therefore, change the name from
Integrator to water tank.
© Buesser Engineering
- 21 -
SimApp User Manual
Simulation Objects
Simulation properties
Signals take over the name of the block from which they come If a block has several outputs, all signals will
have the same name. To change the name of individual signals, use the pop-up menu of the associated
output nodes by right-clicking the nodes. (The element must not be selected.) After entering a name, you
have to position it correctly. Switch snapping temporarily off by pressing the Alt-key.
Outflow
Desired
dH
level
Controller
Amplifier
Us
hd
PT2
P
PI-i
z
Valve
qe
Reset
Hold
Water
tank
qd
I
Reset
K 1
K 1
T 1 s
d 0.5
K 1
T 1 s
Hold
Ti 1
Distance
Voltage Transformer
hi
PTt
K
1
Tt 0.3 s
Figure 23: Labeling objects and signals
The output node of a summer block can not be labeled. Change the block title instead.
© Buesser Engineering
- 22 -
Liquid
level
h
SimApp User Manual
Frequency Simulation
System modeling
7 Frequency Simulation
In the introductory example, you learned the basic concepts of frequency simulations. In this chapter you will
learn the use of frequency probes and the settings of the simulation control parameters.
7.1
System modeling
The first steps in frequency simulation are entering a block diagram and setting the block parameters. Note
that you may only use linear elements or discrete time elements that are also linear elements. Frequency
response analysis requires that systems follow the superposition principle (are linear). That is, the output of
such a system is the sum of all the individual inputs. Clearly, this is not the case for nonlinear systems. If
you have a system with non-linear elements and you wish to do frequency analysis, the easiest way forward
is to define an operating point by replacing all sources with steps, using the time simulation to see the input
value to each non-linear element, and then determining the slope of each non-linear element at that operating point. Replace each of these elements by a gain that reflects that slope. Consult a control system book
in the Bibliography for more details.
Note: There are some elements with selectable transfer functions in the nonlinear pages of the palette. (e.g.
arithmetic element, function element with one or two inputs). If you select a linear function, you may also use
that element.
7.2
Frequency probes
After modeling the system you can determine which subsystem to analyze.
The simplest case is a system with only one single input for which you are only interested in the input-output
response. In this case, you do not need any probes and can just press the start button.
Note: You can achieve one single input by deactivating all open input nodes that should not contribute to the
frequency simulation. Some blocks have special input nodes (e.g. reset input of integrator) that are not relevant for frequency simulations. These nodes are omitted by SimApp automatically and do not need to be
considered in a special way.
Frequency probes allow you to determine the response of any linear subsystem within the system, even if
the subsystem does not have its own inputs and outputs.
Frequency
f
Figure 24: Frequency probe
Each frequency probe has two terminals. The left terminal is an output that feeds the system with a sinusoidal test signal. The terminal on the right is an input that can be connected to several system nodes. The
input terminal of the probe is the measurement input. To connect probes with system nodes, you need signal
lines. The output signal of the probe can be fed into the system at any node regardless of whether it is already driven by another output. SimApp deactivates all these outputs. You can use as many frequency
probes as you like. For every stimulation input, you need one probe. All responses are displayed in the same
diagrams and can easily be compared. The names of the probes appear in the legend and as column names
in the data tables. SimApp internally runs a simulation for every single probe ignoring all other probes. You
may name the frequency probes to help you understand the output.
A common task is to analyze the open and closed loop of an automatic control system:
© Buesser Engineering
- 23 -
SimApp User Manual
Frequency Simulation
Simulation properties
Closed loop
f
Open loop
f
Step
Amplifier
P
H 1
TD 0 s
Input
K 2.53
Controller
PT1T2
PT1T2
PI-i
Reset
K 1
T1 2 s
T2 1 s
Hold
K 1
T 1 s
Output
Measuring
equipment
PTt
K
1
Tt 0.03 s
Figure 25: The use of frequency probes
Remarks:
• Inputs and outputs of the system consist of red nodes or dots. If you find other red nodes this means
that they are not connected to any other node. This could happen due to improper placement of nodes.
• The system must not have short circuits or nodes having no signal. If SimApp finds any errors, it paints
all incorrect connections and signal lines yellow.
• For frequency simulations, you may only use continuous time and linear elements including discrete time
elements. Nonlinear elements are not allowed.
• Loops without any lag or delay elements are allowed (in contrast to time simulation). If you also want to
perform some time simulations with the same system, you should insert fictitious lag elements as PT1blocks. For more information, refer to chapter Time simulation.
• SimApp disables input sources during frequency simulations as they are not needed or used.. .
• Label every probe with a unique name. This will help you to have a better overview of the results.
7.3
Simulation properties
You can control the simulation process by control parameters and options. Open the frequency simulation
options dialog box (menu Frequency + Simulation Properties... or button
or the drawing's pop-up menu).
© Buesser Engineering
- 24 -
SimApp User Manual
Frequency Simulation
Start frequency simulation
Figure 26: Parameters and options for frequency simulations
Enter a start and a stop frequency. Choose how many frequency values you want to calculate per decade.
Generally, the frequency response differs very much from decade to decade, especially the phase response.
To get good resolution in these ranges, you could increase the number of values per decade. But this has
the disadvantage of huge memory demands. In ranges where the response is very smooth, you do not need
a high frequency resolution. Hence, before you increase the resolution try the following three parameters
instead:
Select a smaller maximum phase and magnitude difference between two adjacent frequency values and set
the number of intermediate points if the maximum differences are exceeded.
For more information use the contextual help (?). Refer to chapter Parameter variation for more information
about parameter variation.
7.4
Start frequency simulation
Start the simulation by using the menu command Frequency + Start or the start button . The calculation
time depends on the size of the system and the simulation parameters. During a simulation, you can work on
other drawings and even run other simulations.
© Buesser Engineering
- 25 -
SimApp User Manual
7.5
Results
7.5.1
Plots
Frequency Simulation
Results
Figure 27: Bode plot
A plot can display several curves each with its own color and pop-up menu (right-click the curve) for display
settings. Several curves can overlap. Bring a curve to the front by left-clicking the associated legend item.
The toolbar contains several tools for display manipulation. You can zoom, unzoom and shift a diagram. The
tools always operate on the active diagram, which are selected by clicking. You can recognize the active
diagram by the fine frame around its title.
The mouse pointer also serves as a zoom tool. Draw a frame around that region you want to zoom in. Unzoom by pressing the unzoom button in the toolbar.
The Bode plot contains a measurement line and the Nyquist a measurement cursor for each curve. You can
control the line and the cursors with the navigator at the bottom of the window. The line can also be moved
with the mouse pointer. The legend items show the current values which correspond to the navigator position. The measurement line and cursors are always in step. The legend is hierarchically structured. There is
a section in the legend for every probe.
7.5.2
Special effects
The frequency response is calculated numerically with the state-space description. This method has some
special effects:
7.5.2.1 Constant phase error
Phase calculation from the real and imaginary parts of the frequency response matrix uses the atan function
[1]. The atan function has a periodicity and therefore an uncertainty of 360°. So the initial phase is always in
the range of ±180°. If the real phase is not in this range, SimApp cannot recognize it and produces a constant phase error over the whole frequency range of a multiple of 360°. You can study this by simulating a
chain of three integrators. SimApp shows a phase of 90° instead of –270°.
7.5.2.2 Phase rollover
If the phase drop is very fast, the phase difference between two frequency instants can exceed ±180°. As
the atan-function has a periodicity of 360° (see above), SimApp produces erroneous phase values at every
frequency instant and can even force the phase response in the wrong direction. But this effect can easily be
recognized in the diagrams. It usually occurs if the systems contain time delay elements.
© Buesser Engineering
- 26 -
SimApp User Manual
Frequency Simulation
Results
Figure 28: Erroneous phase response of a dead time element
In figure 28 you see the frequency response of a dead time block. In the frequency range above 70 rad/sec,
the frequency response shows only garbage. The phase drop in the Bode diagram changes to a phase rise
and the Nyquist diagram should show a perfect circle. You can reduce this effect by increasing the number
of points per decade or the number of intermediate points if the phase difference is too high. Note however
that this effect usually occurs at high frequencies and phase drops of more than 1000 to 2000° only, thus not
in the frequency range of interest. So you could eliminate this effect simply by reducing the stop frequency.
7.5.3
Eigenvalues
The eigenvalues are calculated for every subsystem (determined by a frequency probe) and displayed in a
table.
Figure 29: Eigenvalues
There is a column for every single probe.
Notes:
• The eigenvalues are only calculated for linear continuous time and time invariant systems that have no
dead time elements. As a compromise you can approximate dead time elements by means of an appropriate Padé-approximation.
• Those system parts that have no effect on the output are omitted and not used for calculation. If you
have several outputs, the eigenvalues are valid for those subsystems that contain all other subsystems.
If you need the eigenvalues for a single subsystem, you may connect a frequency probe only to the input
and output of that subsystem.
© Buesser Engineering
- 27 -
SimApp User Manual
7.5.4
Frequency Simulation
Results
Data table
There is a data table for every frequency probe. This table contains all data for the Bode and Nyquist diagrams. Note: The frequency column is usually different for every probe because the various frequency responses do not need the same amount of intermediate frequency points.
Figure 30: Data table
Data tables can be copied as a whole or by selecting rows or columns. The data in the frequency column is
included by default.
7.5.5
Report
The report shows the control parameters and some statistical data of the current simulation.
Figure 31: Report
© Buesser Engineering
- 28 -
SimApp User Manual
Time Simulation
System modeling
8 Time Simulation
In the introductory example you learned the basic concepts of time simulations. In this chapter, you will learn
how to use time probes and XY graphs, and how to set the simulation control parameters.
8.1
System modeling
The first steps in time simulation are entering a block diagram and setting the block parameters. In contrast
to the frequency simulation, you are no longer restricted to pure linear elements. You may use any element
from the palette.
8.2
Insertion of signal sources and use of time probes
Three kinds of probes are available for time simulation: Time probes, XY graphs (see next paragraph), and
output probes. Time simulations need sources that stimulate the system at various nodes.
Several system nodes can be connected simultaneously to the time probe input.. The output probe can be
attached to a single node, measure its output and scale it. This is helpful in diagrams with widely different
signal amplitudes. In addition, they can function as a gain that scales or inverts the signal further in the
model. Output probes can conveniently be rotated or flipped with the buttons in the left menu area.
Time
Output
t
K 10
Figure 32: Time and Output probes
Use signal lines to connect system nodes to time probes or output probes. Signal lines that connect probes
to the system change their graphical representation. Open inputs (red nodes, not in custom blocks) are valid
but are fed by zero inputs. Generally, you can have one source of main system stimulation as reference
input and some optional sources as disturbance inputs.
If no probe is available, all outputs are led to a fictitious probe. If you have at least one probe, all outputs that
are not connected to probes are omitted.
Time 1
t
Time 2
t
Oscillator
Amplifier
Controller
P
f0 0.25 Hz
A
1
Ph
0 °
PT1T2
PI-i
Reset
K 10
Plant
K 1
T1 2 s
T2 1 s
Hold
K 1
T 1 s
Measuring
Equipment
PTt
K
1
Tt 0.1 s
Figure 33: Using time probes
© Buesser Engineering
- 29 -
SimApp User Manual
Time Simulation
Further remarks about time simulation
Time probes can be grouped. (Do not confuse with drawing groups). The membership of a source to a distinct group is defined by its group number. The group number is displayed only if it is greater than zero.
Oscillator
Grp 3
f0
1 Hz
A
10
Ph
0 °
Figure 34: Source with group number (Grp)
SimApp runs one simulation for every single group. Sources not belonging to the current group are switched
off. The time responses of all groups are displayed in the same diagram so that you can stimulate your system in different ways and compare the results.
The sources of group 0 are special. All groups use these sources. For example, you may use a source from
group 0 as reference input and two other sources as disturbance inputs. SimApp will perform two simulations, first with disturbance 1 and then with disturbance 2 and display the results in the same diagrams.
User
source
Oscillator
Ramp
A 1 s-1
Grp 1
f0
1 Hz
A
10
Ph
0 °
Grp 2
PT2
G(s)
PT2
G(s)
K 1
T 1 s
d 1
b0: 1 a0:
a1:
1
1.4
PTt
PTt
K
1
Tt 0.1 s
Figure 35: Example for source groups
8.3
Further remarks about time simulation
Inputs and outputs of the system are marked with red dots. If you find other nodes that are also marked red,
this means that they are not connected to any other node. This could happen due to improper placement of
nodes.
The system must not have short circuits or nodes without signals. If SimApp finds any errors, incorrect connections and signal lines are marked yellow.
System parts that have no effect on measured outputs are not included in the simulation process.
Feedback paths without time delays or lags are known as Algebraic loops and not allowed in time simulations. This cannot be done since the output is instantly dependent on inputs and the output. In such cases,
insert a fictitious PT1 lag element in the loop and set the time constant so small (usually 2x the integration
© Buesser Engineering
- 30 -
SimApp User Manual
Time Simulation
XY Graphs
step) that the system behavior does not change. You may also need to shorten the integration interval as
well (approx. 1/10 of the shortest time constant in the system).
P
P
P
P
P
P
K 1
K 1
K 1
or
PT1
PTt
PTt
PT1
K
1
T 0.001 s
K
1
Tt 0.001 s
Figure 36: Avoid feedback loops without delays
8.4
XY Graphs
XY graphs are suitable for two-dimensional data representations. You may use time probes and XY graphs
simultaneously. The results are displayed in the same data window but in different diagrams.
Figure 37: XY Graph
The XY graph plots data in the x input against data in the y input. It has three input channels for displaying
up to three X-Y plots simultaneously. Unused channels can simply be left unconnected.
The plots can be printed out. Time information is printed as labeled dots.
Oscillator
f0
1 Hz
A 10
Ph 0 °
XY
X1
X3
Y1
Y3
X2 Y2
Backlash
Preload
S 4
Db 8
OU 1
OL -1
Figure 38: Comparing backlash and preload characteristics by using a XY graph element
8.5
Simulation Properties
The simulation process is controlled by several parameters and options. Open the associated dialog box by
selecting then menu item Time + Simulation properties..., pressing button or opening the drawing's pop-up
menu.
© Buesser Engineering
- 31 -
SimApp User Manual
Time Simulation
Simulation Properties
Figure 39: Parameters and options for time simulation
Enter simulation duration. The simulation always begins at time 0.
Numerical Integration:
The simulation is done by numerical integration of differential equations as defined by the block diagram.
The simulation time is divided into short time intervals of equal length. During these intervals the actual solution curve is approximated with straight line segments. The manner of computing the segments varies from
method to method. The accuracy depends on the method and the interval. Smaller intervals and the use of
complex approximations will lead to more accuracy and also longer computation times.
The optimal interval depends solely on the simulated system. Difficult systems that tend to instabilities may
need some attempts to find out the best integration method and interval. As a rule, follow these guidelines:
• Use an interval that is smaller than the reaction time of the system. For good results use an interval that
is 10 times smaller than the shortest time constant in the system. You can quickly estimate a rough
value if you know the field of study the system comes from. In heating plants you have time constants of
seconds to hours. Motors have electrical time constants in the range of micro- to milliseconds.
• The delay time of dead time elements must be exactly a multiple of that interval. If this is not true, the
actual dead time can vary by +/-1 interval. If the dead time is less than half the interval, it disappears.
• For a first simulation select Euler’s method. It is a simple numerical method and leads to short calculation times. If the system tends towards numerical instability, choose the Runge-Kutta fourth-order
method and shorten the interval. You can recognize numerical instability if the variation of the integration
method and integration interval leads to very different solutions.
• Step-shaped signals can cause inaccuracy and distortions with high order integration methods. Use the
Euler methods and short intervals instead.
The quality of the display of the solution curve is determined by the Time between plotted points parameter.
This has no impact on the calculation- only on the number of points shown on plots and in data tables. Generally you need fewer values for displaying a plot than for the simulation process. In general, use a Time
between plotted points 10 times smaller than the integration interval.
For discrete time elements you can set the sample period individually. Usually, the sample period is unique
in a discrete system. In this case, it is more efficient to set the sample period globally in the Default sample
period dialog box.
© Buesser Engineering
- 32 -
SimApp User Manual
8.6
Time Simulation
Start the time simulation
Start the time simulation
Start the time simulation with menu item Time + Start by button
8.7
Simulation results
8.7.1
Time diagram
or with the drawing's pop-up menu..
The time diagram displays all measured signals from one probe. Every probe and xy graph has its own diagram.
Figure 40: Time diagram
The legend is structured hierarchically. Every source group has its own section.
8.7.2
Data tables
Every source group creates a data table. The table can be copied - in part or in whole - by selecting appropriate sections. The time column is always included even when not selected.
Figure 41: Data table
The values at index -1 at time -0.01 are the initial values before simulation.
© Buesser Engineering
- 33 -
SimApp User Manual
Time Simulation
Time simulation examples
8.8
Time simulation examples
8.8.1
Numerical solutions of differential equations
The following example shows how to solve differential equations in SimApp.
A differential equation and the initial value of the solution curve are given as
y‘ = - 2 x y2,
y(0) = 1
Compute the approximation of the solution curve with different integration methods and compare the results.
First draw the block diagram that represents the differential equation:
Ramp
A 1 s-1
I
y'(t)
Multiplier
SQR
I
y(t)
y(t)
Reset
K -2
Hold
Ti 1
Y0 1
Figure 42: Block diagram for the differential equation y' = -2xy
Calculate for each integration method the first 10 values of the solution curve with an integration interval of h
= 0.1. Copy the values into an Excel or a Word table and compare the results with the exact solution y(x) = 1
/ (x2 + 1).
x
exact
Euler
0
0.1
0.2
0.3
0.4
0.5
0.6
0.7
0.8
0.9
1
1
0.9901
0.96154
0.91743
0.86207
0.8
0.73529
0.67114
0.609756
0.552486
0.5
1
1
0.98
0.94158
0.88839
0.82525
0.75715
0.68835
0.62202
0.56011
0.50364
Euler modified
1
0.99
0.96118
0.91674
0.8611
0.79889
0.73418
0.67014
0.60895
0.55191
0.49964
Heun
1
0.99
0.96137
0.91725
0.86195
0.80003
0.73553
0.67159
0.6104
0.55329
0.50092
Runge-Kutta
3. order
1
0.99013
0.9616
0.91751
0.86216
0.80009
0.73537
0.6712
0.6098
0.55252
0.50002
Runge-Kutta
4. order
1
0.9901
0.96154
0.91743
0.86207
0.8
0.73529
0.67114
0.60976
0.55249
0.5
Since the function has no steps, the Runge-Kutta 4th order method has the best performance at all times.
For a comprehensive discussion about numerical methods refer to [6].
© Buesser Engineering
- 34 -
SimApp User Manual
Parameter Variation
Properties of parameter variation
9 Parameter Variation
Parameter variation allows you to examine the system behavior with varying parameter values rapidly and
easily. Each parameter can take up to 100 different values. SimApp automatically runs a simulation for each
value and displays the results in a single output window.
If one or more parameters of an element(block) contains varying values, one can speak of parameter sets.
Different elements can have parameter value variations throughout the model. For example all i-th values of
the parameters of an element form the i-th parameter set of that element. All i-th parameter sets of all elements of a system form the i-th parameter set of that system.
The number of parameter sets for elements can be individually set. The number of parameter sets used for
the simulation is set in the simulation properties of the time and frequency simulation. But the number of
parameter sets in different elements may be different.
The base parameter value, displayed below the block symbol in the drawing or in the block properties dialog,
does not contribute to the parameter variation. SimApp uses additional values for parameter variation.
An alternative to parameter variation would be to run several simulations with different parameter values
each and display all results in the same diagram (see option in the simulation properties). The disadvantage
of this procedure however is the badly arranged curves in the diagrams and the impossibility to store all the
values in the file.
The base parameter values do not change and therefore can be reused when the work with parameter variation is complete.
9.1
Properties of parameter variation
The properties of the parameter variation cannot be set in one single property sheet – that depends on
whether the user is concerned about a single element or many elements in the system.
9.1.1
Block property dialog
You can set the number of parameter sets in the element’s property sheet (of that element only). You can
set which parameters are to vary by checking multiple, and then parameter properties to define the values.
Figure 43: Parameters variation settings
The following settings are important for the parameter variation:
Multiple
This option must be checked for all parameters contributing to parameter variation.
Number of parameter sets
Denotes the number of additional values a parameter can store for parameter variation. It affects a parameter only if the check box multiple is also checked.
Edit parameter set
This button opens an input table for editing the variable values of all parameters of the current block. Columns are defined by which parameters are checked as multiple.
All parameters contributing to the parameter variation are marked red in the drawing.
© Buesser Engineering
- 35 -
SimApp User Manual
9.1.2
Parameter Variation
Starting parameter variation
Input table for varying parameter values
Figure 44: Input table for varying parameter values
The parameter base values appear in the first line highlighted in yellow, and cannot be modified as they
serve as an overview only. Each parameter set is a row of the table, for example, the first parameter set is in
row 1. Base values are used for parameters that are not marked multiple..
9.1.3
Simulation properties
Figure 45: Settings for parameter variation in the frequency and time simulation properties
Use parameter variation must be checked.
The number of parameter sets denotes the number of parameter sets used in the next simulation run. The
number of parameter sets in each individual element in the model may not equal this value. The elements
may have more or less sets:
• For elements with more parameter sets, all surplus sets are omitted.
• For elements with less parameter sets, the last existing set is used in place of the missing sets.
• For elements with no parameter sets at all, the base parameter values are used instead.
You can give different settings for time and the frequency simulations.
9.2
Starting parameter variation
Start parameter variation as you would for normal simulations. Parameter variation is performed only if the
check box Use parameter variation in the simulation properties is checked. SimApp runs a simulation for
each parameter set and presents the results in the same output window.
Each legend entry is preceded by the index of the parameter set. The colors can be controlled in the simulation properties.
© Buesser Engineering
- 36 -
SimApp User Manual
© Buesser Engineering
Parameter Variation
- 37 -
Starting parameter variation
SimApp User Manual
Custom Blocks
Creating simple custom blocks by selection
10 Custom Blocks
Large and complex systems can be difficult to understand. Such systems often consist of several subsystems. You could graphically separate subsystems by drawing lines or using colored shapes and include
descriptive text, but this would enlarge the drawings even more. Generally, it is not necessary to show all the
details of a system simultaneously. Furthermore, there are some well-known structures in specific engineering disciplines that can be used repeatedly but with different parameter values.
For this purpose, in SimApp you can create your own blocks. You can draw any system or subsystem and
pack it into a new block with its own parameters. This is not even restricted to block diagrams. You can put
any kind of graphical representation you draw with SimApp into custom block. User-defined blocks have own
block symbols and do not differ from basic blocks. You can store them to the palette or collect them in libraries.
There are two methods of creating higher level integrated blocks:
In the first method, you can select all objects in a drawing and gather them into a single block. In the second
method, you use a special workshop in SimApp, the block folder.
The first method is very fast and is suitable for temporarily simplifying a drawing without any need for re-use.
The second method takes more effort, but has no restrictions and is suitable as a long-term solution.
10.1
Creating simple custom blocks by selection
You can select any object in a drawing and put it into a new block. After selection, use the menu command
Extras + Create custom block. All selected objects are immediately replaced by the new block. It has a default symbol and looks like a basic block.
Figure 46: Create custom block by selection
The input and output nodes result from the connections to non-selected elements or are open nodes of the
selected objects. The connections to external elements are not broken.
Remarks
• Do not select signal lines to non-selected blocks. This will break up connections.
• If you select summer elements, select input and output signal lines as well.
© Buesser Engineering
- 38 -
SimApp User Manual
•
•
•
•
•
Custom Blocks
Creating custom blocks in the block folder
Disable open control input nodes of individual elements to prevent them from appearing in the new
block.
Use the block title to give the block a descriptive name.
All parameters of the contained elements appear below the new block and behave like native parameters. You can change their properties as you do in basic blocks.
Parameters that you do not want to be changeable must be hidden in advance. These parameters act as
constants and do not appear on the drawing or any property dialog of the new block.
Parameters of grouped elements are hidden.
If you do not like the default symbol, you can finish the block in the block folder. In this folder you can also
edit the inner structure and create new parameters.
Custom blocks can be broken up with the menu command Extras + Break up custom block at any time. It is
immediately replaced by its inner structure. The symbol is lost, but connections to external blocks are retained.
10.2
Creating custom blocks in the block folder
In a block folder, you can create and alter custom blocks. You have access to the inner structure and the
block symbol. A special feature is the ability to create new virtual parameters and connect them to the real
parameters of the contained blocks.
10.2.1
Introductory example
In this example, you will learn the most important steps to create a custom block in the block folder. The
lesson is to create a custom block from the block diagram of a DC motor. This block should be supplied with
a descriptive symbol.
10.2.1.1 Mathematical modeling
The Laplace transformed equations of a DC motor are [1],[21]:
KA
UA
1 + sTA
UR = U A − e m
Differential voltage:
em = K F ω
Back-emf:
Motor torque:
M A = K FI A
Differential torque:
MB = M A − M L
1
Angular velocity:
ω = MB
Js
Revolutions per minute (r.p.m): n = 60ω 2π
Armature current:
IA =
KA =
L
1
and TA = A
RA
RA
UA = Armature voltage
KF = Torque constant
ML = load torque
J = Inertia of motor and load
The equations describe the function of the new block. It has three nodes:
• Inputs:
Armature voltage UA and load torque ML as disturbance input.
• Output:
r.p.m
To make the block usable for different designs of DC motors, the following coefficients must be changeable:
Name
Symbol
Unit
Armature inductance
La
H
Armature resistance
Ra
Ohm
Back-emf constant
Kf
Nm/A
Inertia of motor and J
Kg-m2
load
All these coefficients form the new virtual parameters of the block.
10.2.1.2 Open block folder
Open the block folder (menu File +New block folder). A new window appears with the title "Block folder 1".
The window consists of two pages and a table. The first page is for the design of the block symbol and the
second page for modeling the block system. Click the tabs if you want to change the page. First we will look
at the System page.
© Buesser Engineering
- 39 -
SimApp User Manual
Custom Blocks
Creating custom blocks in the block folder
10.2.1.3 Draw the internal system
The next figure shows the block diagram representation of the dc-motor derived from the equations:
Figure 47: System page of the block folder
The inputs and outputs are specially marked by node objects. You will find the node objects on the Special
page in the palette. Place the node objects exactly on the input and output nodes of the input and output
signal lines. The node objects are automatically numbered, however, we recommend labeling them with the
associated signal names.
10.2.1.4 Creating parameters
The parameters of the native blocks cannot be used as motor parameters. For example, the time constant of
the PT1-element is the quotient of armature inductance and armature resistance. You can create new parameters in the parameter table. In the simulation properties dialog box of the individual elements, you can
then define the relationships of their own parameters to the new virtual parameters.
Steps:
1. Double-click the first row of the parameter table. In the dialog box, enter the properties of the armature
inductance LA:
Figure 48: Defining block parameters
2. Enter the mathematical symbol, and a typical value for the armature inductance.
© Buesser Engineering
- 40 -
SimApp User Manual
Custom Blocks
Creating custom blocks in the block folder
3. Close the dialog box. The symbol and the value appear on the first row of the parameter table. Repeat
this procedure for the armature resistance, back-emf constant and inertia.
4. Repeat step 1 and 2 for all other parameters.
5. Until now, the new parameters have not had any effect. Now you have to define their relationship to the
parameters of the individual elements. Open the simulation properties dialog box of the PT1-element
”Armature current“. Press the Parameter properties...button and click the tab for the time constant. In the
formula file, enter the expression [1]/[2].
Figure 49: Entering formulas
6. The values in the square brackets are the indices of the new block parameters in the parameter table. [1]
refers to the armature inductance LA. The formula [1]/[2] means the quotient of LA and RA. SimApp interprets the formula for every simulation. Besides the basic operators +, -,* and / , there are numerous additional functions available and you can also use parentheses. Repeat this procedure for the gain of the
PT1-element.
7. Now you have defined the relationship between the parameters of the PT1-element and the new motor
parameters. Repeat step 3 for all elements. For the revolutions at the proportional element, you do not
need a formula. Simply enter 9.549 or the formula 60/(2*Pi).
10.2.1.5 Designing the block symbol
After you have defined the functional part you need a symbol for the motor block. Change to the Symbol
page. You see an empty frame and free nodes that are labeled with the input and output names. If you did
not assign names, they will be numbered as (1),(2) and (3). These are the input and output nodes of the new
block. Move them onto the frame. Input nodes on the left and output nodes on the right. Do not press the Altkey for positioning or switch off snapping permanently. The nodes must lie exactly on the grid. If you are not
button.
sure if they do so, move them to grid with the
The empty frame has the standard size of 1.6 by 1.6 cm, but you can enlarge or reduce it.
Now paint the block symbol with the SimApp drawing tools.
10.2.1.6 Block assembly
Now we can join the functional and graphical part to a whole. Select the command Extras + Block Folder +
Export Block to Windows clipboard. The ready-to-use block is now in the Window clipboard.
Change to another drawing or open a new one and paste the block for further use.
© Buesser Engineering
- 41 -
SimApp User Manual
Custom Blocks
Creating custom blocks in the block folder
DC-Motor
ML
Ua
DC
n
La 0.007
H
Ra
0.5 Ohm
Kf
1.3 Nm/A
J
0.03 kgm2
Figure 50: The finished block
If you have found any errors, go back to the block folder and correct them. If your block is ok, you can store it
in a library (see chapter Libraries), into the palette (see chapter Palette) or into a common SimApp drawing.
10.2.2
Summary
You have learned the necessary basic steps for creating custom blocks. As an overview, we will enumerate
all steps:
1. Open a new block folder.
2. Define new parameters in the parameter table.
3. Draw the block diagram of the system you want to put in the block.
4. Enter the formulas for the parameters of the system blocks.
5. Test the inner structure.
6. Denote the input and outputs by connecting them with node objects.
7. Design the block symbol and move the nodes on the block frame.
8. Join the system and the symbol by exporting the block into the Windows clipboard.
9. Paste the block into a drawing.
10. Store the block into a library or into the palette.
10.2.3
Relationship between the symbol and structure window
The inner system of a custom block is connected to other blocks over the external nodes. The external
nodes cannot be created in the symbol window. They are created by inserting node objects into the system
window. Node objects designate the inputs and outputs of the inner system. The node object and the associated node in the symbol window build an inseparable pair. Deleting a node object in the system window
also deletes the associated node in the symbol window and vice versa. Every new pair gets a unique ID so
that you can see which node and node object build a pair. However, it is advantageous to replace the number by a descriptive name.
10.2.4
Parameter table
By means of the parameter table, you define the external parameters of the custom block that behave like
native parameters of basic blocks. The table has 3 columns. Each row may contain a parameter. The first
column contains the space saver, which you use in formulas. The second column contains the symbol and
the third a typical value.
Double-click a row to enter a new parameter into the table. You could also select a row with the mouse and
press Enter. Blank rows are allowed. The parameters in the finished block appear in the same order as in
the table. If you leave empty rows, you can later insert new parameters. Existing parameters can not be
moved to another row. They must be deleted and inserted again. You can remove single parameters by
selecting the row and pressing the Ctrl- and Del-keys simultaneously.
If you double-click a row, you can define a new parameter or change an existing one. Note that the input of a
symbol is mandatory. If the field of the symbol is blank, the parameter is immediately removed when you
close the properties dialog box. The values of the parameters can be arbitrary, but it is advantageous to
enter typical values as they are used for testing the formulas.
10.2.5
Enter the system
Use any object of the palette to draw the inner system or even other custom blocks. By using sources be
aware that their group number is zero, otherwise they will produce additional simulation runs. You can also
connect the group number to an external parameter.
© Buesser Engineering
- 42 -
SimApp User Manual
10.2.6
Custom Blocks
Creating custom blocks in the block folder
Formula editor
The inner parameters have fixed values that cannot be changed in the finished block or they are related to
external parameters and can be changed indirectly. The relationship can be very simple. For example, you
could determine that an inner parameter always has the same value as the external parameter. But you can
establish much more complex relationships. The formulas are entered in the parameter properties dialog box
of the inner blocks.
If you check the button for the formula, the actual parameter value is calculated by the formula and the external parameter values. In the background works a formula interpreter. The formulas are entered as plain
text that must comply with special rules.
All the functions, operators and constants you can use are listed below:
Function
Description
+-*/^
Addition/ Subtraction/ Multiplication/ Division/ Power
!
Faculty
sin( )
Sine (Radiant)
cos( )
Cosine (Radiant)
tan( )
Tangent (Radiant)
arcsin( )
Arcsine (Radiant)
arccos( )
Arccosine (Radiant)
arctan( )
Arctangent (Radiant)
ln( )
Natural Logarithm
log( )
Decade Logarithm
exp( )
Exponential
sqr( )
Square
sqrt( )
Square root
int( )
Integer part
frac( )
Fractional part
abs( )
Absolute value
rnd( )
Round to integer
Pi
π = 3.14159...
You can also use parentheses. Upper and lower case is not differentiated. The formula is syntactically tested
and numerically evaluated when closing the dialog box. If you have a relationship to external parameters,
their typical values are used. If the formula contains any syntactical or numerical errors (for example division
by zero, overflow, etc.), the point in the formula where the interpreter encountered an error is designated by
a question mark. Therefore, by entering typical and valid values for the external parameters you can avoid
simulation aborts produced by formula errors.
Some examples for correct formula:
5.67
Parameters with constant value 5.67
[3]
The value is always identical to the value of the block parameter in row 3 of
the parameter table.
sin([3])
Sine of the parameter in the third row
2.5 * exp( -4/[6] ) * sin(1.76)
Pi^[4]
[2] * (1 – [4] * (Pi – sin([1])))
Note: SimApp applies zero if you enter a relationship to a non existent parameter. There will be no error
message if no syntactical or numerical errors occur!
10.2.7
Testing the inner system
Before you have finished your block you should test the inner system. In the system window, you can perform time and frequency simulations but you cannot store the results. They are lost if you close the block
folder. Alternatively you could test the system in a standard SimApp drawing. In this case, the formulas are
omitted and the current parameter values are used instead.
10.2.8
Inserting node objects and block nodes
The input and output nodes of the inner system must be connected by node objects. The insertion of node
objects causes the creation of block nodes in the symbol window. Related node objects and block nodes
© Buesser Engineering
- 43 -
SimApp User Manual
Custom Blocks
Creating custom blocks in the block folder
always have the same name. When you change the name in one window, the name of the associated object
in the other window is immediately adjusted. The name appears in the complete block as node label.
10.2.9
Designing block symbols
The empty frame and the arrow are created automatically. If you have many nodes, you can enlarge the
frame. The fill color of the frame corresponds to the standard color also used by basic blocks. You can designate any shape to use this fill color by setting the option Background color for simulation blocks in the format properties dialog box.
Do not insert simulation objects into the symbol window. Direct inserting such objects is however not prevented by SimApp and are removed by block exportation.
Use the block title edit box for block title editing. Common text objects are not recognized as block title.
Draw a symbol that clarifies the functionality of the block. If necessary, use objects from other drawing programs and insert them as pictures. This particularly applies to curve paths (Bezier curves), which you cannot
produce with SimApp. Curve paths can be approximated by polylines however. For that, select a great
enlargement (10 - 30%). All curve paths in the standard objects were produced in this way.
Very important: Be sure that all nodes lie exactly on the grid. If you are not sure if they do so, move it to grid
button. Do not switch off the automatic snapping function.
with the
Set the operation behavior of the objects in the block symbol.
Figure 51: Options for text objects
The check boxes have three states: Checked, unchecked and indeterminate. The indeterminate state is
reflected by a grayed check mark that appears if several objects are selected that do not share the same
state. When closing the dialog box with Ok, grayed check marks leave the underlying objects unchanged. By
clicking the check box the option can be changed to set or unset and is now available for all selected objects.
Within block symbols only text objects can be modified by position, size and contents.
Settings for text objects:
• Neither selectable nor capable for editing: No changes at all.
• Selectable but not editable: change size and position by clicking and pressing the ALT-key. (But the text
is not accessible.)
• Editable but not selectable: Edit text by clicking. Position is fixed, size depends on text.
© Buesser Engineering
- 44 -
SimApp User Manual
•
Custom Blocks
Creating custom blocks in the block folder
Selectable and capable for editing: Select and drag the object by clicking and pressing the ALT-key. Edit
by clicking without pressing the ALT-key.
10.2.10 Joining system and symbol (exporting)
Join the system and the symbol by copying the block into the Window's clipboard. For that however, you
must not use the standard copying command. Select in the main menu Extras + Block folder+ Export block
to Windows clipboard or simply press the Export block button. The complete block is now in the clipboard
and ready for use.
10.2.11 Using and saving blocks
After copying into the clipboard you can use your new block like a standard element. Do not forget to store it
at least at one place. This can be within a normal drawing file, in the palette or in a library. If you have saved
the block, you do not need the contents of the block folder any longer. All information is stored in the block.
You can see the internal structure of the block and change it at any time by importing it into an empty block
folder.
10.2.12 Block revision
Blocks produced in the past may be changed by copying them back into the block folder. This is done via the
Window's clipboard. Copy the block by Edit + Copy to clipboard. You must not use the standard command
Edit + Paste however, to import it into the block folder. This would insert the complete block into the system
or symbol window without opening it. Select menu Extras + Block folder + Import block from Windows clipboard instead. The block is opened and inserted into the two windows. It does not even matter which window
happens to be visible.
Alternatively, you may open the custom block's pop-up menu and click the Open Custom Block in the Block
Folder command.
10.2.13 More remarks on the design of custom blocks
•
•
•
•
•
•
You can open several block folders and design several blocks at the same time.
The system and the symbol window can be stored together in a file. Select File + Save or File + Save
as.... The file is given the extension .sbf.
SimApp also accepts time and frequency probes in blocks and affect the simulation in the common way.
The application of such probes is questionable since they are not visible in the drawing, but influence the
simulation. A possible application would be the automatic monitoring of an internal transmission circuit or
an internal node. But if you wish to monitor internal nodes, it is better to designate outside test nodes or
use transmitter/receiver pairs.
Custom blocks have one block symbol only in contrast to standard elements.
If a block contains one or more discrete time elements, you must designate a block parameter for the
sample period. The reference must be direct (e.g. [3]) and may not contain any formula expressions
([1]/[2] or 5*[5]).
For testing purposes internal signals can be transmitted to outside by using transmitter/receiver pairs.
© Buesser Engineering
- 45 -
SimApp User Manual
Palette
Creating, deleting and renaming palette pages
11 Palette
The palette is a menu system visible above the drawing surface, and contains all standard objects that can
be inserted into the drawing. It consists of several pages, accessible by tabs. Each page contains a certain
category of objects.
You can extend the palette as you wish. For example, you may create new pages and store your custom
blocks in them.
Use the following functions for palette processing:
• Create new pages
• Move pages, change arrangement
• Extend palette with new objects
• Rename pages
• Delete pages
• Move buttons
• Load and save palette
11.1
Creating, deleting and renaming palette pages
Open the palette's pop-up menu by clicking the right mouse button on the palette (but not on a button), then
select the appropriate menu option.
New page
Click the New page. Enter a name that does not yet exist in the palette.
Delete a page
Click Delete page. The front page is deleted immediately. If there are still buttons in it, SimApp requires confirmation that it may remove all buttons and the associated objects. Standard pages are excluded from deletion.
Rename a page
Click Rename page. Enter a new name. Standard pages cannot be renamed.
11.2
Moving pages and buttons
Click Alt-key and the tab or button that you would like to move. Move the mouse pointer to the desired place
and release it.
11.3
Storing objects in palette
You can store any objects into the palette. These could be standard elements, custom blocks, and text objects or even grouped objects. The are stored simply by dragging and dropping.
11.3.1
Storing objects from drawings
Click the tab of the page in which you would like to store the object or a selection of several objects. Then
select the desired object in the drawing and shift it toward the palette. If you come to the edge of the visible
drawing window, autoscrolling normally begins. You can prevent this by keeping the spacebar pressed.
The object is inserted into the page by releasing the mouse button. If you wish to copy the objects, you must
press the Ctrl-key when you release the mouse button otherwise the objects will be moved into the palette
and are no longer available in the drawing. A new button with a standard image appears. You can, as will be
described later, still move the button within the current page. The characteristics of the new button can be
adjusted according to your requirements (see Process buttons).
11.3.2
Storing objects from libraries
Click the tab of the page in which you would like to store your objects. Open a library. Press the Alt-key and
press a library button. Move the button to the palette and release it at the desired insertion position. The
button is copied from the library to the palette.
© Buesser Engineering
- 46 -
SimApp User Manual
11.4
Palette
Working with the palette buttons
Working with the palette buttons
If you move objects from the drawing to library or palette, SimApp creates standard buttons. The images of
these buttons are not very meaningful. You should replace the text with a name that is suitable the contained
objects. You may also design your own image.
11.4.1
Properties of palette buttons
Right-click the button and select Format properties in the pop-up menu.
Figure 52: Palette buttons properties
You can load any bitmap of 24 x 24 pixels. You cannot show a bitmap and button text simultaneously. Create the bitmap with the Paint program of Microsoft Windows or with another paint application. Paint is a standard accessory of Windows. If you have not installed Paint, you will find it on the installation CD of Windows.
As a further option, you can assign a tool tip to the button, a small pop-up window that appears when the
mouse hovers over the button. The tool tip should contain a short description of one to three words.
11.4.2
Designing button images with Microsoft Paint
Open Paint and select Image + Attributes. Select the following adjustments:
Width:
Height:
Unit:
Color:
24
24
Pixel
Colors
Select the largest zoom factor and paint the image., SimApp controls the color of the background in order to
clarify the different switching status. You must determine however, which pixels belong to the background.
SimApp uses the left lower corner pixel to define the background color. All other pixels with the same color
belong to the background. The actual color you select is unimportant to SimApp. It is only important that you
do not use it anywhere else.
This color determines the
background color. All pixels having this color are
assigned to the background.
Figure 53: Button image
Store the image with any name. Change to SimApp and load it into the desired button. The image will be
copied completely. After loading, the bitmap is no longer needed.
11.5
Loading, saving and restoring
Changed palettes can be saved and reloaded. At program start, SimApp loads the last current palette. The
default palette can be restored at any time in the palette's pop-up menu.
© Buesser Engineering
- 47 -
SimApp User Manual
Libraries
Example
12 Libraries
Each engineering field has characteristic system structures that are used repeatedly. For these structures,
you can create your own custom blocks. You can divide your blocks according to certain criteria in groups
and store into libraries. When using libraries you are however not limited to custom blocks. You can select
any number of objects and signal lines or grouped objects to store in libraries for re-use. Even standard elements of the palette can be copied into libraries. Libraries behave like normal toolbars on the display.
12.1
Example
The following example will show you the basics for creating and using libraries. A new library will be created
that is only filled with standard elements so that you do not have to master a large group of objects,. Putting
standard elements into libraries has, in practice, no advantages. It is much more useful for you to store your
custom blocks.
Open a new drawing and place two standard elements from the palette in it.
Create a new library with Extras + Library + New. A window having a yellow background appears. Move an
element from the drawing into that window. Then move the second element into the library while pressing
the Ctrl-key. Let us assume that you have moved the first element and copied the second one.
Select the third element in the palette. Before clicking it, press the Alt-key. Move the button into the library
window and release the mouse button. Your library now looks like this:
Figure 54: Creating libraries
You can rearrange the buttons as you like. Then right-click the library window and select Rename. Enter
"Test" as new text in the window's title bar.
The two objects inserted from the drawing now have gray buttons with designation X1 and X2. The object
that you moved from the palette remained unchanged. You can change the text labels X1 and X2 or even
replace them by images. Please read the appropriate paragraph in the chapter Working with the palette.
Reopen the library's pop-up window and click Processing mode. By switching off the processing mode, the
library window will immediately be reduced and the buttons pushed together.
Figure 55: The finished test library
Open the pop-up menu. Click Save and save the library under the name Test.
Click Close in the pop-up menu. The library disappears but still remains in memory since it is only hidden.
Select View + Toolbars in the SimApp main menu. You will now find the name of your library in that listbox.
Set the check mark of the library and close the dialog box with Ok. The library is displayed again.
Click Remove in the pop-up. If you have not saved the library yet, a request to store will appear. Afterwards,
the library disappears again and you will not find it in the toolbar list.
Open the library again with Extra + Load Library.... and load Test.slb. Now it is back again.
© Buesser Engineering
- 48 -
SimApp
Catalog - Sources
Constant
13 Catalog of Standard Elements
13.1
Sources
Each source has specific parameters to control the output signal. However, all sources (except constant
source) use the following basic parameters:
Offset
The Offset shifts the characteristic curve up and down.
Start delay
Elapsed time before the output signal is applied. Start delay may be used for synchronizing different sources
to each other.
Start offset (initial value)
Initial output value before the start of the simulation and output value until the start delay time has elapsed.
y
Ramp/Rampe
Offset
Start offset/
Anfangswert
Start of simulation/
Simulationsstart
Start delay/
Startverzögerung
t
All basic parameters are set to zero as default.
13.1.1 Constant
The constant source applies an arbitrary positive or negative value, which is never changed during simulation. Offset, start delay and start offset do not exist.
Function:
y(t) = C
y
C
Constant
1
t
© Buesser Engineering
- 49 -
SimApp
Catalog - Sources
Ramp
13.1.2 Ramp
The ramp applies a constant slope up to a specified maximum. The saturation Ymax is always a positive
value and works as a maximum for positive slopes and as minimum with negative sign for negative slopes.
Function:
y(t) = A t
y
Ymax
Ramp
K>0
K
0
1s
K
t
K<0
A 1 s-1
-Ymax
13.1.3 Step
The edge time is determined by the start delay parameter.
Function:
y(t) = H σ(t-TD)
y
Step
H
Y0
H 1
TD 0 s
TD
© Buesser Engineering
t
- 50 -
SimApp
13.1.4
Catalog - Sources
Oscillator
Oscillator
The oscillator generates sinusoidal, rectangular or triangular output signals. Frequency, amplitude and initial
phase are adjustable.
y
Rectangle/Rechteck
A
Sine/
Sinus
Oscillator
Triangle/
Dreieck
0
t
Phase
f0 1 Hz
A 1
Ph 0 °
-A
The oscillator may be operated as a voltage controlled oscillator (VCO) by means of the modulation input
port. Either the output frequency is proportional to the input signal (f = f0 x Mod, linear modulation) or exponential to the input signal (f0 x 10Mod x, exponential modulation).
When the modulation input port is not used, the output frequency is constant f = f0.
13.1.5
Pulse
The pulse source applies a series of identical pulses. Either the sequence consists of one single pulse (N=1)
or of several pulses (e.g. N=6) or of an infinite number of pulses (N<0).
y
PW
Pulse
A
1
2
TD
TR
TF
t
A
PW
TP
N
TD
1
1 s
2 s
1
0 s
TP
The rising slope always precedes the falling slope. Before the beginning of the rising slope, the falling slope
must have finished. If the rising slope is longer than the period, it finishes at the end of the period and the
falling slope is omitted.
© Buesser Engineering
- 51 -
SimApp
Catalog - Sources
13.1.6
Pulse width modulator (PWM)
Pulse width modulator (PWM)
The pulse width modulator generates a rectangular output signal of desired frequency, phase and amplitude.
The ratio between Ton / Toff is controlled by the input signal between 0 and 100%. The rising edge always
matches the beginning of a new period of the underlying fundamental wave. The falling edge is controlled by
the input signal. The control values for 0% (LL) and 100% (UL) can be set to any value (LL may be greater
than UL or even negative).
T
y
Ton
A
PWM
Y0
TD
PW
UL (100%)
Toff
f0 1 Hz
A 1
Ton / Toff
50%
LL (0%)
13.1.7
Timer
The timer generates a single rectangular pulse. On/off time and pulse height can be specified.
Function:
y
y(t) = A [σ(t-Ton) - σ(t-Toff)]
Timer
A
Ton
© Buesser Engineering
Toff
A
1
Ton 1 s
Toff 2 s
t
- 52 -
SimApp
13.1.8
Catalog - Sources
Trigger
Trigger
The trigger source supplies a predefined sequence of pulses. The height of the pulses corresponds to logic
1 level and their width to the current integration step size. This source is useful for triggering time dependent
events in a controlled process.
The pulse sequence is defined in the simulation properties of the source. By setting the option Iterative, the
sequence is continuously repeated. If the first pulse is at time 0, the sequence starts its repetitions at pulse
no. 2, because the last pulse of the sequence has priority.
Integration step size/
Integrationsschrittweite
"1"
Trigger
T1
T2
T3
T4
T5
The time sequence can be stored into a text file and loaded at any time. The maximum number of pulses is
10,000.
The data format in the text file is the same as for the file source and user source, except that it needs only
one data value per line.
Format description for the text file
• One single data value per line. Valid decimal separators are comma and period. A data line may be finished by a comment preceded by an asterisk (*)
• Pure comment lines which start with a numeral must place an asterisk (*) in front. Preceding spaces are
allowed.
• The file must be an ANSI- or ASCII text file. Default file name extension is .txt, but any other valid Windows file name extension is allowed.
The decimal separator depends on the associated setting in the program options: comma or period.
Sample text file:
Trigger source sample file
Created by Bruno Buesser, Feb. 29, 2003
0
*First pulse at simulation start. Excluded from repetitions.
3.67
*Second pulse. Time values are in ascending order.
(>Blank lines are skipped
5
6,2
*Decimal separator may also be a comma
8
*Last pulse
* 5 values >> Asterisk * is used as comment starts with a numeral
By setting the option Iterative, the sequence from 3.67 to 8 is
successively repeated.
End of sample file
© Buesser Engineering
- 53 -
SimApp
Catalog - Sources
Driving curve
13.1.9 Driving curve
Start and speed-up characteristic.
y(t) = f(A,TV,TH)
Function:
y
TV
TH
TV
Driving
curve
A
quadratic/
quadratisch
quadratic/
quadratisch
A 1
TV 1 s
TH 5 s
linear
TV
TV+TH
2TV+TH
t
13.1.10 Noise, random number generator
Noise
This source can also be used as random number generator and you can evaluate the behavior of automatic control systems in presence of random noise.
M
1
SD 0.4
A
1
The noise source supports the following four noise distributions.
Uniform (White noise)
Exponential
λ
Amplitude
1
Amplitude
f(x) =
f(x) =
a
λ e- λ x
1
b-a
Mean value/
Mittelwert =
b
a+b
2
1
λ
Mean value/Mittelwert
Poisson
Normal (Gaussian)
f (x ) =
1
2πσ
2
e
−
2
( x− m)
2σ
2
p( k ) = e
−λ
λk
k!
k
Mean value/
Mittelwert m
m+σ
λ
Mean value/Mittelwert
The Reproducible option controls the starting point of the internal random generator.
If Reproducible is set, it applies identical noise sequences for every simulation run, even when the drawing is
saved and reloaded.
If Reproducible is disabled, it applies different noise sequences in subsequent runs.
If the system has more than one noise source, all noise sequences differ from each other. (Independent of
Reproducible)
© Buesser Engineering
- 54 -
SimApp
Catalog - Sources
User source
13.1.11 User source
This characteristic consists of a series of points that form the output signal. You can select between a linear
and a rectangular interpolation.
y(t) = f[P1...Pn, t]
Function:
rectangular/rechteckig
y
P2
Pn-1
P1
T1
T2
User
source
linear
Tn-1
Pn
Tn
t
The characteristic can start with an initial value or the first point. The initial value is set by inserting a fictitious
first point for time < zero. The data value of this point applies from the very beginning up to the expiration of
the start delay. After the start delay has elapsed, the value of the first real point is applied. If there is no fictitious point, the first real point applies from the beginning (before and after the start delay). The start delay
shifts the whole characteristic to the right on the time axis. E.g., a point at time 2s comes at time 3s if the
start delay is 1s.
Steps are achieved by setting same time for two adjacent points. The law of causality must be observed,
therefore the points must be arranged in ascending time. If three or more points have the same time, only
the first and the last one are considered.
By setting the option Iterative the characteristic is continuously repeated. If the first point is at time 0, the
characteristic starts its repetitions at second point, since the last pulse has priority.
The values are stored in the source, but can also be saved and reloaded to/from a text file.
Description of the data format in the text file:
• One Y-t pair per line.
• Y- and t-values must be separated by space, tab or semicolon. Valid decimal separators are point and
comma. A data line may be completed by a comment, preceded by asterisk (*).
• All lines not starting with numeral, comma or period are interpreted as comments.
• The file must be an ANSI or ASCII text file. Default name extension is .txt, but all other valid Windows
extensions are also accepted. The number of data points is limited to 10,000. Surplus points are ignored
on larger files.
If the data are stored in a text file, the value pairs are separated by TAB. The decimal separator depends of
the setting in the program options.
User source sample file
Create by Bruno Buesser, Feb. 27, 2007.
This file contains 5 pairs of values.
-1; 0.5
*Optional fictitious first point which acts as initial value.
2.45; 1
*First real point. Time comes first then output value
3.67; 2.5
*Second point. The time values must be in ascending order.
5 3.14
*The values are separated by spaces.
(blank lines are omitted)
6.23 2,5
*Comma is also a valid decimal separator
Lines which do not start with numerals, period or comma are skipped
8;0
*That is the last pair of values
* 5 pairs are red >> asterisk * is mandatory as the comment starts with a numeral
End of sample file
© Buesser Engineering
- 55 -
SimApp
Catalog - Sources
File source
13.1.12 File source
The file source may have up to 50 simultaneous outputs. The data cannot be stored in the source and is
loaded from a text file during simulation. Only the file path is stored in the source. If you copy the drawing to
another computer, you must also copy the data file. Be aware that the stored file path in the source may not
be valid in another environment. The file path may be absolute (i.e. with drive letter) or relative. A relative
path refers to the directory of the drawing.
y(t) = f[P1...Pn, t] (per curve)
Function:
rectangular/rechteckig
y
P2
P1
File
source
linear
Pn-1
Pn
T1
T2
Tn-1 Tn t
Every output signal requires an output node. The number of output nodes can be set in the block properties
dialog box from 1 up to 50. The number of data series in the text file must at least match the number of output nodes. Surplus series are allowed but omitted. The output signals all start with the first point.
The characteristic can start with an initial value or the first point. The initial value is set by inserting a fictitious
first point with time less than zero. The data value of this point applies from the very beginning up to the expiration of the start delay. After the start delay has elapsed, the value of the first real point is applied. If there is
no fictitious point, the first real point applies from the beginning (before and after the start delay). The start
delay shifts the whole characteristic to the right on the time axis. E.g. a point at time 2s comes at time 3s if
the start delay is 1s.
The series are repeated each time the stored time interval has elapsed by setting Iterative. If the first point
occurs at time 0, it is skipped in repetitions as the last point has priority.
If the simulation lasts longer than the stored sequences and repetitions, the last point is used as constant
value for the rest of the simulation.
Description of the data format
The data streams and the associated time form a table. Columns are separated by tab, spaces or semicolons (or mixed). Valid decimal separators are period and comma. The first column contains the time values,
all other columns the associated output values. All output values of a line are referred to the time value in the
first column. The times are arbitrary (no equal spaced time interval needed), but the value must be in ascending order. Steps can be made by setting the same time for two adjacent points.
A data line can be followed by a comment that is started by asterisk (*). Pure comment lines must only be
started by asterisk if the comment starts with a numeral. The file must be an ANSI or ASCII text file. Default
name extension is .txt, but all other valid Windows extension are also accepted.
File source sample file
Created by Bruno Buesser, Feb. 27, 2007
This file contains 3 output signals with 5 data points each
-1; 0.5; 0.6; 0.8
*Optional fictitious first point as initial value
2.45; 1; 5; 8
*This is the first set of points. Time comes first then data.
3.67; 2.5; 4.3; 6
*Second point. Time values are in ascending order.
5 3.14 4.5 3.3
*The values are now separated by spaces
(>blank lines are skipped)
6.23 2,5 4.1; 2,5
*Comma is also accepted as decimal separator
Lines which start not with numeral, point or comma are skipped
8;0 3,8; 1.4
*That is the last set of points
* 5 sets of points are loaded >> * is mandatory, as the comment starts with a numeral
End of sample file
The series are best edited in a spreadsheet (like Microsoft Excel) and then saved to an AINSI text file.
Note: The time space between two successive data points should be a multiple of the integration step size.
If not, the integration step size should be less than half the space of two successive data points, otherwise
signal filtering occurs (undersampling) that may distort the output signal. Check the output visually in case of
doubt.
© Buesser Engineering
- 56 -
SimApp
13.2
Catalog - Linear elements
Adder / Summer
Linear elements
Linear elements obey the principles of superposition and gain.
f (u1 + u2 ) = f (u1 ) + f (u2 )
Principle of superposition
f (Ku1 ) = Kf (u1 )
Principle of gain
With linear elements, you can perform time simulations and frequency simulations.
13.2.1
Adder / Summer
The adder (adder or, summer element) has one or more signal lines as inputs and one or more single signal
lines as output. For each input signal, the sign can be set individually. With only one input line the adder can
form an inverter.
You can change the sign of the inputs by selecting the signal line and pressing the + or - key on the numeric
keypad or by using the signal lines pop-up menu.
Function: y( t ) = ±u1 ( t ) ± u 2 ( t ) ± K ± u n ( t )
Example:
y1 = u1 - u2 + u3
y2 = u1 - u2 + u3
© Buesser Engineering
- 57 -
SimApp
13.2.2
Catalog - Linear elements
Proportional element (P element)
Proportional element (P element)
The input is multiplied by gain K.
Functions
Step response
y(t)=Ku
h( t ) = Kσ( t )
G(s) = K
h(t)
P
K
P
1
σ(t)
K 1
t
Magnitude and phase response
Polar plot
[dB]
K
K
K
ω
ϕ
0°
© Buesser Engineering
P
K 1
ω
- 58 -
SimApp
13.2.3
Catalog - Linear elements
Integrator
Integrator
The output of an integrator element is the integral of the input signal over time. It responds to an input step
with an unlimited time output ramp. Thus, it represents an unlimited storage device.
For t <= 0 the output is equal to the initial value Y0.
The reset time is the time at which the magnitude of the step response is equal to the constant magnitude of
the input step (if Y0 = 0).
Ymin and Ymax (anti-windup) limit the output. When the maximum value is reached, the integration is
stopped and continues in the opposite direction only if the input value has changed its sign. The limits are
active only, if Ymax > Ymin
Logic high value at Reset input terminal always resets the integrator to initial state Y0. The logic threshold
Vth is 0.5 by default, however may be adjusted individually.
In frequency simulations, the Reset input is omitted. In time simulations, if you do not need the reset feature,
you can leave it open (disconnected).
Step response
Functions
h( t ) =
t
1
y( t ) = ∫ u( τ)dτ
Ti 0
1
t
Ti
I
h(t)
I
Ymax
1
G(s) =
sTi
Reset
1
σ(t)
Ti
Magnitude and phase response
t
0
-20dB/Dek
ω=∞
1
ωi =
Ti
I
1
sTi
ω
Reset
Hold
ϕ
Ti 1
ω
-90°
© Buesser Engineering
Ti 1
Polar plot
[dB]
0°
Hold
- 59 -
SimApp
13.2.4
Catalog - Linear elements
Derivative element
Derivative element
Pure differential behavior cannot exist in a real (causal) system and cannot be realized by computers. This
derivative element is the best approach to the ideal differentiator. For time simulations, the approach depends on the integration step size and for frequency simulations, it depends on stop frequency.
An ideal differentiator responds by a infinitely high pulse that lasts an infinitely short time interval only. In
simulations however, the pulse height is limited to TD/h and the pulse length to h where h is the Integration
step size. The shorter h the better is the approximation to the ideal behavior. As an ideal behavior cannot
occur in real systems, the approximation in SimApp is not a disadvantage.
Functions
Step response
y( t ) = TDu& ( t )
h( t ) = TD δ( t )
G(s) = TD s
h(t)
D
TD h
1
D
σ(t)
h
+20dB/Dec
20
0
ϕ
t
Polar plot
Magnitude and phase response
[dB]
TD 1 s
with approximation/
mit Näherung
1
ωD =
TD
10ωD
TD s
ω=0
0
90°
0°
D
ω
TD 1 s
ω
Implementation notes:
As a pure differentiator can not be implemented by programming, SimApp uses a real differentiator whose
coefficients are set in such a way that they approximate the ideal behavior.
The transfer function of a more realistic differentiator includes a lag: G( s) =
TD s
. Ideally, T is 0.
1 + Ts
For time simulations: T = h (integration step size)
For frequency simulations:
T=
1
where ωS = simulation stop frequency (set by user) or
100ωS
T = TD / 100 , depending on which value is smaller.
© Buesser Engineering
- 60 -
SimApp
13.2.5
Catalog - Linear elements
Derivative lag element (DT1)
Derivative lag element (DT1)
The DT1 Element is the combination of an ideal derivative and a first-order lag element. Its step response is
strongly damped and so limited in size and the settling time is significantly increased.
Functions
Step response
y + T1 y& = TD u&
T −
h( t ) = D e T1
T1
t
h(t)
T s
G(s) = D
1 + T1s
TD
T1
DT1
DT1
σ(t)
1
TD 1 s
T1 0.1 s
1
T1
t
Polar plot
Magnitude and phase response
[dB]
TD
T1
DT1
+20B/Dec
1
T1
ω
ω =0
ϕ
90°
TD
T1
45°
0°
© Buesser Engineering
ω=∞
ω
- 61 -
TDs
1 + T1s
TD 1 s
T1 0.1 s
SimApp
13.2.6
Catalog - Linear elements
First order lag element (PT1)
First order lag element (PT1)
The PT1 element has one internal energy store. Therefore, it cannot follow a step instantaneously. The output signal is strongly smoothed. The damping is so strong that an overshoot cannot occur. After a long time,
the step response follows proportionally the input signal.
Functions
Step response
Ty& + y = Ku
h( t ) = K(1 − e − t / T )
h(t)
K
K
G(s) =
1 + Ts
PT1
PT1
1
σ(t)
0.63K
T
Magnitude and phase response
[dB]
K
K
3dB
1
ω1 =
T
ω= ∞
ω
ϕ
0°
ω =0
PT1
K
1 + Ts
K 1
T 1 s
ω
-45°
-90°
© Buesser Engineering
t
Polar plot
-20dB/Dec
0
K 1
T 1 s
- 62 -
SimApp
13.2.7
Catalog - Linear elements
Second order lag element (PT2)
Second order lag element (PT2)
The PT2 element contains two independent energy stores. The step response depends on the damping d
and the resonant frequency. There are four cases:
1.
2.
3.
4.
Undamped:
Underdamped:
Critically damped:
Overdamped:
d= 0. The step response is an undamped sinusoidal signal
0<d<1
d=1
d>1
Step response
Functions
T y + 2dTy& + y = Ku
G(s) =
PT2
1 + 2dTs + T 2 s 2
d<1
d=1
d>1
t
Polar plot
K
d<1
[dB]
ω=∞
d=1
1
ω0 =
T
ω
K
1 + 2dTs + T 2s2
ω
K 1
T 1 s
d 0.5
ϕ
0°
d<1
d>1
-180°
© Buesser Engineering
ω= 0
PT2
-40dB/Dec
d=1
K 1
T 1 s
d 0.5
σ(t)
1
Magnitude and phase response
d>1
PT2
K
K
(1 + T1s)(1 + T2 s)
T1 = T⎛⎜ d + d 2 − 1 ⎞⎟
⎝
⎠
T2 = T⎛⎜ d − d 2 − 1 ⎞⎟
⎝
⎠
-90°
⎞⎤
⎟⎥
⎟⎥
⎠⎦
K
For d ≤ 1 we get:
G(s) =
⎡ 1 − d2
⎛ 1 − d2
e −( d / T ) t sin⎢
t + arctan⎜
⎜ d
⎢⎣ T
1 − d2
⎝
K
h( t ) = K −
2 &&
- 63 -
SimApp
13.2.8
Catalog - Linear elementsNon oscillating second order lag element (PT1T2)
Non oscillating second order lag element (PT1T2)
This element corresponds mathematically to the PT2 element, but the damping is always greater or equal to
1. This is the overdamped case, where the denominator of the transfer function can be decomposed into two
linear factors with the time constants T1 and T1.
Functions
Step response
y + y& ( T1 + T2 ) + &y&T1T2 = Ku
⎛ T e − t / T1 − T2 e − t / T2
h( t ) = K ⎜⎜1 − 1
T1 − T2
⎝
K
G(s) =
(1 + sT1 )(1 + sT2 )
⎞
⎟⎟
⎠
PT1T2
K
PT1T2
σ(t)
1
K 1
T1 2 s
T2 1 s
t
Polar plot
Magnitude and phase response
[dB]
K
K
ω=∞
0
1
ω1 =
T1
1
ω2 =
T2
-45°
K 1
T1 2 s
T2 1 s
ω
-90°
-135°
-180°
© Buesser Engineering
PT1T2
K
(1 + sT1 )(1 + sT2 )
ω
ϕ
0°
ω =0
- 64 -
SimApp
13.2.9
Catalog - Linear elements
Nth order lag element (PTn)
Nth order lag element (PTn)
This element has n identical time constants. The greater n, the flatter the step response.
Functions
Step response
K
G(s) =
; n≥0
(1 + Ts)n
K
PTn
h(t)
σ(t)
1
PTn
K 1
T 1 s
t
Magnitude and phase response
Polar plot
[dB]
K
K
-n*20dB/Dec
ω=∞
ϕ
K 1
T 1 s
ω
-n*45°
-n*90°
© Buesser Engineering
PTn
K
(1 + Ts)n
ω
0°
ω =0
- 65 -
SimApp
Catalog - Linear elements
Lead/Lag element
13.2.10 Lead/Lag element
This element is a first order rational element. Depending on the ratio of T1 to T2 it can be configured as a
lead or lag phase element.
Do not confuse the lead/lag element with the lead/lag controller, which has a second order transfer function.
Step response
Functions
t
− ⎤
⎡
T2
h( t ) = K ⎢1 + (T1 − T2 )e ⎥
⎢⎣
⎥⎦
y + T2 y& = K (u + T1u& )
Lead/Lag
h(t)
1 + T1s
G(s) = K
1 + T2 s
T1 > T2
LL
K
1
T1 0.5 s
T2 1 s
K
Leading: T1 > T2
1
σ(t)
T1 < T2
Lagging: T1 < T2
t
Magnitude and phase response
Polar plot
[dB]
K
K
T1 > T2
1 T1
ω=∞
ω
1 T1
T1 < T2
-K
ϕ
© Buesser Engineering
1 + T1s
1 + T2 s
K
1
T1 0.5 s
T2 1 s
T1 > T2
T1 < T2
Lead/Lag
K
1 T2
1 T2
ω =0
ω
- 66 -
SimApp
Catalog - Linear elements
Rational transfer element (G(s))
13.2.11 Rational transfer element (G(s))
The G(s) element is the general form of a linear transfer element Y(s) = G(s) U(s) where G(s) is a rational
function
G(s)
Transfer function:
b 0 + b1s + K + b m s m
G(s) = K
; an <> 0 and m <= n
a 0 + a1s + K + a n s n
P-, I-, PT1-, PT2- and PT1T1 elements are special cases of the
G(s) element. Since the numerator order m must not be greater
than the denominator order n, the element cannot have a derivative behavior. Magnitude and phase response, polar plot and step
response depend on the order of the polynomials and the choice of
the coefficients.
© Buesser Engineering
- 67 -
G(s)
b0: 1 a0: 1
G(s)
b 0 + b1s + K + b m s m
K
a 0 + a1s + K + a n s n
b0: 1 a0: 1
SimApp
Catalog - Linear elements
Dead time (PTt)
13.2.12 Dead time (PTt)
The dead time (delay) element delays the input signal by the dead time Tt, but does not change the signal
shape.
Functions
Step response
y( t ) = Ku( t − Tt )
h( t ) = Kσ( t − Tt )
G(s) = Ke
h(t)
K
− sTt
PTt
PTt
σ(t)
1
K 1
Tt 1 s
Tt
t
Polar plot
Magnitude and phase response
[dB]
K
-K
0
ω
ωt =
ϕ
0°
PTt
K
Ke− Tt s
ω =0
1
Tt
K 1
Tt 1 s
ω
-57°
Padé equivalents
The transfer function of the dead time element has neither a numerator polynomial nor a denominator polynomial. Since poles and zeros are not defined, eigenvalues do not exist and SimApp will not try to calculate
them.
To eliminate this disadvantage the dead time element must be described by state variables. But since the
dead time element cannot be described by a finite number of state variables, we must use an approximation.
SimApp offers two approximations developed by H.E. Padé [1].
Padé-Allpass
The rational transfer function of the Padé allpass function is
n
G(Tt s ) =
1 + ∑ ( −1) i ai Tt i s i
i =1
where
n
1 + ∑ a i Tt s
i
i
⎛n⎞
1
ai = ⎜⎜ ⎟⎟
⎝ i ⎠ 2n(2n − 1)...(2n − i + 1)
i= 1,...,n
i =1
The allpass shows good results in the frequency domain. The magnitude characteristic is exact and the
phase characteristic matches that of the pure time delay up to a frequency of 10ωt. But in the time domain
the step response is rather unruly - the initial value depends on the order n being equal to 1 or –1 (although
it should be 0) followed by an intensive oscillation.
By means of the second approximation you can obtain better results in the time domain.
© Buesser Engineering
- 68 -
SimApp
Catalog - Linear elements
Dead time (PTt)
Padé-Approximation
The rational transfer function of the Padé approximation is
n −1
G(Tt s ) =
1 + ∑ bi Tt i s i
i =1
n
1 + ∑ a i Tt i s i
where
⎛n⎞
1
i = 1,...,n
a i = ⎜⎜ ⎟⎟
⎝ i ⎠ ( 2n − 1)( 2n − 2)...( 2n − i)
i =1
⎛ n − 1⎞
1
⎟⎟
bi = ( −1) i ⎜⎜
i = 1,...,n-1
⎝ i ⎠ (2n − 1)(2n − 2)...(2n − i )
The Padé approximation does not have the exact allpass characteristic of the Padé allpass. However, the
step response is much better. The initial value now is zero.
Which method to should you use?
If you perform time simulations, you should use the ideal dead time element without any approximation. The
response is absolutely exact without any distortions or over- and undershoots. But the need of buffer memory can be rather high for long dead times. If your computer is short of main memory, an approximation
might be indispensable. If the dead time element is close to the input of the system where effective steps
and spikes can occur, you should use the Padé approximation because of its better time response.
For frequency simulations, the ideal dead time element yields exact values for the magnitude and the phase
curve. For the calculation of the eigenvalues, it is replaced by a unit-gain element without any phase lag.
Therefore, the influence of the delay on the eigenvaluesis not computed. For valid eigenvalues you should
use a Padé approximation. The Padé allpass shows a good frequency response. Note that the poles and
zeros of the Padé allpass affect the whole system and influence the number and magnitudes of eigenvalues.
© Buesser Engineering
- 69 -
SimApp
Catalog - Linear elements
First order all-pass element (PTa1)
13.2.13 First order all-pass element (PTa1)
The PTa element has a constant magnitude characteristic and is independent of the frequency. The step
response shows a negative undershoot near t = 0. Systems with allpass characteristics are difficult to control.
Step response
Functions
(
h( t ) = K 1 − 2e − t / Ta
y + Ta y& = K(u − Ta u& )
)
h(t)
K
1 − sTa
G(s) = K
1 + sTa
PTa1
1
PTa1
σ(t)
0
Ta
Ta 1 s
-K
Polar plot
Magnitude and phase response
[dB]
ω=∞
0
ϕ
0°
K
-K
K
ω =0
PTa1
ω
ωa
10
ωa =
1
Ta
K
10 ωa
ω
Ta 1 s
-90°
-180°
© Buesser Engineering
1 − sTa
1 + sTa
- 70 -
SimApp
Catalog - Linear elements
Second order all-pass element (PTa2)
13.2.14 Second order all-pass element (PTa2)
This element has a similar undershoot as the first order all-pass. But in the second part of the step response
it shows a dying oscillation, dependent on the damping in the denominator.
Step response
Functions
y + 2dT2 y& + T2 &y& = K(u − T1u& )
G(s) = K
h(t)
PTa2
K
1 − T1s
1 + 2dT2 s + T22 s 2
PTa2
1
σ(t)
T1 1 s
T2 1 s
d 0.5
0
Magnitude and phase response
Polar plot
Bsp. für T1=1, T2=1; d=0.5
ω=∞
[dB]
0
0
ϕ
0°
PTa2
K
1 − T1s
2
1 + 2dT2s + T2 s2
T1 1 s
T2 1 s
d 0.5
ω
-90°
-135°
-270°
© Buesser Engineering
ω =0
ω
-20dB/Dec
-180°
1
- 71 -
SimApp
Catalog - Linear elements
Linear differential equation system
13.2.15 Linear differential equation system
SimApp lets you model linear and time invariant differential equation systems in State Space format. This
representation is particularly useful for models with a lot of interactions and for advanced control applications.
LDES
Vector form
& ( t ) = A x( t ) + Bu( t )
System matrix equation: x
Output matrix equation:
y( t ) = Cx( t ) + Du( t )
Transfer function
G(s) = C(s)[sΙ − A(s)] B(s) + D(s) s = jω
−1
The system has n states, p input quantities and q output quantities.
x
u
y
A
B
C
D
State vector (n x 1)
Input vector (p x 1)
Output vector (q x 1)
System matrix (n x n)
Input matrix (n x p)
Output matrix (q x n)
Direct transmission matrix (q x p)
Parameters:
x& = A x + Bu
y = Cx + Du
n<=50, p<=50, q<= 50
Matrix representation
A 12
A 22
.
A n2
. A 1n ⎤ ⎡ x 1 ⎤ ⎡B 11 B 12
⎥ ⎢ ⎥ ⎢
. A 2n ⎥ ⎢ x 2 ⎥ ⎢B 21 B 22
*
+
.
.
. ⎥ ⎢ . ⎥ ⎢ .
⎥ ⎢ ⎥ ⎢
. A nn ⎦ ⎣ x n ⎦ ⎣⎢B n1 B n2
. B1p ⎤ ⎡ u1 ⎤
⎥ ⎢ ⎥
. B 2p ⎥ ⎢u 2 ⎥
*
.
. ⎥ ⎢ . ⎥
⎥ ⎢ ⎥
. B np ⎦⎥ ⎣⎢u p ⎦⎥
⎡ y 1 ⎤ ⎡C11 C12
⎢ ⎥ ⎢
⎢ y 2 ⎥ = ⎢C 21 C 22
⎢ . ⎥ ⎢ .
.
⎢ ⎥ ⎢
⎢⎣ y q ⎥⎦ ⎢⎣C q1 C q2
. C1n ⎤ ⎡ x 1 ⎤ ⎡D11 D12
⎥
⎢
. C 2n ⎥ ⎢ x 2 ⎥ ⎢D 21 D 22
*⎢ ⎥+
.
. ⎥ ⎢ . ⎥ ⎢ .
.
⎥ ⎢ ⎥ ⎢
. C qn ⎥⎦ ⎣ x n ⎦ ⎢⎣D q1 D q2
. D1p ⎤ ⎡ u1 ⎤
⎥ ⎢ ⎥
. D 2p ⎥ ⎢u 2 ⎥
*
.
. ⎥ ⎢ . ⎥
⎥ ⎢ ⎥
. D qp ⎥⎦ ⎢⎣u p ⎥⎦
⎡ x& 1 ⎤ ⎡ A 11
⎢& ⎥ ⎢
⎢ x 2 ⎥ = ⎢ A 21
⎢ . ⎥ ⎢ .
⎢ ⎥ ⎢
⎣ x& n ⎦ ⎣ A n1
In real systems the direct transmission matrix D is usually = 0.
© Buesser Engineering
LDES
- 72 -
SimApp
13.3
Catalog - Nonlinear elements
Linear differential equation system
Nonlinear elements
Time simulations can be done irrespective of whether they contain linear or nonlinear elements.. This is in
contrast to the frequency simulation where you may only have linear elements (including discrete time elements).
The most important nonlinear functions are available as their own elements. With multi-function elements
you can develop numerous additional, frequently used transfer functions. If you cannot find the proper function, try to combine standard elements or use the user characteristic element with which you can develop
any characteristic.
Input and output shift
The characteristic of many nonlinear elements can be shifted in the coordinate system. The characteristic is
shifted to the right by a constant value subtracted from the input signal. The characteristic is shifted upwards
by a constant value added to the output signal. The parameters of the input and output shift are not shown
below the block symbol in the drawing if they are equal to zero. You can edit them in the simulation properties dialog box of the corresponding blocks.
dY0
-dU0
u
y
Example: The saturation characteristic is shifted by dU0 and dY0
y
dU0
dY0
0
© Buesser Engineering
u
- 73 -
SimApp
Catalog - Nonlinear elements
Square
13.3.1 Square
y = Ku 2
Functional relationship:
y
SQR
K
Ku2
-1
13.3.2
1
u
Square-root
y =K u
Functional relationship:
y
SQRT
SQRT
K u
K
1
13.3.3
SQR
u
Inverter
y = K /u
Functional relationship:
y
Inverter
K /u
1
0
13.3.4
Inverter
K
u
Multiplier (Product)
The multiplying element computes the product of two input quantities and gain K.
Functional relationship:
© Buesser Engineering
Multiplier
y = Ku1u 2
Ku1u2
- 74 -
Multiplier
SimApp
13.3.5
Catalog - Nonlinear elements
Divider
Divider
The divider element divides the input value u1 by the input value u2 and multiplies the result by gain K
Functional relationship:
© Buesser Engineering
Divider
u
y =K 1
u2
u1
Ku
2
- 75 -
Divider
1
2
SimApp
13.3.6
Catalog - Nonlinear elements
Arithmetic element with multiple inputs
Arithmetic element with multiple inputs
This element supports basic arithmetic functions of multiple input values such
as addition, subtraction, multiplication and division.
Arithmetic
The number of input nodes can freely be chosen between 2 and 50. Unused
inputs without connections are ignored.
1
2
The sign of the input values can be changed in the pop-up menu of the associated signal lines or by pressing the + or - key in the numeric keypad when a
signal line is selected.
+
Addition and Subtraction
Functional relationship: y = ±u1 ± u 2 ± K ± u n
The subtraction of inputs is achieved by inverting the polarity of the incoming signal line.
Multiplication
Functional relationship: y = ±u1 × ±u 2 K × ±u n
The negative weighting (minus sign) of factors is achieved by inverting the polarity of the incoming signal
line..
Division
Functional relationship: y = ±u1 ÷ ±u 2 K ÷ ±u n
Dividend is the signal of the first, the top most input node. All other inputs are divisors. The sign of the dividend and the divisors can be set by changing the sign of the input signal line. (See subtraction.)
13.3.7
Function element with single input
Func 1
Only the most important functions have their own element. This element
provides 29 additional single input functions. There are linear and nonlinear
functions. Linear functions may also be used in frequency simulations.
sin
Trigonometric and inverse functions
sin
cos
tan
Cotan
arcsin
arccos
arctan
Hyperbolic and inverse functions
cosh
sinh
tanh
arcosh
arsinh
artanh
Exponential and logarithmic functions
exp
2x
10x
x2
x3
ln
Lb
lg
xA
Ax
logA
x
Miscellaneous functions
x
sign
© Buesser Engineering
Deg > Rad
Rad > Deg
- 76 -
Cycle > Rad
Rad > Cycle
SimApp
13.3.8
Catalog - Nonlinear elements
Function element with double input
Function element with double input
This element provides 10 input functions for two inputs
a+b
a-b
b
axb
1/b
a
a
arctan(a/b)
min(a,b)
2
a/b
2
a +b
max(a,b)
Func 2
a
b
a+b
a is the lower and b the upper input node.
13.3.9
User characteristic
This element has a static input-output characteristic with up to 10,000 points. You can choose between linear and rectangular interpolation.
Functional relationship: y = f(P1,P2, ...,Pn,t); n = 1..10'000
y
linear
P5
P4
rectangular/
rechteckig
P3
P2
User
P6
u
P1
Steps can be built by setting the same input value u for two adjacent points. The output values of the first
and the last point are also valid beyond the given characteristic.
The values are stored in the element, but can also be saved in text files. This enables the data exchange
with other applications. For file and data format descriptions, please see User Source.
13.3.10 Saturation
The saturation element is the most commonly encountered non-linearity in control engineering. It limits the
input value to the upper and lower saturation values SU and SL.
y
SU
Saturation
OF
UF
45°
SU 1
SL -1
u
SL
If the input signal is greater than SU, the overflow output (OF) is set to logic 1. If the input signal is lower than
SL, the underflow output (UF) is set to logic 1. But the analog output signal always stays between the limits.
© Buesser Engineering
- 77 -
SimApp
Catalog - Nonlinear elements
Dead zone
13.3.11 Dead zone
The dead zone element suppresses small signals within the dead zone DL--DU. Between DL and DU the
gain is GI, and GO otherwise. The default value for GI is 0. Therefore, the output remains 0 until the input
signal has crossed the thresholds DL and DU.
y
Dead
zone
GO
DL
DU
GI
u
DU 1
DL -1
GO
13.3.12 Preload (Offset)
This element adds a positive or negative offset to the input value.
Functional relationship:
u >=0: y = OU + Ku
u < 0: y = OL + Ku
y
Preload
K
OU
OU 1
OL -1
u
OL
K
13.3.13 Backlash
S is the maximum saturation value. If the input signal cannot reach S, the characteristic forms a smaller
backlash. If the input starts at zero, the characteristic follows the new curve a.
Backlash
S 1
Db 1
© Buesser Engineering
- 78 -
SimApp
Catalog - Nonlinear elements
Minimum/Maximum (MinMax)
13.3.14 Minimum/Maximum (MinMax)
This element applies those input signal at its output that is currently the smallest or the largest. You can also
use absolute values for minimum-maximum determination.
Maximum
Minimum
y
y
Maximum of absolute value
y
Minimum of absolute value
y
u1
u1
u1
u1
MinMax
1
min
2
u2
u2
u2
u2
13.3.15 Peak detector
This element tracks the input signal and holds the maximum value that has occurred since the simulation
start or since the last time the reset signal has been applied. The peak detector is reset to the current input
signal on the rising edge of the reset signal. The output follows the input as long as reset is set.
Maximum peak
Minimum peak
y
y
Maximum peak of
absolute value
y
Minimum peak of
absolute value
y
Peak
max
Reset
© Buesser Engineering
- 79 -
SimApp
Catalog - Nonlinear elements
Stiction
13.3.16 Stiction
Valve stiction often imposes great problems on control loops since it can cause
oscillations. The term stiction is the combination of the two words "stick" or "static"
and "friction". It describes the effects that occur if the static friction exceeds the
dynamic friction in valves, motors or other mechanical systems. When the valve is
at rest and the control signal is increased the valve will not move until a certain
force has been applied. But the resulting movement is not as uniform as in the case
of a simple hysteresis characteristic. Since the valve sticks, the initial movement is
a jump. Sticking occurs if the valve stops, moves very slowly or changes direction.
The stiction element in SimApp is not limited to valves. It acts as a common actuator element for various devices having stiction. It deals only with the effects of hysteresis and sticking. Other effects that are device dependent are achieved by subsequent elements or sub systems.
SimApp uses an empirical model described in a paper of S. L. Shah (Modelling
Valve Stiction) that is not based on physics but is simple to implement and easy for
industrial personnel to measure the required parameters.
Stiction
S
y
DS
3 %
J
1 %
U0
0
U100 10
Y0
0
Y100 10
In the model, stiction occurs if the sign of the slopes changes or remains zero (speed = 0) for two consecutive time intervals. To observe the speed of the valve the position is sampled in consecutive time intervals.
The length of the interval equals the integration interval, specified in the time simulation properties dialog.
In practice, stiction is expressed as % of the span of the input signal or the valve travel. In the SimApp block
we cannot explicitly specify the value "stiction". In reality however, deadband (<=3%), stickband (<=1% and
slip jump (<=1%) are very small. Under these circumstances stickband and slip jump are almost equal (ca.
0.02% difference) and so both equal stiction. So, if you have a stiction value, use it for slip jump (if values are
small).
For more information about valve stiction, please refer to papers and web pages of Shah, Ruel and others
(keywords: valve, stiction, Shah, Ruel).
Output
y
Y100
Valve
position
0..100%
sticks due to
direction change
100%
direction
change
slip jump
lve
va
t
c
rfe
pe
direction
change
sticks due to
valve rest
sticks due to
direction change
D
Y0
Deadband
0%
S
J Slip jump
Stickband
100%
DS = Deadband + Stickband
U0
Internal
setpoint
0..100%
Control
input or
U100 u external
setpoint
Parameters:
• DS [%], Deadband + Stickband: Hysteresis of the valve in % of the valve range (0..100).
• J [%], Slip jump: The jumpy movement of the valve in %, if the cumulative change of the input signal is greater than the stickband (0--100).
• U0: Input signal for 0% valve travel
• U100: Input signal for 100% valve travel
© Buesser Engineering
- 80 -
SimApp
•
Catalog - Nonlinear elements
Y0: Output signal for 0% valve travel
© Buesser Engineering
- 81 -
Stiction
SimApp
Catalog - Actuators
13.4
Actuators
13.4.1
Rate limiter
Rate limiter
The rate limiter shows the characteristic of an actuator that is too slow to follow the input control signal.
It limits the rising and falling rates of the input signal, i.e. the first derivative of the signal passing through it,
and the amount of the upper and lower saturation limits.
The initial value can be specified by the user or tied to the input signal at time 0. In the second case, Y0 is
ignored.
y
Sf ≤
Ymax
u(t)
dy ( t )
≤ Sr
dt
Sf ≤ 0
Sr
Rate
limiter
Sr ≥ 0
y(t)
Sf
dy
dt lim
t
Sr 1 s-1
Sf -1 s-1
Ymin
Y min ≤ y( t ) ≤ Y max
13.4.2
Constant rate
This element knows 3 output signal slopes only. If the input signal is too small, the output does not change
(dead zone), otherwise it rises or falls at a constant rate, dependent on the input signal being positive or
negative. Finally, saturation limits the output signal in both directions.
The initial value can be specified by the user or tied to the input signal at time 0. In the second case, Y0 is
ignored.
y
Ymax
Rr for/für u(t) > Xt
dy( t )
= Rf for/für u(t) < -Xt
dt
0 for/für -Xt<=u(t)<=Xt
Rr ≥ 0
Rr
Constant
rate
Rf ≤ 0
Rf
dy
dt const
Xt
-Xt
t
Ymin
Y min ≤ y ( t) ≤ Y max
© Buesser Engineering
- 82 -
Rr 1 s-1
Rf -1 s-1
SimApp
Catalog - Controllers
13.5
Controllers
13.5.1
2-point step controller
2-point step controller
The output signal varies between two constant values.
2-step
SU
1
SL
-1
DU 0.5
DL -0.5
Y0
1
Y0 is the initial value at time t<= 0. May be different from SU and SL.
13.5.2
3-point step controller
The output signal varies between three constant values.
3-step
SU
SL
Db
DU
DL
Y0
Y0 is the initial value at time t<= 0. May be different from SU,SL and OF.
© Buesser Engineering
- 83 -
1
-1
1
1
-1
0
SimApp
13.5.3
Catalog - Controllers
Ideal PI controller (PI-i)
Ideal PI controller (PI-i)
The ideal PI controller is designed for phase-lag compensations. It is used if the controlled system has inadequate steady-state performance. It is not used if the system itself has an integral characteristic. The ideal
PI controller eliminates the steady-state error in the step response.
Functions
Step response
t
⎛
⎞
1
y = K⎜ u +
u( τ)dτ ⎟
⎜
⎟
T0
⎝
⎠
t⎞
⎛
h( t ) = K ⎜1 + ⎟
T
⎝
⎠
∫
PI-i
h(t)
2K
1 + sT
G(s) = K
sT
Reset
K
T
0
Magnitude and phase response
Hold
σ(t)
1
[dB]
PI-i
K 1
T 1 s
t
Polar plot
ω=∞
0
I-P ortion/A nteil
(-20dB /Dec )
3dB
P -P ort ion/A nteil
0°
1 + sT
sT
RS
K
0
ϕ
PI-i
K
1/T
1/10T
K/T
ω
Hold
10/T
K 1
T 1 s
ω
-45°
-90°
© Buesser Engineering
- 84 -
SimApp
13.5.4
Catalog - Controllers
Modified PI controller (PI-m)
Modified PI controller (PI-m)
The modified PI controller is designed for phase-lag compensation. It is used if the controlled system has
inadequate steady-state performance. It is not used if the system itself has an integral characteristic.
The modified form of the PI controller is used for the same purpose as the ideal PI controller but cannot
achieve the steady-state accuracy of the ideal PI controller.
Functions
Step response
y + y& TN = K (u + u& TR )
t
⎡ ⎛T
⎞ − TN ⎤
R
− 1⎟⎟e ⎥
h( t ) = K ⎢1 + ⎜⎜
⎢ ⎝ TN
⎥
⎠
⎣
⎦
G(s) = K
1 + sTR
1 + sTN
PI-m
K
h(t)
K
σ(t)
K
1
TR 1 s
TN 10 s
TR
TN
T
0
Magnitude and phase response
Reset
Hold
1
TN>>TR
PI-m
t
Polar plot
[dB]
K
0
K
TR
TN
ω=∞
K
TR
TN
0
ϕ
PI-m
K
1 TN
0°
1 TR
ω
Reset
Hold
K
1
TR 1 s
TN 10 s
ω
-45°
-90°
© Buesser Engineering
1 + sTR
1 + sTN
- 85 -
SimApp
13.5.5
Catalog - Controllers
Ideal PD controller (PD-i)
Ideal PD controller (PD-i)
The ideal PD controller is designed for phase-lead compensation. It is used if the transient response is insufficient or if the system is unstable (phase rise of 0° to 90°). It is not used if the controlled system itself does
not have an integral characteristic.
The ideal PD controller is mostly used for educational purposes. It is difficult to implement in practice, and
the D-term amplifies the noise in the control system.
Functions
Step response
y = K (u + Tu& )
h( t ) = K [σ( t ) + Tδ( t )]
∞
G(s) = K (1 + sT )
PD-i
PD-i
h(t)
K
1
σ(t)
t
0
Magnitude and phase response
[dB]
K 1
T 1 s
Polar plot
D-Portion/Anteil
(+20dB/Dec)
P-Anteil
K
0
PD-i
1/T
ϕ
ω =0
ω
0
K
K 1
T 1 s
90°
45°
0°
© Buesser Engineering
K (1 + sT)
ω
- 86 -
SimApp
13.5.6
Catalog - Controllers
Real PD controller (PD-r)
Real PD controller (PD-r)
The real PD controller is designed for phase-lead compensation. It is used if the transient response is insufficient or if the system is unstable (provides a phase increase of 0° to 90°). It is not used if the system itself
does not have an integral characteristic.
The real implementation of the PD controller has similar effects as the ideal PD controller, but it is easy to
implement and keeps the noise within tolerable limits.
Functions
Step response
t
⎡ ⎛T
⎞ − ⎤
h( t ) = K ⎢1 + ⎜⎜ R − 1⎟⎟e TN ⎥
⎢ ⎝ TN
⎥
⎠
⎣
⎦
y + y& TN = K (u + u& TR )
G(s) = K
PD-r
T
K R
TN
1 + sTR
1 + sTN
PD-r
K
1
TR 1 s
TN 0.3 s
σ( t )
1
TN < TR
K
t
0
Magnitude and phase response
Polar plot
[dB]
K
PD ideal
ω=∞
TR
TN
0
ϕ
PD-r
PD real
K
1 TR
K
1 TN
ω
90°
0
ω =0
K
45°
0°
© Buesser Engineering
ω
- 87 -
ω=∞
K
TR
TN
1 + sTR
1 + sTN
K
1
TR 1 s
TN 0.3 s
SimApp
13.5.7
Catalog - Controllers
Ideal PID controller type I (PID-I)
Ideal PID controller type I (PID-I)
PID control structures are used if the steady-state and the transient performance of the control system are
not to adequate.
The first form of the ideal PID controller corresponds to the parallel connection of a unit-gain, an integrator
and an ideal differentiator followed by a saturation element. As parameters, the gain, the rate time and the
reset time are used. In addition the falling edge of the differentiator can be delayed by TD.
The initial value of the output signal is determined by the input value, the gain and the integrator's initial
value Y0I: Y0:= U0 * K(1 + Y0I);
The output signal can be limited to the range Ymin ... Ymax by two selectable anti-windup measures.
Windup appears because the integral term increases too much during saturation.
Thus, during saturation the increase should be slowed down.
Anti-Windup-Hold
The integration is stopped when the saturation's input signal leaves the valid range (the upper or lower limit
of the saturation). As soon as the signal is reduced, the integrator is released.
Anti-Windup-Reset
If the saturation's input signal exceeds the limit, the integrator's output signal is reduced so that the sum of
integrator, differentiator and unit-gain equals exactly the limit (Ymax or Ymin).
Functions
Step response
t
⎛
⎞
1
⎜
u( τ)d( τ) + TV u& ⎟
y =K u+
⎜
⎟
TN 0
⎝
⎠
∫
PID-I
h(t)
PID-I
K
1
⎛
⎞
1
+ sTV ⎟⎟
G(s) = K ⎜⎜1 +
sTN
⎝
⎠
σ(t)
0
TN > TV
Magnitude and phase response
K 1
TV 1 s
TN 1 s
t
Polar plot
[dB]
K
ω∗ =
0
1 KTV
1 TV
1 TN
1 KTN
ω
K
0
ϕ
90°
TN Tv
PID-I
⎛
⎞
1
K ⎜⎜1 +
+ sTV ⎟⎟
⎝ sTN
⎠
K 1
TV 1 s
TN 1 s
45°
0°
-45°
1
ω∗ =
1
ω
TN Tv
-90°
© Buesser Engineering
- 88 -
SimApp
13.5.8
Catalog - Controllers
Adaptive PID controller
Adaptive PID controller
PID
adaptive
This controller corresponds to the ideal PID controller, type I, whereby the
specified parameters K, TV and TN can be modified during simulation by
control input signals. The parameter control can be multiplicative or additive. Thus, the actual parameter values are:
k PID
n
for multiplicative parameter control:
K = K0 * dK
TN = TNO * dTN
TV = TV0 * dTV
v
m
K0 1
TV0 1 s
TN0 1 s
for additive parameter control:
K = K0 + dK
TN = TNO + dTN
TV = TV0 + dTV
With open control inputs (unconnected) the associated parameters keep
their default values
The limits can also be multiplicatively changed by the input signal at node
m:
Ymin = Ymin0 * dYL
Ymax = Ymax0 * dYL
If the input node is open the limits are unchanged.
PID
adaptive
⎞
⎛
1
⎟⎟
⎜⎜1 +
kK
0
svT
+
V
0
v
snT
m
N
0
⎠
⎝
k
n
K0 1
TV0 1 s
TN0 1 s
© Buesser Engineering
- 89 -
SimApp
Catalog - Controllers
13.5.9
Industrial PID controller
Industrial PID controller
PID
industrial
There are many different real controller structures on the market. Different aplications use different algorithms, so there is no standard PID algorithm. There is even
no standard terminology as in literature and product specifications you find terms
like "ideal", "parallel", "series", "ISA", "interactive", "non-interactive" and more.
Some terms are used equally or similarly others very differently.
SimApp uses only two designations with regard to the mutual arrangement of the Dand I-channel: Series and parallel. Together with two selectable options (D on PV
and P on PV) all knows structures can be achieved.
A/M
MI
FF
SP
PV
Ks
Kp
TN
TV
In the series implementation derivative and integral part are arranged in series,
whereas in the parallel implementation D and I are in parallel and so do not interact
with each other. In both forms the I and D channels can also be switched to operate
on the measurement input (process variable) rather than error signal.
PID
1
1
1 s
1 s
Parallel form
manual input
MI
Bias
FW
KF
Feed Forward
Input
error
e
SP
Set Point
1
sTN
KS
KP
-
F
auto/
manual
I
manual
Y
P
PonPV
DonPV
D
sTV
1+ sTD
Anti-W indup
-1
PV
Process Variable
Serial form
manual input
MI
FW
F
KF
Bias
Feed Forward
Input
auto/
manual
SP
error
manual
e
1
sTN
KS
Y
I
Set Point
DonPV
-1
sTV
1+ sTD
KP
D
PonPV
P
Anti-W indup
-1
PV
Process Variable
Features and settings
PonPV:
Off: P channel reacts to the error signal (default setting).
On: P channel reacts to the process variable (PV) and so eliminates (or reduces, if D is still present) transfer
of set point value discontinuities to control signal.
DonPV:
Off: Derivative operates on the set point change (default setting).
© Buesser Engineering
- 90 -
SimApp
Catalog - Controllers
Industrial PID controller
On: Derivative works on the process variable (PV) and so prevents impulses on control signal caused by
discontinues (jumps) on the reference signal.
Feed-forward action
The feed-forward channel lets the process change independently of process error, and allows faster or earlier reaction to set point disturbances.
Manual mode
In manual mode, all regulation tasks are done through the manual input terminal. A special feature is the
bump-less transfer between manual and automatic mode.
When switching from auto to manual mode an automatic bias or offset is applied to the manual input signal,
so that the controller's output shows no discontinuities (step changes).
When switching back from manual to auto the output of the integrator is set such that the bump-less transfer
is guaranteed also.
In manual mode P and D work as usual but are not used for the output. I channel is stopped and not used
either.
First order lowpass Filter in the D-channel
To reduce noise amplification (differentiation noise) of the controller input a low pass filter is combined with
the derivative to form a DT1 element.
Output Limitation, Saturation
Limitation of the control signal to prevent overloads.
Anti-Windup-Hold
The integration is stopped and held when the control signal at the saturation input leaves the valid range
(upper or lower limit of saturation). As soon as the control signal is reduced, the integrator is released.
Anti-Windup-Reset
If the control signal at the saturation's input exceeds the limit, the integrator's output signal is reduced such
that the sum of all action channels (integrator, differentiator, Gain, feedforward) exactly equals the limit
(Ymax or Ymin).
© Buesser Engineering
- 91 -
SimApp
Catalog - Controllers
Ideal PID controller type II (PID-II)
13.5.10 Ideal PID controller type II (PID-II)
PID control structures are used if the steady-state and the transient performance of the system are not within
specifications.
The second form of the ideal PID controller comes from the importance of the poles and zeros. The assignment of the parameters to ideal basic elements is not as obvious as for the type I controller.
Functions
Step response
t
⎤
⎡
y = K ⎢(TR1 + TR 2 )u + u( τ)dτ + u& TR1TR 2 ⎥
⎥⎦
⎢⎣
0
∫
PID-II
K
1
(1 + sTR1 )(1 + sTR 2 )
G(s) = K
PID-II
h(t)
σ(t)
K
1
TR1 2 s
TR2 1 s
s
0
TR1 ≥TR2
Magnitude and phase response
t
Polar plot
[dB]
PID-II
K(TR1 + TR 2 )
ω∗ =
0
1 TR 2
1 TR 1
ω
ϕ
90°
-45°
ω∗ =
1
ω
TR1TR 2
-90°
© Buesser Engineering
TR1TR 2
K (TR1 + TR 2 )
0
45°
0°
1
- 92 -
K
(1 + sTR1 )(1 + sTR2 )
s
K
1
TR1 2 s
TR2 1 s
SimApp
Catalog - Controllers
Real PID controller (PID-r)
13.5.11 Real PID controller (PID-r)
The real PID controller lessens the influence of the differentiator in the high frequency range (noise) and can
be implemented easily.
Functions
Step response
t
⎤
⎡
y + TN y& = K ⎢(TR1 + TR2 )u + u(τ)dτ + TR1TR2 u& ⎥
⎥⎦
⎢⎣
0
∫
G(s) = K
(1 + sTR1 )(1 + sTR2 )
s(1 + sTN )
PID-r
h(t)
TR1TR 2
TN
K
PID-r
σ(t)
1
K
1
TR1 3 s
TR2 1 s
TN 0.5 s
TR1 ≥ TR2 > TN
0
ω∗ =
t
1
TR1TR 2 − (TR1 + TR 2 )TN
Magnitude and phase response
Polar plot
[dB]
K
TR1TR 2
TN
ω=∞
ω∗
0
K(TR1 + TR 2 )
TN
K
1 TN
0
1 TR1
ω
∗
1 TR 2
ω
ϕ
90°
K(TR 1 + TR 2 − TN )
45°
0°
-45°
ω∗
ω
-90°
© Buesser Engineering
PID-r
K(TR1 + TR2 ) K TR1TR2
- 93 -
(1 + sTR1 )(1 + sTR2 )
s(1 + sTN )
K
1
TR1 3 s
TR2 1 s
TN 0.5 s
SimApp
Catalog - Controllers
Modified PID controller (PIDm)
13.5.12 Modified PID controller (PIDm)
The modified PID controller is suitable for specific and flexible pole and zero cancellations in the controlled
system. Although it does not offer a true integrator, you can get arbitrarily close to meet your steady state
error requirements.
Functions
Step response
PID-m
y + y& (TN1 + TN2 ) + &y&TN1TN2 =
K [u + u& (TR1 + TR 2 ) + &y&TR1TR 2 ]
K
PID-m
h(t)
(1 + sTR1 )(1 + sTR 2 )
G(s) = K
(1 + sTN1 )(1 + sTN2 )
σ(t)
1
K
TR1TR 2
TN1TN 2
TN1 >> TR1 ≥ TR2 > TN2
0
Magnitude and phase response
t
K
1
TR1 2 s
TR2 1 s
TN1 10 s
TN2 0.5 s
Polar plot
[dB]
ω=∞
0
0
1
TR1
1
TN2
1
TN1
K
1
TR 2
TR1TR 2
TN1TN 2
PID-m
(1 + sTR1 )(1 + sTR2 )
(1 + sTN1 )(1 + sTN2 )
K
1
TR1 2 s
TR2 1 s
TN1 10 s
TN2 0.5 s
45°
ω
-45°
© Buesser Engineering
K
K
ω
ϕ
0°
ω =0
- 94 -
SimApp
Catalog - Controllers
Generalized PID controller (PID-a)
13.5.13 Generalized PID controller (PID-a)
By means of the generalized PID controller complex roots in the polynomials of the numerator and denominator are realizable. However, all other structures are also realizable by using suitable parameters.
A typical step response, magnitude or phase curve or Nyquist plot cannot be provided due to the great flexibility of this controller.
PID-a
Functions
[
&&TZ2
y + y& 2dN TN + &y&TN2 = K u + u& 2d Z TZ + u
G(s) = K
]
PID-a
1 + 2dZTz s + TZ2s2
K
1 + 2dNTNs + TN2s2
1 + 2d Z Tz s + TZ2 s 2
K
dZ
TZ
dN
TN
1 + 2dN TN s + TN2 s 2
PID-a
K
dZ
TZ
dN
TN
1
1
1 s
2
2 s
1
1
1 s
2
2 s
13.5.14 Lead/Lag controller
PID control structures are used if the steady-state or the transient performance of the controlled system are
insufficient.
This controller corresponds to the modified PID controller, where the separation into a lead and a lag is particularly obvious. It does not contain a pure integrator.
Functions
Step response
y + y& (T1 + T2 ) + &y&T1T2 =
&&abT1T2 ]
K [u + u& (aT1 + bT2 ) + u
Kab
h(t)
K
⎛ 1 + aT1s ⎞⎛ 1 + bT2 s ⎞
⎟⎟⎜⎜
⎟⎟
G(s) = K ⎜⎜
⎝ 1 + T1s ⎠⎝ 1 + T2 s ⎠
0
Magnitude and phase response
LLC
σ(t)
1
T1 < T2
a>1
b<1
Lead/Lag
controller
K
1
a
4
T1 0.1 s
b 0.5
T2 1 s
t
Polar plot
[dB]
Kab
Lead/Lag
controller
K
1
bT2
0
ϕ
1
aT1
0
K
1
T2
1
T1
Lag
0°
© Buesser Engineering
ω =0
ω
ω=∞
Kab
⎛ 1 + aT1s ⎞⎛ 1 + bT2 s ⎞
⎟⎟⎜⎜
⎟⎟
K⎜⎜
1
+
T
s
1
+
T
s
1 ⎠⎝
2 ⎠
⎝
K
1
a
4
T1 0.1 s
b 0.5
T2 1 s
Lead
ω
- 95 -
SimApp
Catalog - Discrete time transfer elements
13.6
Discrete time transfer elements
13.6.1
Introduction
Introduction
In a sampled control loop the controlled variable consists of a sequence of discrete time values at time t = kT
(k = 0...n) which are supplied to a discrete time controller. This is typically how a computer or microcontroller
would manage the control loop. The analog signals between the sampled points are ignored.
The discrete time controller transforms the input sequence into a appropriate output sequence that is also
defined at the same sample points t = kT only. If the actuator or controlled system uses a continuous signal
input, the output signal of the controller needs to be reconstructed. The most common reconstruction
method is the zero order hold (ZOH). A common implementation is a Digital to Analog converter (DAC) that
holds the value of each digital output until the next one comes along.
SimApp can simulate discrete time elements in the time domain as well as in the frequency domain, however, the following differences need to be considered:
During time simulations, all discrete time elements have a virtual sampler at their inputs and a virtual hold
element at their outputs. Discrete time elements may be placed anywhere in the system. Sample and hold
elements are allowed but not required. In both cases, the signal process is unchanged.
During frequency simulations, however, the transition from the discrete time to the continuous process and
vice versa is very important. The sampling process produces constant weighted sideband signals with the
periodic repetition of the spectrum of the continuous time signal. The hold element exhibits a low pass characteristic with frequency dependent weighting. The Nyquist sampling theorem states that a sampled analog
signal can be perfectly reconstructed from the samples if the sample rate exceeds twice the highest frequency in the system. In the range of half the sampling frequency and above strong distortions occur (poles
and alias frequencies). Therefore, in sampled control systems, the sample period must be sufficiently short
and the harmonic distortion produced by aliasing must be eliminated by a low pass filter before the sampling
process. In practice, sampling should be done at least at 5-10x the highest frequency of interest.
Sampling
Holding
F( jω)
F( j ω)
0
ω
F * ( jω)
0
− ωS −ω S
2
0
ωS
2
ωS
ωS
2ωS
ω
ω
To get a valid frequency response, the sample and the hold elements must be correctly placed. They may be
omitted however, if the simulated frequency range is significantly smaller than the sample period.
If the system for frequency simulation is purely linear, the sample and the hold element may be replaced by
a combined sample and hold element.
Please Note: Each analog element or controller has the option to operate as a discrete time element. The
check box: Time discrete simulation allows application of a sample period to the incoming signal, and it has
a ZOH at the output. The time discrete model is derived from the linear model by substituting the complex
frequency s = jω in the linear transfer function by a forward, backward or trapezoid substitute:
z −1
h
z −1
Backward substitute: s =
hz
2 z −1
Trapezoid substitute: s =
h z +1
Forward substitute: s =
whereas the h is the sampling period
© Buesser Engineering
- 96 -
SimApp
13.6.2
Catalog - Discrete time transfer elements
Sampler
Sampler
The sampler element samples the input signal at sampling points kT (T = sample period) and supplies a
pulse train at its output.
Sampler
T
Ts 0.1 s
Time domain:
y( t ) =
∞
∞
∑ u(kT )δ(t − kT )
Sampler
∑ f (kT )e
k =0
− kTs
k =0
Ts 0.1 s
Frequency domain:
∞
Y * (ω) =
2π ⎞
1
⎛
U⎜ ω − n
⎟,
T ⎠
T n= −∞ ⎝
∑
where U(ω) is the spectrum of the continuous input signal.
The spectrum of an ideally sampled signal u(t) is equal to original time continuous signal weighted by the sample period T and periodically repeated by
the sampling frequency 2π / T
The description of a discrete time signal as a triangular pulse train does not fully correspond to reality. After
sampling, the signal is only defined at sampled points kT. All the following discrete time elements use only
these values. Therefore, the shape of the pulses is not important as it is not considered in the following process. Therefore, it is not proper to supply the output signal of a sampler to a time continuous element. The
resulting signal would not correspond to reality.
Behind a sampler only discrete time elements are allowed which consider the signal at sample points only
and do not care about the values between.
To supply a sampled signal to a time continuous system, it must be held between the sampled points by a
hold element. But most real and discrete time elements already fulfill this condition as they hold the value of
the last sampled point until the new value is applied. That is also true for all discrete time elements in SimApp during a time simulation. However, in frequency simulations the sample and the hold elements must
exist in pairs. (See introduction to discrete time elements.)
© Buesser Engineering
- 97 -
SimApp
Catalog - Discrete time transfer elements
13.6.3
Zero order hold (ZOH)
Zero order hold (ZOH)
The hold element creates from a series of discrete time values u(kT) a stair-like time continuous output signal by holding the current value until a new value is applied. This procedure corresponds to a hold element
of 0-th order (zero order hold).
With the hold element one can also create continuous step functions from continuous input signals as the
hold element also performs an inherent sampling at its input.
In the frequency domain however, a frequency dependent weighting of the signal occurs and the dynamic
systems behavior is only valid in combination with a sampling element.
Functions
y (t ) =
∞
∑ u(kT )[σ(t − kT ) − σ(t − kT − T )]
ZOH
k =0
G(s) =
1 − e −Ts
sin ωT 2 − jωT
e
=T
ωT 2
s
2
Ts 0.1 s
Time response
Magnitude and phase response
U(t)
[dB]
T
ZOH
0
T
2T
3T
...
t
1/T
0
2/T ω
ϕ
Ts 0.1 s
0°
ω
-180°
© Buesser Engineering
- 98 -
SimApp
13.6.4
Catalog - Discrete time transfer elements
Sample and hold (S/H)
Sample and hold (S/H)
S/H
The sample and hold samples the input signal
at times kT (T = sample period) and holds the
sampled value at its output until the next value
is sampled at k(T+1).
1 − e − Ts
s
S/H
∞
∑ f (kT )e
−kTs
k =0
Ts 0.1 s
Ts 0.1 s
Functions
Time response
y
y (t ) =
∞
∑ u(kT )[σ(t − kT ) − σ(t − kT − T )]
u(t)
k =0
1 − e −Ts
Y( s ) =
s
∞
∑ u(kT )e
y(t)
−kTs
k =0
T
t
Magnitude and phase response
[dB]
1
0
1/T
2/T ω (lin)
ϕ
0°
-180°
© Buesser Engineering
- 99 -
ω (lin)
SimApp
13.6.5
Catalog - Discrete time transfer elements
Discrete time integrator (Iz)
Discrete time integrator (Iz)
There are several methods to implement a discrete time integrator. SimApp uses a trapezoidal approximation to transform an ideal time continuous integrator to its discrete time counterpart.
Functions
Step response
Trapezoidal approximation:
1 u k + u k −1
y k = y k −1 +
T
Ti
2
h(t)
Ymax
σ(t)
1
State equation:
Iz
x k +1 = x k + u k
yk =
Ti
T
(2x k + uk )
2Ti
Iz
t
Reset
Hold
x k = x(kT )
Ti
1
Ts 0.1
Transfer function:
T z +1
G( z) =
2Ti z − 1
z = e sT = e jωT
Magnitude and phase response
Polar plot
[dB]
0
-20dB/Dek
ω→ π T
π
T
ϕ
1
Ti
0°
ω
Iz
T z +1
RS
2Ti z − 1
Hold
Ti
1
Ts 0.1
ω
-90°
The discrete time integrator can also be derived from the analog implementation of the bilinear transformation:
1
Transfer function of the analog integrator is G(s) =
sTi
2 z −1
s=
Bilinear Transformation:
T z +1
Replacing s in G(s) by the bilinear transformation yields G(z)
© Buesser Engineering
- 100 -
SimApp
13.6.6
Catalog - Discrete time transfer elements
Discrete time differentiator (Dz)
Discrete time differentiator (Dz)
The discrete time differentiator is derived from the analog implementation by difference expression.
Strong distortions (poles and alias frequencies) can occur in the range of the sample frequency and above.
Therefore, in sampled data systems the sample period must be sufficient short and the harmonic distortion
produced by aliasing must be eliminated by a low pass filter before the sampling process.
Functions
Step response
Difference expression:
u − u k −1
y k = TD k
T
TD
T
Dz
h(t)
State equation:
x k + 1 = uk
yk =
TD
(− xk + uk )
T
σ(t)
1
Transfer function:
T z −1
G( z) = D
T z
Polar plot
[dB]
analog
20dB/Dec
Dz
2π
T
time discrete/
zeitdiskret
ω
0
ϕ
© Buesser Engineering
TD z − 1
T z
TD 1 s
Ts 0.1 s
+90°
0°
TD 1 s
Ts 0.1 s
t
T
Magnitude and phase response
1
TD
Dz
ω → 2π T
ω
- 101 -
SimApp
13.6.7
Catalog - Discrete time transfer elements
Unit delay (z element)
Unit delay (z element)
The unit delay delays a discrete time or analog signal by the sample period T.
The block can be rotated in 90° steps.
Functions
Time response
y(t) = u(t-T)
y(t)
u(t)
Step response:
z-1
h(t)=σ(t-T)
T
Transfer function:
G(z)=z-1;
Ts 0.1 s
z:=esT
T
t
Magnitude and phase response
Polar plot
[dB]
0
ω
-1
0
ω =0
2π
T
ϕ
0°
-57°
© Buesser Engineering
1
ω
z-1
z −1
Ts 0.1 s
- 102 -
SimApp
13.6.8
Catalog - Discrete time transfer elements
Discrete time PID controller (PIDz)
Discrete time PID controller (PIDz)
This controller is the counterpart to the ideal analog PID controller, type I. It consists of the parallel connection of a P-, a Iz and a Dz element, which can individually be switched off.
Since the same parameters exist (gain K, rate time TV and reset time TN) it allows a direct comparison between the analog and the discrete time implementation.
The output signal can be limited by two selectable anti-windup measures in the range Ymin ... Ymax.
Anti-Windup-Hold
The integration is stopped when the saturation's input signal leaves the valid range (the upper or lower limit
of the saturation). As soon as the signal is reduced the integrator is released.
Anti-Windup-Reset
If the saturation's input signal exceeds the limit, the integrator's output signal is reduced so that the sum of
integrator, differentiator and unit-gain equals exactly the limit (Ymax or Ymin).
Functions
Step response
PIDz
⎛
T TN ( z + 1) ( z − 1) ⎞
⎟
+
G( z ) = K ⎜⎜1 +
2( z − 1)
T TV z ⎟⎠
⎝
h(t)
PIDz
K
1
0
Magnitude and phase response
K
1
TV
1 s
TN 1 s
Ts 0.1 s
σ(t)
t
Polar plot
[dB]
PIDz
K
ω∗ =
0
1 KTV
1 TN
1 TV
1 KTN
ω
0
K
45°
-45°
ω∗ =
1
ω
TN Tv
-90°
© Buesser Engineering
TN Tv
⎛ T T ( z + 1) ( z − 1) ⎞
⎟⎟
K⎜⎜1 + n
+
2
(
z
−
1
)
T
T
z
v ⎠
⎝
K
1
TV
1 s
TN 1 s
Ts 0.1 s
ϕ
90°
0°
1
- 103 -
SimApp
13.6.9
Catalog - Discrete time transfer elementsRational discrete time transfer element (G(z))
Rational discrete time transfer element (G(z))
The G(z) element is the general implementation of a linear discrete time transfer element. It is the counterpart to the analog G(s) element and is also known as digital controller.
A real time computer program must be causal, i.e. for computing the new output value y(kT), one can only
use the input values u(kT), u(kT-T), ... From that is concluded that the order of the denominator must be
greater or equal to the order of the numerator.
G(z)
Functions
G( z ) = K
1
b0 + b1z + K + bm z
b0 + b1z + K + bmz
a0 + a1z1 + K + anzn
1
m
K
a0 + a1z1 + K + an zn
m ≤ n , an ≠ 0
Ts 0.1 s
b0: 1 a0: 1
m ≤ 31 n ≤ 31
G(z)
m
N( z)
D( z)
Ts 0.1 s
b0: 1 a0: 1
The meaning of the initial values is depicted by the matrix representation of the state equations:
⎡ 0
⎢
⎢ 0
x k +1 = ⎢ M
⎢
⎢
⎢− a∗
⎣ 0
1
0
0
1
M
M
− a1∗
− a∗2
[
⎡ 0 ⎤
0 ⎤
⎢
⎥
⎥
K 0 ⎥
⎢ 0 ⎥
O
M ⎥ x k + ⎢ M ⎥uk
⎢
⎥
⎥
1 ⎥
⎢
⎥
⎢1 ⎥
K − an∗ ⎥⎦
⎢⎣ an ⎥⎦
K
]
yk
= b 0 − a∗0bn b1 − a1∗bn K bn −1 − an∗ −1bn x k + bn∗ uk
K
a
b
a∗i = i
bi∗ = i
an
an
13.6.10 Discrete time filter (z-Filter)
As the powers in the transfer function are negative, this elements has not the restrictions of the G(z) element. The orders of numerator and denominator can be freely selected. The law of causality does not apply
here.
Functions
G( z) = K
z-Filter
−1
−1
−m
b0 + b1z + K + bm z
a0 + a1z −1 + K + an z −n
K
b 0 + b 1z + K + b m z
a 0 + a1z −1 + K + a n z −n
Ts 0.1 s
b0: 1 a0: 1
a0 ≠ 0
m ≤ 31 n ≤ 31
© Buesser Engineering
−m
- 104 -
z-Filter
Ts 0.1 s
b0: 1 a0: 1
SimApp
Catalog - Discrete time transfer elements
Linear difference equation system
13.6.11 Linear difference equation system
SimApp lets you model linear and time-invariant difference equation systems in State Space format. This
representation is particularly useful for models with a lot of interactions and for advanced control applications.
This element is the counterpart to the analog implementation. Note that the coefficients used in the difference equation system are NOT the same as for the analog implementation.
LDS
Vector form
System matrix equation x k +1 = A x k + Buk
Output matrix equation y = Cx k + Duk
xk +1
k
where x k = x(kT )
Ts 0.1 s
The system consists of n states, p input quantities and q output quantities.
yk
State vector (n x 1)
Input vector (p x 1)
Output vector (q x 1)
A
B
C
D
System matrix (n x n)
Input matrix (n x p)
Output matrix (q x n)
Direct transmission matrix (q x p)
xk
uk
Parameters:
LDS
xk +1 = A xk + Buk
yk = Cxk + Duk
Ts 0.1 s
n<=50, p<=50, q<= 50
Matrix representation:
⎡ x& k +1,1 ⎤ ⎡ A 11 A12
⎢&
⎥ ⎢
⎢ x k +1,2 ⎥ = ⎢ A 21 A 22
⎢ . ⎥ ⎢ .
.
⎢
⎥ ⎢
⎢⎣ x& k +1,n ⎥⎦ ⎣ A n1 A n2
⎡ y k,1 ⎤ ⎡C11 C12
⎢
⎥ ⎢
⎢ y k,2 ⎥ = ⎢C21 C22
⎢ . ⎥ ⎢ .
.
⎢
⎥ ⎢
⎣⎢ y k,q ⎦⎥ ⎣⎢Cq1 Cq2
. A 1n ⎤ ⎡ x k,1 ⎤ ⎡B11 B12
⎥ ⎢
⎥ ⎢
. A 2n ⎥ ⎢ x k,2 ⎥ ⎢B 21 B 22
+
*
.
.
. ⎥ ⎢ . ⎥ ⎢ .
⎥ ⎢
⎥ ⎢
. A nn ⎦ ⎢⎣ x k,n ⎥⎦ ⎢⎣Bn1 Bn2
. C1n ⎤ ⎡ x k,1 ⎤ ⎡D11 D12
⎥
⎢
. C2n ⎥ ⎢⎢ x k,2 ⎥⎥ ⎢D21 D22
+
*
.
.
. ⎥ ⎢ . ⎥ ⎢ .
⎥ ⎢
⎥ ⎢
. Cqn ⎦⎥ ⎢⎣ x k,n ⎥⎦ ⎣⎢Dq1 Dq2
. B1p ⎤ ⎡ uk,1 ⎤
⎥ ⎢
⎥
. B 2p ⎥ ⎢uk,2 ⎥
*
.
. ⎥ ⎢ . ⎥
⎥ ⎢
⎥
. Bnp ⎥⎦ ⎢⎣uk,p ⎥⎦
. D1p ⎤ ⎡ uk,1 ⎤
⎥ ⎢
⎥
. D2p ⎥ ⎢uk,2 ⎥
*
.
. ⎥ ⎢ . ⎥
⎥ ⎢
⎥
. Dqp ⎦⎥ ⎣⎢uk,p ⎦⎥
In real systems, the direct transmission matrix D usually is 0.
© Buesser Engineering
- 105 -
SimApp
13.7
Catalog - Converters
Analog to digital converter (ADC)
Converters
SimApp makes a distinction between binary and digital converters. This is not common practice but it is important to describe two types of digital transmission used in SimApp.
A digital input or output in SimApp consists of a single node that can transmit all bits at one time. The digital
numerical value is transmitted as a positive analog integer signal, e.g. binary 0 corresponds to 0, 1101 (13
decimal) corresponds to 13. It does not make sense to mix digital and analog signals, therefore the digital
signal lines differ in color from the standard signal lines. The advantage of this analog coding of digital values lies in the small space requirement on the drawing for the element and transmission (one line only).
The binary input and output in SimApp corresponds more to the usual concepts. For each individual bit, an
individual signal line is used. The disadvantage of this solution is the huge space requirement for large numbers (big elements and multiple lines).
13.7.1
Analog to digital converter (ADC)
The ADC samples the input signal at constant time intervals T (sample period) and converts it into a digital
signal. The digital output signal is supplied to a single digital signal line. The ADC incorporates a sampler a
converter and a quantizer that rounds the signal to positive integer values.
The sample period, the resolution of the quantizer and the upper and lower limit can be specified. The default value for the lower limit is zero.
When the input signal leaves the valid range, the Overflow or the Underflow output is set to logic high.
Parameters:
0<= Res <= 32
Example: Characteristic of an ADC with 3 bit resolution in the range of 0 to 10.
Upper limit /
obere
Bereichsgrenze
u(t)
Rh
10
111
8.75
ADC
110
101
q=
100
Rh - Rl
2
Res
= 1.25
011
lower limit/
1.25
untere
Bereichsgrenze
0
Underflow
Overflow
H
001
Rl
000
L
H
L
t
Note: The upper limit Rh corresponds to the binary value 1000 = 111 + 1.
© Buesser Engineering
UF
Rh 10
Res 8 Bit
Ts 0.1 s
010
2.5
OF
- 106 -
SimApp
13.7.2
Catalog - Converters
Digital to analog converter (DAC)
Digital to analog converter (DAC)
The DAC converts the digital input signal into an analog output signal. The sample period, the resolution and
the upper and lower limit as well must be specified. Default value for the lower limit is zero. The sample period must be equal to those the ADC uses to produce the input signal.
Example: DAC with resolution of 3 bit and range from -2 to 8.
111=7=Res-1
110
u(t)
100
101
DAC
011
010
001
1011
000
8
t
Rh 10
Res
8 Bit
Ts 0.1 s
Rh
y(t)
q=
-2
Rh - Rl
2 Res
t
= 1.25
Rl
© Buesser Engineering
- 107 -
SimApp
Catalog - Converters
13.7.3
Analog to binary converter (ABC)
Analog to binary converter (ABC)
The ABC converts an analog input signal into a binary-weighted output signal. Each digit has its own output
node. The valid input range and the resolution are selectable in number of bits ( = number of output nodes.
The valid resolution range is from 1 to 31. When the input signal leaves the valid range, the Underflow (UF)
or Overflow (OF) output is set. In the underflow case, the binary outputs are cleared, in the overflow case all
binary outputs are set.
Example: 3-Bit ABC
Rh
ABC
Rl
OF
UF
B0
B1
B2
B0
B1
B2
Rh 10
Overflow
Underflow
t
13.7.4
Binary to analog converter (BAC)
This converter is the counterpart to the ABC. It converts the binary input signal that comes in through several
signal lines into an analog output signal. The resolution (number of bits = number binary input nodes) can
freely be selected between 1 and 31. The two selectable limits correspond to the binary values 0 and
11111..1 +1. The upper limit can never be reached as it represents the value 2n . The maximum input value
is 2 n − 1 . (n = number of bits, resolution.).
Example: 3 bit BAC
Rh
BAC
y(t)
B0
B1
B2
Rh 10
Rl
000
001 010 011 100 101 110 111
Input
© Buesser Engineering
- 108 -
SimApp
13.7.5
Catalog - Converters
Quantizer
Quantizer
The output signal of a quantizer can assume integer values only, that are a multiples of an integer value. It
follows a ramp by creating a step function. The step size depends on the selected range and the resolution.
Example: For a range of 16 and a resolution of 3 bits, the step size amounts to q = 16 / 2^3 = 2.
The selected range however does not limit the output signal, as it is only used for step size computation.
The quantizer can be used for simulating digital systems where only discrete values can occur. The discrete
time elements themselves do not quantize the signal, they only sample and compute the signal at discrete
times.
Example: 3 bit quantizer
Ra = 16
14
12
10
Quantizer
8
Step/Schritt = 2
6
4
Res 8 Bit
Ra 10
q=2
0
Quantization error = ± 1
Quantisierungsfehler = ± 1
-2
-4
© Buesser Engineering
- 109 -
SimApp
13.8
Catalog - Logic
GND (Ground, logic 0, false)
Logic
Logic elements perform Boolean operations with binary and logical signals. In SimApp, there is no difference
between logic and analog signals. Logic elements can be supplied by output signals of analog elements and
vice versa.
Input signals lower than the logic threshold are interpreted as low (logic 0 or false) whereas signals being
greater than the logic threshold are interpreted as high (logic 1 or true). The default threshold value is 0.5
and default logic high output value is 1. Logic 0 is always 0.
Feedback with logic elements
By default, logic elements in SimApp have no propagation delay. Thus, there are the same restrictions as for
other elements: Feedback loops without any delay elements are not allowed (see algebraic loops).
However, in logic circuits it is common to build feedback loops. For example you can form a set/reset flip flop
with two NAND gates in a feedback configuration.
Furthermore, logic circuits often need propagation delays for proper operation, even when they do not have
feedback loops. For example, in a synchronous counter with a chain of JK flip-flops all having the same input
clock signal, it is essential that the states at the J and K inputs and the outputs of the preceding flip-flops,
change after the positive going edge of the clock signal. For details, see the counter example in the programs example directory.
To enable such cases, all logic elements have the option Propagation delay. The output signal of the element changes only at the beginning of the next integration interval if this option is set. Therefore, a short
delay of one integration step size can be included. If the integration step size is set as recommended (see
chapter Time simulation) this delay can be neglected. If you build large logical circuits or long chains of logic
elements the sum of delays may become unacceptable long.
If you encounter such problems, you can take the following actions.
1. Enable the Propagation Delay option only for one logic element in the feedback loop.
2. Reduce the integration step size by factor 10.
13.8.1
GND (Ground, logic 0, false)
Connects an input port to ground and acts as a source that supplies a value of 0. Normally, open logic input ports are interpreted as a ground connection.
You can rotate this element in 90 degree steps for correct positioning in the drawing.
13.8.2
V+ (logic 1, true)
Connects an input port to logic 1 and acts as a source that supplies the logic 1 value.
For correct positioning in the drawing you can rotate this element in 90 degree steps.
13.8.3 AND gate
This multiple input logic element performs the Boolean operation:
AND
Y = I1 • I2 • K • In
The number of inputs is freely selectable between 2 and 50.
The output can be delayed by one integration step by setting propagation delay. The
NAND function is achieved by a subsequent NOT gate.
© Buesser Engineering
- 110 -
1
2
&
SimApp
13.8.4
Catalog - Logic
OR gate
OR gate
This multiple input logic element performs the Boolean operation:
OR
Y = I1 + I2 + K + In
The number of inputs is freely selectable between 2 and 50.
The output can be delayed by one integration step by setting propagation delay. The
NOR function is achieved by a subsequent NOT gate.
13.8.5
1
2
1
Exclusive-OR gate (XOR, non-equivalence)
This logic element performs the Boolean operation:
Y = I1 ⊕ I2 resp. Y = I1 ≠ I2 resp. Y = I1 • I2 + I1 • I2
The number of inputs is two and is unchangeable.
The output can be delayed by one integration step by setting propagation delay.
The EXNOR function Y = I1 = I2 (equivalence) is achieved by a subsequent NOT gate.
13.8.6
Inverter (NOT gate)
This element performs the Boolean operation:
Y = I or Y= not I
The output can be delayed by one integration step by setting propagation
delay. .
The NOT gate has two symbols:
The first symbol is a small circle so that the inversion of an input or output
signal of another gate needs as little space as possible. The second symbol
is a triangle for independent use.
© Buesser Engineering
- 111 -
XOR
1
2
=1
SimApp
13.8.7
Catalog - Logic
SR flip-flop
SR flip-flop
A high level at the Set input sets the output (Q to high, Q- to low) and a high level at Reset input resets the
output. If both inputs are reset the output is not changed.
If both Set and Reset are set, the output state depends on the option Set dominant.
If Set Dominant is true, the output is set, when both Set and Reset are high at the same time.
If Set Dominant is false, the output is reset, when both Set and Reset are high at the same time.
If Positive edge triggered is active, the state changes only occur at positive input edges otherwise the static
values are decisive. With positive edge triggering there is no output change if the inputs fall from 1 to 0.
The logic initial value is selectable.
The output can be delayed by one integration step by setting propagation delay.
Inputs
Outputs
Reset
Q
Q
L
H
H
L
L
L
H
H
L
H
Q0
H
L
Q0
H
L
L
H
Set
H
H
SR-FF
Set
Q
Reset Q
Set dominant
Reset dominant
Q0 = level of Q before the last change of Set or Reset.
13.8.8
JK flip-flop
A high level at Set or Reset input sets or resets the outputs regardless of the levels of the other inputs. When
Set and Reset are inactive (low), data at the J and K inputs are transferred to the outputs on the positivegoing edge of the clock pulse. Data at J and K input may be changed without affecting the levels at the outputs. This flip-flop can be used as toggle flip flop by tying J and K high.
The logic initial value is selectable.
The output can be delayed by one integration step by setting propagation delay.
Inputs
X
Q0
Outputs
Set
Reset
CP
J
K
Q
H
L
H
L
L
L
L
L
L
H
H
L
L
L
L
L
X
X
X
X
X
X
L
H
L
H
X
X
X
X
L
L
H
H
X
H
L
L
H
H
H
Q0
Q0
H
L
H
L
Toggle
Q0
Q0
L
= do not care
= level of Q before the last input change or clock pulse
= 0-1 CP edge
© Buesser Engineering
- 112 -
Q
JK-FF
Set
J
Q
CP
K
Q
Reset
SimApp
13.8.9
Catalog - Logic
D flip-flop
D flip-flop
The D-type flip-flop has asynchronous Set and Reset inputs and complementary (Q,Q-) outputs. Information
at the input is transferred to the outputs on the positive going edge of the Clock Pulse. After the Clock Pulse
the Data input is locked out and information present will not be transferred to the outputs until the next rising
edge at the Clock Pulse input.
The logic initial value is selectable.
The output can be delayed by one integration step by setting propagation delay.
Inputs
Outputs
Set
Reset
CP
D
Q
Q
H
L
L
H
H
L
L
X
X
H
L
H
L
L
X
X
X
X
H
L
H
H
H
H
L
L
L
X
L
Q0
L
L
H
Q0
D-FF
Set Q
D
CP
Q
Reset
13.8.10 Monoflop
The monoflop has a positive-transition-triggered input (T) and a asynchronous reset input (R). Triggering
sets the output. Once triggered, all input transitions at the trigger port are ignored as long as the output is
high. (See options.)
The output is reset after the on-time Ton has elapsed or when Reset is asserted. The output cannot be set
when Reset is high.
Options
Reset option:
Retrigger option:
The output is cleared as soon as the trigger signal goes back to low, otherwise it waits
Ton.
The monoflop can be retriggered, i.e. when the trigger input fires again, the high state is
extended by another Ton interval.
Reset
Monoflop
Trigger
T
Ton
Ton 1 s
Output
Reset
Option
© Buesser Engineering
R
Ton
- 113 -
Retrigger
Option
SimApp
Catalog - Logic
On/off delay
13.8.11 On/off delay
This logic delay element has a positive-transition-triggered (T) and a asynchronous Reset (R) input. In contrast to the non delayed monoflop, the on-time of the output is not specified. The on-time is determined by
the duration of the Trigger pulse and an additional delay time. The rise and fall times depend on the Off delayed option.
Options
When Off delayed is disabled, the output is set the delay time Td after the positive transition of the trigger
signal and forced low again on the negative transition of the trigger. If the trigger pulse is shorter than the
specified delay time, the output signal remains low.
When Off delayed is enabled, the output is set on the positive transition of the trigger signal and is forced low
delay time Td after the Trigger signal went low. If the trigger input is set again before the Td has elapsed, the
output high state is extended until Td after the negative transition of the second trigger pulse (= retriggering).
Reset
Delay
Trigger
T
R
Output
On delayed
Output
Off delayed
© Buesser Engineering
Td
Td
Td
Td
Td 1 s
Td
- 114 -
SimApp
13.9
Catalog - Miscellaneous
1:2 Switch
Miscellaneous
13.9.1 1:2 Switch
This element is a 1-line to 2-line demultiplexer. The Select input determines the signal routing to the output.
When the select signal is low (off state) the input is routed to the upper output, the lower one supplies zero.
When the select signal is high (on state) the input is routed to the lower output, the upper one supplies zero.
The Schmitt Trigger select input prevents output jitter, when the select signal is slowly changing and superimposed with noise. Switching threshold and deadband are adjustable. By default, the threshold is set to the
logical threshold.
The switch can be used for logical and digital signals and analog signals.
1:2
1
2
13.9.2 2:1 Switch
This element is a 2-line to 1-line data selector/multiplexer. The select input determines
which input is routed to the output.
When the select signal is low (off state), the upper input is routed to the output.
When the select signal is high (on state) the lower input is routed to the input.
For information about the Schmitt Trigger select input see 1:2 Switch.
The switch can be used for logical and digital signals as well as for analog signals.
For more information about switching characteristic see 1:2 switch.
© Buesser Engineering
- 115 -
2:1
1
2
SimApp
13.9.3
Catalog - Miscellaneous
1:n output switch (demultiplexer)
1:n output switch (demultiplexer)
The signal at select input (S) selects 1 of several outputs to be connected to the single input. All other outputs supply 0. The routed signal may be of any type (analog, logical or digital). This multiswitch can have 2
to 50 output pins.
S
O0
O1
...
On-1
<0
0
0
...
0
1:n
1
0
1
...
0
Sel
Inp
...
...
0
...
...
...
0
...
1
...
0
n-1
0
0
...
1
≥n
0
0
1
2
0
...
...
All outputs supply 0, if the value at S is < 0 or greater than the number of outputs - 1
13.9.4
0
n:1 Input switch (multiplexer)
The signal at select input (S) selects 1 of several inputs to be connected to the single output. The routed
signal may be of any type (analog, logical or digital). This multiswitch can have 2 to 50 input pins.
S
Out
<0
0
0
I0
1
I1
...
...
n-1
In-1
n:1
Sel
0
1
2
O
≥n
0
The output supplies 0, if the value at S is < 0 or greater than the number of inputs - 1.
13.9.5 Triggered sample and hold
This element has an analog and a logic input terminal. On the rising edge at the trigger input the analog input signal is sampled and the value held at the output until the end of the simulation or until the next trigger
event is applied.
Before the first trigger event, the shape of the output signal is determined by the option Track before hold.
If Track before hold is enabled, the output tracks the input signal until the first trigger event is applied, otherwise the output signal remains zero. After the occurrence of the first trigger event, this option does not affect
the output any longer.
Note the difference from SimApp's ordinary sample and hold element which samples and holds the input
signal at every sample period.
Folgen vor
Halten
Track before
hold
u(t)
y(t)
Trig. S/H
t
Hold/
Halten
t
© Buesser Engineering
- 116 -
SimApp
13.9.6
Catalog - Miscellaneous
Controllable delay element
Controllable delay element
The current delay time in seconds [s] is controlled by an analog input signal at the control input (Ctrl). Dmin
and Dmax can limit the delay range. The lower limit is 0 if Dmin < 0 and the upper limit is ∞ if Dmax < 0.
Example: Response to input step at time t = t0:
y(t)
K
1
u(t)
Delay
Y0
t0
Ctrl
Dmin
Ctrl
Dmax
t
Ctrl
Dmax
13.9.7
Relation
The Relation element offers 6 relational operators:
A<B
A <= B
A=B
A >= B
A>B
A <> B
The deadband is used for the equal (A=B) and unequal (A<>B) operations only, in order to compare floating
point numbers within a tolerance band. If both input signals are within this band, they are interpreted as
equal or unequal respectively.
Relation
A
B
© Buesser Engineering
- 117 -
<
SimApp
Catalog - Miscellaneous
13.9.8
Window comparator
Window comparator
This element detects if the input signal is inside or outside the range (window) WB...WT. The state (input
inside or input outside) is indicated by the logic Q output port. The output port Y supplies the input signal if it
is in the valid range otherwise it supplies WB or WT.
Designation of the valid range is determined by the Outside option.
If Outside is enabled, the valid range is between WB and WT. If the input is not in this range, the Q output is
set.
If Outside is disabled, the valid range is outside of the range WB...WT. If the input is between WB and WT
the Q output is set.
The start of the rising edge at the Q output can be delayed by the Alarm delay parameter so that short time
range violations are ignored.
WT
WB
Window
Y
Q
Alarm
inside/
innen
Q
Td
Alarm Q
outside/
aussen
13.9.9
Td
Td
Td
WT 1
WB -1
Td
Td
Td
Td
Zero crossing detector
This element observes the input signal and supplies a short logic pulse if it crosses the zero line. The pulse
width is one integration step size, so that it is not visible if the output time resolution is longer than the integration step size.
There are three detection modes:
Both Directions:
Fires an output pulse if the input goes form negative to positive or from positive to
negative.
Negative > Positive: Detects crossings only if the input goes from negative to positive.
Positive > Negative: Detects crossings only if the input goes from positive to negative.
negative > positive
positive > negative
t
both directions
VO
h
t
© Buesser Engineering
- 118 -
Zerocrossing
SimApp
Catalog - Miscellaneous
Step ramp
13.9.10 Step ramp
This elements supplies a stair-shaped ramp at its output Y. The step size can be specified and remains constant during simulation. On each positive going edge at the clock (Clk) input, the ramp is increased or decreased by one step. The ramp starts at a given value and grows towards the variable limit signal. By applying Reset the ramp is reset to the initial value. The ramp stops if it has reached the limit and the output Q is
set. If the limit signal is changed, the output Q is cleared and the ramp again approaches the new value of
the limit signal on every clock edge. By changing the limit signal the slope of the ramp can be changed at full
speed.
y(t)
Limit
dY
Step ramp
Y0
t
Lim
Clk
RS
Y
Q
dY 1
Q
Reset
Clock
t
© Buesser Engineering
- 119 -
SimApp
Catalog - Special
Transmitter and Receiver
13.10 Special
13.10.1 Transmitter and Receiver
By means of transmitter-receiver pairs you can build block diagrams which are more clearly. Instead of a
direct visual connection of two blocks, you can use a wireless transmission. The connection is established by
a common name which must be unique in the drawing. Two or more transmitters having the same name
form a short circuit. A transmitter however can transmit a signal to more than on receiver if all have the same
name.
It is also possible to transmit signals out of custom blocks without using nodes. But this is recommended for
testing purposes only as the transmitter is not visible from outside and can get forgotten.
Example: One transmitter and two receiver blocks with the name Trans:
Trans
Trans
Send
Rec
Trans
© Buesser Engineering
- 120 -
SimApp
Bibliography
14 Bibliography
Deutsch
[1]
Föllinger Otto: Regelungstechnik, Hüthig-Verlag Heidelberg, 1994
[2]
Orlowski Peter: Praktische Regeltechnik, Springer-Verlag Berlin, 1994
[3]
Mann Heinz, Schiffelgen Horst, Froriep Rainer: Einführung in die Regelungstechnik, Carl HanserVerlag München, 1997
[4]
Wegener Adolf: Analoge Regelungstechnik, Carl Hanser-Verlag München, 1995
[5]
Bossel Hartmut: Modellbildung und Simulation, Vieweg-Verlag Wiesbaden, 1994
[6]
Schwarz Hans Rudolf: Numerische Mathematik, B. G. Teubner Stuttgart, 1993
[7]
Föllinger Otto: Lineare Abtastsysteme, Oldenburg Verlag München, 1993
[8]
Föllinger Otto: Nichtlineare Regelungen I, Oldenburg Verlag München, 1993
[9]
Föllinger Otto: Nichtlineare Regelungen II, Oldenburg Verlag München, 1993
[10] Föllinger Otto: Laplace- und Fourier-Transformation, AEG-Telefunken, 1980
[11] Lutz,Wendt: Taschenbuch der Regelungstechnik, Verlag Harri Deutsch
[12] Norbert Grosse, Wolfgang Schorn, Taschenbuch der praktischen Regelungstechnik, Hanser, 2006
English
[21] Kuo Benjamin C.: Automatic Control Systems, Prentice Hall, 1995
[22] Kuo Benjamin C.: Digital Control Systems, Holt, Rinehart and Winston, Inc, 1980
[23] Kailath Thomas: Linear Systems, Prentice Hall, 1980
[24] Gibson John E.: Nonlinear Automatic Control, McGraw-Hill, 1963
[25] Atherton D. P.: Nonlinear Control Engineering, Van Nostrand Reinhold Company London, 1975
[26] Slotine, Jean-Jacques E. and Weiping Li: Applied Nonlinear Control, Prentice-Hall, 1991
[27] Ogata, Katsuhiko: Modern Control Engineering, Prentice-Hall, 2002
Français
[41] BHALY: Boucles de Régulation, études et mise au point, Kirk Editions, 1990
[42] C.Sueur, P.VanHeeghe, P.Borne: Automatique des Systèmes Continus, Edition Technip, 1997
[43] Yves Granjon: Automatique, Dunod, 2003
121