1
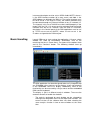
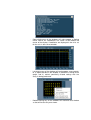
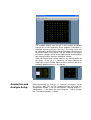
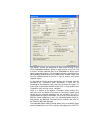
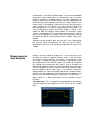
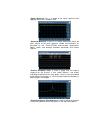
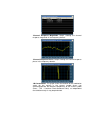
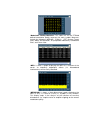
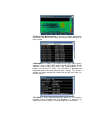
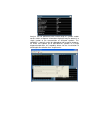
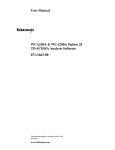
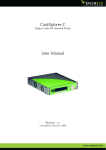
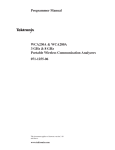
D i g i t a l B r o ad c as t A n a l y z e r
USER
MANUAL
Chapter 1
Introduction
What’s in This
Chapter
This chapter contains a general description of the DBA software
package. It also provides information on how to install the software
on your computer or instrument.
NOTE
This software package operates in conjunction with the
Tektronix family of Real-Time Spectrum Analyzers. This
manual describes the operation of the DBA software
package and can be used with any of the following
Tektronix
products:
RSA3303A/B,
RSA3308A/B,
RSA3408A/B, WCA230A, and WCA280A.
Introduction
DBA is a software package devoted to analyze digital broadcast
signals using any Tektronix Real-Time Spectrum Analyzer (RTSA).
Among other capabilities, DBA enables the user to:
1. Basic and advanced modulation quality assessment for
signals based in the DVB-T/H standards.
2. Basic QoS characterization.
3. Measurements procedures and results according to the
TR101 290 standard.
4. Handling of arbitrarily long captures over live or recorded
signals.
5. Transport Stream extraction for deferred analysis and/or playback.
6. Fast analysis speed ideal to handle long captures and
interactive testing..
7. Support for DVB-T/H in the 2K, 4K, and 8K modes with 5, 6,
7, and 8 MHz channel bandwidths.
8. Up to four independently defined analysis windows may be
displayed simultaneously.
9. MER measurement capabilities beyond 48dB with current
instruments.
10. Time, spectrum, and modulation
including the exclusive MER vs
(MERgram) display
analysis correlation
time vs frequency
11. Analysis may be carried out by the internal RTSA computer
or by a remote PC through a GPIB or network connection.
12. Measurement data can be exported in both graphical or
textual formats.
System
Requirements
Minimum requirements for system configuration are described
below. These are:
1. PC compatible computer running Windows NT, Windows
2000, Windows XP, Windows Vista and at least 256 Mbytes
of RAM.
2. 100 Mbytes of free hard disk space. (More memory will
be needed if signals are to be stored in local files).
3. Ethernet and/or GPIB required if a direct connection to
the target instrument is planned. The GPIB card must be
fully compatible with National Instruments IEEE488.2
function calls and any VISA library (TekVISA
recommended).
Installation
Installing the DBA software package is very straight forward
process. Just insert the supplied CD into the CD drive, click on the
DBA.msi file and follow the on-screen instructions. When done,
DBA will automatically place an icon on your desktop. To run DBA,
just click on the DBA icon and the program will be invoked.
License
Handling
The DBA application requires a valid license to work permanently in
any instrument or computer. The DBA application is automatically
installed in “Trial Mode” so there is no need to enter any validation
information at installation time. Trial mode is valid for 15 days and
the following rules apply during this period:
-Every time the application is started, the license management
splash screen shows up. The number of remaining days before
expiration is shown in the licensing splash screen.
-The licensing information is stored in the computer in an encrypted
format. Re-installing the DBA application will not re-start the 15
days trial period.
The DBA license is locked to a particular computer through the
Hard Disk serial number. Take a look to the “DBA Licensing
Procedures” appendix for detailed activation instructions on how to:
1)Activate the application after purchasing a license.
2)Delete the license from a given computer and, if desired, ask for a
new activation code.
Chapter 2
DBA Basic Handling
What’s in This
Chapter
This chapter contains information on how to connect the software to
the target instrument and basic operation information.
NOTE
This software package operates in conjunction with the
Tektronix family of Real-Time Spectrum Analyzers. This
manual describes the operation of the DBA software
package and can be used with any of the following
Tektronix
products:
RSA3303A/B,
RSA3308A/B,
RSA3408A/B, WCA230A, and WCA280A.
Connection to the
Target Instrument
Direct connection to the analyzer requires TekVISA running in the
computer where the DBA application runs. TekVISA must be
installed in the target instrument along with the latest software
version if the TCP/IP connection is going to be used for
communication. If the RSA analyzer is accessed through a network
connection then the VXI-11 server must be running in the target
instrument. Embedded execution requires TekVISA installed in the
RSA analyzer and the VXI-11 server should be switched off. If
TekVISA is going to be used as the control interface, the control
port for the RSA must be set to “TekVISA”. Refer to the RSA3000
series user and programming manual for further details
Successful communication requires proper set-up of the Device
Descriptor parameter within the DBA settings window. Use the
following settings for the different interfaces:
-
GPIB: “GPIBn::addr::INSTR”; n:GPIB intfc# (usually 0), addr: RSA'
address
-
TCP/IP: “TCPIP::aaa.aaa.aaa.aaa::INSTR” ; aaa....aaa is the TPC/IP
address
-
Embedded: “GPIB8::1::INSTR”
The current package includes some evaluation files to help the
evaluators run all the available functionality without requiring actual
DVB-T/H source. Those files have been captured from live
transmitters using an antenna so the modulation quality measured
by the RSA/DBA combination reflects the actual system
performance including signal attenuation and noise addition
introduced by the channel and not the analysis noise floor.
Connecting to the instrument from the embedded controller
requires meeting several conditions: TekVISA must be installed
properly in the target RSA, the VXI-11.2 server must be
deactivated, and the control interface must be set to “TekVISA”
from the RSA UI. Instrument descriptor in the Control panel of the
DBA application must be set to “GPIB8::1::INSTR”. Controlling the
instrument from an external controller through the GPIB interface
does not require TekVISA running at the target instrument. The
instrument descriptor must be set to “GPIBx::Addr::INSTR” where x
is the GPIB interface number (0 in most cases) and Addr is the
GPIB address as defined in the RSA UI. The control interface must
be set to “GPIB” in the RSA UI. Finally, the external controller may
be connected through an Ethernet interface to any IP network (i.e.
The Internet) in this case TekVISA must be installed properly in the
target RSA, the VXI-11.2 server must be activated, and the control
interface must be set to “TekVISA” from the RSA UI. Instrument
descriptor in the Control panel of the DBA application must be set
to “TCPIP::xxx.xxx.xxx.xxx::INSTR”, where xxx.xxx.xxx.xxx is the
IP adress assigned to the RSA analyzer.
Basic Handling
Launch DBA.exe to start running the application. A license splash
window will show up immediately. Information such as the
remaining trial time is shown there. Just ignore all the options there
and hit the “Continue” button. The following window show up
immediately:
The DBA application has been designed to be easily integrated into
any RSA3000 series analyser so the displays shows up gracefully
in the embedded RSA LCD display. Additionally, most of the
functionality can be accessed by using a mouse and the embedded
RSA numeric keyboard.
The display is split in 4 different analysis windows. These are the
common controls to handle the windows:
-
The analysis performed by each window can be selected by
clicking at the drop-down menu at the top of each window. The
current version of the software does not allow selecting the
same analysis function in two or more windows at the same
time.
-
Right clicking any of the windows will make appear a floating
cursor whose X/Y coordinates are shown at the bottom left
corner of the display. Coordinates are displayed in the units set
for the axis in the current window.
-
Left-clicking any of the windows will make appear some controls
to 1) export the data in the window, 2) control the scaling of the
graph, and 3) control specifically related settings with the
analysis being performed.
-
Double-clicking any of the windows will maximize that window
so that will be the only one shown.
Acquisition and
Analysis Setup
-
The available display may be split in two sections by double
clicking one of the quadrants where graphical information is
displayed while pressing the “Shift Key·. The same result may
be obtained by double clicking the desired graph while pressing
the center button in the mouse. The left section of the display
will contain a bigger version of the graphic being clicked and the
right side will always show the “Highlights” window.
-
Click and Drag may be used to zoom on any desired portion of
the graph. To do so it is necessary to allow zooming by
checking the View->Enable Zoom control in the menu bar or by
hitting the Magnifying Lens in the tool bar.
Before performing any analysis it is necessary to properly set-up
the analysis tool. This can be accomplished by accessing the
configuration window. It can be activated by selecting Analysis->
Configuration... in the Menu Bar or by hitting the
icon in the tool
bar. The following display is shown:
The default settings are designed to work while running in any
RTSA embedded computer. Analysis origin can be set to Disk File
to access already captured files or to RSA3408A for direct signal
capture from the analyzer. The file to be analysed is specified at the
corresponding field located in the middle of the window. Make sure
that the selected format for the file is “iqt” to analyse any of the
supplied signals.
It is possible to shift the analysis band within the available Span by
controlling the “Frequency Shift” parameter. It must be set
according to the frequency shift necessary to center the signal (i.e.
If the signal is centered at 36 MHz and the CF is set to 35 MHz then
“Frequency shift” must be set to -1.0 MHz).
There is a control at the bottom (“Transport stream output file”)
where the user can define a file where the transport stream being
carried by the captured waveform will be extracted. This file is
stored without any extra information so it can be visualized by any
MPEG2 viewer supporting .ts files (i.e. Windows Media Player) or
analysed by any deferred Transport Stream analysis tool such as
the Tektronix MTS4SA package.
The Expected Signal Setting section allows the user to define signal
format according to any of the settings according to the DVB-T/H
specifications in 2K/4K/8K OFDM modes. The channel bandwidth
and guard interval parameters are automatically set for analysis
made on previously recorded captures (iqt files). Additionally for
captures longer than 68 OFDM symbols, the DBA application can
check the consistency between the analysis settings and the TPS
content and, if not matching, allow the user to re-start the analysis
again based on the TPS content. The “Get TPS first” option has
been designed for TPS analysis and automation when there is no
need to continuously acquire 68 OFDM symbols or more. In this
mode the DBA will acquire around 100ms of continuous signal
activity, it will decode the TPS information and the analysis settings
will be set according to its contents if desired. Acquisition time for
the following captures will be defined by the “Capture” field in this
window.
Settings may be saved or open bu using the “Save Configuration
file“ and the “Open Configuration File” entries in the File Menu.
Alternatively, there are save and load configuration file icons in the
Toolbar.
Measurements
and Analysis
Analysis may be started by hitting the > in the menu bar or by
selecting the Analysis->Capture Analysis entry in the menu bar.
The current version performs the analysis by executing a loop
consisting in reading one symbol, analysing it, showing the results
and jumping to the next OFDM symbol. This allows to manipulate
the settings while performing the analysis and to evaluate the
approximate update rate that could be reached for live acquisition.
The final product will allow a much faster block-capture-> block
analysis->display results when there is no need for continuous
display update (i.e. When transmitter adjustments are being done).
Analysis may be stopped by hitting the squared red button in the
tool bar or by selecting the Analysis->Stop entry in the Menu Bar.
What follows is a brief explanation of the available analysis
functions:
-Raw Spectrum: This is a graph of the magnitude of the complex
spectrum obtained from applying the FFT to the IQ raw sample
pairs.
-Signal Spectrum: This is a graph of the signal spectrum after
applying the analysis bandpass filter.
-Spectrum Measures: It consists in a table showing the values for
each symbol of the main spectrum related measurements as
described by the TR101/ETR290 measurement specification:
Upper, Lower, and Average Shoulder attenuation and Overall
Flatness.
-Channel Response Time: It shows a graph with the impulse
response for the channel. It also shows different red arrows
indicating the position of the main peaks. Those usually correspond
to the different transmitters in a SFN (Single Frequency Network) or
different types of multipath.
-Channel Response Time Measures: A table showing the location
in time and amplitude of the main peaks in the channel response.
-Channel Response Magnitude: Graph showing the channel
response magnitude in the frequency domain.
-Channel Response Phase: Graph showing the channel response
phase in the frequency domain.
-IQ Constellation: This graph shows the location of the modulation
states for the carriers in the current symbol. Users can
activate/deactivate the different components of the OFDM symbol
(Data / TPS / Continual Pilots/Scattered Pilots) so independent
constellation analysis may be performed.
-Modulation Quality Measures: This table lists all the ETR290
defined modulation quality measures for each symbol. Measures
include the following: MER(dB), EVM(%), STE (System Target
Error) Mean and Deviation, AI (Amplitude Imbalance), Quadrature
Error, and Phase Jitter.
-MER: It shows a graph displaying the MER as a function of the
carrier so frequency dependent effects (i.e. Narrowband
interferences) can be easily identified.
-MERGRAM: It shows a three-dimensional graph displaying the
MER (Z axis) vs. Carrier # (X axis) vs. Symbol (Y axis) function.
This display helps in the analysis of the influence of transient
disturbances (i.e. Impulse noise or amplifier clipping) on the overall
modulation quality.
-Bit Error Rate Measurements: It consists in a table showing the
error before Viterbi and after Viterbi (thus before Reed-Solomon) for
each symbol.
-HIGHLIGHTS: It shows a live display of the main signal quality
indicators such as MER, BER before Viterbi, BER before ReedSolomon, Packet Error Ratio (errors after Reed-Solomon as TS
packets are hit) and TPS status (TPS information is decoded and
compared against the actual physical layer settings). This analysis
window has been designed to show how the tool can show live
measurements.
-TPS INFO: It shows detailed information about the TPS contents
including all the available fields fully decoded. It is necessary to
capture at least 68 symbols in a row to display this information.
Analysis can be performed with limited range of symbols and/or
carriers within a capture. Information displayed may be based in a
single symbol or the accumulation of analyzed symbols. This
capability is specially useful for debugging and research purposes.
As RSAs can capture up to thousands of symbols in a single
triggered acquisition, this capability allows for the visualization of
meaningful constellation for a single carrier: