1
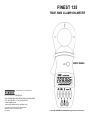
FINEST 135
TRUE RMS CLAMP-ON METER
USER’S MANUAL
a world leader in test & measurement
FINE INSTRUMENTS CORPORATION
341-5, SONGNAE-DONG, SOSA-GU, BUCHON-SHI, KYUNGGI, KOREA
- TEL: (82-32) 656-8771~4 - FAX: (82-32) 656-5844
- E-mail: [email protected]
- Internet: www. finestwon.com (or www.finest. co.kr)
© Copyright 1994 Fine Instruments Corp. All right reserved.
Specifications subject to change without notice.
Litho in Korea.
© 1994, FINE INSTRUMENTS CORPORATION All rights reserved. Litho in Korea
Measurement Limits:
AC Amperes
: True-rms 0.3 to 700A
DC Amperes
: 0.3 to 700A
AC Voltage
: True-rms 0 to 750V
DC Voltage
: 0 to 750V
Frequency
: 0.5 to 9999Hz
Resistance
: 0 to 4KΩ
Continuity Check
: Beep at Approx. < 35Ω
in the 400Ω range
WARNING!
READ “ CLAMP-ON METER SAFETY” BEFORE USING
THIS METER.
Contents
1. Introduction
2. Clamp-on Meter Safety
3. Explanation of Controls and Indicators
4. Alignment Marks
5. How to Use this Meter
6. Applications of Measurement
7. Maintenance and Calibration
8. Technical Data and Specifications
1. Introduction
This Meter is a handheld and battery operated True-RMS
Clamp-on Meter that is designed and tested according to
IEC Publication 348, Safety Requirements for Electronic
Measuring Apparatus (Protection Class ll) and other safety
standards (see “Technical Data”).
This Meter combines the speed and versatility of a high
resolution analog display with the precision of a digital meter.
1
This Meter measures the true-rms value of Alternating
Current (AC) over from 0.3A to 700A. AC measurements
are from 10Hz to 1KHz and frequency measurements are
from 0.5Hz to 10KHz.
Clamp meters that measure average current flow are
inaccurate for non-linear currents and their measurements
may have some differences from those obtained using this
Meter.
This Meter can also measure frequency while measuring
current flow simultaneously. AC and DC voltages and
resistances can be measured and also continuity check is
possible with this Meter.
This Meter also provides:
■Auto Range or Manual Range selection.
■HOLD function to freeze readings.
■41-segment analog bar graph that displays current while
simultaneously measuring frequency on the digital display.
■ Low- battery indicator and battery life indicator at
powerup using bar graph.
■Automatic power off after 10 minutes of inactivity and
power lock to disable the automatic power off function.
■When an ineffective pushbutton is pressed, this Meter
beeps twice continuously.
■ A SOFT mode to display a 3-second running average.
■A CREST mode that measures half-cycle peak AC
amperes.
■A MIN/MAX RECORD mode to record maximum,
minimum, and average values of rms current, softened
rms, frequency, voltage or ohms. Half-cycle peak
maximum may also be recorded in the CREST mode.
■Zero adjustment by the microprocessor when measuring
DC amperes.
2
2. Clamp-on Meter Safety
In this manual, the word “DANGER” identifies a severe or
immediately accessible personal hazard that can cause
death or injury; the word “WARNING” identifies a personal
hazard about a condition or procedure that could cause
death or injury; the word “CAUTION” identifies an
equipment hazard about a condition or procedure that
could cause damage or destruction of this Meter.
Observe the International Electrical Symbols listed below.
Warning! Risk of electric shock.
Caution! Refer to this manual before using this Meter.
Double Insulation (Protection Class ll)
■Never clamp around a conductor at 600V rms or greater
or with a frequency of 10KHz or greater.
■Never use a meter whose insulating protection has been
impaired.
■ Be extremely cautious when clamping around
uninsulated conductors or bus bars.
■Use this Meter only as specified in this manual. Otherwise,
the protection provided by this Meter may be impaired.
■Observe the safety messages contained in this manual.
■Avoid working alone.
■Inspect the test leads for damaged insulation or exposed
metal. Check test lead continuity. Damaged leads should
be replaced.
■Disconnect the live test lead before dis-connecting the
common test lead.
■Be sure this Meter is in good operating condition. During a
continuity test, a meter reading that goes from overflow
(OFL) to 0 generally means this Meter is working properly.
■ Select the proper function and range for your
measurement.
3
3. Explanation of Controls and Indicators
(1)
(7)
Ω . Selects ohms measurement mode.
(8)
VΩ . Volt, Ohms, Continuity Test Input Terminal.
(9)
V. Selects volts measurement mode.
(10) COM . Common Terminal.
(11) Hz . Selects frequency measurement mode.
(12) A . Selects amperes measurement mode.
(13) MIN MAX . Selects RECORD mode and displays
recorded MAX, MIN, and AVG.
(14) SOFT CREST . Selects SOFT for a running 3-second
average, or CREST for half cycle peak amperes.
(15) AC DC . Selects AC or DC mode.
(2)
(16)
(3)
(15)
(14)
(13)
(4)
(5)
(12)
(11)
(6)
(7)
(16) LEVER . Opens and closes clamp jaws.
(10)
(9)
(8)
(17) RECORD . Displayed (blinking) when MAX, MIN, and
AVG values are being recorded. Duration of
RECORD is limited by battery life.
(1)
CLAMP. Opens 2.04 inches (52mm) to enclose
conductors.
(2)
HOLD. Freezes reading in digital display.
(3)
DISPLAY. Liquid crystal display.
(4)
RANGE. Selects 0 to 40A, 0 to 400A, or AUTO.
(5)
ON OFF. Selects meters power ON or power OFF.
(6)
4
. Selects continuity testing mode.
(18) MAX MIN AVG . Displayed in RECORD mode by
pressing MIN MAX pushbuttons.
(19)
. Displayed when HOLD pushbutton has been
pressed.
(20)
. Displayed when
pressed.
pushbutton has been
(21) SOFT . Displayed when current flow readings or Hz or
V readings are softened out over 3-second intervals.
5
(22) KΩVHz . Displayed when measuring ohms or voltage
or frequency.
4. Alignment Marks
(23) PEAK . Displayed when current flow readings are in
halfcycle peak amperes (Crest mode).
(24) RMS . Displayed when current reading is in amperes
rms.
(25) OFF-SCALE ARROW . Displayed when bar graph
pointer is off scale.
(26) DUAL . Displayed when measuring frequency in
digital and amperes in bar graph simultaneously.
(27) A . Displayed when meter is measuring amperes.
(28) DIGITAL DISPLAY . Displays 3999 counts, with two
decimal points relative to the two ranges. But,
displays 9999 counts in frequency mode. Display is
updated 4 times each second.
(29) POINTERS . Displayed to indicate position on bar
graph scale. Positions are updated 20 times each
second.
(30) ANALOG DISPLAY POLARITY . Displays + or when the pointers are displayed.
(31) 0 to 400A . (or 0 to 800A.) Numeric reference for the
bar graph.
(32)
. Displayed when internal battery needs
replacing.
(33) AC . Alternating Current or Voltage.
(34)
. Automatically indicate negative digital
displays.
(35) AUTO . Displayed when autoranging controls bar
graph scale (0 to 40A scale, or 0 to 400A scale) and
controls position of decimal point on digital display.
(36) POWER LOCK . Displayed when the Auto Power off
mode of the meter has been disabled.
(37) BEEPER . Beeps for pushbutton operation or current
overload.
(38) OFL . Overflow Indication.
6
Figure 1. Alignment Marks
Position the conductor within the jaws at the intersection of
the indicated marks as much as possible (Figure 1) in order
to meet this Meter’s accuracy specifications.
If the conductor is positioned elsewhere within the jaws, the
maximum additional error resulted is 1.5 percent.
5. How to Use this Meter
5.1 Battery Replacement
This Meter is powered by a single 9V battery (NEDA Type
1604A, 6LF22, or 006p). To guarantee the specified battery
life, alkaline or other long-life batteries are recommended.
If the low-battery indicator on the digital display will be
displayed, replace the battery by using the following
procedure referring to Figure 2.
1. Unclamp this Meter from any conductor, and turn it off by
pressing the ON OFF pushbutton.
2. Place this Meter face down on a non abrasive surface
and completely loosen the three rear panel screws with
a Phillips-head screwdriver.
7
3. Grasp the bottom of the rear cover and lift it free of the
case.
4. Lift the battery from the case, and carefully disconnect
the battery connector leads.
5. Snap the battery connector leads to the terminals of a
new battery and insert the battery into position. Dress
the battery leads so that they will not be pinched
between the case bottom and the case top.
6. Replace the rear cover, ensuring it slips beneath the
holddown lip (next to the jaws) and fits securely into
position.
7. Reinstall the three securing screws.
If this Meter is not be used for periods of longer than 60
days, remove the battery and store it separately.
5.2 Notes
For taking full advantage of this Meter’s capabilities, read
completely, in sequence, each of the following pages. It is
not necessary to make a measurement to learn how to use
this meter. Take the time to read this section completely
before attempting any meter applications because this
meter has many features and operating sequences that are
not readily apparent.
WARNING!
MOST OF THE TYPICAL APPLICATIONS ARE
EXPOSED TO LETHAL VOLTAGES. BE CAUTIOUS
WHEN TAKING MEASUREMENTS. BEFORE THE
METER IS CONNECTED TO ANY CIRCUIT, REVIEW
THE SAFETY INFORMA-TION. ALWAYS KEEP YOUR
HANDS BEHIND THE METER’S HAND GUARD.
5.3 Power Up/Self Test
Figure 2. Battery Replacement
8
Press and hold the ON OFF pushbutton in order to power
up and initiate self test. This meter beeps and all LCD
segments will turn on (some segments have nothing to do
with this Meter.) as part of a self-test routine. Observe a
bar graph pointer blinks to indicate the battery condition
while still pressing the ON OFF pushbutton. The “OffScale” arrow blinks for a battery life in excess of 40 hours
and a corresponding bar graph pointer blinks for a battery
life of less than 40 hours. Read the scale as 0 to 40 hours
for this battery test. A pointer under the 3 (6 is not
displayed) on the scale, for example, represents
approximately 30 hours of remaining battery life.
9
Release the ON OFF pushbutton to initialize this Meter.
5.5 Measuring DC Amperes
Replace the battery before using this Meter when the
battery test gives a reading of only a few hours or when the
low-battery indicator is displayed on the digital display.
If this Meter dose not turn ON, the battery is missing or
worn out. To replace the battery, see 5.1 Battery
Replacement.
This Meter shuts OFF after 10 minutes if no pushbutton is
pressed, even if it is making a measurement. To disable
the auto power off, press the ON OFF pushbutton (
is displayed), when if you press the ON OFF pushbutton
again, the Meter turns OFF.
When you want to use this Meter in manual range, press
the RANGE pushbutton, than this Meter is in manual
range. Press RANGE pushbutton for 2 seconds to return to
Autoranging mode.
5.4 Measuring AC Amperes
Press the AC DC pushbutton to select the DC amperes
measurement mode (AC disappeared on the LCD), but the
meter is still in the autoranging mode (AUTO displayed),
unless you press the RANGE pushbutton to enter into the
manual ranging mode.
When the DC amperes measurement mode is entered, the
display reads a non-Zero DC amperes (positive or
negative) value due to the presence of the Earth’s
Magnetism. This value is variable according to the location
measuring DC amperes.
Zero Adjustment by the Microprocessor
To initiate the Zero Adjustment procedure, press the HOLD
pushbutton for 2 second. Then, the meter beeps and the
display reads Zero just after the microprocessor
memorized the right preceding display value that is used
for calculating the exact DC amperes measurement value
when measuring the DC amperes of a current-carrying
conductor.
When this meter has been powered up, it defaults in the AC
amperes mode with 250-ms mea-surement intervals (AC
displayed) and auto-ranging mode (AUTO displayed), which
auto-matically selects the proper range for both the bar
scale and the digital display. Press the RANGE pushbutton
to select a fixed scale instead of autoranging. Observe that
each press alternates between the 40A and 400A scales
and AUTO is no longer displayed. When the reading is
beyond the limits of the digital display, for example, 40A on
a 40A scale, OFL appears on the digital display.
When measuring the DC amperes of a current-carrying
conductor, the DC amperes value has a positive or
negative polarity according to the direction of currentcarrying. This value is positive when the current flows
through the conductor in the forward-moving direction of a
right-hand threaded screw. And it is negative when the
currents flows through the conductor in the backwardmoving direction of a right-hand threaded screw.
Press the RANGE pushbutton for 2 seconds and than
release in order to return to autoranging mode. This Meter
acknowledges with a beep sound and displays AUTO.
10
11
5.6 Measuring Frequency
5.7 Using Data Hold
To enable the frequency measurement mode, press the Hz
pushbutton. This Meter displays Hz, DUAL, and AUTO.
The frequency of the current flow is displayed. Auto
(autoranging) is applied to the bar graph, which represents
rms value of the current flow. When in AUTO, frequency
measurement uses an auto trigger threshold based on onehalf of the peak current mea-surement. This provides the
best sensitivity and noise immunity.
To freeze the digital display reading (HOLD is not applied
to the bar graph.), press the HOLD pushbutton.
is
displayed when HOLD is enabled.
To select a fixed 40A or 400A bar graph display (AUTO is
no longer displayed), press the RANGE pushbutton. With a
fixed 40A or 400A scale, fixed trigger thresholds are
imposed for frequency readings. The thresholds are 6A
(40A scale) or 40A (400A scale). The frequency display is
0.0Hz when a trigger threshold is not reached.
Press the RANGE pushbutton for 2 seconds and then
release in order to return to autoranging mode. This Meter
acknowledges with a beep sound and displays AUTO on
the digital display. Press the other function (A or V or Ω or
) pushbutton to exit the frequency mode.
When HOLD is used while measuring frequency, RANGE
can be changed only for imposing trigger thresholds of 6A
on the 40A scale, and 40A on the 400A scale. The
frequency reading will be 0.0Hz when HOLD is released, if
the trigger threshold is not reached.
When in the HOLD mode, this Meter function can be
changed from the held function to one of the other
functions, when HOLD is automatically released.
Press the HOLD pushbutton again (
displayed) in order to exit HOLD.
is no longer
Press the RANGE pushbutton for 2 seconds and then
release in order to autoranging mode. This Meter
acknowledges with a beep sound and displays AUTO on
the digital display.
5.8 Measuring AC/DC Voltage
Press the V pushbutton to enable the voltage
measurement mode and then select AC or DC by toggling
the AC DC pushbutton.
12
13
This Meter defaults in the autoranging mode and displays
V, AC and AUTO. AUTO (autoranging) is applied to the bar
graph.
To measure voltage, connect this Meter in parallel with the
load or circuit under test. Each of the three AC/DC voltage
ranges presents an input impedance of approximately 10
MΩ in parallel with less than 100pF.
Measurement errors due to circuit loading can result when
making either AC or DC voltage measurement on circuits
with high source impedance. In most cases, the error is
negligible (0.1% or less) if the measurement circuit source
impedance is 10 Kilohms or less.
5.9 Measuring Resistance
CAUTION!
TURN OFF POWER ON THE TEST CIRCUIT AND
DISCHARGE ALL CAPACITORS BEFORE ATTEMPTING
INCIRCUIT RESISTANCE MEASUREMENTS. IF AN
EXTERNAL VOLTAGE IS PRESENT ACROSS A
COMPONENT, IT WILL BE IMPOSSIBLE TO TAKE AN
ACCURATE MEASUREMENT OF THE RESISTANCE OF
THAT COMPONENT.
The resistance in the test leads can diminish accuracy on
the lowest (400-ohm) range. The error is usually 0.1 to 0.2
ohms for a standard pair of test leads.
When measuring resistance, be sure that the contact
between the probes and the circuit under test is good. Dirt,
Oil, Solder flux, or other foreign matter seriously affect
resistance.
5.10 Continuity Testing
Press the Ω pushbutton to enable the res is tance
measurement mode. This Meter defaults in the autoranging
mode and displays KΩ and AUTO. And also the off-scale
arrow of the bar graph blinks and the digital display reads
OFL.
AUTO (autoranging) is applied to the bar graph.
This Meter measures resistance by comparing the internal
reference resistance given by a resistor array with the
unknown resistance to be measured. Remember, the
resistance displayed by this Meter is the total resistance
through all possible paths between the probes. This
explains why in-circuit measurement of resistors does not
often yield the ohms value indicated by the resistor’s color
code.
14
Press the
pushbutton to enable the continuity testing
mode. This Meter defaults in the 400-ohm range and then
highest bar graph scale shows 400. The digital display
reads OFL.
Continuity testing verifies that circuit connections are intact.
Test resistances below 35Ω cause the Meter to emit a
continuous tone.
15
Input Range
400Ω
Beeper On If
5.12 Using Crest
Approx. < 35Ω
Table 1. Beeper Response in Continuity Test
The continuity mode is extremely fast and can be used to
detect either shorts or opens that last for as little as 100
milliseconds. When a change is detected, the beeper tone
is “stretched” to last at least 1/4 second, so you can hear it
and detect both shorts and opens.
This can be a valuable troubleshooting aid when looking for
intermittents associated with cables connections, switches,
relays, etc. If the test value is very close to the threshold,
erratic beeps can also occ ur due to environmental
electrical noise (EMI).
Observe that PEAK is displayed after pressing the SOFT
CREST pushbutton twice. PEAK is available for AC
ampere readings only and can not be selected when in the
other modes.
Both the digital display and bar graph measure the halfcycle peak AC amperes when PEAK is displayed.
The crest factor of a waveform is the ratio of its half-cycle
peak amperes to its rms amperes.
Half-Cycle Peak Amperes
Crest Factor =
RMS Amperes
5.11 Using Soft
The Crest Factor is a nominal 1.414 for linear current flow
without current wave distortion. Crest Factors other than
1.414 indicate the presence of harmonic current flow. (See
6.1 Non-Linear Loads.)
Press the SOFT CREST pushbutton once to exit CREST.
Then, PEAK is no longer displayed.
5.13 Enabling Record
Observe that SOFT is displayed after pressing the SOFT
CREST pushbutton once. This SOFT mode digitally
displays a running average of readings over 3-second
interval to reduce the fluctuation of the readings. The bar
graph is unaffected by this SOFT function and updates 20
times each second.
SOFT function can be used for ampere readings or voltage
readings.
To enable RECORD, Press the MIN MAX pushbutton. The
blinking RECORD is displayed.
Press the SOFT CREST pushbutton twice when in the AC
or DC amperes mode, or once when in the voltage mode,
in order to exit SOFT.
16
17
The recording of a new maximum or minimum is indicated
by beep sounds.
We can use RECORD in all modes of this Meter, but we
can not change Meter modes while in RECORD, for
example, from voltage to amperes.
In the AC amperes mode, the bar graph displays the rms
value of current flow and also blinking pointers at the
recorded MAX and MIN. But, in the frequency mode, the
bar graph displays the rms value of current flow only. No
blinking pointers.
In SOFT, the softened values of rms current flow,
frequency or voltage is recorded for MAX, MIN, and AVG.
The bar graph displays instantaneous values of rms
current with blinking pointers for MAX and MIN.
In CREST (that is, PEAK) mode, the half-cycle peak
amperes are recorded for MAX. In CREST mode, MIN
AND AVG are not available. The bar graph displays a
single blinking pointer for MAX. The CREST (that is,
PEAK) function is not available in the other (V or Hz or Ω)
modes.
To stop recording, use the HOLD pushbutton. Then,
RECORD no longer blinks, and the values of MAX, MIN,
and AVG are frozen. Press the HOLD pushbutton again to
restart recording, when the values of MAX, MIN, and AVG
are not reset. The recording simply starts again from where
it left off.Press and hold the MIN MAX pushbutton for 2
seconds and then release in order to exit RECORD. This
Meter acknowledges with a beep sound and RECORD is
no longer displayed.
5.14 Using Record
After enabling RECORD, press the MIN MAX pushbutton
to cycle through the MAX, MIN, and AVG readings held in
memory. If this Meter is in CREST (that is, PEAK) function,
only MAX is held in memory. Battery life limits the duration
of RECORD. The MAX reading is the maximum value
detected since RECORD started. The MIN reading is the
minimum value detected since RECORD started. The AVG
reading is calculated continuously from the start of
RECORD.
To stop recording and to freeze the values of MAX, MIN,
and AVG in memory, press the HOLD pushbutton. Press
the MIN MAX pushbutton to cycle through the readings,
including a position where the
blinks. In this mode,
readings may be taken without disturbing the values held in
memory. To restart recording, press the HOLD pushbutton.
Then, RECORD blinks.
When using HOLD and RECORD, note that when
RECORD is blinking, this Meter is recording values; when
RECORD is not blinking, this Meter is not recording values.
When
is blinking, the digital display is showing a
real measurement; when
is not blinking, the digital
display is showing a recorded measurement. HOLD and
RECORD apply to the digital display only. The bar graph
shows a real measurement only at all times.
If you press the MIN MAX pushbutton to start recording
while in the HOLD mode, RECORD is not blinking because
this Meter is not recording values. And if you cycle through
the MAX, MIN, and AVG readings, this Meter displays just
– – – –.
18
19
Press the MIN MAX pushbutton for 2 seconds and then
release in order to exit RECORD (or HOLD and RECORD
it selected). This Meter acknowledges with a beep sound
and RECORD is no longer displayed.
6. Applications of Measurement
The vector addition of the currents in the transformer’s
neutral wire was zero or quite low (because perfectbalance was rarely achieved) in a well-balanced system,
devices connected to which were incandescent lighting,
small motors, and other devices that presented linear
loading. The result was an essentially sine-wave current
flow in each phase and a low neutral current flow at a
frequency of 50Hz/60Hz.
6.1 Non-Linear Loads
True-RMS current flow is very important because it directly
relates to the amount of heat dissipated in wiring,
transformers, and system connections. Most ammeters in
the market measure average current flow, not true rms
current flow, even if this average current flow is displayed
on a scale calibrated in rms. These average-sensing
ammeters are accurate only for a pure sign-wave current.
All current waveforms are virtually distorted in some way.
The most common is harmonic distortion caused by nonlinear loads such as household electrical appliances,
personal computers or speed controls for motor drives.
Harmonic distortion caused significant current flow at
frequencies that are at odd multiples of the power line
frequency. Harmonic current flow gives a substantial
impact on the neutral wires of star (wye)-connected power
distribution systems.
In most countries a power distribution system uses
commercial 3-phase 50Hz/60Hz power applied to
transformer with a delta-connected primary, and a star
(wye)-connected secondary.
The secondary generally provides 120V AC from phase to
neutral, and 208V AC from phase to phase. To balance the
loads for each phase was a big headache for the electrical
system designer, historically.
20
But, devices such as TV sets, fluorescent lighting, video
machines, and microwave ovens are commonly drawing
power line current for only a fraction of each cycle so that
they cause non-linear loading and subsequent non-linear
current flow. This generates odd harmonic of the
50Hz/60Hz line frequency. Therefore, the current in the
transformer of today contains not only a 50Hz (or 60Hz)
component, but a 150Hz (or 180Hz) component, a 250Hz
(or 300Hz) component, and the other significant harmonic
components up to a 750Hz (or 900Hz) component and
beyond.
The vector addition in a properly-balanced power
distribution system feeding non-linear loads may still be
quite low. But, the addition does not cancel all the
harmonic currents. The odd multiples of the 3rd harmonic
(called the “TRIPLENS”) are, particularly, added together in
the neutral. These harmonics can from a total rms current
in the transformer’s neutral wire that is normally 130% of
the total rms current measured in any individual phase,
whose theoretical maximum is 173%.
For example, phase currents of 80 amperes may cause
harmonic current flow in the neutral of 104 amperes. The
dominant current flow in the neutral is most commonly the
3rd harmonic.
The electrical system designer must consider the following
3 issues when he designs a power distribution system
containing harmonic current flow.
21
1. The AC neutral wires must be of sufficient gauge to
allow for harmonic current flow.
2. The distribution transformer must have additional cooling
to continue operation at its rated capacity, if it is not
harmonic-rated. This is because the harmonic current
flow in the secondary neutral wire is circulating in the
delta-connected primary winding, after it is reflected to
the primary winding. The circulating harmonic current
heats up the transformer.
3. Phase current harmonics are reflected to the primary
winding and they continue back towards the power
source. This can cause distortion of the voltage wave
so that any power factor correction capacitors on the
line can be easily overloaded.
6. To soften readings, press the SOFT CREST
pushbutton once (SOFT displayed) or to measure halfcycle peak amperes, press this pushbutton twice
(PEAK displayed). A crest factor (see 5.11 Using
Crest) other than 1.414 is an indication of non-linear
current flow.
7. To record readings and to view readings, press the
MIN MAX pushbutton.
8. To clear RECORD, press the MIN MAX pushbutton for
2 seconds.
We can use this Meter to analyze components such as
power distribution transformers and power factor correction
capacitors.
6.2 General Applications
You can measure any conductor carrying AC unless this
conductor is at a potential above 600V AC or at a
frequency above 10KHz. True rms measurement yields the
effective current value.
1. Press the ON OFF pushbutton to turn on this Meter.
2. Clamp around the conductor to be measured. Be sure
the clamp jaws are securely closed, or measurements
will not be accurate.
3. Observe the display for true rms current flow.
4. Press the Hz pushbutton to measure frequency.
5. Press the HOLD pushbutton to freeze the digital
display, if necessary.
22
23
6.3 Motors
You can measure starting (inrush) current, running current,
and current imbalance. Inrush current is typically 6 times
the value of running current, depending on the motor type.
1. Press the ON OFF pushbutton to turn on this Meter.
7. Turn on the motor. When the motor gets to the desired
speed, note the blinking upper bar on the bar graph
(inrush rms current), and the displayed level (running
rms current).
8. To view the maximum inrush current, press the MIN
MAX pushbutton once.
2. Clamp around a motor phase conductor. Be sure the
clamp jaws are securely closed, or measurements will
not be accurate.
9. Repeat step 6, if necessary.
3. While watching the bar graph, turn on the motor and
observe the level of inrush current. In this case, the bar
graph is better than the digital display because the bar
graph response is faster than the digital display.
6.4 Distribution Transformers
10. To clear RECORD, press the MIN MAX pushbutton for
2 seconds.
You can measure excessive current, load balance between
phases, true-rms and frequency of neutral current. Truerms measurement yields the effective value.
1. Press the ON OFF pushbutton to turn on this Meter.
2. Clamp around a phase wire of the transformer. Be sure
the clamp jaws are securely closed, of measurements
will not be accurate.
3. Observe the display for true-rms current flow.
4. Repeat your measurement for each phase to observe
balance. Unbalanced phases cause large neutral
currents flow.
5. Clamp around the neutral wire.
4. When the motor reaches the desired speed, observe
the running current.
5. Repeat your measurement for each motor phases.
Unbalanced current may be caused by a voltage
imbalance, or a shorted motor winding.
6. Repeat steps 1 thru 3, then press the MIN MAX
pushbutton to enable RECORD.
24
6. Observe the display for true-rms current flow. Any
significant flow, with balanced phases, indicates the
presence of harmonic currents.
7. Press the Hz pushbutton to measure the frequency of
neutral wire. Reading indicates the frequency of the
dominant current flow (in case of harmonic current
flow, 180Hz reading in a 60Hz system).
8. To freeze the digital display, press the HOLD
pushbutton.
9. To measure peak amperes, press the 1mS PEAK
pushbutton (PEAK displayed).
25
10. To record readings and to view maximum, minimum,
and average values, press the MIN MAX pushbutton.
11. To clear RECORD, press the MIN MAX pushbutton for
2 seconds.
5. To record readings and to view readings, press the
MIN MAX pushbutton.
6. To clear RECORD, press the MIN MAX pushbutton for
2 seconds.
6.5 Adjustable Speed Motor Controllers
You can measure input current, output current and
frequency of the adjustable speed motor controllers. The
output current frequency is used to calculate the rotating
speed of the motor, while input current frequency is used to
measure the frequency of the power line. The frequency of
the output current is important because the voltage
frequency is often meaningless for the calculations of
motor controller speed.
1. Press the ON OFF pushbutton to turn on this Meter.
2. Clamp around an input or output phase (as required),
and run motor at desired speed. Be sure the clamp
jaws are securely closed, or measurements will not be
accurate.
3. Observe the display for true-rms current flow.
4. Measure an output phase of the motor controller and
use Hz mode to measure frequency. Nominal motor
speed is calculated from RPM = 120F/P, where F is
the frequency measured, and P is the number of motor
poles.
26
7. Maintenance and Calibration
7.1 Maintenance
Repairs or servicing should only be performed by qualified
personnel.
WARNING!
TO AVOID ELECTRIC SHOCK, DO NOT PERFORM ANY
SERVICING PROCEDURE UNLESS YOU ARE
QUALIFIED TO DO SO. READ “CLAMP-ON METER
SAFETY” AT THE BEGINNING OF THIS MANUAL
BEFORE PROCEEDING.
To assure continued safety of this Meter, inspect this Meter
before use for cracks or missing portions of the insulating
cover, or for loose or weakened components. Pay
particular attention to the insulation surrounding the clamp
jaws and clamp lever. Any Meter that fails this inspection
should be made inoperative by taping the clamp shut.
27
Periodically wipe the case with a damp cloth and detergent;
do not use abrasives or solvents. Open the clamp jaws and
wipe the magnetic pole pieces with a lightly oiled cloth. Do
not allow rust or corrosion to form on the pole pieces.
7.3 Calibration
This Meter should be calibrated annually. Regarding the
service/calibration information on this Meter, contact the
nearest distributor of this Meter.
The serial number is stamped on the back of the unit. The
serial number should be used when ordering parts or
requesting service/calibration information.
7.2 Replaceable Parts
WHEN SERVICING THIS METER, USE ONLY THE
REPLACEMENT PARTS SPECIFIED.
Replaceable parts are shown in Figure 3 and listed in
Table 2.
Table 2. Replaceable Parts
ITEM
1
2
3
4
5
6
7
DESCRIPTION
PART
NUMBER
Q’TY
Lens, LCD
Cover, Rear
Screw, Case (metric)
Battery, 9V
User’s Manual
Clip-on Holster
Test Lead Set
CL2 LENS
CL2 CASE
CL2 SCRW
CL1 BT09
CL3 MAN
C130
TL34
1
1
2
1
1
1
1
Figure 3. Replaceable Parts
28
29
8. Technical Data and Specifications
AC Current
RMS AMPERES
8.1 Technical Data
RANGE
Display: Digital – 4000 counts (33/4 digits)
[Hz: 9999 counts], updates 4 times/sec.
Analog – Updates 20 times/sec, 41 segment bar
graph.
Maximum Conductor Size: ø 51mm (2.00”)
Maximum Jaw Opening: 52mm (2.04”)
Max. Conductor Voltage: 600V rms
Frequency Range: Current Measurement – 10Hz to 2KHz
Frequency Measurement – 0.5Hz to
10KHz
Crest Factor, Continuous Waveform: (45Hz to 65Hz, less
than 1000A peak)
1.4 to 2.0 add 20 digits to accuracy below 100A
2.0 to 3.0 add 1% to accuracy ( + 20 digits below 100A)
3.0 to 5.0 add 2% to accuracy ( + 20 digits below 100A)
Adjacent Conductor Effect: 1% of current in adjacent
conductor max.
Operating Temperature: – 10°C to 55°C
Operating Humidity: 0% to 80% @ 40°C, 70% @ 50°C
Storage Temperature: – 20°C to 60°C
Standard Equipment: Clamp-on Meter, Clip-on Holster,
Test-leads, User’s manual,
and 9V battery (installed)
Battery Type: NEDA 1604A 9V or 6LF22 9V
Battery Life: 80 hours typical (alkaline)
Safety Standards: UL 1244, IEC 348/1010, IEC 664
(Appropriate Parts)
Installation Category Ill, CSA C22.2 No.
231, ANSI/ISA S82, VDE 0411
Weight: Approx. 1.21 lb (545g)
Size: 4.39cm H x 9.75cm W x 24.5cm L
(1.73”H x 3.84”W x 9.65”L)
*
1
0.30 to 39.99A
(40A Scale)
0.01A
± (3% + 20 dgts)
± (4% + 30 dgts)
± (4% + 30 dgts)
± (8% + 30 dgts)
45Hz – 65Hz
30Hz – 45Hz *3
65Hz – 1KHz
20Hz – 30Hz *4
0.3 to 399.9A
(400A Scale)
0.1A
± (3% + 2 dgts)
± (4% + 3 dgts)
± (4% + 3 dgts)
± (8% + 3 dgts)
45Hz – 65Hz
30Hz – 45Hz *3
65Hz – 1KHz
20Hz – 30Hz *4
400 to 700A
(400A Scale)
1A
± 5%
± 7%
± 7%
Not Specified
45Hz – 65Hz
30Hz – 45Hz *3
65Hz – 1KHz
20Hz – 30Hz *4
* 1.
Sine Wave, measured with conductor centered at alignment marks and battery life indication
greater than 40 hours on meter power up.
RMS Min/Max: ADD 10 counts
* 3 . 1A and above, 30Hz – 45Hz
* 4 . AVG only, 2.5A and above
RMS Min/Max: Add 2% of reading
* 2.
INSTANTANEOUS AMPERES (CREST MODE)
RANGE
RESOLUTION
**
**1
ACCURACY
0.4 to 39.99A
(40A Scale)
0.2A
± (3% + 30 dgts)
± (4% + 30 dgts)
± (4% + 30 dgts)
± (4% + 40 dgts)
45Hz – 65Hz
30Hz – 45Hz**2
65Hz – 1KHz
20Hz – 30Hz**3
0.4 to 399.9A
(400A Scale)
2A
± (3% + 3 dgts)
± (4% + 3 dgts)
± (4% + 3 dgts)
± (4% + 4 dgts)
45Hz – 65Hz
30Hz – 45Hz**2
65Hz – 1KHz
20Hz – 30Hz**3
400 to 599A
(400A Scale)
4A
± 3%
± 4%
± 4%
± 4%
45Hz – 65Hz
30Hz – 45Hz**2
65Hz – 1KHz
20Hz – 30Hz**3
600 to 999A
(400A Scale)
4A
± 7%
± 7%
± 7%
± 7%
45Hz – 65Hz
30Hz – 45Hz**2
65Hz – 1KHz
20Hz – 30Hz**3
8.2 Specifications
Accuracy is given as ± ([% of reading] + [number of least
significant digits]) at 18°C to 28°C with relative humidity up
to 80%, for a period of one year after calibration.
30
ACCURACY *2
RESOLUTION
1. Same as * 1
**
2. Same as * 3
** 3.
2.5A and above
31
Resistance
FREQUENCY
** * 1
RANGE
***
RESOLUTION
RANGE
RESOLUTION
ACCURACY
ACCURACY
0 to 399.9Ω
0.1Ω
±(1.0% + 10)
0 to 3.999KΩ
0.5 to 999.9 Hz
0.1 Hz
±(0.2% + 3 dgts)
1000 to 9999 Hz
1 Hz
±(0.2% + 3 dgts)
1Ω
±(1.0% + 3)
Continuity Check
1. Same as *1
RANGE
With current autorange: Trigger Level, 5 Hz to 1500 Hz,
0.7A RMS or more, 1/2 peak
current
With manual ranging: Trigger Threshold, 10 Hz to 1000Hz
40A Range – 6A RMS or more will
trigger.
400A Range – 40A RMS or more
will trigger.
400Ω
CONTINUITY BEEPER
Approx. <35Ω
DC Current
RANGE
RESOLUTION
0.30 to 39.99A
0.01A
0.3 to 399.9A
0.1A
400 to 700A
ACCURACY
±(2% + 30 dgts)
±(2% + 10 dgts)
1A
AC Voltage (True-RMS)/DC Voltage
RANGE
RESOLUTION
ACCURACY
AC VOLTAGE
45Hz to 65Hz 45Hz to 1KHz
0 to 39.99V
0.01V
0 to 399.9V
0.1V
0 to 750V
1V
±(1.0% + 3)
±(2.5% + 5)
DC VOLTAGE
±(1.0% + 3)
±(1.5% + 5)
±(1.5% + 5)
AC Voltage
Common Mode Rejection Ratio: > 80dB, dc to 60Hz
DC Voltage
Normal Mode Rejection Ratio: > 11dB at 50Hz or 60Hz
Common Mode Rejection Ratio: > 84dB at dc ,
50Hz or 60Hz
32
33