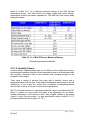
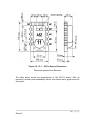
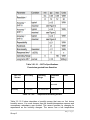
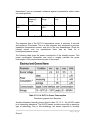
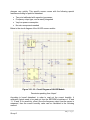
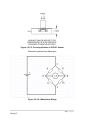
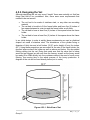
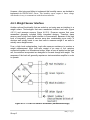
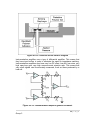
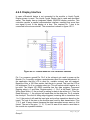
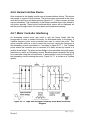
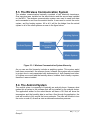
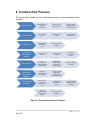
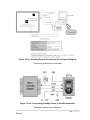
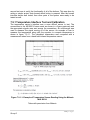
1
Table of Contents 1. Executive Summary .......................................................................................... 1 2. Project Description ........................................................................................... 3 2.1. Motivation ................................................................................................... 3 2.2. Goal & Objectives....................................................................................... 4 2.3. Requirements & Specifications................................................................... 4 2.3.1. General Requirements ......................................................................... 4 2.3.2. Mechanical Requirements .................................................................... 5 2.3.3. Heating System Requirements ............................................................ 5 2.3.4. Wireless Communication Requirements .............................................. 5 3. Research .......................................................................................................... 6 3.1. Existing Similar Projects and Products ....................................................... 6 3.1.1. Other Extractors ................................................................................... 6 3.2. Relevant Technologies ............................................................................... 9 3.2.1. Temperature/Humidity Sensors ........................................................... 9 3.2.2. Weight Sensor ................................................................................... 19 3.2.3 Valve ................................................................................................... 27 3.2.4 Wireless Communication Technologies .............................................. 28 3.2.5 Bluetooth Module ................................................................................ 30 3.2.6 Display ................................................................................................ 33 3.2.7. Micro controller Decision .................................................................... 33 3.3 Operation of Classical Honey Extractor ..................................................... 37 3.3.1 Operation of Our Honey Extractor ....................................................... 39 3.3.2 Dangers of Honey Extraction .............................................................. 40 4. Project Hardware and Software Design .......................................................... 42 4.1 Hardware Block Diagram .......................................................................... 42 4.2 Software Activity Diagram ......................................................................... 43 4.2.1 Software Development Tools .............................................................. 44 4.2.2 Software System Requirements .......................................................... 44 4.2.3 Android Application Development ....................................................... 44 4.3. Configuring and Pairing the Bluetooth ...................................................... 49 4.3.1 Integrating the Bluetooth into Circuit ................................................... 52 4.4. Heating System ........................................................................................ 54 i|Page Group 3 4.4.1. Coil Heating & Heating Plates............................................................ 55 4.4.2. Flexible Heating Elements ................................................................. 56 4.4.3. Implementing the Temperature Sensor ............................................. 57 4.4.4. Powering the Heating System ............................................................ 59 4.5. Designing the Mechanical Components ................................................... 59 4.5.1. Designing the Frame Holder .............................................................. 59 4.5.2. Designing the Vat .............................................................................. 63 4.6. Sensor / Driver Interface .......................................................................... 64 4.6.1. Temperature sensor interface ............................................................ 64 4.6.2. Humidity sensor interface: ................................................................. 66 4.6.3. Weight Sensor Interface .................................................................... 68 4.6.4. Bluetooth Interface (Android Interface) .............................................. 70 4.6.5. Display Interface ................................................................................ 71 4.6.6. Human Interface Device .................................................................... 72 4.6.7. Motor Controller Interfacing ............................................................... 72 4.7 The Motor.................................................................................................. 73 4.7.1 Mounting the Motor ............................................................................. 74 4.8. Weight Sensor Implementation Options ................................................... 76 4.9. Printed Circuit board (PCB)...................................................................... 77 4.9.1. Circuit Board Design .......................................................................... 78 4.9.2. Fabrication ............................................ Error! Bookmark not defined. 4.10 Powering the Extractor ............................................................................ 79 4.11. Emergency Stop Design ........................................................................ 79 4.12. Procedure for Presentation .................................................................... 81 5. Design Summary ............................................................................................ 83 5.1. The Motor System .................................................................................... 83 5.2. The Heating System................................................................................. 84 5.3. The Wireless Communication System ..................................................... 85 5.4. The Android System................................................................................. 85 5.5. The Weighing System (Optional) ............................................................. 86 6. Construction Process ..................................................................................... 87 7. Project Prototype Testing ............................................................................... 88 7.1. Hardware Test Environment .................................................................... 88 7.2.1 Bluetooth Data Transfer to Android .................................................... 88 ii | P a g e Group 3 7.2.2 Data Transfer between Android and Development Board over Bluetooth Preliminary Testing ...................................................................... 89 7.3 Android Application Software Testing........................................................ 90 7.4. Testing the Motor ..................................................................................... 96 7.4.1 Initial Testing ....................................................................................... 96 7.4.2 Intermediate Testing ........................................................................... 96 7.4.3 Final Testing ....................................................................................... 96 7.5. Testing the Heating System ..................................................................... 96 7.5.1 Testing the Heating Element ............................................................... 96 7.5.2 Testing the Entire Heating System ...................................................... 97 7.6. Testing the Sensors ................................................................................. 97 7.6.1. General Sensor Testing Ideology ....................................................... 97 7.6.2. Weight Sensor Test............................................................................ 99 7.6.3. Temperature Sensor Test ................................................................ 102 7.6.4. Humidity Sensor Test ....................................................................... 104 7.7. Circuit board testing ............................................................................... 109 7.8. Micro Controller Testing ......................................................................... 110 7.9. Human Interface Device Testing ............................................................ 111 7.9.1 Temperature Interface Test and Calibration ...................................... 112 7.9.2 Humidity Interface Test and Calibration ............................................ 113 7.9.3 Weight Sensor Interface Testing ....................................................... 113 7.9.4. Motor Controller Interface Testing .................................................... 114 7.9.5. Bluetooth Interface Testing .............................................................. 114 7.10. Emergency STOP Testing .................................................................... 116 8. Administrative Content ................................................................................. 116 8.1 Project Milestones ................................................................................... 116 8.2 Budget & Financing ................................................................................. 119 8.2.1. Expected Costs ................................................................................ 119 8.2.2 Financing .......................................................................................... 119 8.3 Advisors .................................................................................................. 120 8.4 Facilities and Equipment ......................................................................... 121 Appendix A: References ....................................................................................... A A-1. Works Cited ............................................................................................... A A-2. Email Requests.......................................................................................... B A-3. Email Permissions: .................................................................................... E iii | P a g e Group 3 iv | P a g e Group 3 1. Executive Summary Automated honey extractors along with many other automated equipment necessary for the honey extraction processes are popular among big honey extraction industries. In fact, no big industry will be able to exist without automated equipment in order to extract big amounts of honey in a short period of time. Among beekeepers who do not own big businesses or industries, automated honey extraction equipment is not so popular due to high costs. The main idea of this honey extractor was to make it automated and available (in terms of cost) to the beekeepers who practice beekeeping not necessary for business purposes. Once the start button is pushed, the honey extractor spins the motor and based on the previously calculated optimal time stops the motor (which is at a point of time when the honeycomb frames do not lose mass anymore). Besides just being an automated extractor it also has many other useful and unique features to enhance its usefulness. The main feature of the automated honey extractor is that it has a controllable electric motor which spins the honeycomb frames with honey inside of a container and extracts the honey to the walls of the barrel (the same principle is used in a centrifuge). The honey then flows down the walls to the valve where it will be collected. Once the beekeeper gets the honeycomb frames ready or prepared for the extraction process through a process of uncapping, they are ready to be loaded into the automated honey extractor (this extractor has a capacity of up to fifteen frames). Once the frames are loaded into the apparatus, the beekeeper or the operator of the machine is presented with two ways of controlling the machine. One option is the on board analog buttons and switches; the other option is wirelessly through an android device. The convenience of operating the machine wirelessly through an android device comes with an additional advantage such as on screen statistical information about the extraction process, for example, the current temperature inside the apparatus and the humidity level. The same information can be found in the analog interface, however the menu has to be switched. As already may be assumed from the information of the above paragraph, the automated honey extractor comes with two sensors on board, these are – a temperature sensor and a humidity sensor. Each of the sensors will provide a valuable piece of information to the beekeeper or the person who will operate the machine. The temperature sensor is used for the heating mechanism built into the extractor and for the user who chooses the temperature he or she wants the extraction process to be at. The purpose of the heating mechanism is to speed up the whole extraction process. The more the honey is heated the less viscous it becomes which speeds up the flow of the honey out of the container down 1|Page Group 3 through the valve. Also, in order not to damage the honey, the temperature cannot exceed certain value for certain types of honey. Thus, giving the option to the user to set a certain temperature limit and be able to monitor the temperature is a neat and useful feature which helps speed up the process. The humidity sensor is used to provide a valuable piece of information to the user about the humidity levels. During the extraction period, the humidity levels directly affect the water content in honey. As a general rule of thumb for beekeepers, the more there is water content in the honey the worse its quality is considered to be. In order not to exceed a certain percentage of water content in the product, the beekeeper must know the humidity levels of the surrounding environment. Summarizing all the points and features of this equipment, the automated honey extractor is an extractor, first of all, with low cost, which makes it available to small honey extraction industries and, most importantly, to nonprofit seeking beekeepers. Second of all, it is automated and requires minimal input form the user – the loading of the frames and pushing the start button. Finally, the extractor provides the user with a handful of features such as indirect temperature control and monitoring, humidity monitoring, wireless and on board control over the motor and real-time feedback on the android device. 2|Page Group 3 2. Project Description 2.1. Motivation Although honeybees are worth billions of dollars to farmers just in the United States, very few people other than them realize the importance of the beekeepers and their bees. The reason why they are so important is because the bees in the process of making honey have to collect nectar from trees and flowers. While collecting nectar, the bees also cross-pollinate the plants that they collect from, which in turn produce fruits and seeds. For this very reason farmers even rent bees from beekeepers. However, regardless of the importance of beekeeping, it is becoming less and less popular, especially in the United States. There are several reasons why the number of beekeepers started to dwindle. It is no secret that beekeeping has never been easy, however with the arrival of tracheal mites in the 1980s and varroa mites and small hive beetles in the 1990s (all of which are pests that invade hives and hinder beekeepers) keeping bees has become much more challenging for beekeepers. However these pests were not the only thing that the beekeepers had to face. Another thing that the beekeepers had to face was high prices for the machinery that they needed in order to operate their business. With these problems the number of beekeepers stated to slowly become smaller and smaller, until the only people that still kept bees are the ones that were ready to invest large amounts of money into their business or the ones that were ready to spend enormous amounts of time tending to their bees. Our senior design group decided to address this problem, and as engineers we cannot help with reducing the pests since we lack the proper education, but what we could do in order to make the work of the beekeepers easier, was build a device that will somehow aid their struggle. After doing some research, the most useful device that we could build is a honey extractor since extracting honey is probably the most troublesome part in the honey production, and for this reason over the years beekeepers came up with numerous methods of extracting honey from the wax frames, starting with the aged method of just letting gravity do its work of draining the honey from the frame, to the more modern methods which involve fairly expensive machinery. And as in any other industry, the more advanced the machinery, the more money it costs. However as most people cannot afford a device that costs several thousand dollars, the market was in need of a device that will do the same thing but costs at most several hundred dollars. Therefore our senior design group decided to build a honey extractor that will have the functions of a high-end commercial extractor and maybe even some new functions that have never been seen before in a honey extractor, and yet be at the price of the lower-end extractors. We hope that with the introduction of this device, the number of hobbyist beekeepers will rise, and beekeeping will become a little more popular. 3|Page Group 3 2.2. Goal & Objectives The goal of this senior design project was to create a as low-cost as possible automated honey extractor that is fast and easy to use, which should help beekeepers to extract honey without too much trouble. The purpose of creating such a device was because it would help decrease the costs of maintaining a bee farm and at the same time increase the profits of the beekeepers and ultimately increase the number of hobbyist beekeepers and small-scale beekeeping. The objective of the Automated Honey Extractor in its simplest form is to extract the honey from the wax frames. However the entire process, other than the loading of the frames into the device and then removing them after the process is complete, was to be autonomous. After the frames are loaded into the honey extractor and the start sequence is activated, the honey extractor should do the rest of the work automatically. It should use the centrifugal force to remove the honey from the wax frames with minimal damage done to the frames. This should decrease the effort put in by the beekeepers in the honey extraction process and give them time for other things that need to be taken care of in their business. 2.3. Requirements & Specifications In this section all of the project‘s requirements and specifications will be listed. To simplify this section, the project requirements and specifications will be split into several categories. The categories are: General Requirements (Table 2.3.1), Mechanical Requirements (Table 2.3.2), Heating System Requirements (Table 2.3.3) and Wireless Communication Requirements (Table 2.3.4). 2.3.1. General Requirements Requirement AHE-GR01 AHE-GR02 AHE-GR03 AHE-GR04 AHE-GR05 AHE-GR06 AHE-GR07 AHE-GR08 AHE-GR09 AHE-GR10 AHE-GR11* Description The extractor shall extract honey The extractor shall have a heating system. The extractor shall have an onboard controller The extractor shall be able to be operated wirelessly The extractor shall be powered by a standard wall outlet(s) The extractor shall be ―User Friendly‖ The extractor shall have a stainless steel vat The extractor shall have a humidity sensor The extractor shall not damage the wax frames too much The extractor shall cost no more than $1000 The extractor shall have a weight sensor Table 2.3.1: General Requirements *Optional, Not Required 4|Page Group 3 2.3.2. Mechanical Requirements Requirement AHE-MR01 AHE-MR02 AHE-MR03 AHE-MR04 AHE-MR05 AHE-MR06 AHE-MR07 AHE-MR08* Description The extractor shall support at least eight (8) frames The extractor shall have a vat of at least ten (10) gallons The extractor shall be driven by an electric motor The extractor shall have a radial design The extractor shall have a valve The extractor shall use centrifugal force to extract honey The extractor shall have a emergency stop button The extractor shall have a basic filter for the honey Table 2.3.2: Mechanical Requirements *Optional, Not Required 2.3.3. Heating System Requirements Requirement Description AHE-HSR01 The heating system shall heat up the honey to no more than forty (40) degrees Celsius AHE-HSR02 The heating system shall have a temperature sensor AHE-HSR03 The system shall adjust the temperature based on data from sensor AHE-HSR04 The temperature will be displayed on the android device in real time AHE-HSR05 The heating system shall not use more than 500W of power to heat up the heating element AHE-HSR06 The temperature sensor will have the range of at least twenty degrees Celsius to fifty degrees Celsius Table 2.3.3: Heating System Requirements 2.3.4. Wireless Communication Requirements Requirement Description AHE-WCR01 The extractor shall be able to be operated wirelessly from a distance of at least five (5) feet AHE-WCR02 The extractor shall use Bluetooth. AHE-WCR03 The extractor shall be able to be operated using an android device wirelessly AHE-WCR04 Data from the humidity sensor shall be displayed on the android device Table 2.3.4: Wireless Communication Requirements 5|Page Group 3 3. Research 3.1. Existing Similar Projects and Products 3.1.1. Other Extractors From the countless senior design projects we could not even find one project that tried to build a similar device. However even though there were no similar projects, there are many different extractors on the market that in principle are the same. In general there are two types of extractors that dominate the market, the tangential type (see figure 3.1.1.1), and the radial type (see figure 3.1.1.2). And since we did not want to ―reinvent the wheel‖ we were going to stick with one of them. 3.1.1.1. Tangential Extractors What makes an extractor ―tangential‖ is the positioning of the frames inside the extractor. If the frames are organized similarly to what we see in the figure below, it is considered to be a tangential extractor since the frames are ―tangent‖ to the circular shape of the centrifuge. Due to the positioning of the frames in such a manner, a problem occurs, that problem is the fact that the frames need to be flipped in order to get all of the honey from the frame. While this type of extractor is fairly common and effective in the amateur beekeeping world, it is very impractical when the number of frames that need to be extracted exceeds foursix at a time. When we were designing our extractor our initial idea was to make it tangential, however after some research we decided that a radial extractor is more suited for our objectives. Figure 3.1.1.1 Tangential Extractor Top view 6|Page Group 3 3.1.1.2. Radial Extractors The second major type of extractors is the radial extractor. In the radial extractor, unlike the tangential extractor, the frames are positioned ―radially‖ which means that one edge of the frame is facing the center of the centrifuge, while the second edge is facing the edge of the circle, just like the radius of the circle. At first glance this type of positioning does not make sense because one would assume that it would be difficult for the honey to be extracted, however what makes this type of extractor work is the natural shape of the honeycomb in the frames. The honeycomb because of gravity is tilted. This design uses that tilt to the fullest. By placing the frame with the honeycomb tilt facing the outer edge ensures the easy extraction of the honey from that frame, without much damage to the honeycomb. And due to that placement of the frames, the frames do not need to be flipped in order to extract the honey, which saves a lot of time, especially if this is done on a commercial scale where the number of frame extracted exceeds hundreds. Another advantage that this frame placement has is that it takes up much less space compared to the tangential type, which makes it even more appealing to the beekeepers that have a large quantity of frames. For this very reason, our group decided that this type of extractor is more suited for our goals. However event though our extractor‘s basic layout will be the same, our extractor will have numerous features that other extractors do not. Figure 3.1.1.2 Basic Radial Extractor 7|Page Group 3 3.1.1.3. Other Extractor Features Since our extractor is almost identical in its core with other extractors, our extractor needed to have something that will set it apart from the rest. But to do that we needed to first find out what the others had. Extractors exceeding the price tag of one thousand dollars usually have the following features: They are motor driven Can hold anywhere from eight to twenty frames Made of stainless steel Some have speed control Anything beyond that is very rare. Our extractor has all of these features, as well as many other ones. A schematic of a lower end honey extractor can be found below. Figure 3.1.1.3.1: Figure of Lower End Honey Extractor 8|Page Group 3 3.2. Relevant Technologies 3.2.1. Temperature/Humidity Sensors Monitoring temperature and humidity is essential for the quality of honey the honey extractor will produce. Controlling the temperature and measuring it throughout the process of extracting honey will contribute to a better flow of the honey from the walls or the frame of the extractor down to the valve where it will be collected in special containers. Overall, controlling the temperature will contribute to the efficiency of the apparatus. Temperature sensor will provide essential data to the heating mechanism. The heating mechanism cannot exceed a set temperature as that will have a negative effect on the quality of the honey. Overheating will result in quality loss of the honey (this includes caramelization, fresh flavor loss etc.) [3]. Enzyme destruction occurs when honey is overheated. Overheating the honey is practiced by many manufacturers because it makes the honey stay clear instead of cloudy, and it also prevents it from caramelization. Some industries go for cosmetic looks instead of quality. Many of the good properties are lost with overheating; this is why a temperature sensor was so important in this project since quality is our priority concern. Fermented honey is often also reclaimed by heating it to 150 degrees Fahrenheit. This process may destroy enzymes as well. In the table 3.2.1.1 below the safe temperatures and heating time is outlined [3]. Temperature F Heating Time (Minutes) 128 470 130 170 135 60 140 42 145 7.5 150 2.8 155 1.0 160 0.4 Table 3.2.1.1: Honey Pasteurization Treatments Humidity is another key factor that determines the quality of the honey. Honey has a tendency to absorb water from the air. The higher the humidity during the extraction process the more water content the honey will contain. Honey with high amount of water content negatively affects the quality, as it allows for the fermentation to occur. The water content in honey ranges anywhere from thirteen (13) to twenty five (25) percent. Honey with over nineteen (19) percent water will ferment and with seventeen (17) percent and less will not ferment if kept in proper temperature [3]. The humidity sensor provides the operator essential data which will determine whether it is ―safe‖ to begin extraction or not. In a case with 9|Page Group 3 high humidity which will result in water content of over nineteen (19) percent the extraction process should be delayed until the humidity drops into safe levels or the humidity should be forcefully lowered by using a dehumidifier. Figure 3.2.1.1 - Temperature/Humidity Sensor diagram 3.2.1.1 Temperature Sensor The infrared temperature sensor comes with a handful of other useful features that make it easier to integrate into our design from an electrical perspective; the pins of the sensor are shown in figure 3.2.1.1.1. The following table shows some of the features of the infrared temperature sensor that stand out the most, one should note that even with features such as these, the sensor does not exceed the price range allowed by our sponsor: 10 | P a g e Group 3 Features and benefits Small size Low cost Easy to integrate Factory calibrated in wide temperature range: o -40…..+125 degrees C for sensor temperature and o -70…..+380 degrees C for object temperature. High accuracy of 0.5 degrees C over wide temperature range (0….+50 degrees C for both Ta and To) Hugh (medical) accuracy calibration Measurement resolution of 0.02 degrees C Single and dual zone versions SMBus compatible digital interface Customizable PWM output for continuous reading Available in 3V and 5V versions Simple adaptation for 8….16 applications Sleep mode for reduced power consumption Different package options for applications and measurement versatility Automotive grade Table 3.2.1.1.1: IR Temperature Sensor Advantages Despite all other advantages discussed before, this sensor has many other features. The only disadvantage over the other sensors is that the spinning frame holders might hinder its accuracy. Out of the three options we considered the latter two, first we were going to try the infrared sensor if that were to give us complications and if it did not perform as expected we would have implement the second option. Product Number TMP100 TMP101 480-3161-ND DS18S20 LM335 Manufacturer Temp Range/Accuracy TI -55~125C/+-2C TI -55~125C/+-2C Honeywell Sensing -60~150C/+-1.3% and Control Maxim Integrated -55~100C/+-0.5C TI -40~100°C/+-6C Cost $0.75 $0.75 $4.74 $4.00 $1.35 Table 3.2.1.1.2 - Temperature Sensor Comparison 11 | P a g e Group 3 There are many types of temperature sensors that could have been implemented in our project. For the purposes of the honey extractor, the temperature sensor did not need to be a high performance and very accurate sensor, in fact, all of the sensors in the comparison table have a very good accuracy and satisfied the requirements. As seen from table 3.2.1.1.2 above, all of those sensors have satisfactory specifications. The cost is not an issue since we did not need many sensors for the project. The ease of communication between the sensor and the microcontroller unit was to be the key factor in choosing which sensor to go with if the decision was made to avoid the infrared temperature sensor. The 192-302LET-A01 is actually a thermistor, but using it as a temperature sensor is very common. This sensor has only two outputs or pins which is an advantage over the other sensors. The complicated part about this sensor is translating the output to the measured temperature. But since it is a very common sensor and is easily integrated with the microcontroller, many resources are available on how to do this part. LM335, TMP100 and TMP101 all come with wide temperature ranges, satisfactory accuracy, voltage inputs and costs. All of them are analog and would have required an analog to digital converter part, if it is not supported by the microcontroller. They all would have had to be sealed to avoid contact with the honey which will eventually destroy the sensor. They were all good options with good functionality, specifications and options. If the infrared sensor had not me\et our expectations we would have gone for the 192-302LET-A01 thermistor, which is very cheap and very small, has only two pins which is very beneficial in our project design. However, the infrared sensor satisfied our needs. Product Input Voltage Temp Range Response Time Cost IRTEMP 3 to 5V 15~35C 1 second $34.95 MLX90614 8 to 16 V -40~85C ----- $12.49 OS211 6 to 24 V -20~500C 240ms $196.00 Table 3.2.1.1.2: Infrared Temperature Sensor Comparison Research and comparison led to a conclusion to choose the MLX90614 infrared temperature sensor as a first option. Below in the figure 3.2.1.1.1 are the pins of the sensor. Table 3.2.1.1.3 describes the function of each pin. This table along with the figure was very helpful later on in the testing section of the temperature sensor. 12 | P a g e Group 3 Figure 3.2.1.1.1 – IR Temperature Sensor Pins Permission granted from Melexis Pin Name SCL / Vz Description Serial clock input for 2 wire communications protocol. 5.7V zener is available at this pin for connection of external bipolar transistor to MLX90614Axx to supply the device from external 8 …16V source. SDA / PWM Digital input / output. In normal mode the measured object temperature is available at this pin Pulse Width Modulated. In SMBus compatible mode the pin is automatically configured as open drain NMOS. VDD VSS External supply voltage. Ground. The metal can is also connected to this pin. Table 3.2.1.1.3 – Pin Description Permission granted from Melexis 13 | P a g e Group 3 Below is a table 3.2.1.1.4 of absolute maximum ratings of the MLX infrared temperature sensor. This table shows the voltage supply and current ratings, temperature at which the sensor operates etc. The table will come handy when testing the sensor. Table 3.2.1.1.4: MLX IR Sensor Maximum Ratings Permission granted from Melexis 3.2.1.2. Humidity Sensor Humidity sensor implementation was not as difficult as the temperature sensor implementation because humidity did not necessarily have to be measured inside the container. Anywhere close to the container was accurate enough for the purposes of this project. There were a variety of sensors that come with a humidity sensor and a temperature sensor as one part. If the infrared temperature sensor were to not be satisfactory in our project we would have considered humidity/temperature sensors that come as a one part to avoid extra complications. SHT1x is the part number of a temperature/humidity sensor manufactured by DF Robot. It comes as a very small unit which is an advantage for our needs. Another advantage of this sensor is that it has a digital instead of an analog output. It is also very low power. For part specifications refer to table 3.2.1.2.1 and part dimensions refer to figure 3.2.1.2.1. 14 | P a g e Group 3 Figure 3.2.1.2.1: – SHT1x Sensor Dimensions Permission granted from Sensirion The table below shows the specifications of the SHT1x sensor. With its resolution, accuracy and repeatability values, this sensor was a good choice for the project. 15 | P a g e Group 3 Table 3.2.1.2.1 – SHT1x Specifications Permission granted from Sensirion SHT110 Sensor Accuracy Operating Range Response Time Temperature +-0.5C -40 to 123.8C 5 to seconds Humidity +-2% RH 0 to 100% RH 8 seconds Cost 30 $24.00 ------------- Table 3.2.1.2.2: – Temperature/Humidity Sensor Table 3.2.1.2.3 below describes a humidity sensor that was our first choice humidity sensor. It is much cheaper than the humidity/temperature sensors and unnecessary redundancy was avoided. This sensor operates by changing its capacitance as the humidity changes. The sensor has a low temperature 16 | P a g e Group 3 dependence, has an increased resistance against contamination which suited our needs perfectly. Part Number Operating frequency range Operating Range Response Time HCH-1000002 1 – 100 kHz 10 %RH to 95 15 seconds %RH $4.32 HH10D 5 – 10kHz 0 to 100 RH $9.95 8 seconds Cost Table 3.2.1.2.3: Humidity Sensor The response time of the SHT11x temperature sensor is minimum 5 seconds and maximum 30 seconds. This is a slow response time compared to previous standalone temperature sensors, and this is the only disadvantage. Since the infrared sensor met our expectations there was no need for a humidity/temperature sensor. The following table gives the power consumption of the humidity sensor. This power consumption information was used to roughly calculate the power consumption of the whole electronics part of the project. Table 3.2.1.2.4: SHT11x Power Consumption Permission granted from Sensirion Another alternative humidity sensor listed in table 3.2.1.2.3 – the HH10D model is an interesting alternative. The HH10D sensor module comes with a capacitive type of technology. Due to this technology, the sensor responds to humidity 17 | P a g e Group 3 changes very quickly. This specific sensor comes with the following special features according to sparkfun datasheet: Two point calibrated with capacitor type sensor Frequency output type, can be easily integrated Very low power consumption No extra components needed Below is the circuit diagram of the HH10D sensor module. Figure 3.2.1.2.2: Circuit Diagram of HH10D Module Permission pending from Hoperf According to hoperf datasheet, in order to read out the correct humidity, 4 calibration factors need to be read out from the EEPROM at address of 10 and 11, 12 and 13 for sensitivity, offset. Once the frequency output from the sensor is measured, then the correct humidity value can be calculated in the following method: 18 | P a g e Group 3 Table 3.2.1.2.5: Calculation of Humidity Permission pending from Hoperf Figure 3.2.1.2.3: Application Circuit Permission pending from Hoperf After trying to implement our first choice humidity sensor and failing to implementing it, the HIH-4030-003 sensor was chosen and was implemented along with other electronics on top of the extractor. This humidity sensor is widely used because of its cost and ease of integration. It outputs a linear voltage which made it easy to communicate with the microcontroller, the voltage supply needed was variable anywhere between 4 and 5.8 volts, it also operates at a wide temperature range from -45°C to 85°C, has a 0 to 100 % humidity range and a satisfactory accuracy (for the purpose of the extractor‘s use) of +-3.5% with a response time of 5 seconds.. 3.2.2. Weight Sensor Although this option was never implemented, the group wanted to research in thoroughly and had there been a needi, actually implement it. 19 | P a g e Group 3 The weight sensor was to be used to calculate the amount of honey being extracted from the frames. The user would have been receiving a feedback on a LCD screen and/or android device. The weight sensor would have not only calculated the weight of the honey extracted at the end of the process, but would have also been used to calculate the weight being extracted in real time of the process. This means that the user would have received a feedback on the screen with either a counter or a graph plot of real time weight extracted from the honeycombs in desired units of weight measurement. Measuring weight in real time instead of just the weight difference of the honey extractor at the end of the process would have allowed us to calculate the optimal time when to stop the extraction process, for example, if the honeycomb frames do not lose weight this means the motor should be slowing down. Also it would have allowed us to create many statistical calculations for the user if one desired to know at what point of time or at how many revolutions per minute is the honey extracting the fastest or the slowest and so on. However due to various reasons this option was never implemented. Part Number S-20-1000FS15 SEN-09376 Retailer Trossenrobotics Range 1 to 100N Accuracy +/- 6% Price $7.95 Sparkfun 0.1 to 10kg +/- 15% $7.95 SEN-08685 Sparkfun 1 to 100lb +/- 3% $19.95 S-20-1000-FS5 Trossenrobotics 1 – 100N +/- 6% $6.60 Table 3.2.2.1 – Thin and Flexible Force Sensors The FX1901 sensor is very affordable and comes with the following advantages: High Reliability Design for OEM, Appliance and Medical Applications 10-100 lbf Ranges Compact Coin Cell Package Anti-Rotation Mounting Features CE compliance 20 | P a g e Group 3 Table 3.2.2.2: FX1901 Specs Permission granted from Meas-spec Figure 3.2.2.1: FX1901 Dimensions Permission granted from Meas-spec 21 | P a g e Group 3 All of the sensors in the table 3.2.2.1 are thin and flexible type of force sensors, the sensors in table 3.2.2.3 are heavy duty force sensors with mechanical parts. The SEN-10245 is a load sensor used in regular electronic scales. All of the sensors from table 3.2.2.1 are based on a principle where the more pressure or weight is applied to the sensor the less the resistivity becomes. The change in the resistivity can be converted into a voltage change using a Wheatstone bridge. Figure 3.2.2.4 shows the diagram of a Wheatstone bridge. Measuring the voltage changes and converting them using the given formulas in the datasheets of the sensors would have given us the weight of an object applied on the sensor. The SEN-10245 sensor will most likely be used in our project. It has a few advantages over the other sensors, though has its own disadvantage as well. It is more accurate and has a wider range while staying relatively cheap. The sensor that comes closest to that range from the flexible type is the SEN-08685, which has a 100lb limit, though comes with a higher price tag. Another disadvantage of the SEN-10245 is its size and mechanical parts which would have added to the implementation difficulty in our project. Another advantage of the flexiforce sensors is that they come with a detailed user manual and formulas that explain how to use the sensor and how to connect it to the microcontroller and measure the actual weight. Below in the figure 3.2.2.4 is an example of how SEN-08685 is hooked up and operates. Figure 3.2.2.2: Force Sensor Excitation Circuit Permission granted from FlexiForce 22 | P a g e Group 3 The heavy duty sensors below in table 3.2.2.3 are complete package sensors, it means they are ready to be hooked up straight to the microcontroller. They are factory calibrated, robust, sturdy and very reliable. For our project the heavy duty sensors were preferable at this point of time. When all of the fifteen honeycomb frames were to be inserted into the frame holders, the weight would have been approximately 35 kilograms not counting the weight of the frame holder. The frame holder is constructed from metal so it will add by approximation another 10 to 20 pounds; therefore we have a total weight of approximately 90 pounds or so. From this approximation the sensor should have been, preferably, with at least 100lb maximum force range. Part Number SEN-10245 Retailer Range Accuracy Price Sparkfun 1 to 110lb +/- 0.03% $9.95 FN2570-6 ------------- 40 to 500lb +/- 2.5% F.S. $120.00 FMT6 FX1901 ------------Future Electronics 20 to 4000lb 10 to 100lb 1 - 5% F.S. +/- 1% ~ $400 $22.41 FC22310000-0100-L FC23110000-1000-L Digi-Key 10 – 100lb +/- 1% Span $62.87 Digi-Key 50 – 2000lb +/- 1% Span $119.43 Table 3.2.2.3: Heavy Duty Force Sensors Most of the sensors come with two outputs where the voltage difference can be measured straight from those outputs. If the sensor comes with four outputs, the two of the outputs are for the excite voltage – the positive and negative nodes as shown in Figure 3.2.2.4. The other two outputs are from the Rx resistor. When there is a slight change in the resistance, the voltage difference can as well be easily detected. The voltage differences are usually very small and an amplifier will be used to amplify that difference if not implemented in the microcontroller. 23 | P a g e Group 3 Figure 3.2.2.3: Force Application on FX1901 Sensor Permission granted from Meas-spec Figure 3.2.2.4: Wheatstone Bridge 24 | P a g e Group 3 The FMT6 sensor was considered only because of its design. Although it comes with a high price point it will be probably easier integrated in the extractor due to its shape. Figure 3.2.2.5 below shows the construction of the FMT weight sensor. This is a donut shaped sensor that will make it easy to implement in our design. Figure 3.2.2.5: Donut Shaped Weight Sensor Permission granted from Meas-spec The Figure 3.2.2.6 below shows how the sensor is implemented on a screw. This is very similar to frame holder‘s axle. 25 | P a g e Group 3 Figure 3.2.2.6: Implementation of Donut-Shaped Weight Sensor Permission granted from Meas-Spec As already was mentioned before, the donut-shaped load cell weight sensor would have been the easiest to implement in our project. The only concern was the price. The team had to decide whether to buy this sensor or not depending on budget information. Below are the specifications of the sensor in table 3.2.2.4. Table 3.2.2.3: Parameters of the Donut-Shaped Weight Sensor Permission granted from Meas-Spec 26 | P a g e Group 3 3.2.3 Valve The valve in the honey extractor was another important part of the entire project. Without the use of a valve, there would be no honey flow control. The idea of the valve was to open it once the honey was configured, filtered through a screening filter and collected at the bottom of the vat. Looking at a variety of valves available on the market, a conclusion has been made to use a knife gate type of valve (Figure 3.2.3.1) or a specially designed valve for honey flow. The construction of these knifes allows for fast flow of viscous fluids such as honey. A regular valve used for water and less viscous fluids will not be a good choice because it will greatly reduce the rate of honey flow and also may get clogged over time. Both, the knife gate type valve and the specially designed valve for honey should perform the same. Initially we had the idea to implement an electronic valve (typical in water flow applications) to be controlled using the on board buttons or wirelessly with an android device, but electronic valves have many disadvantages and were most likely not to be used in the project. The disadvantages are: Small diameters Easily clogged by viscous fluids Unreliable operation with honey There is electric knife gate type of valves on the market as well. Predictably, they would have operated much better than the valves discussed above. But they had their own disadvantages and did not meet our project goals. These disadvantages were: Very expensive Large sized Hard to acquire Analyzing all of the options discussed above, unless an inexpensive knife gate valve was to be found, a decision has been made to use a mechanical knife gate valve or honey designed valve. Both valves are very similar and are operated similarly. Product Retailer Diameter Price Honey Gate Shop.meghowe.com 4.00 cm $13.50 Valve GV2-2 Gate Aquiticeco.com 3.81 cm $11.85 Valve M005792 Plastic Dadant.com 3.81cm $10.99 Scissors Gate Table 3.2.3.1 – Mechanical Valve Gates 27 | P a g e Group 3 From table 3.2.3.1 the first valve seems to be a better choice due to higher diameter which translates to a faster flow. Figure 3.2.3.1 – Knife Gate Valve Permission granted from Boilersupplies However, after considering our options once more, and coming across a relatively cheap ball-point valve, we decided that we are going to use it. It was fairly easy to implement and served our purposes well enough. 3.2.4 Wireless Communication Technologies The automated honey extractor was to have an on-board control unit and the emergency button. However, the team has requested that the device should also be controlled remotely via an android phone. It should be pointed out that this feature was beyond our customer requirements. The question at hand was how to make a phone control the automated honey collector. To answer this question it was important to consider several android phone capabilities. One of the capabilities currently available in the android phone was Bluetooth connectivity. Bluetooth technology is a wireless communications system that intended to replace the cables that used to be used to connect many different types of devices. Bluetooth is now commonly 28 | P a g e Group 3 integrated in mobile phones, headsets, and a wide variety of electronic equipment. Bluetooth is a short-range wireless technology. The connection would have had to be established with a Bluetooth module on the printed circuit board (PCB) of the automated honey collector and the phone within a distance range of 100 meters, so that devices can exchange information seamlessly. Here are some advantages and disadvantages of using Bluetooth technology: Advantages: Bluetooth is inexpensive technology Bluetooth is low energy consumption technology. Maximum permitted power 100 mW for the range of 100 meters Since the technology uses radio waves the devices don‘t have to be in a clear line of each other. Low latency rate. Small amount of data being send more quickly Simplicity of use Disadvantages: Data transfer rate between two devices has maximum speed of 1 MB per second Lacks security. Easy to hack into Another wireless communication technology that is integrated in the android phone and could have been potentially used for this project is Wi-Fi technology. Wi-Fi technology uses radio waves to provide high-speed Internet and network connection which allows electronic devices to exchange data. Here are some advantages and disadvantages of using Wi-Fi technology: Advantages: Wi-Fi offers high speed connection Wi-Fi has high throughput Disadvantages: Communication is not possible without cell phone service provider or a hotspot service provider Wi-Fi is a high energy consumption technology Table 3.2.4.1 summarizes both technologies features that are critical to our project. 29 | P a g e Group 3 Technology Wi-Fi Bluetooth Simplicity Hotspot of use requirement High Speed Penetration through metal Table 3.2.4.1 Communication Technology Comparison Since the automated honey collector was going to be used in the field, a barn, or in an area without access to a cellphone tower, customer‘s cell phone provider services, or a hotspot, may not be reachable to his location. In this situation Wi-Fi communication could not have been possible. Also, the radio waves should have been able to penetrate through the metal walls of the honey collector in order to communicate with the microcontroller. With Wi-Fi technology this would not have been possible. These two major aspects played a crucial role in selecting between the two technologies. Since there were no security concerns present and no large amounts of data were to be transmitted via established communication link between the two devices, the Bluetooth technology appeared to be the most suitable technology for this project. 3.2.5 Bluetooth Module There are three classes of Bluetooth modules. Each class has a different effective range of coverage and power consumption. The differences between the three Bluetooth classes are represented in Table 3.2.5.1. Bluetooth Power Class Maximum Output Power Operating Range (m) Class I 100 mW (20dBm) 100 Class II 2.5 mW (4dBm) 10 Class III 1 mW (0dBm) 1 Table 3.2.5.1 Bluetooth Transmitter Power Classes The market has great variety of Bluetooth modules with great range of specifications and features. We are going to closely examine a few of them. Here is the list of features that the Bluetooth module should have possessed in order to be considered for our project: good operating temperature range, onboard embedded Bluetooth stack, should support Bluetooth data link to an android device, high data rate, low power consumption, on-board antenna. 30 | P a g e Group 3 One of the Bluetooth modules we examined for this project was RN41SM-I/RM designed by Roving Networks. This is fully certified Class 1, due to its range it would have made our communication with the Android device seamless, Bluetooth version 2.1 + EDR module consumes low power and provides fast data rates up to 3 Mbps baud rate speed, over air data rate of 721kbps to 2.0Mbps, high power amplifier with on board ceramic RF chip antenna, universal asynchronous receiver/transmitter (UART) local and over-the-air RF configuration, and 128 bit encryption for secure communication. Bluetooth version 2.0, 2.1+EDR will have pairing compatibility with Android version 2.2 and later. We also examined RN42EK-I/RM Bluetooth module. This module has similar specifications to RN41SM, but class II module. One of the big advantages is that it connects directly to a PC via a standard USB interface or to embedded processors through the TTL UART interface. It would have been very easy to configure, debug, and communicate with the module. Another Bluetooth module we considered for this project was RN25S-I/RM. This module consumes low power, has status LEDs, on-board embedded Bluetooth stack, external SMA jack or ceramic on-board antenna. Other features include auto-connect, connect-on RX data, transfer data up to 100M, error correction for guarantied packet delivery, UART (SPP or HCI) data connection hardware interfaces. This Bluetooth version would also have been compatible with Android version 2.2 and later. The RN-25 module also accepts a wide range of unregulated DC power 4Vdc to 24Vdc. Technical specifications for the Bluetooth RN25S-I/RM module described in Table 3.2.5.3. Last Bluetooth module that we examined was HC-06. It is a Chinese part and it‘s not very well documented. Some of its specification that we were able to gather include: Bluetooth version is 2.1_EDR and it is forward compatible with later Bluetooth versions, data rate 2.1 Mbps, supplied voltage 3.3/5 volts. The module sits on the base board and it has four onboard pins GND, VCC, Tx, Rx. Such configuration made it very easy to integrate the module to the printed circuit board. 31 | P a g e Group 3 Bluetooth RN41SM RN42EK RN25S HC-06 Bluetooth Version Frequency band Operating temperature 2.1 + EDR, 2.0, 1.2, 1.1 2.412-2.484 GHz 2.1 + EDR, 2.0, 1.2, 1.1 2.412-2.484 GHz 2.1/2.0/1.2/1.1 and v2.0+EDR 2.402 to 2.480 GHz -40C to + 85C -40C to + 85C -40C to +85C Bluetooth Class I Class II Class I Data rate Onboard stack 300Kbps HCI mode: 1.5Mbps sustained, 3Mbps burst Onboard stack 300Kbps HCI mode: Up to 300Kbps 1.5Mbps sustained, 3Mbps burst 2.1Mbps Supplied voltage 3 V ~ 3.6 V 3 V ~ 3.6 V 5V 3.3/5V Power - Output 16dBm 16dBm 12dBm Sensitivity -80dBm -80dBm -80dBm -84dBm 35mA 35mA 35mA - 65mA 65mA 65mA 50mA Data Interface Pads for Pins Pads for Pins PCB, Through Hole Pins Antenna On-Board On-Board On- Board On-Board Price $45 $45 $99 $8.90 Current Receiving Current Transmitting 2.1+EDR 2.4 -2.48 GHz -20 to +75C Class II Table 3.2.5.3: Comparison of Bluetooth Modules Specifications Summary After close examination of all specifications and features of all three of these Bluetooth modules would have been great candidates for our project. The RN25S-I/RM with all its features appeared to be the most desirable module to use in the project, but because of its high price (around $99 per unit) RN41SMI/RM module ( $45 per unit) would have been given greater consideration that of RN25S-I/RM. Since the RN42EK-I/RM module comes on the socket module it makes it very easy to integrate to the printed circuit board. Also, since it can be connected directly to a PC, it makes it very convenient to communicate with. The HC-06 module is inexpensive, having just right set of specifications that we were 32 | P a g e Group 3 looking for this project. However, it‘s not well documented and not that easy to communicate as with RN42 module. For this project we decided to pick two Bluetooth modules and see which one of them would be the best fit. The two winners for our project ended up to be HC-06 and RN42. 3.2.6 Display Several display technologies were considered to be used. The requirements were that it must display information from the sensors. That means that the unit must have at least ASCII output and room for at least 16 digits and 2 rows. One row was used for displaying the type of information measured, and another row was used to display the value of the measured sensor. More functionality would have increased the cost of the project, and was unnecessary for the display of basic information. Other technologies that were considered included Touch screen displays and Graphics LCD displays. Touch screen displays appeared desirable at first because of the functionality including both display and human interface. After extensive testing and serious thought, the conclusion agreed upon was that this was not the choice for this project. Reasons for this decision included honey interfering with the capacitance of the screen and producing false inputs, high cost, and high level of difficulty in interfacing the device with the microcontroller. Graphics LCD displays were another viable option. These displays included functionality to produce bar graphs and other complex display types. The extra functionality initially appeared desirable, but further examination of the purpose proved this functionality unnecessary. 3.2.7. Micro controller Decision The microcontroller we decided to choose should have been able to interface with several components. These components include a screen on the unit its self, a Bluetooth unit to the android device, several sensor interfaces and a motor controller. In order to meet these requirements, the microcontroller must have had at least 2 duplex serial lines, and at least 7 analog to digital converters. In order to meet the specifications, an array of micro controllers was selected. The microcontroller we decide to choose must interface with several components. These components include a screen on the unit its self, the Bluetooth unit to the android device as well as sensor interface. In order to meet these requirements, the microcontroller must have at least 2 duplex serial lines, and at least 7 analog to digital converters. In order to meet the specifications, an array of micro controllers was selected. 33 | P a g e Group 3 3.2.7.1. PSoC Discussion The first microcontroller chosen for evaluation is the Cypress Semiconductor PSoC (Programmable socket on chip) family. These devices have three separate memory blocks, SRAM for data, Flash memory for instructions and fixed data, and I/O registers. This selection includes small FPGA capabilities, as well as several integrated libraries to incorporate other systems to the Module. These other capabilities can be shown in figure 3.2.7.1.1. The pros of this system are high functionality. The cons of this choice are high cost and a steep learning curve. Some interesting features of the PSoC included a vast array drop in modules. The board also has a large amount of analog devices. This allows for an ease of design using very little off chip components. The only components that must be off board are passive components such as resistors, capacitors and inductors. This allows for a super modular design. Components such as the specified load cell could be easily implemented. Figure 3.2.7.1.2 shows how to implement an instrumentation amplifier in Cypress PSoC Creator 2.2. The resistors were off board, and consisted of surface mount devices. On the output of the instrumentation amplifier there was an Analog to digital converter to convert the analog signal to a digital signal. The signal was then read by the microcontroller and processed to display the temperature. Other modules could have been easily implemented into the PSoC. Another example of this is the LED driver. The driver was simply dragged and dropped into the Top Design section of the PSoC programmer. The wires were then connected to the appropriate pin as shown previously. Another interesting feature that could have been used is the PSoC‘s CapSense module. This module is meant to interface with capacitive touch buttons. It has built in capacitive measuring capabilities, and the idea was that it was to interface with the humidity sensor, however that did not work out as planned. 34 | P a g e Group 3 Figure 3.2.7.1.2: Implementation of an Instrumentation in a PSoC 3 chip. Compiled using PSoC Creator 2.2 3.2.7.2 Raspberry Pi Discussion Another choice for a microcontroller was the Raspberry Pi. This choice was good because a board is already laid out, and standard connectors are used (UBS connectors, RJ-45 Ethernet port, HDMI port). Also A Linux build could have been incorporated into the project, and might have allowed for a smooth interface to an android device. Pros for this choice included ease of connection and assembly due to the standard connectors. Cons included the GPIO pins operating at 3.3V, so a level converter may have been required, and an operating system would have been needed to be incorporated. 3.2.7.3. Arduino Discussion The third choice was the Arduino platform. This platform is widely used in the hobbyist marketplace. There are a plethora of devices that Arduino produces, as well as devices that are produced by non Arduino companies that interface to the Arduino programing environment, such as PRJC‘s Teensy line. Arduino also has all open source hardware, so the schematics are available online and they can be easily modified in Eagle CAD. The Pros for this choice were ease of use, extensive hobbyist background and relatively low cost. The Cons were somewhat limited hardware capabilities and interfacing with the android device may have been difficult. 35 | P a g e Group 3 3.2.7.4. MSP 430 Discussion Another microcontroller option was the Texas Instrument‘s MSP 430 microcontroller. This micro controller is a generic device that can be programed in assembly level language or C language. An advantage about this device was that most students have experience with this device due to taking Embedded Systems at UCF. Serial communication and push button interfaces have been mastered in class. This microcontroller does not have the large tutorial set that the Arduino has, or the advanced functionality of the PSoC, so it was not the best choice for this project. 3.2.7.5. IOIO board Discussion The fifth and final choice for micro controllers was the IOIO board. The IOIO board is based off of a Microchip PIC 24 microcontroller. It has firmware built in to it specifically designed for interface with an android device. This product is also open source and containing a large hobbyist background. Pros for this device were ease of integration into the Android environment. Cons included having to use Java to program the Microcontroller. The PIC 24 class of micro controller also has some drop in capabilities added to it. It has a module to facilitate the capacitive touch sensing interface, so it would have also been able to integrate the humidity sensor. Other built in features include an I2C interface and built in Analog to digital converters. Implementation of this device would have first consisted of testing with the IOIO board, and once a final design has been developed, the design would have been copied and integrated into a custom built PCB. After some debate about which product to use, the Arduino environment was the best choice. Reasons for this choice were ease of documentation for programing the units, and low cost. The honey extraction project did not require a fancy connection to a monitor or other devices, and FPGA style device was not necessary, and programming entirely in the android environment was not practical. The Arduino Mega 2560 was a good choice because it has 3 built in hardware serial lines. This would have provided more than enough capabilities to interface with the android device as well as other serial devices. It also includes 16 analog in pins and 54 digital I/O pins. This should have been more than enough functionality for our project. Also a development board could be purchased and tested on before a board was made from the schematic. Table 3.2.7.5.1 shows a few different MCUs and their respective characteristics.. 36 | P a g e Group 3 MCU PSoC 3 Arduino Mega MSP 430 IOIO Raspber ry Pi Part Number Digit al Pins 25 Analo g Pins 25 Serial Other Communicati on CY8C3244PVI25 pins, I2C, Routabl 133 SPI, UART e pins ATMEGA128054 16 4UART, Easy to 16AU ICSP, 1 SPI, use 1 I2C MSP430F5659IP 74 12 SPI, UART, Used in Z USB class PIC24FJ256GB2 52 24 4 UART, 3 Android 06-I/MR SPI, 3 I2C, board USB Broadcom 17 0 I2C, SPI, Linux BCM2835 USB, Ethernet Table 3.2.7.5.1: Various Microcontroller Options Price $5.41 $16.1 3 $11.8 6 $7.81 $35 3.3 Operation of Classical Honey Extractor The operation of a classical honey extractor is a long and tedious process. First the honeycombs must be extracted from the beehives. Figure 3.3.1 shows this process. The process includes first introducing a harmless smoke into the beehive to coerce the bees out of the hive. Once the bees are removed from the hive the honey combs can be extracted. This is a dangerous process due to the close interaction with the bees and the smoke causing temporary loss of vision. To combat these dangers, beekeepers wear protective bee suits so that they do not come in contact with the bees directly. Figure 3.3.1: Extracting honey combs from beehives 37 | P a g e Group 3 After the honeycombs are extracted from the hives the next step is to uncap the honeycombs. Throughout the years a standard honeycomb size has been developed and is constructed from wood. The wooden frames allow the bees to create honeycombs from their natural wax. The reason why bees create honeycombs is to allow for food storage for young bees during fruitless months. The bees create caps on the honeycombs to seal in the honey for use later. During the extraction process, these caps must be removed to allow the honey to escape. This process called uncapping is shown in figure 3.3.2. A knife is used to scrape off the sealing units for the honeycombs and the honey is exposed. Figure 3.3.2: Uncapping honey After the honeycomb is uncapped, it is put into an old fashioned honey extractor. The old style honey extractor uses a hand crank connected to the frame holders to spin the honey out of the frames. The frames are spun until the operator feels that they are empty. He then removes the frames and puts them back into the bee hives so that the bees can fill them with honey again. 38 | P a g e Group 3 3.3.1 Operation of Our Honey Extractor The operation of the honey extractor is a very simplified process. The Same extraction process is used with the extraction of the honey combs and the uncapping, but the actual extraction method is much more simplified. The frames are simply inserted into the unit and the speed up button is pressed. The unit automatically starts spinning and honey is extracted so that the honeycombs end up perfectly empty. After the unit has stopped spinning, the emergency stop switch is activated. This will insure that the system is ready for the frames to be removed. After the frames are removed, they are put off to the side. The extracted honey is run though a filter to remove impurities. The frames are then returned to their respective hives. Our process shows an improvement over older styles by increased honey extraction percent and speed. Figure 3.3.1 shows a more detailed step by step process. Remove Honey Combs From Hive Smoke out Bees Pull out Frames Uncap Honey combs Use knife to carve off outer shell Place frames into honey extractor Operate honey extractor Reset emergency stop button Press start button Let the extractor spin the frames Remove frames Make sure device has stopped spinning Activate emergency stop Remove frames from machine Process honey Strain honey to remove impurities Put honey into container Return frames to beehives Smoke bees out of hive Put frames back into hives Figure 3.3.1: Flow Chart for Operation of Honey Extractor 39 | P a g e Group 3 3.3.2 Dangers of Honey Extraction One of the many dangers of honey extraction is the contact between the operator and the bees. Bees have stingers which contain an apitoxin. The apitoxin is mostly comprised to melittin and other histamines. Some humans may be allergic to these histamines and may develop an allergic reaction requiring immediate medical attention. If treatment is not carried out soon enough an anaphylactic shock may occur. If this happens, the best way to seek treatment is through the injection of an EpiPen. Honey bees contain barbs on their stingers so the stinger may remain in contact with the skin even after the bee has flown away 3.3.2.1. Usually if this happens the bee will die shortly after. When the bee dies it releases a pheromone that will attract more bees. These bees have entered a heightened ―hive mentality‖ and will sting anything they see as a threat. The best way to escape these bees is simply to run in one direction until the bees become too far from their hive. The bees are aware of where their hive is at all times and will not leave the vicinity of their hive. Once you are outside the hive‘s zone of control, you will be safe. Figure 2.3.2.1: Stinger Stuck in the Skin after a Bee Sting Another Risk of honey extraction is the honey extractor itself. The honey extractor has a half horsepower alternating current motor attached to it. The motor is dangerous not only because of the mechanical power it is producing, but also because of the electrical power it is using. Honey contains many electrolytes 40 | P a g e Group 3 and will conduct electricity similarly to how salt water does. During construction of the extractor extreme care was taken into the routing of the AC power lines. They were well insulated and placed out of the way so that accidental contact is not made. The mechanical power that the honey extractor produced was also a safety concern. All loose articles of clothing were removed or tucked away prior to operation. This was to prevent accidental snags and keep people outside of the dangerous spinning device. An example of clothing getting caught is shown in Figure 3.3.2.2. Figure 3.3.2.2: Example of clothing caught in machinery. luckily the operator was not sucked into the machine Another concern for safety was the extractor itself falling over and possibly pinning someone to the ground. Spinning of the honey extractor with an unbalanced load may cause excessive vibration in the unit and create an unstable mounting position. To alleviate the worry caused by this scenario the honey extractor was only operated by the buddy system, meaning that no less than two people were allowed to operate the machine at a time. If all of these safety precautions are taken into account then no injuries should occur during operation of the honey extractor 41 | P a g e Group 3 4. Project Hardware and Software Design 4.1 Hardware Block Diagram Before the system was built it was important to identify what modules the system will include, how they were going to be interacting with each other, how they were going to be powered and connected. For software development it was important to identify the user needs and a design flexible and easy to use custom user interface. Figure 4.1.1 depicts major blocks of the automated honey collector. Figure 4.1.1: Honey Extractor Main Unit Block Diagram 42 | P a g e Group 3 4.2 Software Activity Diagram In order to give an alternative to The Automated Honey Extractor‘s an on-board control unit the system can be controlled by a custom Android application with user friendly custom graphical user interface. The application is compatible with Android running devices operating system version 2.2 or later. Graphical user interface (GUI) is displaying data received from the Bluetooth which in its turn will receive sensors‘ data from the microcontroller. Sensor data will include: temperature data in numerical form, humidity data in numerical form. Custom control selections are also available to the user in the GUI. The user is able to press the Forward button to start spinning the honey extractor in the clockwise direction. The Stop button is also included so that the user can stop the spin at any time (something similar to the manual emergency stop button). The Reverse button will rotate the motor in the counterclockwise direction. Figure 4.2.1 portrays the application‘s entire activity diagram. Figure 4.2.1 Android Software Activity Diagram 43 | P a g e Group 3 4.2.1 Software Development Tools There are a lot of free extensible build tools that are available to the developers today for the android application development. One of these tools is the Android software development kit (SDK). The Android SDK provides developers with the application programming interface (API) libraries, debugger, a handset emulator, documentation, and sample code. All these tools aim the developers to build, test, and debug great applications for Android. The Android SDK is free, open source, and runs on major operating systems platforms. Eclipse integrated development environment (IDE) is used hand in hand with the Android SDK. Java is the primary android development language, but other languages might be used for the development as well. Since Java is mature and well documented programming language it was given preference. 4.2.2 Software System Requirements Over the past decade, Android has matured and evolved into an extremely reliable Linux-based embedded operating system platform. One of the greatest advantages choosing developing an Android application was that Java and Eclipse IDE are free tools and are available in both 32-bit and 64-bit versions on the three primary operation systems in use today. In this project the automated honey collector was not to only be controlled by an on-board control panel, but also by a custom Android application. The application was developed on a machine running Windows 7 64-bit version operating system, utilizing Eclipse IDE 3.6.2 Helios, and programming language Java. 4.2.3 Android Application Development The application was developed for a smartphone running Android version 4.03 operating system. The lowest version of Android operating system that our application supports is Android 2.2. By setting our application development to be the minimum required Android API to Android 2.2 (SDK 8) we have ensured that our application will support as many devices as possible. The target API was set to Android version 4.3 which was the latest version available as of the day the project was completed. The latest version includes all of the new features. With these setting, we were able to provide enhanced user experience through a modern user interface and made the application available and compatible with older versions. Figure 4.2.3.1 depicts the new android application project setup in Eclipse IDE. 44 | P a g e Group 3 4.2.3.1 The New Android Application Project One of the greatest features that Android platform includes is support for the Bluetooth network stack. This feature has allowed our Android phone to wirelessly communicate with the HC-06 Bluetooth module. The application uses the Android APIs to access local Bluetooth. By using Bluetooth API in our remote control application we enable it to scan for Bluetooth devices and query the local Bluetooth for a paired Bluetooth device, establish point-to-point wireless connection without leaving the application and transfer data to and from local Bluetooth [5]. The application is accessible through an icon on the Android device that has the Honey Extractor application installed onto it. Upon launching the application the user is prompted to turn on the local Bluetooth, if it has not been previously turned on manually by the user. Figure 4.2.3.2 depicts the Bluetooth permission request dialog. 45 | P a g e Group 3 4.2.3.2 The Enabling Bluetooth Dialog If the user chooses not to enable the Bluetooth, no communication will be possible between the Honey Extractor and the Android device. If the user chooses to enable the Bluetooth by pressing the ‗Yes,‘ then the local Bluetooth is activated. This feature allows the user to automatically turn on the local Bluetooth without the need of exiting the application. The menu option ‗Connect a device‘ is accessible through the basic operating system interface on the Android device. By selecting ‗Connect a device‘ option and having local Bluetooth activated the user is able to scan, connect, and pair with available Bluetooth devices in the vicinity of the phone. Figure 4.2.3.3 displays this menu option. 4.2.3.3 Connect a Device Menu Option 46 | P a g e Group 3 If the two devices have been previously paired the user is able to select from the list of previously paired devices and connect without additional scanning. Figure 4.2.3.4 depicts the paired devices dialog. 4.2.3.4 The Enabling Bluetooth Dialog Once the local Bluetooth connects to the selected device a confirmation message is displayed with the name of the Bluetooth device indicating successful connection. If the two devices fail to connect then ‗Unable to connect device‘ notification is displayed on the screen for a few seconds informing the user about the connection failure. When the user exits the application or loses the connection with the Bluetooth module the notification ‗Device connection was lost‘ is displayed on the screen. The graphical user interface includes a Forward, Reverse, and Stop buttons. The Forward button allows for the Honey Extractor to spin clockwise, whereas the Reverse button spins in the counterclockwise direction. Spinning the device in both directions results in a more complete honey extraction. To remind the user which button was activated, the previously selected button remains highlighted in red. As a precaution, the user is not able to rotate the device in the opposite direction unless the Stop button is pressed beforehand. This feature prevents excessive wear and tear on the motor. For example, if the Forward button was pressed and the device is currently rotating in clockwise direction, the Reverse button will be disabled until the Stop button is pressed. The Stop button halts the motor of the Honey Extractor. The buttons are aligned in one row and located across the top of the GUI. In the center of the GUI current humidity and temperature data is displayed. The data is collected from sensors located inside of the drum of the Honey Extractor. The humidity is expressed as a percent and the temperature is expressed in degrees Fahrenheit or Celsius. The user is able to toggle the temperature between Celsius and Fahrenheit by utilizing two radio buttons. 47 | P a g e Group 3 On the bottom of the GUI a manual speed controller is available to the user. With the help of an interactive slider the user is able to vary the speed of the motor manually. The interactive slider makes it possible to select a value from discrete range of values by moving the slider thumb. The slider does not only provide a variable speed, but it also allows for the rotation of the motor in both forward and reverse directions. The user can minimize the application by pressing the Back button, while staying connected to the device. To maximize the application the user may simply click on the application icon. To exit the application the user should press the Home button. Both buttons are accessible through the basic operating system interface on the Android device. Figure 4.2.3.5 depicts actual graphical user interface when the connection with Bluetooth has been established. 4.2.3.5 Graphical User Interface Figure 4.2.3.6 depicts application‘s class diagram. It took us tree classes and over one thousand lines of code to develop the application, not including XML files. The following will describe the purpose of each class from left to right. The BluetoothSericalService class does all the work for setting up and managing Bluetooth connections with other devices. It includes 2 inner classes ConnectThread and ConnectedThread, both of which extend Thread class. The ConnectThread thread is for connecting with a device. It runs until the connection 48 | P a g e Group 3 either succeeds or fails. The ConnectedThread is for performing data transmissions when connected. Both the BeeActivity and DeviceListActivity extend an Activity class. The BeeActivity is the main activity that takes care of a main window in which we placed all of our UI. The DeviceListActivity appears as a dialog. It lists any paired devices and devices detected in the area after discovery. When a device is chosen by the user, the MAC address of the device is sent to the BeeActivity in the result Intent. 4.2.3.6 Application Class Diagram 4.3. Configuring and Pairing the Bluetooth Pairing the RN42 Bluetooth module with the smartphone is a very straight forward process. The Bluetooth comes with dipswitches that set the module in various configurations. The Bluetooth is considered to be a slave and smartphone is the master. Before proceeding to pairing we need to power up the Bluetooth. This can be done by connecting the Bluetooth with two wires to a LiPO battery or by connecting the 49 | P a g e Group 3 module directly to the PC via mini-to-USB cable. The procedure can be described in tree steps. 1. On the Bluetooth set the dipswitch to be in slave mode. Automatic discovery is available only in salve mode. The Bluetooth will be set in slave mode by setting switches as shown in Figure 4.3.1. In this phase the module will broadcast its name, profile, support and unique MAC address. 2. In this step the Android phone (master) discovers the Bluetooth (slave). Select the Bluetooth name on the screen. When prompted, enter pin on the phone code 1234. If the pin code was entered correctly and validates successfully the Bluetooth and Android exchange security keys. The Android phone stores Bluetooth‘s credentials and connects to the Bluetooth. The two devises should be now paired and Bluetooth‘s light emitting diode (LED) should be on solid. 3. Next, switch the dipswitch on the Bluetooth to off so that the two devices do not try to re-pair each time power is cycled. The configuration of the dipswitches shown in Figure 4.3.2 [4]. Usually, the devices need to be paired only once. Once paired, when the two devices in the range of each other, they are able to connect. On Off 1 2 3 4 Figure 4.3.1 Dipswitch Configuration for Slave Made On Off 1 2 3 4 Figure 4.3.2 Dipswitch Configuration for Deployment 50 | P a g e Group 3 Since the remote control application is using the Bluetooth as a pipe to transmit data to the microcontroller, without paired and properly configured Bluetooth module an android phone and a microcontroller are not able to exchange data. There are two ways to configure the RN41 Bluetooth module: via Bluetooth and using computer‘s serial port. The procedure is simple and relatively straight forward for setting up and configuring the RN41 family Bluetooth modules. We configured our Bluetooth module with the microcontroller over local configuration. Since the RN41 Bluetooth module has UART port, it was easily configured over this port. The module was connected to the computer via the RS-232 DB9 port. With the Bluetooth module powered up and connected to the computer we were able to put it into command mode by launching a terminal emulator then specify the module‘s serial port default settings. Finally, to enter the command mode we typed $$$ in the terminal. The command mode had to be entered within the period of 60 seconds. In command mode the Bluetooth accepts ASCII bytes as commands. On the emulator we were able simply type a command from a set of available commands to configure the module. The serial port default settings such as baud rate, parity bit, 1 stop bit, data bits, and hardware flow control were set at this point. The system was rebooted after configuration so that the settings take the effect. After reboot all the settings have taken the effect and persisted on the module until we have reconfigured or reset the module. Figure 4.3.1 demonstrates data and command modes of the RN41 Bluetooth module [4]. Figure 4.3.1 Data and Command Modes of the Bluetooth Module Pairing the HC-06 Bluetooth module with the smartphone was also a very simple process. The Bluetooth is slave by default. When the Android phone discovered the HC-06 Bluetooth it displayed its name and the MAC address on the screen. When the user selected the name on the screen, he was then prompted to enter pin on the phone. The default code is 1234. When the pin code was entered 51 | P a g e Group 3 correctly and validated successfully the Bluetooth and Android exchange security keys. The Android phone stored Bluetooth‘s credentials and connected to the Bluetooth. The two devises were now paired and Bluetooth‘s light emitting diode (LED) became solid. 4.3.1 Integrating the Bluetooth into Circuit Originally, the team was going to utilize RN-42 Bluetooth module is their project. The Bluetooth was going to be integrated into the printed circuit board in the following fashion. The Bluetooth was going to be powered up by 3.3V or 5V regulated power input VDD (pin 11), GND pins and were to be grounded (pins 1 and 11). In order to avoid noise caused by other circuit elements a decoupling capacitor will be placed in the circuit. The Bluetooth module was going to be connected to pin 10 of the microcontroller through UART_TX transmit line (pin 14). The receive line UART_RX (pin 13) of the Bluetooth was going be connected to the microcontroller‘s pin 11. The module has hardware flow control and it is set to enable as a default factory setting. This feature is controlled by request to send (RTS) and clear to send (CTS) protocols. When the hardware flow control is set to enable on the Bluetooth module, it will refrain from sending packets to the microcontroller until the microcontroller send CTS signal back to the module. This configuration was supposed to resolve hidden node problem and provide protection against packet collisions. The CTS was also going to hold the medium while the RTS accessing the medium thus preventing others from sending data. RTS/CTS protocol increases network performance. However, there is a tradeoff. RTS/CTS also introduces an increase in overhead, thus decreases in throughput which was an undesirable tradeoff in our project. Moreover, our network was to have no other nodes trying to access the medium and we were not going to transmit large amounts of data over the medium that had to be broken up into chunks. Thus, in order to avoid the overhead that comes with enabled hardware flow control, pins UART_CTS (pin 16) and UART_RTS (pin 15) were to be shortened. The schematic of the RN41 Bluetooth module is shown in Figure 4.3.1.1. 52 | P a g e Group 3 4.3.1.1 Bluetooth RN42 Pin Configuration During testing RN-42 Bluetooth module the team encountered a data transfer problem. After a few weeks of debugging the RN-42 Bluetooth module and communicating with supplier‘s engineer, it was determined that the Bluetooth module is defective and need a replacement. However, instead of getting another RN-42 the team decided to utilize a HC-06 Bluetooth module in the project. The HC-06 Bluetooth has four pins: VCC, GND, Tx, and Rx. It was powered up by 5V regulated power input into the VDD pin, GND pin was grounded, the Tx pin was connected to the Rx pin on the microcontroller. With the Bluetooth‘s simple pin configuration it was very easy for us to integrate this Bluetooth module into our printed circuit board. The Bluetooth pin layout is presented in Figure 4.3.1.2. 53 | P a g e Group 3 4.3.1.2 Bluetooth HC-06 Pin Configuration 4.4. Heating System One of our requirements for this honey extractor was to have a heating system that was to heat the vat of the extractor in order to increase the flow of the honey, thus decrease the extraction time. In order to satisfy this objective we could have uses several heating methods. Deciding which particular method to use was one of the most challenging tasks, while considering cost, heating ability and ease of use. The heating system was to include a temperature sensor (see Temperature Sensor section for more details), and heating elements. The temperature sensor and the heating elements were to be both connected to the MCU. The temperature sensor was to measure the temperature of the honey and then send the data to the MCU, and based on the readings from the temperature sensor, the MCU was to automatically adjust how much heat the heating elements need to produce by controlling the amount of current that goes to them, or use a relay to switch them on and off as necessary. If the temperature of the honey is higher than what it should be, the current was to be decreased or the relay was to be turned off. On the other hand if the temperature is too low, the current was to be increased or the relay was to be turned on. Also, the temperature reading of the temperature sensor was also to be available for system monitoring, meaning they were to be displayed on the GUI for the user to see. However there were no plans of giving direct control of the temperature to the user as of the moment when the heating system was first designed. A general block diagram of the heating system can be found below. 54 | P a g e Group 3 Figure 4.4.1 Heating System Block Diagram 4.4.1. Coil Heating & Heating Plates One method of heating that was considered was using a coil or a heating plate to heat the vat that will be holding all of the extracted honey. The coil or the heating plate would have had to be installed at the bottom of the vat, and this way the vat would be heated, essentially it would be like installing a stove under the vat (see figure 4.4.1.1). This method is probably the most cost efficient in regard to the actual element cost (not power consumption) since coils and plates are well spread. However the major problem would have been actually installing the coil or the plate as well as the fact that it would take some time for the vat to heat up from bottom to top, thus slowing the whole extraction process. The problem with installing the coil or the heating plate under the vat consisted in that, on the bottom of the vat we needed to have a draining valve as well as the draining container which leaves little room for the heating element. Therefore either we needed to come up with a way to install the coil or the heating plate without getting in the way of the container and the valve and find a way to decrease the heating time or we needed to use another method to heat the vat. 55 | P a g e Group 3 Figure 4.4.1.1: Coil or Heating Plate Diagram 4.4.2. Flexible Heating Elements The second method of heating the vet that was considered for our project was using flexible heating elements such as flexible coils or silicon rubber heaters. This method was probably the most convenient method to heat up the vat since the vat would be ―wrapped‖ with the flexible heating element, thus increasing the rate at which the vat would heat up (see figure 3) also because it is fairly easy to find space around the vat to install the heating element. By installing drum heaters around the vat, the vat would be fairly quickly heated up and ready for use, while the bottom of the vat is still available for other parts to be added there. However, because of its convenience and easy use, the price of a flexible heating element rises exponentially. While using a hot plate or a coil as that of a stove or range, the cost would be around thirty dollars for components, using a flexible heating element would cost over one hundred dollars. Overall this method of heating was more advantageous compared to other methods; the only problem that occurred was the cost of the element. 56 | P a g e Group 3 Figure 4.4.2.1: Heating Vat using Flexible Heating Elements However even after deciding that we want to use a flexible heating element in our project, deciding which particular one was a challenge on its own; our choices were either, a drum heater, a silicon rubber heater or apecolator heating element. After some research, an alternative for the more expensive flexible heating elements was also found—Nichrome Resistive Wires. If we were able to effectively use the Nichrome wires as a flexible heating element, we would have been able to reduce the cost considerably. When choosing the right part, the temperature range, the physical proportions, and the cost were considered. A general table of the parts considered can be found below. In the end we ended up using silicon rubber heating strips. Name Volts Power Briskheat DHCS15 Drum Heater 120 1200 W Silicon Rubber Heater (12‖ by 24‖) 120 1440 W Nichrome Resistive Wire ? ?W Stove/Oven/Range 6" Heating Element - 120 1250 W 2391B Frigidaire 5308011964 - P1-8 Coil 120 2100 W Element Frigidaire 316442300 Range Surface Coil 120 ? Element NEW OEM Table 4.4.2.1: Heating Elements Price / Each $155 $109.21 $8-$20 $26.40 $49 $13 4.4.3. Implementing the Temperature Sensor Implementing the temperature sensor on the drum (which spins to create a centrifugal force and fly the honey out of the honeycomb) or on the interior side of the container or the vat was essential in our design because of the heating mechanism which was to be integrated in the apparatus. The temperature inside the container, was expected to be different from the surrounding environment of 57 | P a g e Group 3 the extractor which was the reason why it was so important to read the temperature inside of the container. Implementing the temperature sensor on the spinning drum would have required a wireless communication of the sensor and the microcontroller which would have brought redundancy, ineffectiveness and cost inefficiency to the project. Implementing the sensor on the walls of the container where it will get in contact with the honey itself was more practical to do. Another option was to use an infrared temperature sensor, which did not have to be placed inside the container in order to read the temperature of the inside environment. The latter option was the easiest in terms of implementation and that was the biggest advantage of it comparing to other options, but it comes with its own cons too. Thorough and detailed analysis of the three options of implementation of the temperature sensor was required in order to decide which one was the best option in our project. 4.4.3.1 Implementation Options Implementing the temperature sensor on the spinning drum came with one advantage over the implementation on the container, i.e. it does not come into contact with the honey. The disadvantages were: it would be always in motion; it would require wireless connection to the microcontroller. Since the microcontroller is placed outside of the container, a wireless connection with the temperature sensor must have been established, this brought many challenges and complications and, therefore, this option was omitted. Implementing the sensor on the walls of the container, as shown in figure 4.4.3.1, was again more practical to do. The advantages were: it would always be stationary and a wired communication with the microcontroller could be easily established. The disadvantages were: it would be in contact with honey, a special sensor would have to been acquired that will be ―honey proof‖. To avoid the possible costly feature of a temperature sensor which would be ―honey proof‖ meaning it can withstand certain acidity levels, (of the honey in our case) the sensor could be sealed in a metal or plastic material. Wires would also get in contact with the honey, which brings another con to this option. To see some of the temperature sensors we have considered using in this option refer to table 3.2.1.1.1 for comparison. Infrared temperature sensor was the easiest to implement among the three options from a mechanical perspective. The advantages over the two options are: it is always stationary, it is wired to the microcontroller unit, and it is not inside the container and does not need to be in contact with the honey. To see some of the infrared temperature sensors we have considered using in this option refer to table 3.2.1.1.2. 58 | P a g e Group 3 Figure 4.4.3.1 - Temperature Sensor inside the Barrel 4.4.4. Powering the Heating System The heating system, in our project is one of the most power-demanding systems other than the motor. To power the system we implemented AC voltage. The other parts of the heating system, such as the temperature sensor and the MCU are powered using an AC to twelve volt DC inverter. 4.5. Designing the Mechanical Components A good amount of our project consisted of mechanical parts such as the vat and the frame holder, and designing those mechanical parts was also one of this group‘s responsibilities. 4.5.1. Designing the Frame Holder When we were designing the frame holder, we had a few requirements that needed to be met. The frame holder had to be made of stainless steel or other non-corroding material The frame holder had to fit at least eight frames at the same time 59 | P a g e Group 3 The frame holder had to utilize frames of the dimensions 17.75‖ by 9.125‖ The frame holder had to be as light weight as possible The frame holder had to be able to support the weight of eight frames full with honey (approximately thirty-forty pounds) Having these requirements in mind we first considered a tangential design for the frame holder, and we even came up with a flipping mechanism to solve one of the main problems with that design. The flipping mechanism incorporated hinges on each individual frame support and depended on the centripetal forces made by the motor to do the flipping. A figure of what we came up with can be found below. Figure 4.5.1.1: Tangential Frame Holder The figure below shows a closer look on each of the individual frame holders. And as it is seen in the diagram above, we had eight of them on the frame holder. Each one of the wax frames would be placed in one of these things, and then spun around to extract the honey from one side, then spun in the opposite direction, which due to the rotational force would flip the individual frame holder and that way the honey would be extracted from the other side of the wax frame. 60 | P a g e Group 3 Figure 4.5.1.2: Individual Frame Holder However after looking at what we have achieved, we realized that using a tangential design for the frame holder is just too inconvenient. To utilize eight frames at the same time, the size of the frame holder becomes too bulky and heavy with the dimensions of the wax frames being seventeen inches and three quarters (17.75‖) by nine inches and an eighth (9.125‖). So we decided to start from scratch and design a frame holder that utilizes the radial design instead of the tangential in order to save up some space and also decrease the weight of the entire extractor. And as a result also save some money on materials. As you can see by comparing the figures above with the figures below, the amount of materials being used in the one below is much less, which makes the frame holder a lot lighter in mass. Also even though it looks ―simple‖ it completes all of the requirements and if the future owned of the device decides that he needs to fit two times more wax frames into the extractor, it could be done with a minor modification to this existing frame holder. In addition it uses fewer components and is more ―solid‖ since there are no moving parts in the holder, unlike the previous version of the frame holder that we designed. In the end, we made the frame holder similar to the figure figure 4.5.1.3, however it held fifteen frames at a time, and instead of it being a four segmented as shown in figure 4.5.1.3, it turned out to be a three segmented frame holder. 61 | P a g e Group 3 Figure 4.5.1.3: Frame Holder Top & Bottom & Side View Figure 4.5.1.4: Frame Holder Top & Bottom & Side View 62 | P a g e Group 3 4.5.2. Designing the Vat Although designing the vat may sound ―simple‖ there were actually not that few things that had to be considered. Also, there were some requirements that needed to be met as well. The vat had to be made of stainless steel, or any other non-corroding material The vat had to be able to fit the frame holder and have five (5) inches of free space between its outer rim and the frame holder on all sides. The vat had to have at least five (5) inches of free space below the frame holder The vat had to have at least five (5) inches of free space above the frame holder In our initial design, in order to satisfy these requirements we used a cylindrical shaped vat made of stainless steel. The dimensions of the cylinder being: a diameter of thirty two and a half inches (32.5‖) and a height of forty five inches (45‖). Using these proportions we accounted for the size of the frame holder, the required space around the holder as well as above and below. We also added filtering netting into the vat. Doing that made sure that the valve that Is below would not get clogged up with wax from the frames, as well as the honey would be ready to be filled directly into the containers without the need of much more filtering, thus saving time in the whole process of the honey production. A diagram of the vat can be found directly below (not to scale). Figure 4.5.2.1: Side View of Vat 63 | P a g e Group 3 However, after some more thought, we ended up removing the filtering netting as well as slightly changing the dimensions of the cylinder. The resulting vat properties ended up being: The vat is made of Gauge 16 (1/16‖ width) Grade 304 (food grade) stainless steel. The bottom of the vat is made of Gauge 13 (3/32inch width) Grade 304 stainless steel. The vat‘s dimensions are: Diameter: 32 inches (100.531‖ circumference) Height: 31inches Total Volume: 24931.68 Cubic Inches 4.6. Sensor / Driver Interface A variety of sensors were necessary in order to meet the project‘s requirements. Some sensors had a serial interface, while other sensors had an analog interface instead. The micro controller had to be able to sample each of these sensors on a separate pin, so that external switches or multiplexers aren‘t required. The types of sensors required for this project Included temperature sensors, and humidity sensors. Each of these sensor types contained several technologies in order to obtain measurement. For example, temperature sensors required either an analog voltage signal or an infrared readout type signal. 4.6.1. Temperature sensor interface Thermocouples were first considered because of their wide usage in industry. Thermocouples would have produced a voltage on a junction of two dissimilar metals as seen in the figure 4.6.1.1 below. This is due to the thermoelectric effect or Seebeck effect, a figure of which can be found below as well (figure 4.6.1.2). According to the equation it is clear that certain details such as the conductors‘ size and the length of the conductor do not matter. However, thermocouples must maintain direct contact with the material being measured, so caked on material will prove difficult to measure due to insulation properties. Figure 4.6.1.1: Seebeck effect 64 | P a g e Group 3 Figure 4.6.1.1: High level thermocouple diagram Infrared sensors seamed most desirable due to the remote nature of the device. Caked on material would not affect the accuracy of the sensor. These sensors have a less standard interface when compared to thermocouples. The infrared sensor we decided to use is the Melexis. The connection of the MLX90614 can be seen in figure 4.6.1.2. The connection required was simply a PWM interface in order to communicate with the module. The SCL pin was used to program the device, however the device come out of the box outputting a 10-bit PWM signal in the temperature range of -20°C to 120°C. This range provided an output resolution of .14°C, and thus satisfied the problem of temperature measurement. 65 | P a g e Group 3 Figure 4.6.1.3: connection of the MLX90614 (courtesy of Melexis) 4.6.2. Humidity sensor interface As described earlier, humidity is another factor that determines how honey is extracted. Measuring humidity is common in electronics, as humidity is also a great factor in determining how well electronics function. Some microcontrollers may even have an integrated humidity sensor, so that an external sensor is not required. There are many types of humidity sensors that have different output types. Some humidity sensors output an analog voltage, where others have a more passive sensing approach. One sensor that seamed interesting to interface with was a capacitive humidity sensor. A sensor from Honeywell stuck out as a good match for the project. A sensitivity chart is shown in figure 4.6.2.1. Many of the micro controllers that were looked at included built in capacitive touch sensing functionality. These modules usually functioned through pulsing the capacitor at a certain frequency and measuring the response via the drop off time in an RC circuit. This functionality is shown in figure 4.6.2.2. 66 | P a g e Group 3 Figure 4.6.2.1: Cypress PSoC cap sense module (embedded in PSoC 3 units and PSoC 5 LP units) Figure 4.6.2.2: Humidity Sensor Response 67 | P a g e Group 3 However, after trying and failing to implement this humidity sensor, we decided to implement the HIH-4030-003 sensor. This humidity sensor outputs a linear voltage which makes it easy to communicate with the microcontroller. 4.6.3. Weight Sensor Interface Another optional functionality that we ended up not using was an interface to a weight sensor. Technologies that were researched include Load cells (figure 4.6.3.1) and pressure sensors (figure 4.6.3.2). Pressure sensors that were researched generally included totally integrated designs. Therefore these sensors used a high level digital interface to communicate. Because of the high level of integration, pressure sensors were also considerably more costly. A decision was quickly made to use load cells to measure weight if we were to actually use a weight sensor. From a high level understanding, load cells measure resistance to produce a weight measurement. Most load cells consist of an array of four resistors connected together in a Wheatstone bridge. When a force is applied on the load cell, the resistors incorporated are designed to flex and change with weight. The response of the load cell generally requires an instrumentation amplifier in order to operate. Figure 4.6.3.1: Load Cell Generic Schematic (Wheatstone bridge) 68 | P a g e Group 3 Figure 4.6.3.2: Pressure Sensor Generic Diagram Instrumentation amplifiers are a type of differential amplifier. This means that they have input buffers in order to eliminate the need for impedance matching. Instrumentation amplifiers also have very low DC offset, low drift, low noise, very high open-loop gain, very high common-mode rejection ratio. This means that very small signals can be accurately measured, such as those produced by a load cell. Figure 4.6.3.3: Instrumentation amplifier generic schematic 69 | P a g e Group 3 Figure 4.6.3.4: Equation for Generic Instrument Amplifier Figure 4.6.3.3 depicts a generic schematic for the instrumentation amplifier, while figure 4.6.3.4 is the equation for the generic instrument amplifier. 4.6.4. Bluetooth Interface (Android Interface) Android devices are revolutionizing the way people think about computers and engineering. Bluetooth is a wireless communication protocol that allows various devices to connect to one another through thin air! Most android devices contain built in Bluetooth modules, allowing for seamless integration to devices such as wireless headsets. For this project a Roving Networks RN41 Class 1 Bluetooth module was first selected to create an android interface. Details on this module were discussed earlier in the paper. This module communicates to the micro controller via an integrated UART (Universal Asynchronous Receiver / Transmitter). This creates and easy interface system and should easily connect to any microcontroller. This module allows for data rates of up 240Kbits per second for slave mode and 300kbits per second of master mode. Connection from the Bluetooth module the micro controller was supposed to happen via RS232 protocol. The connections were to be made coincident figure 4.6.4.1. The custom built circuit board will facilitate the connections and contain the module. Figure 4.6.4.1: RS232 Connection However, after having some problems with that particular Bluetooth module we ended using a HC-06 module, which was similarly interfaced. 70 | P a g e Group 3 4.6.5. Display Interface In case a Bluetooth device is not connected to the module, a Liquid Crystal Display screen is used. The Liquid Crystal Display that is used was described earlier. The display has an integrated Hitachi HD44780 display controller. This controller requires a parallel communication interface, meaning that more than one signal is sent to the display at a time. This required for 7 pins to be connected to the microcontroller. The connection is shown in figure 4.6.5.1. Figure 4.6.5.1: Hitachi HD44780 LCD Controller interface Pin 1 is a common ground Pin. Pin 2 is the voltage in pin used to power up the Module. Pin 3 normally contains a potentiometer used for contrast adjustment. In the application that the LCD is used for, variable contrast was not required. Because of this, a 10K Ohm resistor tied the pin to ground. This kept the LCD at full brightness. Pin 4 is a register select pin. This pin selects which register is to be used. The Hitachi HD 44780 controller has two data registers; Command Register select = 0, and Data, Register select = 1. Pin 5 is the Read / Write pin. When Read Write = 0, the protocol is waiting for data to be written to it. Then the Read Write pin = 1, the protocol will send data via the data pins. Pin 6 contains the clock pin. The clock is falling edge triggered, meaning the on transitions from 1 to 0, the protocol will read the input pins and perform operations based on the inputs. The rest of the pins on the module were used for data transmission. Pins 7, 8, 9, and 10 were unused, because the data transmitted across was in a 4 bit format. The rest of the pins; 11, 12, 13, and 14 were 4 bits used to send data to the module via a parallel interface. 71 | P a g e Group 3 4.6.6. Human Interface Device Also contained in the display module was a human interface device. This device was simply a couple of touch buttons. The buttons were connected to the micro controller via pull up or pull down resistors (figure 4.6.7.1). More complex circuitry was not necessary. The functionality of the human interface device was limited to only button presses. These buttons selected which sensor will be displayed, as well as cycle through values for motor speed and temperature sensing 4.6.7. Motor Controller Interfacing An alternating current motor was used to spin the frame holder with the honeycombs in order to extract the honey. As discussed earlier in the paper, a Variable frequency drive motor controller was used to control the motor. This motor controller acted as a way to control the motor by varying the frequency of the alternating current connected to it. According to figure 4.6.7.1., first 3-phase power enters the controller and is converted to a direct current by means of a rectifier diode bridge. The direct current bridge is then switched using high power transistors to mimic an Alternating current. Because these transistors are going to be controller using the microcontroller, it was possible to vary the frequency of the alternating current entering the motor. Figure 4.6.7.1 is shown as a 3-phase system. Figure 4.6.7.1: High level Variable Frequency Drive Motor Controller Diagram 72 | P a g e Group 3 The microcontroller interface to the motor controller was to be either another rs232 connection, or possibly a direct connect for the H-bridge used to modulate the signal. This connection will consist of a pin to select the direction of rotation of the motor, and another pin to select the frequency of the motor connection. Figure 4.6.7.2: pull up or pull down 4.7 The Motor One of our project‘s requirements was to have an electric motor that will create the centrifugal force in order to extract the honey from the wax frames. However not just any motor would have worked in this situation. The motor we needed was a motor with enough torque to rotate at least eight frames full with honey (later we changed that to fifteen frames), and on top of that the metal assembly that was holding the wax frames, which by our estimations added up to forty-fifty kilograms at about 300RPM. Also, as mentioned by our requirements, the motor had to be electrical and be powered by a regular wall outlet of 110-120 volts. With these two main requirements, our choices became very limited. However 73 | P a g e Group 3 most motors that met these requirements were very expensive, over $150 but since it was also a requirement for our project to make this device as low cost as possible, none of them fit the bill. For that reason we had to ―dig deeper‖ and find a motor that could be used for our purposes and that is fairly cheap compared to the other ones. And we found such a motor! With the half of a Horse Power the problem with the torque is taken care of. Also the voltage that it uses is 115 Volts, so that makes it possible for it to be powered by a regular wall outlet. And finally the price tag of $80 sold us in this particular motor. 4.7.1 Mounting the Motor The placement of the motor in the honey extractor played a big part. We needed to place the motor in a place that would be the most convenient. There were mainly two possible positions where we can place the motor at. The first position was to mount it above the extractor, and directly connect the motor shaft to the wax frame holder‘s axel. A diagram can be found below. Figure 4.7.1: Motor Positioned above the Vat 74 | P a g e Group 3 The problem with positioning the motor in this manner was that it would take up the space above the extractor, which would make the loading of the frames into the extractor a little inconvenient, however it would reduce the number of parts used to connect the motor. The second possible way of mounting the motor was by placing the motor adjacent to the vat and having a rubber belt that would connect the motor and the frame holder. So as the motor spins, the belt would rotate as well and spin the frame holder. However connecting the motor in this manner added more components to the project as well as made the extractor a little unstable due to the weight being on one side on the vat unlike how it was in the center in the previous method. A diagram can be found below. Figure 4.7.2: Motor Positioned Adjacent to Vat All in all, choosing either method would create some problems, therefore we decided to go with a combination of both the second method and the first method and place the motor adjacent to the frame holder‘s axle but still above the vat therefore reducing the problem with going purely by the second method, and also limiting the space taken by the motor to just one side of the extractor. Figure 4.7.3 is the resulting placement of the motor. 75 | P a g e Group 3 Figure 4.3.3: Final Motor Positioning 4.8. Weight Sensor Implementation Options Although it was never implemented, in order to achieve the goal of real time measurement without delays, (which is essential for calculating the optimal time when to stop the motor) the weight sensor could not be placed where it would measure the whole weight of the honey extracting apparatus because the viscous honey takes time to flow out of the container. Instead, the weight sensor must measure only the weight of the honeycomb frames, and in order to achieve this, we must have had to place the weight sensor on the bottom of the frame holder аlong with its axis, in other words, we have to measure the weight of the spinning part separately from the other parts. Refer to figure 4.8.1 and figure 4.8.2 for clarification. Figure 4.8.1: The Spinning Frame Holder Alone 76 | P a g e Group 3 Another approach would have been placing the sensor on the top as shown in figure 4.8.2. In this approach, the bottom of the axis must not be supported by the container or the vat, in order for the weight differential to be detected by the sensor when the honeycomb frames are placed inside the holder. The above two approaches are fairly difficult to achieve from a mechanical point of view and as a backup plan we had to consider weighing the whole apparatus approach, which is not be as desirable as the above two approaches, but would have been easier to achieve and which is why this approach was our back up plan in the case we decided to use a weight sensor. Currently there are many types of force and weight sensors available in the market that could have been used in our project. Through the process of elimination and research we have come up with a list of sensors that fitted our needs. Table 3.2.2.2 and table 3.2.2.1 outline and compare the main characteristics of chosen sensors in the above section. Figure 4.8.2: Top or Bottom Placement of the Weight Sensor 4.9. Printed Circuit board (PCB) According to the requirements for the course, a printed circuit board was to be created. Printed circuit boards are used to connect electrical components together. Most circuit boards are made of copper laid on top of a fiberglass material. Usually this material is FR4. 77 | P a g e Group 3 4.9.1. Circuit Board Design The design of the printed circuit board was created in CadSoft‘s Eagle. This program allowed for electrical components to be created or imported and placed in a circuit schematic. The schematic was then converted to a net list, which described how the components are connected. These connections were then physically laid out on a computer generated model of the printed circuit board. The circuit board layout used in our project can be seen in figure 4.9.1.1. The colors represent different layers of the circuit board. Some circuit boards may contain up to 16 layers, however that is not the case in our PCB. Figure 4.9.1.1 Our Printed Circuit Board According to 4.9.1.1, there are 4 layers; top layer, bottom layer, drill holes and vias. The top layer is shown in red and containing information describing where the copper is located on one side of the board. The bottom layer is shown in blue. It contains the information related to the traces on the other side of the board. The green layer is showing where the through the hole pads are going to be placed. Holes are drilled through the circuit board, and then connected together by means of conductive material. The yellow layer contains information related to the placement of vias. Vias are junctions between the top layer and the bottom layer. 78 | P a g e Group 3 4.10 Powering the Extractor Almost every part of our project needed to be supplied with power, starting with the motor, the MCU, the sensors and ending with the heating system. For this purpose we needed to implement both alternating and direct current. Our motor uses a regular 115 Volt outlet as a power source, therefore it is connected into the wall outlet directly, without the use of an inverter or a transformer of any kind. However, we needed to implement an AC to DC inverter for our other electrical parts that needed to be supplied with power. The heating elements used an AC power supply, therefore they did need an inverter. However the MCU along with all of the sensors such as the humidity sensor and the temperature sensors used an AC to twelve volts DC inverter. Figure 4.10.1 shows the initial power supply of the components, however as our components changed, so did the layout of the power supply. What we ended up with was a single outlet that later branched into DC and AC circuits. Figure 4.10.1: Power Supply Using Three Outlets. 4.11. Emergency Stop Design An important part of the design was safety. In case of a hypothetical failure, a purely electric and mechanical system had to be in place to safely stop the unit. The emergency stop had to be separate from the microcontroller, to ensure robustness. Since in case of a systems fail, the smaller low voltage components tend to be destroyed. 79 | P a g e Group 3 The emergency stop consisted of a double single pole double throw relay and two switches as shown in figure 4.11.1. One of the relay‘s switches was connected to the power feeding the motor. The other switch was used to reset the unit once an emergency stop has been triggered. The circuit also consisted of a normally closed ―emergency stop‖ switch and a normally open "power on‖ switch. When the normally closed emergency stop switch is activated, power to the relay‘s coil is cut off. The relay collapses and breaks the circuit feeding the motor power. To turn back on the relay, the power on switch (reset switch) needs to be pressed. The switch reenergizes the coil so that both the switch feeding the relay and the switch feeding the motor become closed, allowing current to flow to the devices. If the switch feeding the motor is shown to be too low current rated, then a larger relay or contactor would have been added so that the coil is energized by the ―power out‖ node. This may have been necessary because relays with more than one switching circuit generally tend to cost more and be lower power than single switch relays. However since we found the needed relay‘s this did not need to be done. Figure 4.11.1: Emergency Stop Schematic 80 | P a g e Group 3 4.12. Procedure for Presentation Our first presentation was a great milestone in our project. Sticking to the design calendar, the requirements were met well before this date. The time in between these dates gave us plenty of time to practice our presentation. Mandatory requirements to be met before this time included integrating the Human Interface Device, the Liquid Crystal Display Screen, the temperature sensor, humidity sensor, the motor and the android device interface. First thing that was done during the presentation was to plug in our power for our devices. Light emitting diodes were turned on to show that various systems were enabled. Once all of the devices were tested, the motor test was started. The motor slowly powered on and was spinning until full speed was reached. The motor was run for a little while, and then the emergency stop button was pressed. Once the motor has powered down, the reset circuit was tested. The motor powered back on. Later, the humidity and temperature sensor readings were checked for accuracy. Once the sensors were confirmed to be functioning properly, the heating system was tested. This completed the testing phase of our device before our presentation. Next test was to connect the android device to the unit. The Android device was powered on and connected to the device. Sensor input was verified to make sure the connection is made. The Android device was given to one of the members of the review committee so the sensor information can be read remotely. Next we were going to load the unit with the honeycomb frames. The frames were to be removed from sealed containers over the extractor as not to spill honey on the floor during the presentation. Once the frames were to be inserted, the device would be closed and the start button would have been pressed. The device would have started spinning and the honey would have started coming out of the units. The vat would have heated up so that it would flow easier to the straining device. The vat would then have been opened and the honey poured into a small container. The container full of honey would have been presented to the review committee. However, since there were no full honeycomb frames available due to season this part of the presentation was omitted. The final step was to ask the review committee if there are any questions, and then we answered them as appropriate. Once all of the questions were answered and our group was dismissed, we packed up our equipment and examined the room for any parts that have escaped our attention. The Android device was collected. Any messes were cleaned up, and the group left the presentation location in an orderly fashion. Figure 4.12.1 shows a step by step process of our presentation. 81 | P a g e Group 3 Power on Device Plug in Device Verify status lights Test Device Test Motor Test Emergency Stop Connect Android Device Verify Sensor Reading on Aandroid Device Prepare Device Unload Honey Combs Place Honey Combs into Device Press Reset Button then Start Button Watch Device Function Verify Motor Spinining Verify honey Extraction Verify heating System Unload Device Wait for Device to Come to a Complete Stop Enable Emergency Stop Remove Empty Frames From Device Make Closing Statements Answer Questions Thank Advising Comittee Clean up Messes if Necessary Test Reset switch Figure 4.12.1: Presentation Procedure 82 | P a g e Group 3 5. Design Summary The Automated Honey Extractor design was composed of several detailed subsystems. The main subsystems were the motor system, the heating system, the wireless communication system, the android system and the optional weighing system (which was not implemented) as seen in figure 5.1. Automatic Honey Extractor Heating System Android System Motor System Wiresless Communication System Weighing System (Optional) 5.1 Automatic Honey Extractor Systems 5.1. The Motor System The motor system included a motor, a motor controller and a power supply. All of these components were be connected to the microcontroller unit. The motor controller was controlled by the user both directly using the onboard controlls and also with an android device running the Honey Extactor application using the Bluetooth wireless communication system as a medium. Figure 5.1.1 shows how the motor system was set up, which parts communicated with what. The diagram shows the communication links between the microcontroller to the motor as well as the android device and the human interface device and the LCD display. 83 | P a g e Group 3 Android Device Human Interface Device Bluetooth Module Micro Controller Motor LCD Display Motor Controller Figure 5.1.1: The Motor System 5.2. The Heating System The heating system included flexible heating elements such as the three Flexible Silicone-Rubber Heating Sheets, a power supply and a temperature sensor. The temperature sensor constantly read the temperature of the extracted honey and fed the data to the MCU, which in turn transferred the data to the android for viewing, as well as made decisions to either increase the temperature of the vat or decrese the temperature. The figure below shows the control loop of the heating system. Micro Controller Temperature Heating Coil Driver Sensor Heating Coil Figure 5.2.1:Heating System Control Loop 84 | P a g e Group 3 5.3. The Wireless Communication System The wireless communication basically consisted of two bluetooth trancievers. One tranceiver was installed on the adroid device and the second was installed on the MCU. The wireless communication system was used to send both data and commands to and from the android device. It was used to control the motor system, and the heating system. All in all it will be the bridge from the adroid system to all of the other systems as seen in the figure below. Heating System Android System Wireless Communication System Weighing System Motor System Figure 5.3.1: Wireless Communication System Hiararchy As you can see this hierarchy includes a weighing system. This system would have been connected it the manner shown, however this system was not added to project due to costs associated with implementing it, both financial and other. In its place once could add the humidity sensor, however that is hardly a system, therefore it was not added. 5.4. The Android System The andoid sytem is composed of basically an android phone. However what makes this a system is the software that will be installed on the android device. The application written for the adroid device will have a GUI that will show the temperature and the humidity data in real time. Also through the application, the user will be able to fully control the honey extractor. The user will be able to turn the motor on and off, as well as start an automatic extraction proccess. 85 | P a g e Group 3 5.5. The Weighing System Included in Final Project) (Optional—Not The weighing system was planned to consist of a wheatstone bridge force sensor and an instrumintation amplifier, the instrumintation amplifier was to be integrated into the microcontroller chip. The wheatstone bridge would have changed resistance based on the force applied by the weight of the honey onto the axle of the honey extractor. The instrumincation amplifier would have been tuned to detect minute changes in weight. The data would be processed by the microcontroller into an appropriate form and decisions would have been made to either continue spinning the motor or stop depending on the differential of the weight change . Figure 5.5.1 shows the control loop of the weighing system. Wheatstone Bridge Forece Sensor Instrumentation Amplifier Motor Motor Controller Micro Controller Data Registers Figure 5.5.1: Weighing System Control Loop 86 | P a g e Group 3 6. Construction Process The figure below shows the full construction process of the automated honey extractor. 1: Specify Parts Read data sheets to verify usefulness Compile a variety of parts to use Agree on one or two components for each system 2: Order Parts Place order for parts Wait for parts to arrive Verify all parts have arrived 3: Test Parts Verify parts are not dead on arrival Return to step 2 if necessary 4: construct mechanical system Construct frame holder Construct motor mount Construct electronics box mount 5: Test sensors Use microcontroller evaluation board to test sensors Create PCB to neatly interface sensors and microcontroller Return to step 2 if necessary 6: incorperate sensors into mechanical system Construct mounting points for sensors Run wires from PCB to each sensor and peripherial device 7: Test system as a whole Initiate a "dry run" with no honeycombs in unit Insert honey combs and run system Tweak microcontroller for optimised results Return to step 2 if necessary Compare results with other honey extractors Figure 6.1 Construction Process Diagram 87 | P a g e Group 3 7. Project Prototype Testing 7.1. Hardware Test Environment Before we built the complete system each component of the future system needed to be tested. To send and receive serial data over Bluetooth, we needed a terminal program and a Bluetooth serial adapter. There are many free applications today on the market designed to test data transmission over a Bluetooth. One of the most popular and reliable applications is BlueTerm. BlueTerm can be downloaded from Google‘s application play store. We used this application to test our Bluetooth. This application is a terminal emulator for communicating with a serial device using a Bluetooth serial adapter. The RFCOMM/SPP protocol emulates serial communication over Bluetooth. Before testing our Bluetooth modules we interconnected Tx and Rx pins. The way it works on is as follows: the data sent from the phone will be pushed to the UART_TX pin, then, since UART_TX and UART-RX pins were shorted, it was transferred to the UART_RX pin, and finally the data was sent back to the phone and appeared on the screen. The application required Android Version 2.1 or later which was compatible with the version on our testing phone. The application was installed on the smartphone before testing. 7.2.1 Bluetooth Data Transfer to Android 7.2.1.1. Phone Preliminary Testing To check data transfer between HC-06 Bluetooth module and Android phone BlueTerm was started on the phone. Pins UART_CTS (pin 16) and UART_RTS (pin 15) were shortened for reasons described in section 4.3.3 ―Integrating the Bluetooth into Circuit‖. The Bluetooth was powered up by connecting the Bluetooth with two wires to a LiPO battery. Next, the phone was wirelessly connected to the HC-06 and we started typing on the application‘s emulator. Characters typed on the emulator appeared on the screen which only happens if the Bluetooth works correctly. Test No. 1. Requirement Procedure Expected Result The Bluetooth shall be Type characters on Characters typed on able to transfer data to the emulator. the emulator appear Android within the on the screen. distance of 1 meter. 88 | P a g e Group 3 2. The Bluetooth shall be Type characters on Characters typed on able to transfer data to the emulator. the emulator appear Android within the on the screen. distance of 10 meters. 3. Make sure that the transmitted data is being transmitted over the correct Bluetooth module. Disconnect the No Bluetooth from the appear power supply. Type screen. characters on the emulator. characters on the Table 7.2.1.1.1 Software Functional Requirements Test Procedures 7.2.1.1. Bluetooth Troubleshooting If the testing data transfer over the Bluetooth were to fails then the device would have had to been troubleshot. First we would have needed to make sure that the powered on Bluetooth is discoverable. If the module is not appearing on the screen then polarity would have been checked by making sure that GND pin is connected to batteries‘ negative terminal and VDD is connected to the positive batteries‘ terminal. If the connection appeared to be correct, the supplied voltage would have been checked with a multimeter to make sure that the correct voltage is supplied to the device. If the voltage is within required specification and no pairing occurs the last thing to check would have been if the voltage supplied was supplied to the correct pins. This can be verified with the datasheet for the RN42 and HC-06 Bluetooth modules. If all of the configurations were checked and appeared to be correct and no pairing still occured then the module would have had to be replaced. In case if the device was able to pair, but was unable to transfer characters to the screen we would have checked the loopback pins‘ connection and whether the correct pins were shorted. 7.2.2 Data Transfer between Android and Development Board over Bluetooth Preliminary Testing After the data transfer testing over Android and Bluetooth was successful, we continued by connecting the microcontroller unit and tested the Bluetooth on the development board. To test data transfer between from the microcontroller to Android we transmitted temperature sensor data. The temperature sensor was connected to the development board and tested before we began the microcontroller data transfer to Android over the Bluetooth testing. To test data 89 | P a g e Group 3 transfer from Android to the microcontroller we connected an LCD display to the microcontroller that displayed the data received on the UART_RX pin of the microcontroller. Test No. Requirement Procedure Expected Result 1. The Bluetooth shall be able to transfer data from microcontroller to Android. Record the temperature applied to the temperature sensor. The data read from the temperature sensor appears on Android‘s emulator. Verify appeared temperature with the recorded temperature. 2. The Bluetooth shall be Type characters on Characters typed on able to transfer data the Android‘s the emulator appear from Android phone to emulator. on the LCD screen. the microcontroller. Table 7.2.2.1: Data Transfer Testing 7.3 Android Application Software Testing The graphical user interface (GUI) software had two types of requirements to meet: functional requirements and non-functional requirements. Variety and large amount of tests helped finding the weak parts of the system and optimize them to reduce the risk of system failure. To ensure that all of the requirements have been met, tests were conducted by all of the group members on their android phone. This ensured that software correctly operates across variety of android versions. Test procedures were written in advance and provided in this documentation. When the Android application was created and preliminary testing was performed successfully, the application testing with the honey extractor was conducted according to these instructions. Functional requirements describe software required behavior in terms of specific activities. Non-functional requirements, in other words quality performance, describe some quality attributes that our software possesses. After performing software tests and comparing outcomes with expected results, we were able to verify whether we built the right system that specifies user needs or not. 90 | P a g e Group 3 Before the team started system testing the automated honey extractor was loaded with fifteen frames filled with honey. This way the team made sure that the system under test meets realistic conditions and works properly with a full load of fifteen frames filled with honey. The automated honey extractor was powered up from a wall outlet. Initial pairing of the Android Bluetooth and Bluetooth module located on the printed circuit board is not part of the software requirement and will not be discussed in this testing procedure. Testing procedures for system‘s functional performance and expected results are described in Table 7.3.1. Test No. Requirement Procedure Expected Result 1. User shall be able to Select start the application. application. the The application opened. is 2. The system shall be able Start the application. The system prompts to automatically turn the the user to turn on the local Bluetooth on local Bluetooth. without exiting the application. 3. The system shall be able Start the application. to connect to a Bluetooth When prompted to connect to a module. Bluetooth device select the ‗Yes‘ button. The phone and the HC-06 Bluetooth module are now connected. 4. The application shall be able to discover new Bluetooth devices in the area. Start the application. When prompted to connect to a Bluetooth device select the ‗Yes‘ button. Select ―Connect a device‖ from the menu then select ―Scan for Devices‖ button on the ―Select a device to connect‖ dialog. The ―Select a device to connect‖ dialog displays available devices in the area. If no new devices were found in the area the dialog displays ―No devices found‖. 5. The application shall be able to pair newly discovered devices with the local Bluetooth. Select a Bluetooth device from the list of discovered devices in the ―Select a device to Confirm that the device was added to the list of paired devices. To confirm go to Settings->Bluetooth 91 | P a g e Group 3 connect‖ dialog. on the Android phone. Enter a pin code when prompted an click Ok. 6. The application shall not allow the user to activate buttons and controls while not connected to the Bluetooth device. Open the application. Try pressing buttons, use the thumb on the slider bar, and observe the humidity and temperature readings. Buttons remain inactive when pressed on, the label above the slider reading Speed(0), and no feedback from the sensors. 7. User shall be able to start the automated honey extractor by pressing the Forward button. Start the system by pressing the Forward button on the graphical user interface of the application. Automated Honey Extractor spinning at default speed in the clockwise direction. 8. User shall be able to start the automated honey extractor by pressing the Reverse button. Start the system by pressing the Reverse button on the graphical user interface of the application. Automated Honey Extractor spinning at default speed in the counterclockwise direction. 9. The application shall be able to prevent the user from rotating the device in the opposite direction unless the Stop button is pressed. Start the motor by pressing the Forward button. While the motor is spinning in the clockwise direction try to press the Reverse button. The motor is spinning in the clockwise direction even if the Reverse button is pressed. 10. The application shall be able to prevent the user from rotating the device in the opposite direction unless the Stop button is pressed. Start the motor by pressing the Reverse button. While the motor is spinning in the counterclockwise direction try to press the Forward button. The motor is spinning in the counterclockwise direction even if the Forward button is pressed. 92 | P a g e Group 3 button 11. The application shall be Press the Forward The able to highlight a button or Reverse button. highlighted in red. in red after the button was activated. 12. The application shall be Press able to deselect button. previously activated button. the is Stop Previously activated button is no longer highlighted on red. 13. User shall be able to manually increase rotational speed of the honey extractor in the clockwise direction. To increase speed Rotational speed of the motor on the increases from 0 to 4 honey extractor start in 1 increment. by moving the thumb of the slider to the right until Forward (4) is displayed. 14. User shall be able to manually decrease rotational speed of the honey extractor in the clockwise direction. To decrease speed Rotational speed of the motor on the decreases from 4-0 in honey extractor start 1 decrement. by moving the thumb of the slider to the left until Speed (0) is displayed. 15. User shall be able to manually increase rotational speed of the honey extractor in the counterclockwise direction. To increase speed Rotational speed of the motor on the increases from 0 to 4 honey extractor start in 1 increment. by moving the thumb of the slider to the left until Reverse (4) is displayed. 16. User shall be able to manually decrease rotational speed of the honey extractor in the counterclockwise direction. To decrease speed Rotational speed of the motor on the decreases from 4-0 by honey extractor start 1 decrement. by moving the thumb of the slider to the right until Speed (0) is displayed. 17. The user shall be able to Start the motor by The stop the honey collector utilizing the sider motor has 93 | P a g e Group 3 by pressing the Stop bar on the graphical gradually stopped. button when utilizing the user interface. While the motor is slider bar. spinning press the Stop button. 18. User shall be able to The data from the view data collected from sensors will appear the local honey extractor sensors. after Bluetooth establishes a connection with the Bluetooth module of the Honey Extractor. The data collected form humidity and temperature sensor is displayed on the screen. 19. The application all allow to the user to toggle temperature between Celsius and Fahrenheit. Recorded temperature readings verified by utilizing the following formulas of temperature conversion Celsius to Fahrenheit: 20. The application shall be able to turn the local Bluetooth off when the application is closed. Celsius selected by default. Record the current temperature reading on the GUI. Select the Fahrenheit radio button and record the new temperature reading. F = C*1.8 +32; C = (F-32)*(5/9). Close the The Bluetooth application by turned off. pressing the Back button on the Android phone. is Table 7.3.1 Software Functional Requirements Test Procedures The testing procedures for the system‘s non-functional requirements such as the graphical user interface operation verification, good system availability and performance, compatibility with at least one version of Android OS and operational longevity are described in Table 7.3.2, as well as the expected results to each testing. Test No. Requirement Procedure Expected Result 94 | P a g e Group 3 1. 2. Graphical user interface Make sure all the GUI features function operation verification. properly by navigating around the application. Good system availability Perform steps listed in Table 7.4.2 and performance 3. Compatibility with at least one version of Android Operating System (OS) version 4.0.3 or later 4. Operational longevity No misleading buttons, user control selections applied in the application. At any point of runtime system‘s responses shall take no longer than 10 seconds Download the The system is up and application on a on the device device running Android version 4.0.3 OS or later Have the system up The system controls and running for at shall be functional least 6 hours. during operational time. The system shall not crash, or shut itself down abruptly at any time. Table 7.3.2 Software Non-Functional Requirements Test Procedures Figure 7.3.1: Hardware Utilized for Preliminary Testing of the Application 95 | P a g e Group 3 7.4. Testing the Motor 7.4.1 Initial Testing After the purchase of the motor, the motor was first tested for basic functionality. It was plugged into a regular wall outlet to see if it turned on. After it did work, it was then connected to other parts of the project. If it were to not work it would have been replaced and this test would have been done again with the new motor. 7.4.2 Intermediate Testing After the motor has passed the initial testing, it was connected to the Speed Control Unit, and to the MCU, however it was not be mounted onto the extractor yet. This testing includes a: Check connection between motor and power supply. Check connection between MCU and motor Check if the Manual Speed Control Unit is able to control the speed of motor Check if the motor can be controlled wirelessly. Check lowest RPM of motor Check highest ―safe‖ RPM of motor Check the autonomous motor controlling sequence The motor was not mounted onto the extractor until all these checks produced positive results. 7.4.3 Final Testing After passing both the initial and the intermediate testing, the motor was mounted onto the extractor in its‘ appropriate position, and after testing all systems that involve the motor we observed how the extractor behaved, we decided that the motor will stay in that position, however had it not behaved the way we wanted it to it would have been mounted in a different manner depending on how stable the extractor was. (Refer to ―Mounting the Motor‖ section for more details.) Also after deciding the exact positioning of the motor, we assembled the entire extractor and tested at which motor speed the honey was extracted the most efficiently and for how long the motor needed to be spinning in order to extract the honey. The obtained data went into improving the autonomous motor controlling sequence. 7.5. Testing the Heating System 7.5.1 Testing the Heating Element 7.5.1.1 Initial Testing After the purchase of the heating element it underwent a basic functionality test, to check its basic heating functionality. It was connected to a 110-120 AC power 96 | P a g e Group 3 supply and checked if the elements worked as advertised. After the elements appeared to be heating up the way they are designed to do, they were then connected to other parts of the project such as the temperature sensor and the microcontroller. (For further testing information check ―Testing the Entire Heating System‖ section) 7.5.2 Testing the Entire Heating System 7.5.2.1 Initial Testing Each individual part of the heating system underwent its‘ testing first (refer to each section for detailed testing plan for each part). After each individual part was tested and confirmed to be functioning, the testing of the heating system went to the next stage. 7.5.2.2 Intermediate Testing After connecting the heating elements to other parts of the project, these are the tests that were conducted: Check if there is a connection between the power supply unit and the heating elements Check if there is a connection between the temperature sensor and the MCU Check if the MCU is able to control the temperature of the heating elements based on the readings received from the temperature sensors Check minimum temperature Check maximum ―safe‖ temperature Check if the heating system can work autonomously 7.5.2.3 Final Testing After passing both the initial testing and the intermediate testing, the heating system was installed onto the extractor. After its‘ installation, the heating system was rechecked and observations were made. After the entire extractor was assembled, the extractor was loaded with honey frames and all systems were checked. During this stage of testing, the optimal temperature in order to increase the honey flow was recorded and programmed into the automatic extraction sequence. 7.6. Testing the Sensors 7.6.1. General Sensor Testing Ideology Before the sensors were implemented into the design, each sensor was tested through a series of tests to verify their functionality according to the specifications. First of all, every sensor had to be checked if it worked properly. Then, the sensors were verified if they work according to the datasheet graphs and other data. For example, to verify whether the temperature sensor worked, 97 | P a g e Group 3 an environment of fluctuating temperature was created and the output of the sensor was read for any differences. Had the temperature sensor been a thermistor, for example, the output resistivity would have been according to the temperature changes. The resistivity could have been simply measured by a resistance meter. The rest of the sensors were tested in a similar fashion. Before any tests all sensors had to be verified for functionality through monitoring output changes in either voltage, resistance, or current according to a specific sensor. A diagram of the general sensor testing ideology can be found in the figure 7.6.1.1 Figure 7.6.1.1: General Sensor Testing Ideology 98 | P a g e Group 3 7.6.2. Weight Sensor Test This test was never completed due to the fact that a weight sensor was never implemented, however if it had been implemented, the following steps would have been taken. Before the weight sensor were to be implemented into the entire design, first, it would have had to pass a series of standalone tests as described in the general sensor testing ideology section. Before going through serious tests, first, the weigh sensor would have had to pass a simple test which checks if the sensor is functional or not. The idea of this test is as follows: 1. 2. 3. 4. Connect the sensor outputs to a voltage amplifier Connect a voltage meter from the voltage amplifier Apply some weight to the weight sensor The resistance should decrease as more weight is applied or voltage should change accordingly If the sensor were to pass the above third step, most likely, the unit is functional and is not a defective one. If the FMT donut shaped weight sensor were to be acquired, the connections are shown below in Figure 7.6.2.1. Figure 7.6.2.1 – Wiring Schematic of FMT Sensor Permission granted from Meas-spec 99 | P a g e Group 3 As can be observed from the above figure, the FMT sensor operates using the Wheatstone bridge principle. The wires numbered 4 and 2 (figure 7.6.2.1) – the signal wires are the ones that will be connected to the microcontroller. Wires 1 and 2 are just excitation inputs necessary for the signal voltage differences to occur when weight is applied or removed from the sensor. The idea of the second test would have been to perform a precise test – verify the measured values correspondence with the actual weight within a degree of error according to the sensor‘s specifications. This test would have been performed according to the following procedure: 1. Connect the outputs of the sensor to the breadboard 2. Feed the outputs through a voltage amplifier 3. From the voltage amplifier connect the wires to the microcontroller analog inputs 4. Write a code that will convert the voltage into actual weight using the formulas in the datasheet 5. Write necessary code for establishing a wireless connection between the android device and the microcontroller 6. Use the android device as a monitoring device for the current test to read the weight applied to the sensor values 7. Compare the reported values from the sensor with the actual weight applied to it Once the weight sensor passed all the tests and showed positive results, the next and most important test would have been to integrate it into the system and test it again. Once the weight sensor was to be mounted into the honey extractor it would have been connected to the development breadboard and then to the microcontroller, the microcontroller would have communicated with an android device and reported the measured data from the sensor. The weight sensor is an analog weight sensor. The output of the weight sensor should have been amplified on the breadboard and then connected to the microcontroller‘s analog input. Test Description Outcome Comments The weight sensor is Does the weight of the If the weight does not mounted or frames match? match, was the frame implemented into the holder weighed correctly system. The honeycomb before inserting it to the frames full of honey are extractor? Does the weighed before they are frame holder have inserted into the support from the body of extractor. The weight is the extractor that directly read from the sensor affects its weight through an android measured by the device. sensor? 100 | P a g e Group 3 The extractor is on, the Does the weight sensor frames are spinning. register the weight loss? Could the weight loss ratio be calculated or does the sensor report false values, i.e. jumps from the steady decreasing values? Before the sensor is completely tested, the system cannot rely on sensor‘s information when to stop the process. Once the frames are rotated for a long enough time, in order to verify that all of the honey is out of the frames, the system is stopped. The weight of the empty frames along with the frame holders is measured and recorded through the weight sensor. The frame holders‘ mass is subtracted from that value. Then the frames are pulled out of the system to be weighed on a different scale Repeat the process with different sent of honeycomb frames. Is the system stable while it is spinning? The jumps from the steady decreasing values could be caused by system instability. Work on system stability and balance should be done if that is the case. Is the value reported by The weight reported by the sensor at its lowest the sensor at this point throughout the entire of time should be at its process? lowest. If that is not the case, the sensor‘s calibration could be off and needs recalibration, or the above suggested problems could be still present in the system. Do these values match? If the values matched for previous tests, the weight sensors calibration might be off. Possible solution – recalibrate the sensor. Is this test similar to the previous one? Do the values match within a degree of error from the sensor and from the standalone scale? The tests should be repeatable within a degree of error that could be calculated from the sensors accuracy specification from table 7.6.2.1 Table 7.6.2.1– Weight Sensor Final Test Steps 101 | P a g e Group 3 7.6.3. Temperature Sensor Test The MLX90614 infrared temperature sensor is factory calibrated with a digital PWM and SMBus (System Management Bus) output. This made it easy to test and also ready for testing. The temperature sensor was tested before it was implemented in the system. According to the general sensor testing ideology section, the temperature sensor had to pass a series of standalone tests. Before going through those tests, a simple test to check sensor‘s functionality was performed. The steps of this test are as follows: 1. Connect the sensor to the breadboard 2. Connect a voltage meter to the corresponding pins (refer to figure 3.2.1.1.1 and table 3.2.1.1.3 for pin description) 3. Change the temperature of the sensor 4. Monitor voltage differences as the temperature of the sensor is changed After the sensor passed the above third step, most likely, the unit was functional and was not a defective one. The idea of the second test was to perform a precise test – verify the measured values correspondence with the actual temperature within a degree of error according to the sensor‘s specifications. This test was performed according to the following procedure: 1. Connect the outputs of the sensor to the breadboard 2. Feed the outputs through a voltage amplifier 3. From the voltage amplifier connect the wires to the microcontroller analog inputs 4. Write a code that will convert the voltage into actual weight using the formulas in the datasheet for the microcontroller 5. Write a necessary code for establishing a wireless connection between the android device and the microcontroller 6. Use the android device as a monitoring device for the current test to read the weight applied to the sensor values 7. Compare the reported values from the sensor with the actual weight applied to it Once the temperature sensor passed all of the tests above and showed positive results, the next and most important test was to integrate it into the system and test it again. Once the temperature sensor was mounted to the honey extractor it was connected to the development breadboard and then to the microcontroller, the microcontroller communicated with an android device and reported the measured data from the sensor. The temperature sensor is an analog temperature sensor. The output of the temperature sensor was amplified on the breadboard and then connected to the microcontroller‘s analog input. 102 | P a g e Group 3 Test Description The temperature sensor is mounted or implemented to the system. The heater should be functional at this point, but not yet controlled using the temperature sensor. Temperature is measured using a regular thermometer not used in the design for verification purposes. The temperature is read from the sensor through an android device. The extractor is on, the frames are spinning. Measure temperature using both sensors, the infrared sensor and a regular thermometer for verification purposes. Before the sensor is completely tested, the heater control cannot rely on sensor‘s information. Control the heater by manually increasing the current. Heat the system to the maximum temperature point and measure the temperature again by both sensors. Thermometer is used for verification purposes again. Repeat the test again after a while to make sure the sensor remains calibrated. Outcome Do the temperatures match read from both sensors? Comments The infrared temperature sensor might be off due to the spinning of the frame holders. Compare the Make sure the temperatures reported temperature by both sensors. does not point spinning part extractor. Compare the temperatures reported by the infrared temperature sensor and the thermometer. infrared sensor to the of the The temperature accuracy of the infrared sensor should remain throughout a wide range temperature change. Make sure the sensor is not pointed directly to the heating element. Make sure the results are repeatable compared to the initial test. Temperature differences should not exceed the marginal error for stable and reliable system performance. Table 7.6.3.1: Temperature Sensor Final Testing Procedure 103 | P a g e Group 3 Table 7.6.3.2: IR Temperature Sensor Electrical Specifications Permission granted from Melexis 7.6.4. Humidity Sensor Test The humidity sensor as well as the temperature sensor, was tested before it was implemented in the system. According to the general sensor testing ideology section, the humidity sensor had to pass a series of standalone tests. Before going through those tests, a simple test to check sensor‘s functionality was performed. The general testing procedure steps of this test are as follows (note: refer to figure 7.6.4.2 and explanations of the capacitance-to-frequency circuit): 1. 2. 3. 4. 5. 6. Connect the humidity sensor to the breadboard Connect the voltage pin to a 5 volt power supply Connect the data pin to a voltage amplifier if necessary Connect the data pin to the voltmeter Connect the ground pin to the second node of the voltmeter Read the voltage as the humidity environment changes 104 | P a g e Group 3 Figure 7.6.4.1: Humidity Sensor Environmental Test System Diagram Permission granted from Honeywell Figure 7.6.4.2: Connecting Humidity Sensor to the Microcontroller Permission granted from Sensirion 105 | P a g e Group 3 Since the HCH-1000-002 humidity sensor is capacitance type sensor, step five above of the general testing steps procedure could not be applied without special circuitry. There are two common circuitry additions used in order to be able to convert the capacitance changes to the actual humidity changes [2]. The first one is called a capacitance-to-frequency conversion circuit as shown in Figure 7.6.4.2 below: Figure 7.6.4.3 – Capacitance to Frequency Circuit Permission granted from Digi-Key For the above capacitance to frequency circuit, a 555 timer was used. It was a simple integrated circuit device and is very small in size (source). Once this circuit was applied, a small program for the microcontroller was written to count the frequency changes and output the relative humidity percentage measured by the sensor. 106 | P a g e Group 3 The second method to derive the relative humidity measurements was convert the capacitance changes from the sensor to voltage differences. This was generated by two 555 timers (source). Figure 7.6.4.4 below shows the circuit: Figure 7.6.4.4 – High Accuracy Capacitance to Voltage Circuit Permission granted from Digi-Key After the sensor passes the third step, most likely, the unit was functional and was not a defective one. The idea of the second test was to perform a precise test – verify the measured values correspondence with the actual humidity levels within a degree of error according to the sensor‘s specifications. This test was performed according to the following procedure: 1. 2. 3. 4. 5. 6. Connect voltage pin to the 5 volt output of the microcontroller Use the 555 timer chip to convert capacitance to frequency/voltage Connect the data pin to the analog input of the microcontroller Connect the ground pin to the ground of the microcontroller Before proceeding to step 6 read how to calibrate the sensor section Write the necessary code for the microcontroller to count and convert the frequency changes outputted by the sensor to actual humidity levels using the calibration technique provided in the humidity sensor calibration section. 7. At this point the wireless link between the microcontroller and the android device should be established 8. Necessary code written for the android device to receive data from the microcontroller about the humidity levels should be functional at this point 107 | P a g e Group 3 9. Compare the results with a different complete humidity meter device. Once the humidity sensor passed all of the tests above and showed positive results, the next and most important test was integrate it into the system and test it again. However this after testing this sensor we realized that this sensor was not for us, so we got a different one and used a similar testing procedure and implemented it instead. Once the humidity sensor was mounted to the honey extractor it was connected to the development breadboard and then to the microcontroller, the microcontroller communicated with an android device and reported the measured data from the sensor. The humidity sensor is an analog humidity sensor. The output of the humidity sensor should be amplified on the breadboard and then connected to the microcontroller‘s analog input if an amplifier is necessary, however it was not. Test Description Outcome Comments Mount the humidity Do the humidity levels Testing the humidity sensor to the honey match? inside the system should extractor. Connect it be any different from as similarly as described in testing it alone. the previous test. Read Make sure the sensor the values from the maintains its accuracy android device. throughout a long period Measure the humidity of time. sensor with a different humidity meter. Table 7.6.4.1: Humidity Sensor Final Testing Procedure Once all the steps of the testing were done the sensor were compared to the following graph below (Figure: 7.6.4.4). Figure: 7.6.4.5: Humidity Sensor Performance Permission granted from Sensirion 108 | P a g e Group 3 Figure: 7.6.4.6: Pins of the Humidity Sensor Permission granted from Sensirion 7.6.4.1. Calibrating the Humidity Sensor Tricks can be done to reach near 0% and 100% humidity at home or lab environment [1]. To do this, the following things were needed: Paper towels Rubber band Plastic bag To reach 0% humidity, we put the paper towel in an oven for an hour. This dissipated all the moisture from the paper. Then, put the paper towel together with the sensor in the plastic bag. Waited for the sensor to reach the lowest value and recorded this value. We referred to the datasheet of the humidity sensor for the operation range specification. For example, the HCH-1000-002 sensor‘s operation range is about from 10% RH to 95% RH. To reach near 100% humidity, we poured boiling water on the paper towel and put it in the bag along with the sensor. Made sure the terminals did not contact the moisture of the paper towel. Recorded the highest value read by the sensor. 7.7. Circuit board testing Once the circuit board has been assembled, it needed to be tested in order to confirm functionality. Testing of the circuit boards first consisted of an optical inspection. The optical inspection consisted of simply looking at the solder joints through a magnified lens. Things to check for during this process included raised pads on the solder joint, shorted pad knees, and shorted pads. Figure 7.7.1 shows an example of a bad solder joint. A connection may have been possible 109 | P a g e Group 3 on this joint, but it may have broken in the event of a shifted chip or other mechanical disturbance. Another test that was done during the optical inspection was inspection of proper placement of the parts. After the optical inspection was done, an electrical inspection was required. A digital multi meter was used to check for shorts, and to make sure that there were open circuits where appropriate and closed circuits where appropriate. Once this test was passed, the board was powered on with a current limited supply. The supply was slowly cranked up to allow for more current to be let into the system. Once the voltage level has stabilized to operating voltage the power supply on the board was assumed to be functional. The next step was to test the functionality of the microcontroller. Figure 7.7.1: Example of a raised pad on the solder joint 7.8. Micro Controller Testing Once all of the components were hand, they had to be tested on the microcontroller unit. The testing was done on a development board, more specifically the FreeSoC (Figure 7.8.1). As you can see from the figure, all of the pins were broken out so that they could easily be connected to using male 110 | P a g e Group 3 headers. This allowed for an ease of implementation of our sensors and other interface devices. Figure 7.8.1: FreeSoC microcontroller, an open source implementation of Cypress's PSoC 5 microcontroller 7.9. Human Interface Device Testing The human Interface device was the first peripheral unit that was tested. With the functionality of this unit verified, interface to other devices was possible. The LCD screen displayed information from the sensors, and the touch buttons allowed the user to interface with the peripheral devices. The testing was done using the FreeSoC board. The seven pins required to interface to the LCD were plugged in, and the buttons with their pull up or pull down resistors were connected. The first test was to verify the screen is outputting characters. This was done by a project written for the PSoC that scrolls text across each pixel in the LCD. The 111 | P a g e Group 3 second test was to verify the functionality of all of the buttons. This was done by writing a simple project that showed which button is pressed. After the human interface device was tested, then other parts of the system were ready to be tested as well. 7.9.1 Temperature Interface Test and Calibration The temperature sensor‘s interface was a more difficult sensor to test. The connections to the MLX90614 were made as shown in a figure previously and the appropriate signals were sent across the connections. An oscilloscope was used to measure the signal coming off of the sensor. An example of how to measure the temperature along with the equation to compute temperature is shown in figure 7.9.1.1. The calculated temperature was compared with a measurement taken from a hand held infrared temperature sensor. Figure 7.9.1.1: Example of Temperature Sensor Reading Using the Melexis MLX 90614. Taken with permission from Melexis 112 | P a g e Group 3 7.9.2 Humidity Interface Test and Calibration The humidity sensor also presented a challenge to test. The sensor that was chosen was a passive capacitive response sensor. This means that its capacitance changed with humidity and temperature. There were two possible options to measure this feedback. The first is to use the PSoC‘s Cap Touch module. The built in module was simply placed into a test project and the analog response (capacitance) was displayed on the LCD. The values measured were then compared to actual values measured for another humidity sensor. The second way to test the capacitance was to set up a simple RC circuit. A pulse will load the capacitor, and then be removed. The time that the capacitor drains determined the capacitance due to the formula shown in figure 7.9.2.1. These values were also compared to values obtained from form another humidity sensor. Figure 7.9.2.1: Ideal equation for capacitive decay. R is resistance in units of Ohms, C is capacitance in units of Farads, t is time in units of seconds, and V is voltage in units of volts 7.9.3 Weight Sensor Interface Testing This test never occurred, however if had implemented a weight sensor its‘ interface testing would have been done in the following manner. The weight sensor chosen consisted of a Wheatstone bridge. The best way to test resistivity on the Wheatstone bridge would have been to use an instrumentation amplifier. The instrumentation amplifier would have been preferred over other amplifiers because of the high input impedance. This high impedance measurement would have insured that the measuring device doesn‘t interfere with the resistive Wheatstone bridge. The Wheatstone bridge would have been implemented using the PSoC‘s integrated Operational Amplifiers. Off chip resistors would have been used to tune the amplifiers to a reasonable gain. The signal would then have been sent to a high resolution analog to digital converter, where the signal is digitized. The signal would then have been read and calibrated using measured values for actual weight and measured response values. These values would have been fit to a linear model of the sensor‘s response 113 | P a g e Group 3 7.9.4. Motor Controller Interface Testing The motor controller was a variable frequency drive motor controller. This motor controller was only for alternating current motors because it uses digital signals to recreate an alternating current operating at different frequencies based on motor speed. The motor controller used a serial communication protocol. To test the controller, commands were sent to the unit while an Alternating current was connected to the input of the device. An oscilloscope was connected to the output via a high voltage probe. A high voltage probe was used so the oscilloscope was not to be damaged. The output signal was measured and verified for each different motor controller command. The LCD screen displayed the motor power and theoretical frequency. The input buttons were used to select the different operating frequencies. After the commands appeared to correlate to the frequencies correctly, the AC motor itself was connected to the motor controller. The motor was also cycled through the frequencies to test if was capable to move. The motor was then subjected to a ―burn in‖ period. This means that the motor was run at full power for an hour. This time allowed the motor to warm up and verify the motor was not dead on arrival. After the burn in a load test was performed. A mechanical load was placed on the motor so that higher current was run through the motor. The motor was then subjected through a sweep through the various operating frequencies so that each motor power was tested under load. After the motor passed all of these tests, then the functionality was confirmed. 7.9.5. Bluetooth Interface Testing The Bluetooth interface was the most difficult part of the project to test. The interface to the microcontroller was a simple RS232 serial link. The link was created with the PSoC‘s serial module. To test the communication between the units, a hand shaking packet was sent. Upon powering on the Bluetooth on the Android device, a packet was sent to the Bluetooth module to verify connection. The microcontroller was waiting for the packet, and when it received it, a handshake packet was sent back through the Bluetooth module back to the phone to verify the connection. The LCD display displayed which state the microcontroller was in; awaiting connection, or connected. Once connection was established, the microcontroller sent packets containing the sensor information to the android device. The packets were processed by the Android device and decoded so that the information could be viewed on the screen. The microcontroller was awaiting an emergency stop command from the android device in case the motor or the heater needed to stop functioning. The functionality of this feature was also tested. A summary of the entire micro controller and human interface testing can be seen in the figure 7.9.1. 114 | P a g e Group 3 LCD Display Wire up and run test program Write program to display input information Human Interface device Create circuit with buttons and pull up resistors Use display to verify buttons are pressed Create program to scroll through various sensor interface screens Tempearature Sensor wire temperature sensor and create test module use oscilloscope to obtain signals from unit use equations to calculate theoretical temperature use other thermometer to verify results use microcontroller to process sensor input display sensor calculated sensor input onto LCD Humidity Sensor wire sensor Use PSoC's Cap Sense to output capacitance to screen Weight Sensor wire sensor and create instrumentation amplifier in PSoC use oscilloscope to read output from amplifier Using different weights, plot function of weight vs. responce Wire motor controller to PCB Verify functionallity with oscilloscope wire motor an test functionallity load down motor and test functionallity connect motor to frame holder wire bluetooth module to PCB Write handshaking program on MCU and Android Send hardcoded data to Android device from MCU Send hardcoded data to MCU from Android device send sensor matrix information to Android device display sensor information on Android device using calculated function, output weight found to LCD screen Motor Controller Android interface use Android device to send commands to the MCU Figure 7.9.1: Testing Summary 115 | P a g e Group 3 7.10. Emergency STOP Testing Another feature that had to be tested was the emergency stop circuit. This circuit was essential to the system as it added a level of safety to the unit. Without this circuit, the system would have been unsafe to use. Testing of this circuit was simple. First the motor was powered on. Then the emergency stop switch was pressed to stop the motor. When the motor came to a complete stop, then the next phase was performed. The next phase was to test the reset switch. Once the motor has safely come to a stop, then the reset switch was pressed. When the motor returned to power, the emergency stop circuit was verified as functioning. 8. Administrative Content The team had two semesters to design and implement the working prototype of the Automated Honey Extractor and demonstrate the prototype to a committee of a three to five professors at the end of the second semester. During the first semester the team members agreed to split responsibilities and work on their individual research. Project‘s design and development progressed throughout the first semester on weekly basis during team‘s meetings. The main focus was given to brainstorming ideas about system design, research about components and their proper integration into the system, and course required documentation. Good project management is a major factor in success of any project. In order to successfully build the automated honey extractor, allocated timeframe had to be broken down into milestones. Every milestone included an extra allocated time in case if problems arise during development process. When no problems occurred during previous phase the team proceeded with their work towards the next task and had more time to complete it. The team had total of 28 weeks to complete and present their working prototype to the committee. 8.1 Project Milestones During the first twelve weeks of the Senior Design I course the team members collaborated with each other on high level design of the project, software and its‘ libraries, what parts and part numbers were best to be used based on specifications and their cost, they also identified possible problems during the design phase and found appropriate solutions and completed system testing. Research took large amount of time. On the Android software development side the research included the identification of the most suitable language and platform for establishing wireless communication with the automated honey extractor. Once the language and platform were selected the class structure, libraries research, and GUI design 116 | P a g e Group 3 begun. On the hardware side the research included research about components, components‘ specifications, mechanical parts design, and related software for hardware design. Table 8.1.1 depicts critical milestones of the project and allocated timeframe for their completion during the first semester. Table 8.1.1: Senior Design I Milestones During the second semester the team worked on building the systems‘ working prototype. Ordering parts was the most critical milestone. Without major parts the team was not able to work on preliminary testing to ensure their proper work. Ordering parts was the very first milestone and was done promptly. Unlike with Android software development no hardware development and testing were possible until later in the semester when parts were received. Second milestone was the designing and ordering of the printed circuit board. It took about four weeks to design the printed circuit board and two weeks to receive it. Parts were tested on daily basis as they were received. Testing took large amount of time. This phase is labeled as Preliminary Testing and can be visible in Table 8.1.2 Senior Design II Milestones. In this phase we needed to make sure that every part and component of the system that we received was functional before it could be integrated in the system. Some parts were defective and needed reorder. Once all the parts were tested successfully, the team was working on integrating the parts into the system. On the Android development side the functionality of all the controls was tested on available to the developer hardware. By the time the whole system was assembled the Android application was fully tested and 117 | P a g e Group 3 functional. Android and microcontroller developers worked closely together to develop seamless communication between the two devices. When Android development and microcontroller software were completed, and all the parts were received and integrated into the system, the testing phase begun. Testing was a crucial part of system development. During that period of time some problems occurred. Some parts required reorder and replacement. The team worked around the hours to resolve the issues. All issues were resolved and the team was able to present the working prototype to the committee on the designated day successfully. Table 8.1.2 depicts critical milestones and allocated time for their completion during the second semester. Table 8.1.2: Senior Design II Milestones 118 | P a g e Group 3 8.2 Budget & Financing 8.2.1. Expected Costs The table 8.2.1.1 shows the list of parts that were purchased and their respective prices. Part Cost Mechanical Parts $400.00 Humidity Sensor $14.03 Infrared Temperature Sensor $19.12 Motor $59.04 Motor Controller $85.48 Power Supply $19.99 Printed Circuit Board $84.99 Electronics $120.12 BlueTooth Module $10.60 Heating Element $102.72 Valve $15.00 Total $887.09 Table 8.2.1.1: Bill of Materials 8.2.2 Financing Financing for this project was provided by the Boychev family. The Boychev family covered costs up to one thousand dollars ($1000), anything over that would not have been covered by the Boychev family. If the production of the Automated Honey Extractor were to cost more than what the Boychev family was financing, the remainder would have needed to been covered by the senior design group, since they did not manage to complete one of the core 119 | P a g e Group 3 requirements set by the Boychev family. However since the project was completed within budget, all of the costs were covered by the Boychev family. The device produced by the senior design group, after completion, now belongs to the Boychev family. The students that used their own parts in order to build the device have been compensated. 8.3 Acknowledgements Throughout the process of planning the project our team received advice from a few individuals who have experience from either an electrical background and/or mechanical field background. We value the opinions and the advices from these individuals and we try to give credit for their assistance in this project by mentioning their names and areas we have received advice in or received help with the process of constructing the project in this section of the paper. Assistance from our advisors is not limited to only the thinking process. Some assistance was received in the actual construction process. Things like welding the parts together was done by certified welders who are, in fact, part of the group of the advisors. Microflex Inc.: provided the team with the necessary metal as well as welded the main components of the project. Dr. Richie: general advice received about the project. Dr. Richie guided the team in the right direction by giving his opinion on what things or options should be added or left out in the project, which things were practical for the team and which things were not feasible. Peter Boychev.: advice received in the mechanical area. Also assisted in welding and other mechanical related construction process. Dmitriy Boichev.: another advisor who assisted the team throughout the thinking process in the mechanical construction area. Also assisted the team in welding and other mechanical related process of construction. Dr. Gary Stein: Doctorate in Computer Engineering assisted in microcontroller programming and Android interface. Previous experience in construction of robotic platforms, as well as sensor interface from various types of sensors Jonathan Mohlenhoff: MS in Electrical Engineering. Expert in microcontroller programming. Well versed in several micro controllers including Cypress‘ programmable system in chip family. Sergey Retinskiy: assisted the team with welding the mechanical parts. The Robotics Club at UCF: provided facilities and tools which were used to build the project. Also provided minor parts that were implemented in the project. 120 | P a g e Group 3 8.4 Facilities and Equipment Building and assembling the honey extractor required special facilities and equipment as well as qualified personnel for some parts of the construction process. Open spaced facilities with appropriate ventilation and safety requirements were used. Some of the most important pieces of equipment that were used in the project construction were: Portable welding station along with the welding materials Welding mask Grinder Machines designed for bending metals Machine designed for cutting metals. The welding station was mainly used to weld the rods to the axle and for other mechanical parts such as the frame holder and the vat. Most of the welding and other mechanical work was done in privately owned facility with privately owned equipment. Welding work was done by several certified welders who also assisted the team and gave advice. Another facility owned by Microflex Inc. was used for mechanical construction related work. Another facility that was available for the group to use was the Robotics Club at the University of Central Florida‘s lab. This lab contained a wide variety of electrical test equipment including but not limited to: Soldering stations Power supplies Oscilloscopes Various electronic components. This facility also contained several machines that aided in the mechanical construction of the honey extractor. The machines included but were not limited to: Band saw Drill press 3-D printer Computer numerically controlled mill 121 | P a g e Group 3 Appendix A: References A-1. Works Cited [1] Markal. "Discovering Arduino and Fascinating World of Electronics." Starter Kit RSS. Starter Kit, 11 Oct. 2010. Web. 27 July 2013. [2] Taranovich, Steve. "Humidity Sensors and Signal Conditioning Choices." DigiKey. Digi-Key Corporation, n.d. Web. 27 July 2013. <http://www.digikey.com/us/en/techzone/sensors/resources/articles/humidi ty-sensors-and-signal-conditioning-choices.html>. [3] White, and Landis W. Doner. "Honey Composition and Properties." – Beesource Beekeeping. Bee Source, n.d. Web. 27 July 2013. <http://www.beesource.com/resources/usda/honey-composition-andproperties/>. [4] Roving Networks. ―Bluetooth Data Module Command Reference & Advanced Information User‘s Guide‖.[Online]. Available: www.rovingnetworks.com/files/resources [5] Android.com. ―Bluetooth‖ [Online]. Available: http://developer.android.com/guide/topics/connectivity/bluetooth.html A|Page Group 3 A-2. Email Requests B|Page Group 3 C|Page Group 3 D|Page Group 3 A-3. Email Permissions: E|Page Group 3 F|Page Group 3 G|Page Group 3 H|Page Group 3 I|Page Group 3 J|Page Group 3 K|Page Group 3 L|Page Group 3