1
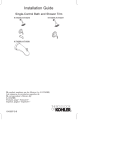
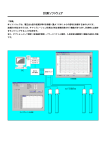
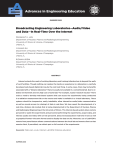
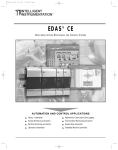
MATS-2010SA Dynamic Hysteresisgraph
USER’S MANUAL
AUTO TEST SYSTEM OF
MAGNETIC MATERIALS
MATS-2010SA Dynamic Hysteresisgraph
User Manual
Contents
1. Forword ………………………………………………………………… 1
2. MATS Profile ………………………………………………………… 1
3. MATS - 2010SA Composition ……………………………………… 2
4. MATS – 2010SA Functions ………………………………………… 2
4-1 Product Profile …………………………………………………… 2
4-2 Main Features …………………………………………………… 3
4-3 Software Functions ……………………………………………… 4
5. Hardware Technology Parameter …………………………………… 5
5-1 MATS – 2010SA Dynamic Hysteresisgraph ………………… 5
5-2 PC5012 A/D Card ………………………………………………… 6
6. Major Technical Indices ……………………………………………… 6
7. System Installation and Setup ……………………………………… 6
7-1 Application Environment ………………………………………… 6
7-2 Computer Configuration ………………………………………… 6
7-3 Install Operating System ………………………………………… 7
7-4 Install Video Adapter Driver …………………………………… 7
7-5 Full Installation of Microsoft Office……………………………… 7
7-6 Install Printed Driver …………………………………………… 7
7-7 Install and Registration of SMTest ……………………………… 7
7-8 Install PC5012 Card Driver ……………………………………… 8
7-9 Set up the compatibility of Application Program …………… 10
7-10 System Installation Precautions ……………………………… 11
8. MATS – 2010SA Application Details ……………………………… 12
8-1 SMTest Software Main Interface ……………………………… 12
8-2 AC Test Function ……………………………………………… 13
8-3 SMTest Software File Operation ……………………………… 17
9. MATS – 2010SA Panel Operation ………………………………… 19
10. Troubleshooting …………………………………………………… 20
MATS-2010SA Dynamic Hysteresisgraph
User Manual
1
1. Foreword
Thank you for purchasing MATS-2010SA Dynamic Hysteresisgraph.
Please carefully read user manual before equipment put into operation. Partial
contents in the user manual (version 1.0.1) and actual situations of the product
subject to change without notice, please obtain related product information from
our website.
2. MATS Profile
MATS is an English abbreviation for AUTO TEST SYSTEM OF MAGNETIC
MATERIALS.
MATS is an automatic measurement equipment composition under computer
control and applied for accurate measurement on magnetic characteristic
parameters of various magnetic materials.
MATS - 2010 is a series of MATS. Due to different categories of materials
measured, MATS - 2010 series can be divided into four parts: MATS - 2010H
Static Hysteresisgraph, MATS - 2010SD Static Hysteresisgraph, MATS - 2010SA
Dynamic Hysteresisgraph and MATS - 2010M Dynamic Hysteresisgraph. Every
part can independently complete respective functions, and can also be freely
combined together to satisfy test requirements of different users.
MATS
contain
two
separate
software
packages:
permanent
magnetic
measurement software HMTest and soft magnetic measurement software SMTest.
Permanent magnetic measurement software HMTest shall work with MATS 2010H, soft magnetic measurement software SMTest can separately work with
MATS - 2010SD, MATS - 2010SA and MATS - 2010M.
The user manual only applies to MATS-2010SA Dynamic Hysteresisgraph, for the
functions of other equipment, related materials or user manuals, please visit our
website.
2
3. MATS - 2010SA Composition
MATS - 2010SA Dynamic Hysteresisgraph block diagram see Fig.3-1, program
control source, power amplifier, current voltage sampling and range control
integrated into one instrument to enable the connection among different functional
modules free of manual connection by users, which greatly improves the reliability
of instrument. High speed A / D conversion is completed through one PCI card
installed in the computer, mainframe computer connected to instrument through
three cables: one RS232 interface line, two high-frequency signal connector
wires.
Fig.3 - 1 MATS - 2010SA Block Diagram
4. MATS - 2010SA Functions
4-1 Product Profile
Automatic measurement on hysteresis loop of soft magnetic material under
dynamic
(AC)
condition,
accurate
measurement
on
dynamic
magnetic
characteristic parameters such as amplitude permeability µa, looss angle δ, iron
loss Pc, remanence Br and coercive force Hc.
Windows measurement software applied simply. It conforms to China
National Standards GB3658 - 83, GB5026 - 85 and GB9632 - 88,
MATS-2010SA Dynamic Hysteresisgraph
User Manual
3
industry standard SJ / T10281 - 91 and international standard
IEC60404 - 6.
Analog source (bridge), frequency indicator, ammeter, voltmeter and wattmeter
are replaced through computer control and high speed A/D sampling, entire
testing process automatically completed.
4-2 Main Features
⑴ Testing sample varieties: soft magnetic ferrite, permalloy, amorphous,
amorphous and nm crystal.
⑵ Test sample shapes: annular, E and U shapes.
⑶ Test samples with closed magnetic circuit can be directly winded and
measured on samples.
Sample, magnetizing coil(N1)and measuring coil(N2)
form a no-load transformer.
⑷ Non-inductive resistance connected on magnetizing coil loop to determine
magnetizing current and magnetic field intensity through the measurement of
pressure drop on non inductive resistance.
⑸ Magnetic induction obtained through digital integration of coil measuring
voltage, magnetic induction peak value locked through digital feedback, magnetic
induction lock precision 0.5%.
⑹ Power source and sampling amplifier integrated into a casing with simple
interface: one RS232 interface connected to the computer, two way voltage alarm
connected to high speed A / D card.
⑺ Different power sources can be selected according to different test
requirements: 1kHz ~ 300kHz or 500kHz, 5kHz or 10kHz ~ 100kHz, or other
frequency ranges customized.
⑻ Measuring dynamic hysteresis loop through volammetry and digital integration
can accurately measure dynamic magnetic characteristic parameters such as µa,
δ, Pc, Br and Hc, and calculate µ’, µ’’, µL, µR, Q and AL, etc.
4
⑼ Automatic and continuous measurement up to 255 testing points, the testing
time of every testing point is about 12 seconds, fixed-frequency or fixed Bm
optional in multipoint test.
4-3 Software Functions
Operate under Windows 95 / 98, Windows 2000 / XP operating systems, conform
to Windows software specification, visual and simple operation.
Full automatic control, intelligent identification, user intervention unnecessary in
entire testing process.
Sampling waveform and instrument status under real-time monitoring, and can be
stopped at any time.
The effective sectional area and length of magnetic path of samples can be
calculated according to the overall dimension of samples.
File system adopts database format, can directly print or output test result to
Excel form.
Powerful file management functions: data saving, deletionb and removal.
Data files contain complete sampled data, sample parameters, instrument
parameters and testing schemes, adopt text format, can be conveniently typed
into other software.
Display I (t), U (t) and B (t) sampling waveform and B (H) hysteresis loop, and
coordinate message at every data point on the curve.
Multipoint cluster, can display B (H) magnetic hysteresis cycle cluster, B (H)
magnetization curve, µa (H) permeability curve, µa (F) permeability curve, Ps (B)
damage curve and Ps (F) damage curve, and can display coordinate message at
every data point on the curve.
B (H) magnetization curve, µa (F) permeability curve, Ps (B) damage curve and
MATS-2010SA Dynamic Hysteresisgraph
User Manual
5
Ps (F) damage curve measured under different conditions can be combined on
one drawing for comparative analysis.
Set up upper and lower limits according to µa, Ps, Bm, Br, Hc and Hm, etc., qualify
test result and determine through the color of data table.
Support various models of printers, test report accurately match printer sheet.
Print preview function, can conveniently regulate the size and edge distance of
test report.
Test report can be directly printed, or generate JPG image file.
JPG image file can be sent directly through E-mail, or saved into disk.
Test reports contain complete curve diagrams, test results, test conditions and
sample parameters. To facilitate adding user mark and enterprise name.
Multiple unit systems optional to satisfy the application habits of different users.
5. Hardware Technology Parameter
5-1 MATS - 2010SA Dynamic Hysteresisgraph
• Output Power: 100VA sine wave
• Frequency Range: 1Hz~ 1000Hz
• Frequency Fineness: < 0.1% * Current Value
• Frequency Error: < 0.05%
• Output Voltage: 0 ~ 1V ~ 10V ~ 50V ~ 300V(Virtual Value)
• Voltage Fineness: Program Control 1mV, panel < 10mV
• Voltage Distortion Factor: Superior to 1%
• Voltage Stability: Superior to 0.1%
• Sampling Current: 2mA, 5mA, 10mA, 20mA, 40mA, 80mA, 200mA,
400mA, 800mA, 1.6A, 4A, 8A(Peak Value)
• Sample Voltage: 20mV, 40mV, 100mV, 200mV, 400mV, 800mV, 2V, 4V, 8V,
16V, 40V, 80V, 160V, 320V, 800V, 1600V(Peak Value)
6
5-2 PC5012 A/D Card
• Sampling Rate: 50MHz * 2 Channels
• Resolution and Linearity: 12 Bit ± 1 /2 LSB
• Voltage Range: ± 0.1V ~ ± 20V
• Sampling Clock: 25ns ~ 5ms Hardware Clock
• Internal Storage Capacity: 4M Byte * 2
6. Major Technical Indices
Adopt volammetry to measure loss Ps and amplitude permeability µa and loss
angle δ, when test frequency is 50kHz, conduct test on ferrite circular ring sample
with standard size (d1 = 40mm, d2= 32mm, h = 6 ~ 10mm), technical indices as
follows:
Parameters
measured
Uncertainty
(K = 2)
Repeatability
(constant temperature)
Bm (%)
Br(%)
Hc(%)
µa(%)
Ps(%)
δ(%)
1
1.5
2
3
5
5
±0.5
±1
±1
±2
±3
±2
7. System Installation and Setup
7-1 Application Environment
• Power Supply: single-phase 200V ~ 240V, 50Hz±10%, maximal 10A
• Environmental Temperature: 23±5℃
• Ambient Humidity: 30 ~ 75%RH
• External magnetic field disturbance: absolutely avoided
• Thermal balance time: 10 minutes
7-2 Computer Configuration
Minimal Configuration: Pentium133 CPU; 32M memory; 4.3G HD; 3.5 inch FD; 16
speed CD-ROM; install Windows 95 operating system.
Recommended Configuration: Pentium1 2.4G CPU; 256M memory; 40G HD; 32M
U disc; 48 speed CD-ROM; install Windows XP operating system.
MATS-2010SA Dynamic Hysteresisgraph
User Manual
7
7-3 Install Operating System
Soft magnetic measurement software SMTest of MATS uses HD as identification
mark of authorized users, so, operating system HD must be hanged on main disk
at the first IDE port of motherboard. Generally, the HD shall be partitioned as per
25% for disk C, 50% for disk D and 25% for disk E. Disk C applies to install
operating system, it is recommended that any Windows version shall be installed
into default path, i.e. C:\Windows.
7-4 Install Video Adapter Driver
Soft magnetic measurement software SMTest has no special requirement for
Video adapter, but may lead to deadlock when working less than 256 colors. This
requires correct installation of Video adapter driver, display mode setup: above
800 * 600 resolution, above 256 colors.
7-5 Full Installation of Microsoft Office
Soft magnetic measurement software SMTest can output database to Word and
Excel, the function will fail if Microsoft Word and Microsoft Excel not installed. We
suggest full installation of Microsoft Office version compatible to operating system
version. Some conversion tools required for database output to Word, full
installation of Office can avoid the prompt to install conversion tool during output
to Word.
7-6 Install Printed Driver
The printout of soft magnetic measurement software SMTest supports automatic
zoom, all printers supported by Windows can be used. Install printed driver, print a
testing page to determine whether the printer works well, then set up printer paper
as lateral to guarantee optimal print effect of test report.
7-7 Installation and Registration of SMTest
Soft magnetic measurement software SMTest is a green software, can be used
when not installed. The software includes 5 files, can be simply copied into same
directory. It is recommended that a TEST directory is created on disk D, and these
files copied into the directory.
SMTest.exe
Soft magnetic measurement main program
SMTest.ini
Soft magnetic measurement user information
Printer.lnk
Printer installation shortcut
8
DateTime.lnk
Date / time modification shortcut
LZ_LOGO.bmp
Test report icon sample
Fig. 7 - 1 User Registration
Registration window as shown in Fig. 7-1 prompts for the 1st SMTest.exe
operation.
There is a “Register(ID: 86992929 – S4102148926)“ in registration window,
please supply ID to the company, ask for 16 bit registration code, type it,
“Registration success!“ prompts, and then can enter testing main interface. If
“Registration code error!“ prompts, please carefully check registration code, the
letters in registration code are not case sensitive, but letters with similar fonts and
digits shall be distinguished.
7-8 Install PC5012 Card Driver
Take Windows XP as an example, driver installation procedures as follows:
⑴ Turn off computer source, open mainframe computer casing, insert PC5012
card into any idle PCI slot.
⑵ Turn on computer source, enter operating system desktop, finding new
hardware prompts, select “Install from list or specific location“ and click “Next”, as
shown in Fig. 7-2.
MATS-2010SA Dynamic Hysteresisgraph
User Manual
9
Fig. 7 - 2 Found New Hardware Wizard
⑶ Select “Include this location in the search", directly type or click “Browse“ in
drop-down box to appoint driver-based directory, click the next, as shown in
Fig.7-3.
Fig. 7 - 3 Appoint driver-based directory
⑷ Driver installation completed, as shown in 7-4.
10
Fig. 7 - 4 Driver installation completed
⑸ After installation, copy System32 directory in PC5012 card directory to system
directory of current operating system (for example: C:\Windows). The cause for
directory copying is that the files in System32 directory are system files, may be
hidden files. If installed under Windows 95/98, the directory shall be copied into
System directory.
7-9 Set up the compatibility of Application Program
Under Windows XP operating system, Windows 2000 driver of PC5012 A/D card
installed, to enable normal working of main program SMTest.exe, compatibility
setup for file shortcut or the file must be conducted, as shown in Fig.7-5, in
“Compatibility mode” box, select “Run this program in compatibility mode for: ",
select “Windows 2000 “in drop-down box.
MATS-2010SA Dynamic Hysteresisgraph
User Manual
11
Fig. 7 - 6 Compatibility setup
7-10 System Installation Precautions
Soft and hardware above-mentioned shall be installed by computer technician,
MATS - 2010SA has been completed by manufacturer.
System reinstallation by users not recommended in general, except operating
system fails due to major failure. If system fails, operating system can be installed
on original system instead of system disk formatted, in order to reduce MATS 2010SA registration and parameter calibration. If the system still fails, it has to be
reinstalled.
If it is connected to web, anti-virus program must be installed because that
exposed to virus infection, MATS - 2010SA main program SMTest.exe will fail,
and registration information and calibration parameters installed will loose.
In addition, please do not install other application programs into the system,
especially resident program, to guarantee sufficient system resources and system
stability. MATS - 2010SA is a software and hardware system, and occupies more
system resources, please close other windows applications as possible.
12
8. MATS - 2010SA Application Details
8-1 SMTest Software Main Interface
Operate SMTest soft magnetic measurement software, enter main interface, as
shown in Fig.8-1.
Fig. 8 - 1 Soft Magnetic Test main interface
Title bar of main window displays: MATS2010 – SMTest, the purpose of the
software.
Main menu contains [ File ], [ Edit ], [ View ], [ Measure ], [ Print ] and [ Help ]
menus.
Toolbar contains [ Testing ], [ Print ] and [ Close ] buttons.
Status bar is divided into five cases, displaying the company's icon, current time,
current index file, current data file and the path of current file in turns.
MATS-2010SA Dynamic Hysteresisgraph
User Manual
13
SMTest adopts window combination technology, entire window functionally
divided into sample parameter area, test function area, record parameter area,
graphic display area and data table area. In which, graphic display area and data
table area can be dragged and dropped so as to regulate the size distribution of
these two areas.
SMTest mainly has three functions: Test function, document function and printout.
8-2 AC test functions
I. Select testing sample type in sample
parameter area, type sample parameter, as
shown in Fig. 8-2.
⑴ Sample type: Optional EE, EI, Ring, RID
and Other.
⑵ Sample size: previous four types have
their diagrams, corresponding dimensional
data can be typed into the table according to
the sign marked in the diagrams. for the fifth
type, effective length of magnetic path and
Fig. 8 - 2 Sample parameter area
effective sectional area can be directly
appointed.
Sx / De column: with dual meanings: lamination factor or material density. When
typed digit less than 10, it indicates material density De (unit: g / cm3), otherwise
lamination factor Sx (%). When typed digit equals to zero, means both lamination
factor and material density are not appointed, in this case, lamination factor taken
as 100 for calculation.
W (g) column: sample quality, unit g. when typed digit equals to zero, means
quality not appointed.
⑶ Explanations on calculation methods of effective length of magnetic path Le,
effective sectional area Ae and effective volume Ve of samples.
14
It is known that different from general current and voltage measurement, magnetic
field intensity and magnetic induction measurements are indirect. Magnetic field
intensity is calculated through the measurement of exciting current, magnetic
induction calculated through the measurement of induction magnetic flux,
effective parameters Le and Ae of samples calculated will have direct relation with
measurement result.
Computing formula of magnetic field intensity: H = N * I / Le
In which: H is magnetic field intensity, unit is A / m; N is the number of turns of
field coil; I is exciting current (measured value), unit A; Le is effective length of
magnetic path of tested sample, unit m.
Magnetic induction calculation formula: B =Vrms / (4.44 * F * N * Ae)
In which: B is magnetic induction, unit is T; Vrms is effective value of induced
voltage, unit V; F is AC signal frequency, unit Hz; N is the number of turns of
induction coil; Ae is the effective sectional area of sample, unit m2.
The calculation methods for effective parameters Le and Ae according to sample
size in different industries are quite different, which may lead to test result lack of
comparability.
The calculation of sample effective parameters in SMTest soft magnetic
measurement software conforms to industry standard SJ / T10281 - 91. The
calculation methods on effective length of magnetic path Le and effective
sectional area Ae of samples will be described as follows with annular sample as
an example.
The first case: appoint lamination factor Sx, appoint sample inside, outside
diameter and height.
According to SJ / T10281 - 91 standard, firstly calculate magnetic core constant
C1 and C2, then calculate Le and Ae according to magnetic core constant, which
is a calculation method strictly implementing the standard.
MATS-2010SA Dynamic Hysteresisgraph
User Manual
15
The 2nd case: appoint material density De and sample mass W, appoint sample
inside, outside diameter and height.
According to SJ / T10281 - 91 standard, firstly calculate magnetic core constant
C1 and C2, then calculate Le and Ae according to magnetic core constant, and
then calculate lamination factor Sx, which is a calculation method slightly different
from the standard, however, calculation result is quite similar with standard.
The 3rd case: appoint material density De and sample mass W, appoint sample
inside, outside diameter, not appoint sample height.
Calculate Le and Ae as per common mathematic formula instead of calculating
magnetic core constant as per SJ / T10281 - 91 standard. The calculation method
is quite different from the standard, only applicable to annular samples.
Effective volume: the sign is Ve, computing formula is Ve = Le * Ae.
⑷ Additional functions: after typing sample parameters for EE, EI, Ring and RID
samples, click “Other“ to obtain effective length of magnetic path, effective
sectional area and effective volume ot the sample from table. The function can be
used as "magnetic parts effective size parameter calculation tool”.
⑸ Set up turns
16
N1: primary (excitation) turns, determined according to power output and N1
match.
MATS - 2010SA / 500k output voltage: 0 ~ 50V.
Considering source SNR,
voltage drop of sampling resistance and voltage drop on N1 coil internal
resistance, the field voltage range on N1 coil is: 1V (Vmin) ~ 40V(Vmax). test
conditions: frequency F and magnetic induction B, and the number of turns of
excitation coil N1 obtained through calculation formula of magnetic induction:
Vmin / 1.5 /(4.44 * F * Ae * B) ~ Vmax / 1.5 /(4.44 * F * Ae * B).
N2: secondary (induction) turns, determined according to voltage sampling range.
Voltage sampling range of MATS - 2010SA / 500k is: 0.1V(Vmin) ~ 10V(Vmax),
test condition: frequency F and magnetic induction B. According to calculation
formula of magnetic induction, the number of turns of induction coil N2: Vmin / 1.5
/ (4.44 * F * Ae * B) ~ Vmax / 3 /(4.44 * F * Ae * B).
Important:
Through sample test, users can regulate the number of turns of N1 and N2 in next
test according to the prompt of status bar in testing process.
II. MATS - 2010SA related test function area see Fig. 8-3.
⑴ Select test mode
If testing AC magnetization curve, µa - H
permeability curve or Ps- B power consumption
curve, select ”Fixed-Freq” mode.
If testing µa - F permeability curve or Ps - F power
consumption curve, select ”Fixed Bm" mode.
Fig. 8 - 3 AC test function
⑵ Setup test condition: frequency F and magnetic induction Bm.
⑶ Testing point setup
Test one data point every time in single-point test.
MATS-2010SA Dynamic Hysteresisgraph
User Manual
17
Different testing point conditions can be set up according to test modes in
multipoint test to satisfy different test requirements.
To measure AC magnetization curve, the number of testing points and position
have great influence on the curve shape combined, to completely combine entire
curve, test more points in initial magnetization area and at the turning point of
curve.
Important: testing point shall be arranged from lower magnetic induction to
higher magnetic induction. If changing measuring frequency or repeating
measurement from lower magnetic induction to higher magnetic induction,
re-conduct demagnetization treatment on the sample. Demagnetization
mode adopts 50Hz AC saturation demagnetization.
⑷ Curve cluster
When selecting ”Cluster”, call all similar data files in current index file into memory
and combine a curve.
III. Fill in sample record parameter
Parameter recording area as shown in Fig. 8-4,
including serial no, material, temperature, date
and test man, except that test date can be
automatically input by system, other parameters
can be typed according to actual situations.
Fig. 8 - 4 Parameter recording
IV. Test coil winding
Coil the sample according to the requirement of magnetic circuit, and connect to
instrument test interface. The coil shall be made with multistrand insulated wire,
induction coil N2 circled on inner layer of magnetic circuit and excitation coil N1
circled outside N2 coil.
8-3 SMTest Software File Operation
I. Test File Type
The software supports two types of files: index file with ind extension and data file
18
with dat extension. Index file records calculation result of related data files,
sample parameters and record parameters; Data file contains raw data of
sampling waveform, sample parameters, record parameters as well as test
schemes.
Index file content shown in data table area, as shown in Fig. 8-5.
Fig. 8 - 5 Data table area
Data file must be called into memory before corresponding curve diagram
generated, multiple data files can be called into memory at one time
through ”Cluster” function.
When data file is called, test scheme included into
the data file also called. Test scheme includes test modes and testing points
setup.
II. User Information File SMTest.ini
The file locates under main file directory, mainly used to set up title, etc. in test
report, and can be modified through “Information“ submenu in “Edit “ menu.
-----------------------------------------------------------------------SMTest.iniFile contents as follows:
[PrintInfo]
UserName= Xiamen Yuxiang Imp. & Exp. Co., Ltd.
UEngName=Xiamen Yuxiang Imp. & Exp. Co., Ltd.
UserSign=LZ
ShowSign=1
FontName=Boldface/
-----------------------------------------------------------------------1st line: [PrintInfo]
2nd line: Chinese format test report title bar
MATS-2010SA Dynamic Hysteresisgraph
User Manual
19
3rd line: English format test report title bar
4th line: work mark at top left corner of test report
The fifth line: control the display of title bar of test report: 1 : displayed; 0 : not
displayed
Sixth line: when the 4th line is letters, control fonts here, follow with “/ “to indicate
that the font is italic
Only the parts following “=“ can be modified when the content of SMTest.ini file
modified. If UserName=Name1.bmp, or UEngName=Name2.bmp, or UserSign=
Name3.bmp, graphics file can be printed onto the title bar of test report.
User logo: open user logo graphics file defined in user information, the reference
height of the file is 260 pixel, length can be determined as required. If it is
unnamed graphics file, must adopt user name appointed in message file, and
save it into the directory where main program SMTest.exe locates in bmp format.
Name of user (Name): open Name graphics file defined in user information,
reference height of the file is 260 pixel, its length can be determined as required.
If it is unnamed graphics file, must adopt user name appointed in message file,
and save it into the directory where main program SMTest.exe locates in bmp
format.
III. Output File Type
⑴ The content of index file can be transferred into Excel table or Word through
“Export” submenu in “File“ menu.
⑵ An image file in test report format (extension jpg) can be generated in the
directory where the data file locates according to the curve of current data file
through “Send To” submenu in “File “menu.
9. MATS - 2010SA Panel Operation
⑴ Start and self-checking
Turn power on, complete self-checking, frequency meter displays frequency, four
digits flash on voltmeter.
20
⑵ Frequency setup
Press ”Fun” key on panel, when digit on frequency meter flickers, flashing digit
indicates cursor position. Use number keys on the panel to modify the digit at
the cursor , meanwhile move the cursor to the next digit; When typing decimal
point, fix it before the cursor, the cursor does not move; Up and down key apply to
modify frequency unit; right and left key apply to move cursor, the cursor can
circulate in four digits.
⑶ Voltage setup
Press ”Fun” key on panel, when digit on voltmeter flickers, flashing digit indicates
cursor position. Use number keys on the panel to modify the digit at the cursor,
meanwhile move the cursor to the next digit; when typing decimal point, fix it
before the cursor, the cursor does not move; Up and down key apply to modify
voltage unit; right and left key apply to move cursor, the cursor can circulate in
four digits.
⑷ Function key ”Fun"
Press ”Fun" key to enter frequency or voltage, press again to move the cursor
between frequency meter and voltage meter.
⑸”Esc” key
Cancel operation setup; cancel power output; cancel protection mode.
⑹”Enter” key
Confirm setup operation; restore power output.
⑺ Reset key”Res"
Restore source, start self-check program.
10. Troubleshooting
I. test source overflow protection
⑴ Four digits ”0000” flash on voltmeter head after test on source overflow
protection;
MATS-2010SA Dynamic Hysteresisgraph
User Manual
21
⑵ Check source service voltage;
⑶ Check short circuit on test interface;
⑷ Check Bm setup at testing point;
⑸ Remove the fault and disassembly test sample;
⑹ Press ”Esc" key on source panel to release protection, press ”Enter” key to
restore output.