1
QoRTs Package User Manual
11
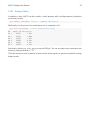
Rscript qortsGenMultiQC.R infile/dir/ decoderFile.txt outfile/dir/
infile/dir/ should be the parent directory within which all the QC output data is contained.
decoderFile.txt should be the decoder file, as described in Section 5. outfile/dir/ should be
the directory where all output plots will be placed.
Alternatively, custom R code can be used to generate non-standard plots or multiplots, alter plotting
parameters, or to generate plots interactively. In addition to the documentation provided in the rest
of this section, the full R docs can be found online. See the github page for a link to the complete
documentation.
7.1
Reading the QC data into R
First you must read in all the QC output from the java utility, using the command below. This command
requires 2 arguments: a root directory and a decoder (which can be either a data frame or a file). We
will be using the example data found in package QoRTexampleData, which is described in Section 5.1.
res <- read.qc.results.data(directory, decoder = decoder.data,
calc.DESeq2 = TRUE, calc.edgeR = TRUE);
Note that the calc.DESeq2 and calc.edgeR options are optional, and tell QoRTs to attempt to
load the DESeq2 and edgeR packages (respectively) and use the packages to calculate additional
normalization size factors. This is not strictly needed for most purposes, but allows QoRTs to plot the
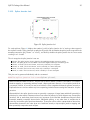
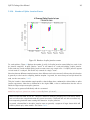
normalization factors against one another. See section 7.4.23 for more information.
7.2
Generating all default plots
To generate all the default compiled plots all at once, use the command:
makeMultiPlot.all(res, outfile.dir = "./");
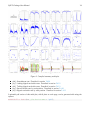
This will usually take some time to run, but will produce all the compiled summary plots described in
the rest of this section, including separate highlight plots for every sample in the dataset. By default
all images will saved to file as pngs. There are a number of alternatives, which can be selected using
the plot.device.name parameter. For example:
#Generate multi-page pdf reports:
makeMultiPlot.all(res, outfile.dir = "./", plot.device.name = "pdf");
#Generate svg vector drawings:
makeMultiPlot.all(res, outfile.dir = "./", plot.device.name = "svg");
Note: The R PDF device primarily uses vector drawings, however, some of the plots are too large to be
efficiently stored as vectors. If pdf reports are desired, we recommend installing the png package. If this
package is installed, then QoRTs will automatically rasterize the plotting areas of certain large plots (in
particular: the gene diversity plots and the various NVC plots). Setting the rasterize.large.plots