1
Drilling down and exploring pathway data
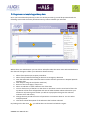
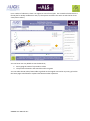
Once you have selected a pathway (in this case Cholecystectomy) you will be presented with the
following screen with the latest period and activity volume indicator pre-selected.
1
2
3
4
5
7
6
8
8
9
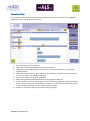
Where there are radio buttons you can click to select/de-select that item. Once selected the data in
the chart will change to reflect your selections almost instantly.
1. Select from Laproscopic or Open procedures
2. Select from procedures following an elective or emergency admission
3. View the OPCS and other code information used to find the operations in Hospital Episode
Statistics data.
4. View help on using the tool (to be made live)
5. Return to the home page / main menu
6. Select an indicator to view a different cut of the data
7. You can click on any of the bars on the chart to ‘drill down’ into the next level of data. The
top banner of the chart will populate with text of what the data relates to based on your
selections. By hovering over the bar you will see a pop up box that gives the selected
indicator value and activity
8. Change the time period the counts of operations or outcomes relate to. You can select
multiple periods
9. This shows a brief description of the indicator that has been selected.
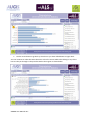
By clicking on the bar chart
7
8
SWORD User Manual v0.1
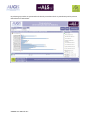
you will be taken to the next level which is region.