1
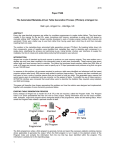
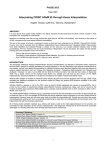
PhUSE 2008
Paper AD09
Automated table generation: The SAS macro %GEEWHIZ
Guido Wendland, UCB Pharma, Monheim, Germany
ABSTRACT
The macro %GEEWHIZ creates tables in PDF-format in which observational units (“subjects”) and observations
(“events”) are counted in categories. The subject count is usually related to the total number of subjects observed.
The categories constitute columns of the table. In most cases the treatment group is the categorical variable but other
categorizations are possible.
The main purpose of the macro is to be able to produce a large amount of tables with just one macro in a controlled
fashion. The macro combines content with layout and thus makes table production more efficient and fast.
Macro parameters are defined in an xml-interface. The paper presents the architecture and provides examples.
INTRODUCTION
Table programming accounts for a high percentage of the statistical programmer trial activities. These activities
consist of a couple of repetitive tasks that could be automated. There is usually a large variety of tables involved in
clinical trials that require various programming approaches. Tables could however be categorized and for single
categories a global macro could be useful. This global macro would automate a lot of steps and programming time
would be vastly reduced.
The macro %GEEWHIZ covers the very frequent category of tables in which subjects or events are counted across
different groups (e.g. treatment groups). It was attempted to cover almost all tables for which this vague description
applies. In the process of development the scope of the macro was expanded to meet the table requirements that
occurred inside our studies. While the macro was initially developed to handle adverse events data, it is not restricted
to this type of data.
The objective of this macro is to combine ease of use with great flexibility. The paper describes the used techniques
to solve this potential conflict of goals. Furthermore the macro %GEEWHIZ combines content with layout.
The aspired flexibility of the macro can be summarized in couple of features:
•
Allows for a lot of user-specified options at the same time.
•
Creates tables for different domains (such as adverse events, vitals etc.)
•
Can be used for development and validation programming (including the option of an automatic compare) in case
double programming is used.
•
Supports various content-related issues (like subgrouping for intensity, subsetting of drug-associated AEs,
inclusion of total and active treatment total columns etc., by group processing, varying denominators etc.)
•
Allows for overlapping treatment categories (e.g. time of onset tables).
It was attempted to reach ease of use by
•
An xml-interface that allows the user to specify the macro parameters. Thus it is easy to use previous examples
and copy and paste information.
•
Generating helpful error or warning messages in case of inappropriate parameterization or use.
•
Supporting a standard table layout by using default parameter settings. User need not to care about layout issues
(like column width, alignment, etc.).
•
A comprehensive user manual.
THE MACRO ARCHITECTURE
The macro parameters will usually be populated via an Excel-spreadsheet that should be stored as xml-file consisting
of two sheets. The macro version of %GEEWHIZ to be used is also one parameter in the xml-file. All parameters of
the xml-file are passed to the macro %GEEWHIZ via an interface macro %SETTABS. The main purpose of the macro
%SETTABS is to allow for the use of different versions of %GEEWHIZ. The macro %SETTABS transforms the xmlfiles into SAS® datasets and calls the corresponding version of %GEEWHIZ.
1
PhUSE 2008
THE XML INTERFACE
It was decided to use an external xml-interface to allow easier manipulations of a large number of parameters and
tables, to provide a better overview of the tables to be produced and as a consequence to speed up the table
production process. The xml-file can be opened for manipulation in Excel in the same way as an xls-file.
This xml-file consists of two sheets, Sheet1 and Sheet2. The name of the xml-file is user-defined. Sheet1 controls the
rows of the table and the general appearance. The column headers of Sheet1 (in row 1) represent the approximately
40 macro parameter names to be used with %GEEWHIZ. For most of these parameters the default specification can
be used in many tables.
Figure 1: Excerpt from sheet1 of the xml-Spreadsheet.
All other rows usually correspond to one table via the macro parameter “KEYWORD” which links to the corresponding
entry in another xml-file that defines the titles and footnotes of the tables.
Sheet2 controls the columns of the intended table and also contains a first row of parameters. Because the number of
(treatment) columns is a variable number sheet two is organized differently to Sheet1. In Sheet2 each row provides a
column description of the table.
Figure 2: Example of sheet 2 of the xml-Spreadsheet.
2
PhUSE 2008
Sheet1 and Sheet2 are linked via the macro parameter “COLUMNTYPE”. So you can use different column
categorizations across the set of tables defined in the xml-file.
There are a few requirements to bear in mind in order to read xml-files:
Xml-files can automatically be opened with Excel and you can set this up as a default (right click on the file, Open with
Microsoft excel and check “Always use this program to open these files”; alternatively specify specifying Tools->
Folder Options -> File Type etc).
•
To ensure proper conversion into a SAS file no empty field is allowed in the xml-file. If you want to have no
information in an xml-field add a blank character (“ “) to it, e.g. by choosing Edit -> Replace and "replace all".
•
The macro %XLXP2SAS from SAS Institute (-> DelGobbo 2006) needs to be available. A typical invocation
would look like this: % XLXP2SAS (excelfile=&PATH…./titles.xml);
Under windows you have to close the xml-spreadsheet in order to retrieve the information from it. Users that prefer to
enter the parameter values directly can alternatively use the macro %SETTABS (see below).
THE MACRO %SETTABS
The user has to invoke the macro %SETTABS to create the tables. This macro %SETTABS constitutes a link
between the xml-file and the macro %GEEWHIZ, which is called automatically.
This invocation of %SETTABS shows its minimal parameterization: The parameter TABLE refers to the xml-file that is
used (in the same folder as the program) and the parameter KEY refers to the row in the xml-file and determines the
table to be produced. It has to match the corresponding KEY that is specified inside the xml-file. Usually other macro
parameters can be used as default. You can use %SETTABS also to overwrite macro parameter setting from the xmlfile by specifying OVERWRITE=%QUOTE(macro parameter1=value1, macro parameter2=value2,…, macro
parameterN=valueN), e.g. if you quickly want to test the effect of a parameter setting without having to change the
values in the xml-file.
%SETTABS creates two temporary SAS datasets from Sheet1 and Sheet2 of the xml-file via the Macro
%XLXP2SAS. Then it calls the corresponding macro version of %GEEWHIZ that is specified in the xml-file. One call
of %SETTABS corresponds to one table.
THE MACRO %GEEWHIZ
The macro %GEEWHIZ is usually only called automatically via %SETTABS and the user does not have to care about
it. To implement this, specify MACROTYPE=GEEWHIZ inside the xml-file. Inside the xml-File you can refer to
different versions of the macro. The macro %GEEWHIZ combines the information of Sheet1 and the corresponding
column information from Sheet2 (via the link variable COLUMNTYPE). It then creates the table using the macro
parameter specifications from the xml-File. If the macro %GEEWHIZ is used as intended it creates a PDF-file for
each table. The internals of the %GEEWHIZ macro are built around proc report and ods PDF.
PREPARATION OF THE DATA
Sometimes the datasets that are used as macro parameter inside the xml-interface need to be prepared.
Usually two data files are needed to create a table with %GEEWHIZ: The first SAS dataset (e.g. ae) contains the
subjects and corresponding events to be counted. In the following this will be referred to as event dataset. The
second SAS dataset (e.g. disposit or demo) contains the number of subjects under risk categorized by group. In the
following, this will be referred to as disposit dataset. Both datasets are merged during the process of table creation.
Prior to calling %SETTABS these two (temporary) files sometimes have to be prepared by
•
Deriving variables in the event dataset to be used in where-conditions or as sorting variables
•
Slicing the event dataset into by-groups (e.g. Week at onset).
•
Create the disposit dataset from multiple sources in case of overlapping groups (e.g. the additional use of an
exposure dataset for dose at onset analyses if a subject may be at risk in multiple groups).
•
Adding by-group variables to the event dataset (in case the by-group variable is a merge variable).
•
Duplicating the records of the disposit dataset in case of overlapping by-groups.
•
Using additional SAS-dataset to determine subjects at risk (e.g. in particular periods).
•
Derive variables that are used to specify a particular aspect of the layout (e.g. a variable that indicates where to
include an empty line)
•
Derive numeric sort variables if you want to bring character values in a pre-defined order.
In many cases you can –as a matter of choice - alternatively address data manipulation issues by preparing the files
or by choosing the macro parameters appropriately. You can for example subset your event dataset prior to calling
%SETTABS or you can do it by specifying a specific macro parameter.
A general advice is hard to give, as the more efficient way of handling things depends on the context. A good practical
example of which pre-processing steps can be necessary is shown in Example 6 below.
3
PhUSE 2008
A BRIEF DESCRIPTION OF MACRO PARAMETERS
This paper can only provide a selection of the functionalities. The functions could be divided into:
•
Layout (such as column widths, empty lines, display of frequencies and percentages).
•
Content (data selection, subsetting etc.)
•
Text labels of columns and categories (e.g. text that appears in the header of the table).
Table 1 and Table 2 provide a brief overview of the general functions of the macro parameters used inside
%GEEWHIZ. In order to address many different aspects of the data and requirements of the customers additional
options, features and functions can be specified for most of the macro parameters. These will usually be appended by
commas and will internally be split up into multiple macro parameters. You can for example add an additional variable
that is used for sorting to the first level variable (see parameter LEV1).
Table 1: Brief description of most of the parameters in sheet1 and their basic functions
Parameter
Brief description
1
Keyword
Variable that identifies the entry and matches with the entry from the file containing the titles
2
Skip
Controls page breaks and allows you to enter blank lines
3
Macrotype
This is the macro version that is used to process the data
4
Usubjid
Usually the subject identifier. Could be a combination of variables if a subject falls into multiple
treatment groups (e.g. dose at onset of adverse event)
5
Dset1
The SAS-dataset which contains the relevant information to be tabulated (“event” dataset).
6
D1_subset1
Contains a where condition for SAS-dataset DSET1 to subset the data
7
D1_subset2
Special subsetting of DSET1, e.g. to determine the numbers at risk or to exclude certain bygroups
8
Byvar
Determines the variable (usually in DSET2) that is used for by-group processing
9
Lev1-Lev3
Up to three variables used to display the different levels (e.g. soc, hlt, and pt). Each new level is
indented by two additional blank characters
10 Levterm
This is the column header of the first column of the table. Use “|” as split character to wrap lines.
11 Lev1txt
The text of this parameter is displayed on top of the table (non-indented) as summary for the 1st
level variable. If text1 is omitted, no summary for the 1st level variable is used.
12 Col1min,
This is the minimum (maximum) width in cm reserved for the first column of the table, which
Col1max
contains the first, second and sometimes a 3rd level variable. If no value is specified COL1MIN is
automatically set to 20 cm
13 Subgroup
This is the subgroup variable (optional) whose values are displayed in the second column of the
table. The values of the subgroup variable are defined in → SUBVALS.
14 Subgrouplabel This is the text for the column header of the subgroup variable (e.g. relationship, intensity,
maximum intensity)
15 Subvals
The comma-separated list of values usually determines the values for the subgroup column.
16 Subvalorder Determines the order of priority for SUBVALS in the presence of a value for SUBGROUP.
17 Dset2
The SAS-dataset which contains the treatment group information and information concerning the
populations (e.g. disposition dataset).
18 D2_subset
Contains a where condition for SAS-dataset DSET2 to subset the disposition dataset.
19
Header_display_n This determines whether of not the N’s should be displayed in the header block of the table
20 Selectrows
This parameter allows you to exclude rows from the table display without deleting data from the
dataset that is to be displayed.
21 Overall
If this parameter is not blank, it determines the text for the Overall column(s) on the right side of
the table. If the parameter is blank, no overall column is created.
22 Orderbytotal Determines the rank of the overall column in specifying the sort order of the 2nd and 3rd level
variable in the first column.
23 Columntype
Determines the appearance of the treatment columns and refers the same variable in sheet2 of
the xml-file.
24 Displaytype
Determines how frequencies and percentages and events are displayed
25 Percentformat Determines the number of digits used in the percentage display.
26 Minimumwidth Allow you to switch between a standard column width and a minimum column width to display the
treatment groups.
27 Spanningtext This optional text is placed on top of the treatment columns as spanning text
st
nd
28 Showbody
Determines whether the frequencies and percentages are summarized for the 1 and 2 level.
29 Cretable
Indicates whether or not the PDF-file should be produced (for validaton programmers a PDF is
not required)
30 Newtarget
Allows you to start e.g. an automated compare.
4
PhUSE 2008
Table 2: Description of the parameters in Sheet2
Parameter
Brief description
Columntype
Integer Number for the table that matches with the corresponding value of sheet1
Var
This is the name of variable that is used for grouping the data into the columns. This is usually a
numeric treatment group variable. Character variable are also allowed if each distinct value is
displayed as column. It is also possible to specify a dose variable if each column should represent a
single or combined dose class.
Start
Determines the start value for the category. The categories must be mutually exclusive.
End
Determines the end value for the category. To include only a single value into a groups END should
be the same value as START. The categories must be mutually exclusive. The overall column(s)
are created inside sheet1.
Sortrank
Determines the rank of the column in specifying the sort order of the 2nd level variable (first
column). The provided numbers must be unique but do not need to be successive.
If a group should be excluded from the active treatment group total add: “,x” or any other character.
Label
Provides the label for the column that appears in the header of the table.
AUTOMATED COMPARE
One advantage of the xml-user interface is that a large number of tables can be handled efficiently. That is way the
macro is often used to create a large number of tables with just one program.
The macro %GEEWHIZ can be used for development and validation of tables. For validation programmers (in case of
double programming) it offers the possibility to perform an automated comparison to the developed file provided that
some requirements are met (e.g. the variable names of the compared variables need to be equal). The requirements
are met if both the development and the validation of a table were done with the macro.
With the automated compare (→ parameter NEWTARGET in sheet 1) the comparison procedure is invoked for a
table and the *.lst outputs created by the compare procedure are concatenated. If the number of tables is large this
yields a big file that can be tedious to check for findings.
An additional SAS macro was designed to extract the relevant information form the *.lst file and summarize the results
in an xml-file. It is optionally called as the last step of the validation program, i.e. after the *.lst was already created.
EXAMPLES
The adverse event data presented in the following examples is completely fictional and only serves the purpose to
show particular test cases and to illustrate how the macro % GEEWHIZ handles these specific test cases. The macro
is particularly suited to process adverse events data. The last example shows its application to real-life laboratory
data.
This chapter can only cover a couple of different fields of application. If shows which changes would be necessary if
you are starting from a base case. Each example will be started with an overview of the changes in the parameter
setting and followed by the table that would be generated with the parameter setting. In the tables a couple of
comments are inserted to further explain the effect of a certain parameter specification.
EXAMPLE 1
The following macro parameters would be specified for a “standard” table. In the following parameter overview the
columns of sheets1 are expressed as rows:
5
PhUSE 2008
Table 3: Parameter settings in sheet 1 for a standard table
Column
Example 1
Incidence of all Treatment-Emergent Adverse Events (TEAEs)
1
Keyword
example 1
3
macrotype
geewhiz_v1_5
4
usubjid
usubjid
5
Dset1
ae
6
D1_subset1
ss_g="Yes"
9
lev1
socdm
9
lev2
hltdm
9
lev3
ptdm
10
levterm
MedDRA (V9.1)| System Organ Class/| High Level Term/| Preferred Term
12
col1min
4
12
col1max
15
17
Dset2
disposit
18
D2_subset
ss_g="Yes"
23
Columntype
1
24
Displaytype
1
25
Percentformat
percnew
26
Minimumwidth
yes
28
showbody
yes
29
cretable
yes
This parameter setting yields the following result:
Figure 3: A “Standard” table
6
PhUSE 2008
EXAMPLE 2
Now the adverse events are to be categorized by maximum intensity via an additional subgroup variable. Table 4
highlights the changes as compared to the base case
Table 4: Inclusion of a subgroup variable to categorize intensity
Incidence of all TE Card. + Nerv. syst. disorders - (SKIP=,,1), SUBGROUP,
Table 6_1
SUBGROUPLABEL, SUBVALS
1
Keyword
Example6_1
2
Skip
,,1
5
Dset1
ae1
6
D1_subset1
ss_g=”yes” and substr(socdm,1,1) in (“C”,”N”)
11 Lev1txt
Any System Organ Class
13 Subgroup
Intensity
14 Subgrouplabel
Maximum Intensity
15 Subvals
Mild, Moderate, Severe, Total
16 Subvalorder
3,2,1,4
21 Overall
,Rotigotine Total,1
28 Showbody
no
Figure 4: A table with a subgroup column
3
3
1
2
1
4
4
2
5
5
The parameter SHOWBODY=no suppresses the display of frequencies and percentages for the first level entries. It
also suppresses the display of the summary of the first level entries (e.g. System Organ Class) specified by
LEV1TXT=Any system organ class (see also the next example where this summary line is displayed). This example
shows that sometimes parameters interact with each other.
The parameters SUBGROUP, SUBGROUPLABEL, SUBVALS, and SUBVALORDER are often used in combination.
Specifying a value for SUBVALORDER implies that the categories follow a priority: If a subject experiences an
adverse event twice the lower category would not be counted.
The parameter OVERALL is starting with a comma, which means that no overall total is calculated but an active
treatment total. The adjacent “1” indicates that the last group is to be excluded from the active treatment total.
7
PhUSE 2008
EXAMPLE 3
This example shows another case where parameters interact with each other. Here the parameter SUBVALS could
also be used without SUBGROUP:
Table 5: Use of parameter SUBVALS without parameter SUBGROUP
1
5
9
9
9
11
13
15
21
Incidence of all TEAEs - Only LEV2, SUBVALS: existing values + blank line
Example7_1
ae1
Table 7_1
Keyword
Dset1
Lev1
Lev2
Lev3
Lev1txt
Subgroup
Subvals
Overall
Socdm
Any System Organ Class
Cardiac disorders,Nervous system disorders,,Vascular disorders,Psychatric disorders
,Rotigotine Total,1
Figure 5: Using the SUBVALS parameter to manipulate the first column
1
1
2
2
3
3
8
PhUSE 2008
EXAMPLE 4
Sometimes treatment groups are not mutually exclusive, e.g. if you want to display adverse events by dose at onset
(variable exdostot), a subject might experience the same adverse at different doses if the subject is titrated to a
maintenance dose.
Table 6: Specifications if treatment columns are not mutually exclusive
Table 8_1
1
4
5
6
17
21
23
Keyword
Usubjid
Dset1
D1_subset1
Dset2
Overall
Columntype
Incidence of all TE Card. + Nerv. syst. disorders by dose at Onset USUBJID, DSET2, and COLUMTYPE
Example8_1
Usubjid exdostot
ae1
ss_g=”yes” and substr(socdm,1,1) in (“C”,”N”)
dispoall
,Rotigotine Total,1
3
As the dose at onset is used here sheet 1 refers to a different value of COLUMNTYPE in sheet 2 (see specification in
the figure below).
Figure 6: Using a combination of two variables to merge the “event” dataset with the “disposition” dataset.
1
1
9
PhUSE 2008
EXAMPLE 5
If you want to group column together (e.g. if you have multiple doses of the same active treatment) it makes sense to
use a spanning header to indicate that certain columns belong together. Furthermore, it is shown how to include
treatment columns into the table that usually would disappear because no subject is in that treatment group. In the
following example this occurs because it is restricted to subjects that reach a certain period in the study.
Table 7: Implementation of a spanning header and inclusion of columns with N=0
Table 11_1
1
5
6
18
21
23
25
27
Keyword
Dset1
D1_subset1
D2_subset
Overall
Columntype
Percentformat
Spanningtext
Incidence of all TE Card. + Nerv. syst. disorders - D2_SUBSET (N=0),
OVERALL, COLUMNTYPE=1 n, SPANNINGTEXT=Rot.
Example11_1
ae1
ss_g=”yes” and substr(socdm,1,1) in (“C”,”N”)
ss_g='Yes' and maint1="Yes"
Overall Total ,Rotigotine Total, 1
1,x
Perc
Rotigotine
Here the parameter OVERALL interacts automatically with the parameter SPANNINGTEXT. The text indicates that
the overall total and the active treatment total (i.e. Rotigotine total) are to be displayed. Furthermore a “1” is added to
indicate that one additional column apart from Placebo is excluded from the active treatment total. This is recognized
by the parameter SPANNINGTEXT which begins at the 2nd treatment column (default) and ends with the column
“Rotigotine Total”. Percentages are displayed here without any decimals to save space (PERCENTFORMAT=perc).
The setting COLUMNTYPE=1,x ensures that all (intended) treatment groups are displayed even if no subjects fall into
a group.
Figure 7: Using a spanning header and including treatment columns with no subjects (N=0).
1
3
4
2
3
1
4
10
2
PhUSE 2008
EXAMPLE 6
The last example handles a more complex real-life situation and shows that %GEEWHIZ is not only restricted to
adverse events data. This is a more sophisticated use of the macro.
The used data needs to be pre-processed here (usually in the SAS program that contains the %SETTABS
invocations) in order to generate the variable “critn” to sort LEV2, to create a variable “nr” that defines empty lines
between the abnormalities and the marked abnormalities, and to generate a dataset “hema511” that only contains the
hematology parameters of the study 511. The latter is required because the full input data (disregarding the
subsetting condition D1_SUBSET1) is used to determine the subject counts (see comment 4 below).
Table 8: Implementation of special laboratory table
1
2
5
6
9
9
10
17
18
21
24
Hematology – Abnormalities/Marked Abnormalities
iss_ap_lab_hem_rd_511
,nr,2
Hema511 yes
Markfnd=”Yes”
lbtest
Markcrt, critn
Parameter (unit)| Criteria
Table 112_2
Keyword
Skip
Dset1
D1_subset1
Lev1
Lev2
Levterm
Dset2
D2_subset
Overall
Displaytype
Subject
ss='Yes' and prindic = 'Advanced PD' and studyid='511'
,Rotigotine Total
3N1ly,0.4,Count
Figure 8: Displaying abnormalities/ marked abnormalities with special features
1
4
3
3
2
1
2
4
5
5
11
PhUSE 2008
INTERACTIONS WITH OTHER MACROS
The invocations of additional macros are embedded into the macro %GEEWHIZ. This includes two error check
macros, that check the macro parameters and the used datasets and variables for validity and a few other macros,
e.g. a macro that takes care that indented text wraps appropriately. All of these macros are part of a macro library
whose members are automatically compiled.
CONCLUSION
The macro %GEEWHIZ tries to combine user friendliness with a great deal of functionality and flexibility. Users report
that it requires a bit of a learning curve to get used to it. However, once you have some experience it pays off rather
quickly because you can generate a large number of tables in a more or less automated fashion.
Its basic use is pretty straightforward and with some experience you can implement more sophisticated solutions.
The experience has shown that the %GEEWHIZ macro can handle approximately 90% of the adverse events tables,
concomitant medication and concomitant diseases tables. Furthermore, it was also used to create tables from a lot of
other domains such as laboratory tables or vital sign tables.
The macro has evolved over time with a lot of features and solutions being implemented into an already existing
macro. The new functions were built-in as options by appending values to existing macro parameters over the years
and over the projects. New macro parameters were not introduced into the xml-spreadsheet. On the one hand this
procedure allows the use of the same set of macro parameters for simple tables and more complex tables. On the
other hand the correct parameter specification often requires a look into the user manual because it can be complex.
As a drawback due to the seemingly complexity of the macro, some users are hesitant to start using the macro and it
needs some promotion to persuade these users.
REFERENCES
DelGobbo, V. 2006. "Creating AND Importing Multi-Sheet Excel Workbooks the Easy Way with SAS® ".
Proceedings of the Thirty-First Annual SAS Users Group International Conference, 31. CD-ROM. Paper 115.
Available http://www2.sas.com/proceedings/sugi31/115-31.pdf.
CONTACT INFORMATION
Your comments and questions are valued and encouraged. Contact the author at:
Guido WENDLAND
UCB Pharma SA
Alfred-Nobel Str 10
40789 Monheim
Germany
Work Phone: + 49-2173-48 1944
Fax: + 49-2173-48 1947
Email: [email protected]
Web: www.ucb-group.com
Brand and product names are trademarks of their respective companies.
12