1
ChemBioFinder 12.0
About this document
This document is the "ChemBioFinder" section of the manual Chem & Bio Office® Chem& Bio3D,
Finder & Bio Viz and is made available as an excerpt for fast downloading.
To read the manual in its entirety or to download other sections, see the desktop support site at
www.cambridgesoft.com.
Contents
What’s New ..........................................281
Chapter 15
ChemBioFinder & BioViz ...................283
About ChemBioFinder 12.0®.............283
About BioViz ......................................283
About this guide..................................283
Additional information .......................284
Chapter 16
The User Interface ...............................285
The ChemBioFinder User Interface....285
More UI features .................................289
Opening ChemBioFinder 12.0 ............290
Using ChemBioFinder with databases 290
Chapter 17
Tutorials................................................293
Tutorial 1: Creating forms ..................293
Tutorial 2: Opening a database ...........295
Tutorial 3: Creating a database ...........296
Tutorial 4: Searching a database .........298
Tutorial 5: Reaction queries................301
Tutorial 6:Creating a BioViz chart .....304
Tutorial 7: Working with subforms ....309
Chapter 18
Forms ....................................................311
Creating forms automatically..............311
Saving a form......................................313
Creating forms manually.....................313
Setting box properties..........................318
Editing forms.......................................324
Chapter 19
Databases...............................................333
Selecting a database ............................333
Opening databases...............................336
Browsing databases .............................338
Creating a database..............................341
Creating a portal database ...................346
Chapter 20
Working with Data...............................347
Entering data .......................................347
Editing data .........................................349
Sorting data .........................................353
Resetting the database .........................354
Changing the database scheme............354
Chapter 21
Queries...................................................357
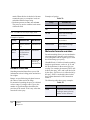
Text searches .......................................357
Numeric searches ................................358
Molecular formula searches ................358
Date searches.......................................359
Find list................................................360
Structure searches................................360
Reaction searches ................................366
Combined searches..............................368
ChemBioFinder & BioViz
User Guide
i
SQL searches ......................................369
Query procedures ................................369
Refining a search ................................374
Special structure searches ...................376
Managing queries................................380
Search examples .................................384
Chapter 22
Importing and Exporting Data ...........389
Importing data.....................................389
Exporting data ....................................394
Chapter 23
Relational Data and Subforms ...........399
Access relational data ........................399
Creating a subform..............................399
Working with subforms ......................401
Searching a subform ...........................402
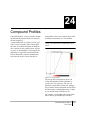
Chapter 24
Compound Profiles ..............................405
Creating a compound profile ..............406
Editing a compound profile ................408
Customizing ........................................411
Chapter 25
ChemBioFinder/Oracle ......................413
Setup ...................................................413
Opening an Oracle database................414
Searching ............................................415
Sorting.................................................416
Handling lists .....................................416
Setting Oracle preferences ..................417
ii Contents
Updating and adding data....................417
Loading................................................418
Indexing...............................................419
CAL.....................................................420
Chapter 26
BioViz ...................................................423
Changes in version 11 .........................423
Changes in version 10 .........................424
Creating a plot .....................................425
Statistical analysis ...............................428
Plotting queries....................................432
Changing the display...........................433
Chapter 27
BioSAR ..................................................435
Subforms and autolinks.......................436
Multiple sort ........................................437
Query hitlists .......................................438
Domains ..............................................441
Creating an mdb database ...................441
Chapter 28
Clustering in BioViz ............................445
Features ...............................................445
Working with Clustering.....................445
Modifying Clustering ..........................447
CS Clustering Dialog features.............449
Chapter 29
Customizing ChemBioFinder 12.0......451
Setting preferences ..............................451
Favorites tree .......................................455
Toolbars ..............................................456
Periodic table ......................................457
Embedding ActiveX controls..............458
Scripting..............................................459
Methods of communication ................467
Chapter 30
ChemFinder/Office ..............................471
Overview.............................................471
The user interface (UI)........................471
Selecting files to search ......................471
Searching by chemical structure ........473
Searching by multiple properties ........474
Browsing search results ......................475
Saving files or data sources ................475
Searching DSD files............................476
Sending a file to another application ..477
Refining your search ..........................478
Changing ChemFinder/Office settings480
Rules....................................................495
Examples .............................................495
Appendix C
Similarity Rules ....................................497
Complete structure similarity ..............497
Substructure similarity ........................498
Appendix D
CAL Commands...................................499
CAL help .............................................499
Menu commands .................................499
Box creation commands ......................502
Box manipulation commands..............507
Program execution commands ............510
General commands..............................513
File commands ....................................527
Variable commands.............................529
Environment variables.........................535
Script-only commands.........................536
Appendix A
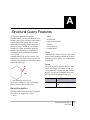
Structural Query Features ..................483
General properties...............................483
Changing the scope of a search...........489
Atom properties ..................................489
Bond properties...................................493
Appendix E
CS Oracle Cartridge ...........................541
Pre-setup procedures ...........................541
Fast-move caching scheme..................542
Configuring via CF_SETTINGS table542
Searching.............................................543
Appendix B
Formula Input Rules ...........................495
Index .......................................... 545
ChemBioFinder & BioViz
User Guide
iii
iv Contents
What’s New
ChemBioFinder has long been the preferred
tool for storing chemical structures, physical
properties, notes, tables of data, and charts
based on that data. ChemBioFinder introduces
a variety of improvements and new features
not found in earlier versions.
New Features
Classes
This is new menu item within the Find Structure submenu under the Search menu. The
Classes menu provides a submenu with various
items for performing searches. For more infor-
mation, see “Special structure searches” on
page 376.
By date modified
This is a new menu item that appears within
the Find Structure submenu under the Search
menu. For more information, see “Special
structure searches” on page 376.
Clustering
This is a new tool for ChemBioFinder biovisual chemist. See “Clustering in BioViz” on
page 445 for more information.
ChemFinder & BioViz
User Guide
281
282
What’s New
Chapter ii
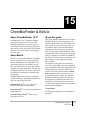
15
ChemBioFinder & BioViz
About ChemBioFinder 12.0®
About this guide
ChemBioFinder 12.0 is a database management system for anyone who works with
chemical information. It provides a place to
store chemical structures, physical properties,
notes, tables of data, and charts. With ChemBioFinder 12.0, you can quickly find and organize your data.
This guide contains information for the ChemBioFinder & BioViz. It assumes that you are
familiar with the basics of your Windows operating system. If you are not refer to your system manual. Some of the material describes
tasks that must be performed in conjunction
with other integrated CambridgeSoft products.
The material on the addins describes tasks that
must be performed in conjunction with Microsoft Excel or Word. If you are not familiar with
these products, please consult the relevant
user’s manual.
The chapters in this guide are organized by
task. They are intended to help you familiarize
yourself with the ChemOffice applications and
start using them as quickly and efficiently as
possible. New users should read the ChemBioFinder & BioViz chapter to get an overview of
the product and how it works. The Tutorials
chapter demonstrates most of the features of
the application. Perform the tutorials in the
order they are presented. Experienced users
can skip to subsequent chapters, which provide
more detailed information.
About BioViz
BioViz is a visualization add-in for ChemBioFinder 12.0 that allows you to plot numeric
data in ChemBioFinder 12.0 databases. You
can identify trends and correlations in your
data, and within subsets of your data, without
exporting to another application. You can have
as many plot windows as you like, each showing a different visualization of data from the
current form.
ChemBioFinder 12.0 & BioViz collaborates
with the following CambridgeSoft products to
help you perform specific tasks:
Chem & Bio Draw®. Lets you draw twodimensional structures and reactions.
Chem & Bio 3D®. Lets you draw three-dimensional structures.
Chem & Bio Draw/Excel®. Allows you to
export data to Excel.
Conventions
The following notations are used throughout
this guide:
ChemBioFinder & BioViz
User Guide
283
• The following symbol indicates that a feature is available in the Ultra version only:
A bold font is used to refer to the User Interface, for example “Click File>Save”.
Additional information
• The following symbol indicates that a feature is available in both Pro and Ultra versions, but not in Standard version:
Additional sources of ChemOffice information
are:
•
•
•
•
The Quick Reference Cards
The Help system
CambridgeSoft Web Pages
http://CambridgeSoft.com/services
Quick reference card
Special formats
CAUTION
Cautions are used to warn you of situations
that might cause a possible loss of data.
The ChemOffice Quick Reference Cards are
located in the back of the printed manual. The
cards summarize ChemOffice Desktop application commands and features.
Help system
NOTE: Notes are used to highlight important
information.
ChemOffice applications provide some or all of
the following types of Help:
TIP: Tips are used to present information supplemental to the main text.
• Help—An HTML reference guide.
• ToolTips—Short descriptions of user interface objects displayed by pointing.
• Status Bar—The lower left corner of the
screen displays useful information as you
work.
Shortcut key sequences are indicated with a +
sign, for example: “Use the command: Ctrl+H
to toggle hidden Hydrogens and lone pairs.”
284
ChemBioFinder & BioViz
Chapter 15
16
The User Interface
ChemBioFinder 12.0 is a database management system that allows storage, retrieval, and
searching of molecular structures, text, and
numerical data.
You can create structures in either Chem & Bio
Draw or with the built-in Chem & Bio Draw
ActiveX control to store data in your ChemBioFinder 12.0 database, and add related numerical or textual data and comments. You can use
the Chem & Bio 3D ActiveX control to view
the structures.
The general steps for using ChemBioFinder
12.0 are as follows:
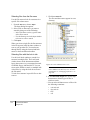
view structures and data. The toolbars contain
icons that change the way the pointer behaves
or that perform actions corresponding to menu
commands.
The components of the ChemBioFinder 12.0
UI are described below
• Create a form
• Create or open a database and link it to the
form.
• Add or manipulate data
• Perform a search.
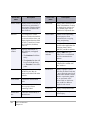
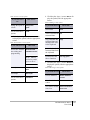
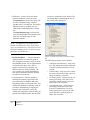
Current list size Displays the number of
records through which you are
browsing. Might be less than
the total database size if you
have recently performed a
search.
These steps are described in the ChemBioFinder 12.0 Tutorials, and in the detailed reference material in the manual.
The ChemBioFinder User
Interface
Screen Element
Description
BioViz window Displays plotted data from
ChemBioFinder 12.0 databases.
Current record Displays the position within
the current hit list of the record
you are viewing.
Control box
A data box containing an
ActiveX control.
The ChemBioFinder 12.0 User Interface (UI)
consists of menus, toolbars and the form window. The central part of the form window contains the work space where you create and
ChemBioFinder & BioViz
User Guide
285
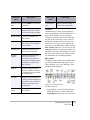
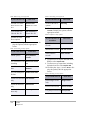
Screen Element
Description
Screen Element
Description
Details window Displays details of selected (or
moused-over) point when a
plot window is displayed. May
be displayed as tabbed with
other windows.
Main form
Displays data contained in one
record of the database. To keep
the display from getting cluttered, tabbed pages may be
added for less important data.
Data box
Main toolbar
Contains icons representing
general-purpose menu
commands such as copying,
saving, and printing.
Menu bar
Contains all the commands
specific to the application for
managing forms, tables,
databases, and their contents.
New Record
indicator
Displays ADD when you
adding a new record that had
not been committed to the
database.
Explorer
window
A viewing area in a form
linked to a field in the database
associated with that form, and
displaying data from that field.
See also: Control box, Picture
box, Profile box, Subform,
Text box.
Displays information on
three tabbed (overlapped)
windows:
• The Database field hierarchy.
• The Queries list that will
be saved with the form.
• A “Favorites” list of file
paths.
Picture box
An enclosure around a data
box or group of boxes
containing a label.
Displays a graphic. Picture
boxes may be either Fixed, that
is, they remain the same for all
records in the database, and are
linked to a particular graphic
file, or associated with a
picture Field, in which case
there could be a different
graphic in each record.
Profile box
Displays Compound Profiles.
A data box surrounded by a
labeled frame.
Query indicator Displays QRY when you enter
a search query.
Filter window
Displays the filters that modify
the BioViz plot. May be
displayed as tabbed with other
windows.
Form toolbar
Contains the form-creation
tools.
Frame
Framed data
box
286
Output window Displays Python output. May
be displayed as tabbed with
other windows.
The User Interface
Chapter 16
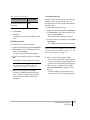
Screen Element
Description
Screen Element
Read-only indi- Displays READ if the database
cator
is read-only.
Total database
size
Record toolbar Contains icons for commands
in the Record menu. Click an
icon to perform the command.
Toolbars
Search toolbar
Contains commands in the
Search menu.
Status bar
Displays information about the
item opened in the ChemBioFinder window.
Structure box
Displays the chemical structure of the current record.
Structure
window
Displays the chemical structure of the selected (or
moused-over) point when a
plot window is displayed. May
be displayed as tabbed with
other windows.
Subform
Displays relational information from a different database,
or a different data table within
the same database.
Text box
Displays text. Text boxes are
Fixed (text fields are displayed
in text data boxes) and may be
formatted in the Box Properties dialog box.
Description
Displays the total number of
records in the current table.
ChemBioFinder 12.0 has several toolbars to
create and manipulate the ChemBioFinder 12.0
form and the database records it displays.
Toolbars are normally docked at the top and
left side of the UI, but they can be “torn off”
and placed anywhere on the screen for your
convenience. You can view the toolbars displayed in the ChemBioFinder window through
View>Toolbars submenu. You can also use the
Toolbars submenu to customize the toolbars. A
description of toolbar customization is beyond
the scope of this manual. (See Microsoft help
for information on customizing toolbars.)
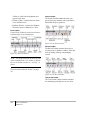
Main toolbar
The Main Toolbar contains the standard tools
you find in most modern applications: New,
Open, and Save; Cut, Copy, and Paste; Undo
and Redo; Print and Help.
Figure 16.1 The Main Toolbar
The three tools are:
Text Format
toolbar
Used to format text in Text and
Memo fields.
• Layout Mode—switches between Layout
(Edit) Mode and View Mode. When the
Layout Mode button is depressed, the Form
ChemBioFinder & BioViz
User Guide
287
Toolbar is visible and an alignment grid
appear on the form.
• Switch to Table—switches between Form
View and Table View.
• Database Wizard—activates the Database
Wizard to connect a database to a form.
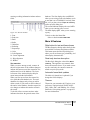
Search toolbar
The Search Toolbar contains the tools you
need to query the database and work with the
hitlists that the query produces.
Form toolbar
Use the Form Toolbar to create a new form or
to add an object to an existing form.
Figure 16.3 The Search Toolbar
Record toolbar
Figure 16.2 The Form Toolbar
The Record Toolbar contains the tools you
need to browse a database or hitlist. It also has
tools for adding, deleting, and changing
records.
NOTE: The Form toolbar docks on the left side
of the ChemBioFinder 12.0 window by default,
but can be docked anywhere or “torn off”, as
shown.
The tools are described in “Forms” on page
311.
Figure 16.4 The Record Toolbar
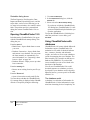
Text format toolbar
The Text Format Toolbar contains standard
text formatting tools that you can use when
288
The User Interface
Chapter 16
entering or editing information in data and text
fields.
Figure 16.5 The Text Toolbar
1- Font
2- Point size
3- Bold
4- Italics
5- Underline
6- Subscript
7- Superscript
8- Color
9- Left alignment
10- Center alignment
11- Rigt alignment
12- Bullets
The status bar
While you move among records, counters in
the lower right corner of the window change to
indicate the current record, the current list size,
and the total size of the database. The lower
left corner of the window displays help for
menu items and other information.
When you first open a form, the current list
size equals the total database size. The total
database size changes only when you add or
delete records. If you search to find a subset of
the entries in the database, then the current list
size changes to indicate the number of hits in
the search.
To the left of these counters are three other
indicators that show the general status of the
database. The first displays the word READ
when you are using a read-only database, such
as one that is on a CD-ROM, a read only form
file, or if you have selected Open as read-only
on the open file dialog box.
The second indicator displays the word ADD
when you are entering a new record.
The third displays QRY when you are entering
a query.
To hide or show the Status Bar:
Select or deselect View>Status Bar.
More UI features
Style button for text and frame boxes
The Box Properties dialog makes the Style button available for frames and plain text labels.
This button opens the Box Style dialog box,
where you can set frame type, printability, and
other display characteristics.
Read-only structure box option
The Box Style dialog has a check box Box is
This applied to text, numeric data
boxes and structure boxes. If you mark a structure box read-only, the structure cannot be
edited except in query mode.
read-only.
Automatic frame label updates
The label of a framed box is updated if you
change the field it displays.
Themes
Themes let you customize the UI style to your
preference. Options include WinXP, Office
2003, Office 2007, and Whidbey. See “ChemBioFinder 12.0 opening options” on page 453
for more information.
ChemBioFinder & BioViz
User Guide
289
Resizable dialog boxes
The Box Properties, Plot Properties, Data
Import and Data Export dialog boxes, and the
script editor, can be resized, allowing you to
see more in text windows, tree controls, and so
forth. The position and size is remembered
during the current ChemBioFinder 12.0 session.
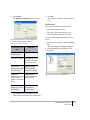
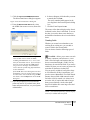
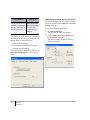
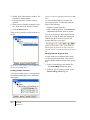
Opening ChemBioFinder 12.0
In default mode, ChemBioFinder 12.0 opens
with the ChemBioFinder startup dialog. This
dialog lets you:
From the New tab
• Blank Form—Open a blank form to create
your own.
• Database Connection—Open a blank form
and connect it to a database. You can create
the form manually or automatically. For
more information, see “Connecting a database to a form” on page 295.
• Database Wizard—Helps you set up a database connection.
From the Existing tab
• Browse to an existing form in your file system.
From the Recent tab
• Open a form on the recently used file list.
You can choose whether the ChemBioFinder
12.0 startup dialog is displayed when ChemBioFinder 12.0 opens by doing the following:
290
The User Interface
Chapter 16
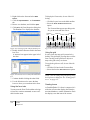
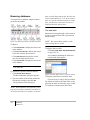
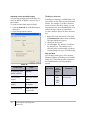
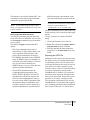
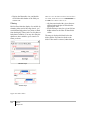
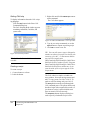
1. Go to File>Preferences.
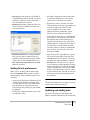
2. In the Preferences dialog box, click the
General tab.
3. Select or deselect Show startup dialog.
If you choose to hide the ChemBioFinder
12.0 dialog box, ChemBioFinder 12.0 will
open a new blank form by default when you
open the application.
To open the ChemBioFinder 12.0 dialog box
when the preference is set to hide, go to
File>New.
Using ChemBioFinder with
databases
ChemBioFinder 12.0 comes with the Microsoft
Jet database engine. ChemBioFinder 12.0
maintains its own table of chemical information—structure, formula, and molecular
weight—and relies on Jet to create a database
system for managing the rest of the data. The
data created by Jet is stored in an MS Access
database file (MDB file). If you have MS
Access installed you can use it with the relational part of the database.
You can use ChemBioFinder 12.0 to add
chemical structures to a database you have
developed. If your database was developed in
Microsoft Access, you can open it in ChemBioFinder 12.0.
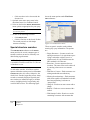
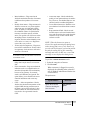
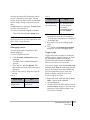
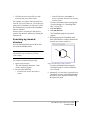
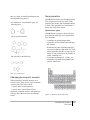
The database model
A database is a collection of information. In
ChemBioFinder 12.0 the information is organized into increasing levels of complexity. At
the simplest level is the data item itself, for
example a molecular weight value.
At the next level is the record, a set of data
items (one for each field) defining a single
entry.
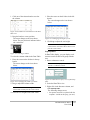
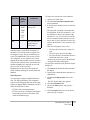
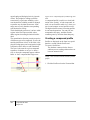
Figure 16.6 A data item in the database
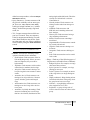
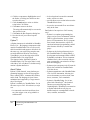
At the next level is a field, a group of data
items defining one type of data. Fields are generally set up once and rarely modified.
Figure 16.8 A record in a database
A collection of records is a table. A table is
defined by a set of fields, and a set of records
which grows as entries are added.
In spreadsheet terminology:
•
•
•
•
Figure 16.7 A data field in a database
A data item is found in a cell.
A field corresponds to a column.
A record corresponds to a row.
A table corresponds to a worksheet.
A database is a storehouse for tables–possibly
one, possibly more than one. A database containing only one table is known as a simple (or
flat or flat-file) database.
Databases containing multiple tables are called
relational. For more on relational databases see
“Relational Data and Subforms” on page 399
A form displays data from a single table, but
may contain subforms that display data from
other tables. If the tables have a field in common, then any record retrieved in the form
calls up the related records in the subform.
ChemBioFinder & BioViz
User Guide
291
Understanding forms and databases
Databases are where data is stored. A form displays the information stored in the database.
No data is stored in a form. The form acts like
a window, letting you select which fields and
tables you want to view.
While no data is stored in forms, some things
are saved with a ChemBioFinder 12.0 form.
BioViz plots, database queries (depending on a
preference setting), file paths of linked graph-
292
The User Interface
Chapter 16
ics, and certain settings are saved with each
form.
You can create more than one form to access
the same database. For example, you may want
to create one sample form for working with
structural data and a more complicated one to
include literature or lab data. By switching
between forms, you can look at just those
fields you want to see.
17
Tutorials
The general steps for using ChemBioFinder
12.0 are:
1. Create a form.
2. Create or open a database and link it to the
form.
3. Add or manage data.
4. Perform a search.
The tutorials introduce you to ChemBioFinder
12.0 basic functions.
You may want to use the Quick Reference card
while you perform the tutorials.
We recommend performing the tutorials in the
sequence they are presented because each tutorial develops on and refers to the previous
ones.
Sample databases
The Samples directory located in the \ChemOffice 2010\samples folder contains several
small databases, forms, and sample scripts.
The Cs_Demo database contains about 300
structure covering a range of structural types.
The database contains two tables, that are visible using the form Cs_Demo.cfx. This is the
form used in the following tutorials. Demo.cfx
is a simpler form which displays only the main
table of the same database.
CAUTION
We recommend you make a working copy of
the database before experimenting with it. If
you make changes to the data or structures in
the database, the examples in the tutorials may
no longer give the documented results.
To copy the Cs_Demo.cfx database:
1.
2.
3.
4.
5.
Open Windows Explorer.
Create a folder for the database copies.
Select all Cs_Demo.* files.
Right-click, then click Copy.
Select the folder you created for the database copies.
6. Right-click then click Paste.
You can now experiment with adding, modifying, and deleting data in the copies with no
effect on the Cs_Demo database.
Tutorial 1: Creating forms
Forms let you to display your data in a customized format, to browse and search through your
database, and to interact with other applications, such as Chem & Bio Draw and Chem &
Bio 3D.
You create forms using the Form toolbar.The
Form toolbar only appears when you select
ChemBioFinder & BioViz
User Guide
293
Layout mode. The Layout Mode tool is on the
Main toolbar, so before you begin, look at the
View>Toolbars submenu and make sure there
are check marks next to both Main and Form
Edit. For information about each tool, see
“Creating forms manually” on page 313.
Creating data boxes
Data and structures from a database are displayed in boxes.
To create a data box:
1. On the Main toolbar, click the New Form
Tool.
A new, blank form appears.
2. If the Form toolbar is not visible, click the
Layout mode tool on the main toolbar.
3. In the Form Tool, Click the Data Box tool.
4. In the form window, click drag diagonally
to create a box.
5. Draw two more boxes in the same way. You
will edit them in later steps.
A frame, a framed box, and a text box are different types of boxes and require a label.
To draw a Framed Box:
1. Click the Framed Box tool and drag diagonally to create a framed box.
A box labeled Data is created.
2. Right-click on Data and select Label. The
Box Text or Label dialog box appears. In
the Box Text or Label dialog box, type
Frame Box and click OK.
The label appears above the Framed Box.
TIP: You can change the font of the label from
the Box tab of the Properties dialog box. Just
click the button labeled Font.
294
Tutorials
Chapter 17
3. Click the Frame tool.
4. Place the pointer at the corner of the upper
right data box and drag to create a border
around the group of three data boxes.
The Enter the Label dialog box appears.
5. In the Enter the Label dialog box, type
Frame and click OK.
The label appears above the box.
To place a picture in your form:
1. Click the Picture tool and drag in the form.
The Open dialog box appears.
2. Browse to a graphic file, then click Open.
NOTE: ChemBioFinder 12.0 supports EMF,
WMF, BMP, GIF, JPG, PNG, and TIF formats.
The picture appears in the area you dragged
in the form.
Editing data boxes
To edit one or more data boxes you must first
select them:
1. Click the Selection tool.
2. To select the upper left box click it.
A selected data box is designated by four
black squares at its corners.
NOTE: You can click an empty space in the
form with the Selection tool to deselect the box.
To select multiple boxes:
Press the Shift key and click in each box.
3. In the Save As dialog box, save the form as
tut1.cfx in the directory of your choice.
4. Go to File>Close.
TIP: You can also select multiple boxes by
Click-dragging a rectangle around the box.You
can select all the boxes on the form by choosing
Edit>Select All.
Tutorial 2: Opening a database
The frame and the box behave as one object
when you select, move, resize, or delete. To
separate them into two objects:
1. Click inside the Framed box to select it.
2. Go to Edit>Bring to Front.
To resize a box:
Select a single box, and resize it by
dragging a side or corner.
To reposition a box:
Select a box, point within the selection, and
drag the box.
If you select multiple boxes, dragging the center of a selected boxes moves all of them.
To edit with the Clipboard:
1. Select a box.
2. Try each of the following menu commands:
• Edit>Cut or press delete
• Edit>Paste
• Edit>Undo
• Edit>Redo
Saving a new form
To save a new form:
1. Draw the form, using the Framed box tool
and labeled it as Structure.
2. Go to File>Save As.
After you create a form, you can use it to connect to a database. In this tutorial, you use the
form you saved. In the previous tutorial after
you connect to the database, data will appear
on the form.
Connecting a database to a form
To connect a database to your form:
1. Go to File>Open.
The Open dialog box appears.
2. Select tut1.cfx and click the Open button.
The form you created in the previous
tutorial appears, with its fields are blank.
3. Right-click on the Structure framed box
and select Data Source.
The Box Properties dialog box appears
with the Database tab displayed.
4. Select the Layout mode button on the main
toolbar, if it is not selected already.
5. Click Open Database.
NOTE: The Open and Create Database buttons
work with ChemBioFinder 12.0 databases only.
To access data in other types of databases, use
the Attach Table or the Oracle button (if available). For more information about data
sources, see “Attaching tables from other
applications” on page 342.
The Open dialog box appears.
ChemBioFinder & BioViz
User Guide
295
6. Select CS_demo.mdb (\ChemOffice
2010\samples folder) and click the Open
button.
The database opens, and the Box
Properties dialog box appears displaying
the Database tab.
7. Select a table.
A list of the tables in the database and the
fields in each table are shown. The field
you select determines what type of data
appears in the box you selected in step 3.
Assigning fields to data boxes
To display structures from the CS_Demo database in a Structure Framed box on your form:
From the list of fields in the Box
Properties dialog box select Structure and
click OK.
The Structure field is linked to the Structure
Framed box. In the Structure data box, the
data of the Structure field for the first
record in the CS_Demo database appears.
To assign fields to the other data boxes:
1. Right-click in the Molname Framed box
and click the Molname.
NOTE: After you open a database and table,
the shortcut menu displays the database fields.
The Molname field in the database is linked
to the Name box, and the data for the first
record appears in the Name box.
2. Right-click in the Formula box and click
Formula.
3. Right-click in the ID box and click the
MOL_ID. Go to File>Save As.
4. In the Save As dialog box, save the form as
tut2.cfx in the directory of your choice.
296
Tutorials
Chapter 17
5. Click File>Close.
Congratulations! You have created your own
customized form for viewing the CS_Demo
database.
Tutorial 3: Creating a database
In this tutorial you will create a new database
using the automatic form generation.
1. Open a new form.
2. Right-click in the form and click the Data
Source.
The Form Properties dialog box appears
with the Database tab displayed.
3. Click the Create Database button.
The Save As dialog box appears.
4. Type mydb and click the Save button.
The name of the database appears in the
Properties box.
ChemBioFinder 12.0 creates one data table
(MolTable) containing four fields:
Structure, Formula, MolWeight, and
MOL_ID.
5. Click the Field tab.
You are now going to add two new fields to
the data table.
6. Click the Create Field button.
The Create Field dialog box appears.
7. Type MolName in the text box, change the
width to 254, and click OK.
NOTE: You can enter not more than 254 characters in a text field. If you want a text field to
contain more than 254 characters, choose
Memo/Rich Text from the Type drop-down list.
8. Click the Create Field button again. Type
Boiling Point in the text box, change the type
to Double, and click OK.
NOTE: Use the field type Double to create a
field containing real numbers (such as -123.7
and 43.242).
The data table tree displays your changes.
9. Click the Form tab.
10.Click the Generate form check box. Click the
Style button. In the Form Generation dialog box, make sure the check box for Structure in upper left of form is checked.
11.Click OK in the Form Generation dialog
box and again in the Properties dialog box.
The Mydb form is generated.
Check the field assignments in the data boxes.
12.Right-click in the structure data box.
There should be a check next to Structure
indicating that the Structure field is linked
to the structure data box.
13.Right-click in the Boiling Point data box.
There should be a check next to Boiling
Point.
Adding records
Now that you created new fields and assigned
them to data boxes, you can add data to your
database.
This tutorial was written to demonstrate use of
the Chem & Bio Draw control (the default
structure mode). Before you begin to add structures, you might want to check whether ChemBioFinder 12.0 is set appropriately.
To check the current setting:
1. Right-click on the Structure data box, and
click Properties.
2. In the Box Style section of the Box Properties dialog box, select Chem & Bio Draw
style.
When Chem & Bio Draw style is selected,
ChemBioFinder 12.0 defaults to the Chem
& Bio Draw control. This allows you to edit
structures directly in the Structure data box
in ChemBioFinder 12.0. ChemBioFinder 12.0
style opens Chem & Bio Draw in its own
window for editing.
Now you are ready to begin adding records to
your database.
3. Deselect the Layout tool to hide the Form
toolbar.
4. Double-click in the Structure box.
The Chem & Bio Draw appears.
TIP: If your default is Chem & Bio Draw style,
you can open Chem & Bio Draw by right-clicking
in the structure box and selecting Edit in Chem &
Bio Draw.
5. Select the benzene tool, and draw benzene
on the structure box.
6. Click anywhere outside the Structure data
box to enter the structure in the data box.
Benzene appears in the Structure Data box.
ChemBioFinder 12.0 calculates the
molecular formula, and assigns an ID
number of 1.
7. Click the MolName box and type Benzene.
8. Click the Boiling Point box and type 80.1.
9. Go to Record>Commit Changes create the
new record.
You entered the first record in your database.
The size of your database is indicated in the
Status Bar.
Enter two more records:
ChemBioFinder & BioViz
User Guide
297
1. Go to Record>Add New Record.
2. Add a record for n-Pentane, with bp = 36.1.
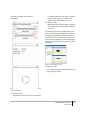
3. Repeat step1 and then add a record for
Cyclohexane (shown below), with a bp =
80.7.
NOTE: After you have two or more records in
your database, you can commit changes by
moving to a different record using the Record
tools.
• Text and structure searches, demonstrated
in Tutorial 4.
• Reaction searches, demonstrated in Tutorial
5.
In this tutorial, you will learn how to search
substructures and text in the CS_Demo Database. This database is included with ChemBioFinder 12.0 as a sample database of
approximately 300 organic and inorganic compounds.
4. Click File>Save.
Opening the demo database
NOTE: Choose Save to save the form. Choose
Commit Changes to save the data in your
database.
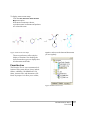
Tutorial 4: Searching a
database
NOTE: Select the Over Current List command
and add it to the instructions
ChemBioFinder 12.0 helps you organize and
find information. One way to find information
is to browse through the database one record at
a time. This is a good way to see some of the
information available. However, because databases can be very big, browsing is often inefficient.
Searching a database is like using the index of
a book. With an index, you can quickly focus
on the few pages you are interested in. When
you search a database, you find only those few
records that have the information you look for.
After you have this smaller collection (a hit
list), you can then browse it much more efficiently than you could the whole database.
ChemBioFinder 12.0 performs the following
types of searches:
298
Tutorials
Chapter 17
To open the CS_Demo database:
1. Start ChemBioFinder 12.0 and click the
Existing tab on the Open dialog box.
If ChemBioFinder 12.0 is already running,
click File>New to open the dialog box, or
access CS_Demo directly from the
Favorites tab of the Explorer Window.
2. Navigate to the...C:\Documents and Settings\All Users\Application
Data\CambridgeSoft\ChemOffice2009\Che
mBioFinder\Samples.
3. In the Samples directory, select
CS_demo.cfx and click the Open button.
The CS_Demo database opens in
ChemBioFinder 12.0.
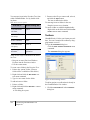
Before you begin searching, open the Explorer
window, if it is not already open.
4. Go to View>Explorer Window.
5. Click the Queries tab.
TIP: The default, set in the Preferences dialog
box, is to save all queries listed in the Queries
tree. If you don’t want to save a particular
query, delete it before closing the form.
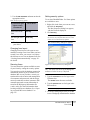
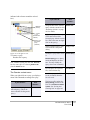
Formula searching
To find compounds in the CS_demo database
with six carbons and one or two nitrogen
atoms:
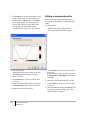
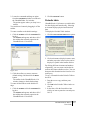
1. Click Search>Enter Query.
The form is cleared so that you can enter a
new query.
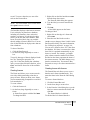
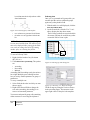
2. Click in the Formula box and type C6N1-2.
3. Press the Enter key.
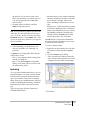
The Status Bar indicates that 12 hits were
retrieved from the 285 records in the
database.
The Queries tree in the Explorer window displays one query as a “child” of the full list.
Queries are saved with the form and can be
reviewed at any time. For more information
see “Managing queries” on page 380.
There are three methods for browsing the
search results:
• In the Form View—Use the Record menu
commands or toolbar to go through the
records.
• In the Data Table View—Browse the table
to view the records.
• In the Continuous Forms View—view multiple records in their own forms.
To toggle between the different views, go to
or Ctrl+W.
To browse the hit list, use the Record menu
commands or their keyboard shortcut equivalents.
View>Switch Views
NOTE: As you keep on viewing the records,
counters in the Status bar indicate the current
record, the current list size, and the total size of
the database.
To view the database in a table that shows the
records in a list, do one of the following:
• Go to View>Data Table>In Current Window.
• Click the Switch to Table tool.
• Type Ctrl+t.
NOTE: The Switch to Table tool is a toggle.
Selecting it again will return you to the Form
view.
The Table view appears and displays all the
records of the current list (in this case, the 12
records that were hit by the search) in a table.
You can sort the records for a specific field in
Table View.
To sort records in Table view by the MolWeight field:
Double click on the MolWeight table
header. The molecular weight field is
sorted in increasing order.
To change the column widths of your table:
Position the pointer over a table header
divider and drag to the width you want.
To use continuous forms to browse your
records:
Go to View>Continuous Forms.
The Continuous Forms view appears. By
default, the Continuous Forms view shows
the same form as the Form view.
Adjust the height of any form by dragging the
bar divider on the left to view the forms
clearly.
Go to View>Form View.
To retrieve all the records in your database
double-click Full List in the Explorer window.
ChemBioFinder & BioViz
User Guide
299
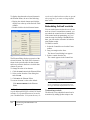
Name searching
Numerical searching
To find all compounds in the CS_Demo database with molecular names starting with
“benz:”
To search in the CS_Demo Database for compounds with molecular weights between 90
and 100:
1. Switch to the Form View, if you are not
already in it.
2. Go to Search>Enter Query.
1. Switch to the Form View, if you are not
already in it.
2. Click Search>Enter Query.
The form is cleared so that you can enter a
new query.
3. Click in the Molecular Weight box and type
TIP: Although the tutorials describe the use of
the Search menu, you may find using the Search
toolbar more convenient. The icons on the toolbar match those you have already seen on the
Search menu. Clicking the Find icon is equivalent to pressing the Enter key when you are
ready to begin your search. See “Queries” on
page 357 for information on more advanced use
of the Search toolbar.
The form is cleared so that you can enter a
new query.
3. Click the Molecule Name box, and type
benz*.
4. Press the Enter key.
12 hits are returned with names starting
with “benz”.
5. Click View>Data Table>In Current Window.
The Table view appears. Browse to verify
that the molecular names are correct.
NOTE: Notice that this search gave you “benzene” but not “bromobenzene.” The query you
entered above is an “anchored substring” and
only gives you strings starting with the indicated substring. For more information on how
to specify text searches, see “Text searches” on
page 357.
300
Tutorials
Chapter 17
90-100.
4. Press the Enter key.
You get 11 hits with molecular weights
between 90 and 100.
5. Go to View>Data Table>In Current Window.
The Table view appears.
NOTE: A molecular weight query is a decimal
value or range. The precision of the search
depends on the number of significant digits
entered. For more information on molecular
weight searching, see “Numeric searches” on
page 358.
Substructure searching
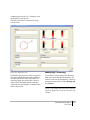
To enter a query and search for a substructure:
1. Click Search>Enter Query.
The form is cleared to allow you to enter
your search terms. The status indicator in
the status bar is changed to remind you that
you are in query mode and the color of the
form may change
2. Double-click in the Structure box.
A blue box is displayed around the
Structure box and the Chem & Bio Draw
control appears.
3. Draw benzene.
To set the correct options for a substructure
search:
1. Select the Search>Substructure menu
option, if it is not already selected.
2. Deselect the Search>Similarity menu
option, if it is selected.
3. Click Search>Find.
ChemBioFinder 12.0 begins searching. The
progress of the search is indicated by
counters in the status bar at the bottom of
the window.
When the search is complete, the number of
hits is displayed in the Current List Size window of the Status Bar, and the form displays
the first hit. In a substructure search, the
matched portion of each molecule is highlighted in red.
NOTE: You can also set search preferences on
the Search tab of the Preferences dialog box.
For more information, see “Customizing
ChemBioFinder 12.0” on page 451.
base that have a benzene substructure and that
have a molecular weight greater than 400.
To perform a combined search:
1. Click Search>Enter Query.
The form is cleared so that you can enter a
new query.
2. Double-click in the Structure box.
The Chem & Bio Draw control appears.
3. Draw benzene.
4. Click the Molecular Weight box and type
>400.
5. Press the Enter key.
6. You get 8 hits from the 285 records in the
database. Click View>Data Table>In Current
Window.
The Table view appears. Browse to verify
that the molecular weights are correct.
Congratulations! You have completed the tutorial on searching a database using ChemBioFinder 12.0. You may now close the CS_Demo
database.
Tutorial 5: Reaction queries
In this search you get 122 hits of structures that
contain an aromatic six-membered ring. The
list you can browse is limited to the hits found
in the search.
NOTE: If a search gets no hits, an alert
appears and you are returned to the query mode
with the query on display.
Combined searching
In some cases, you may want to combine structure searching with text searching to find a specific class of compounds. For example, you
may want to find all compounds in the data-
In addition to helping you organize information about individual substances, ChemBioFinder 12.0 also allows you to store and search
chemical reactions.
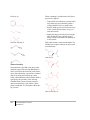
Searching for reactants
Searching for reactants is useful if you have a
known starting material and you are interested
in learning more about what substances it can
produce.
For example, to search for Grignard reactions,
or reactants:
1. Click Search > Enter Query.
The form clears.
ChemBioFinder & BioViz
User Guide
301
2. Double-click in the Structure box.
The ChemDraw control appears.
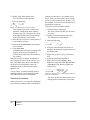
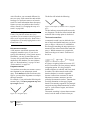
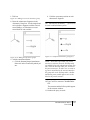
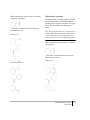
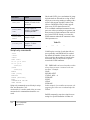
3. Draw the following:
Figure 17.9 Entering a reactant in a query
This structure represents a carbon atom
bonded to a magnesium atom, which is
bonded to any type of halogen. The arrow
at the right indicates that you are looking
for this substructure as a reactant.
4. Select the Search>Substructure menu option, if
it is not already selected.
5. Deselect the Search>Similarity menu option,
if it is selected.
6. Click Search>Find.
ChemBioFinder 12.0 begins searching. The
progress of the search is indicated by
counters in the status bar at the bottom of
the window.
When the search is complete, the number of
hits is displayed in the Current List Size window of the Status Bar, and the form displays
the first hit. In a substructure search, the
matched portion of each molecule is highlighted in red.
You get 3 hits—reactions in which an alkyl
magnesium halide is consumed. Browse the
list of three hits as in previous tutorials.
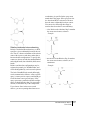
Searching for products
In the next exercise, you search for information
on a particular reaction product. Searching for
302
Tutorials
Chapter 17
products of reactions is very common in syntheses, where you know what you are aiming
for but you do not know how to produce it. In
this example, we look for reactions that close a
ring alpha to a carbonyl.
To perform a reaction product search:
1. Click the Search > Enter Query.
The form is cleared so that you can enter a
new query.
2. Double-click on the Structure data box.
The ChemDraw control appears.
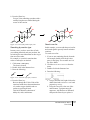
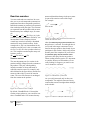
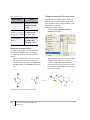
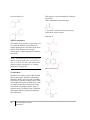
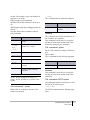
3. Draw the following:
4. Switch to either selection tool (Lasso or
Marquee) and select the single bond next to
the double bond.
5. Right-click, point to Topology, and choose
Ring.
6. Select the remaining single bond.
7. Right-click and select Topology > Ring.
Right-click again and select Reaction Center
> Make/Break. Your structure should now
look like this:
Figure 17.10 Product query with topology and reaction center indicators
The arrow at the left indicates that you are
looking for this substructure as a product.
8. Press the Enter key.
You get 3 hits containing a product with a
carbonyl ring that was formed during the
course of the reaction.
O
OH
HO
HO
O
H
H
Cl
Cl
H
O
Figure 17.11 One of the product query hits
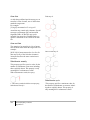
Searching by reaction type
In many cases, you have some idea of both
your starting materials and your products, but
are looking for some information on how to get
from one to the other.
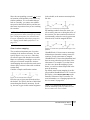
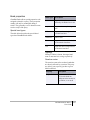
For example, to search for reactions that
reduce a carbonyl to an alcohol:
1. Click Search > Enter Query.
The form is cleared.
2. Double-click in the Structure box.
3. Draw the following:
O
H
Cl
O
Search over list
In this example, you start with the previous list
and search again to get only ketone reduction
reactions.
To search over a list:
1. If you are not continuing directly from the
last example, double-click the previous
query in the Query Tree to make sure it is
the active hitlist.
2. Click the Search>Over Current List from the
menu.
3. Double-click in the Structure box.
4. Draw the following:
OH
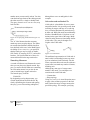
Figure 17.12 A reaction type query structure
4. Press the Enter key.
Browse through the 23 hits. Each of the
reactions found shows the transformation
of a carbon-oxygen double bond to a
carbon-oxygen single bond.
This hit list includes reductions of
aldehydes, acids, and ketones.
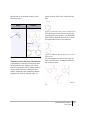
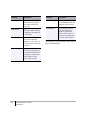
a. Using a Selection tool, right-click on the
double bond and set Reaction Center bond
properties to Change.
b. Using the Text tool, select one of the
carbon atoms. Type [NOT O,H] (all
uppercase, with brackets as indicated)
and press the Enter key to replace it.
ChemBioFinder & BioViz
User Guide
303
c. Still using the Text tool, select the label,
right-click and choose Repeat Last Label.
d. Double-click on the other carbon atom
to reproduce the label. The structure
now looks like this:
Figure 17.13 Modified reactant query
You have specified a search for ketones by
adding the restriction that the atoms
adjacent to the carbon must not be oxygen
atoms or hydrogen atoms. You also
specified that the double bond had to
change, not be broken.
5. Press the Enter key.
You get 13 hits. Each reaction shows the
reduction of a ketone to an alcohol. In the
Queries Tree, this search is shown as a
“child” of the first query.
Figure 17.14 A child search in the queries tree
TIP: If you plan to do several searches over a
hitlist, use the Set Domain to Current List command rather than Search Over Current List.
Setting a domain eliminates the need to keep
restoring the original hitlist.
304
Tutorials
Chapter 17
Tutorial 6:Creating a BioViz
chart
BioViz charts are created from the
View>BioViz Plots submenu, or from the data
field context menu. Existing plots can be displayed (when not visible) or removed from the
form with the View menu. You may create a
plot based on any numerical field in the database. The following options are available:
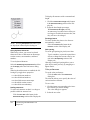
• Line plots with one or two variables
• Scatter plots with one or two variables
• Histograms (X-axis variable only).
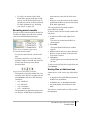
Single variable plots
A single variable plot displays a Y-coordinate
variable vs. the record number.
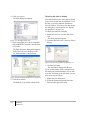
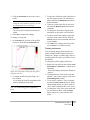
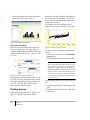
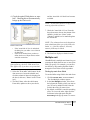
To create a single variable plot:
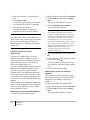
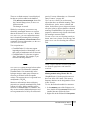
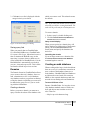
1. Point to BioViz Plots on the View menu:
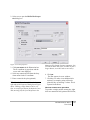
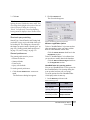
2. Select New to open the BioViz Plot Properties dialog box:
Figure 17.15 Plot properties
3. Click One Variable in the Dimension box.
The X-coordinate is grayed out and the
Analysis tab is not displayed.
4. Select any numerical field from the dropdown menu for the Y-coordinate.
5. Enter a name for the plot (optional).
TIP: Note the Point Limit field on the lower
right side of the Properties dialog box in Figure
above. Plotting a large dataset can be very
slow. As a safely precaution, the default is set to
500, meaning only the first 500 points in the
dataset will be plotted. On most computers, this
will take no more than a few seconds. To plot a
larger dataset, reset this value as necessary.
6. Click OK.
The Plot appears in a new window.
7. Click the Notes tab to view addition information. For example, points will not be
plotted if they are missing Y values. This is
reported in the Notes.
Alternate context menu procedure
To produce a single variable scatter plot, right
click in a numerical field, point to BioViz Plot,
ChemBioFinder & BioViz
User Guide
305
and click ID Plot.
Two-variable plots
In two variable plots, you choose both the X
and the Y coordinates.
To create a two-variable plot:
1. Click BioViz Plots>New on the View menu.
2. Click the Two Variable option in the Dimension
box.
3. Select fields for both the X and Y axes.
4. Click the Scatter plot option in the Style box.
5. Enter a name for the plot (optional).
6. Click OK.
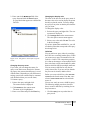
Figure 17.16 data field context menu
You may select the axes in either order. Once
you have selected a field for an axis, it is displayed in the context menu.
Histogram plots
A histogram plot is a variation of a single variable plot, where the X-coordinate is the variable value, and the Y-coordinate shows the
count in each histogram cell.
To create a Histogram plot:
1. Click BioViz Plots>New on the View menu.
2. Click the One Variable radio button in the
Dimension box of the BioViz Plot Properties
dialog box.
3. Click the Histogram radio button in the Style
box.
4. Click either the Number or Size radio button
in the Bins box and enter a value (optional).
• Number sets how many bars will appear in
the plot
• Size sets the number of data points per bar.
5. Select any numerical field from the dropdown menu for the X-coordinate.
6. Enter a name for the plot (optional).
7. Click OK.
The high and low values of each bar are
displayed under the plot.
306
Tutorials
Chapter 17
Figure 17.17 Two-variable selection with the
context menu
If you want to change the axis assigned to a
field, select Reset X,Y and start over.
Working with plots
Three optional windows facilitate working
with BioViz plots: Structure, Filter, and
Details.
• Structure — displays structures of data
points as you mouse over them; used when
the form is not visible or is displaying a different record.
• Details — displays data for selected fields,
either from the database or from child
tables, as you mouse over data points; used
when the form is not visible or is displaying
a different record.
• Filters — displays filter bars for those fields
being used to modify the plot.
TIP: In order to see some of the features
described below, you will need to “tile” the
windows to view the form and the plot simultaneously.
Filters
Filters can be used in two different ways:
• Filter a plotted variable to reduce its range
• Filter on other variables to add other dimensions to the plot.
To activate filters, click the View > Filter Window
or use the context menu (Right-click menu) for
plots. When the filter window opens, Rightclick in it to select or deselect fields. There is
no limit to the number of filters that can be
applied to a plot.
NOTE: Filters act on all active plots, not just
the one displayed.
cally every time you adjust a filter. Autoscale
is a toggle that remains in effect until you cancel it.
Alternately, you can make all of your filter
adjustments without changing the scale, then
select Rescale to All Points on the BioViz context
menu.
Zoom
The BioViz zoom feature is a toggle activated
from the BioViz context menu.
To expand a portion of a BioViz plot:
7. Select Zoom on Drag on the BioViz context
menu.
A check mark appears next to the command
when it is selected. To deselect, click the
command again.
8. Drag over a section of the plot.
When you release the mouse button, the
scale expands to show the points selected.
While the initial view is the area you selected,
you may use the scroll bars to view any part of
the plot at the expanded scale. Clicking either
the X or Y Zoom Button will return that axis to
the original scale, while leaving the other axis
at the expanded scale. Clicking Unzoom on the
BioViz context menu will restore the original
scale to both axes simultaneously.
You may repeat zoom, that is, zoom in on an
area in an already expanded scale. If you have
performed multiple zooms, the Zoom button
acts as an Undo control, reversing one step at a
time.
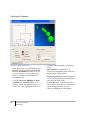
Statistical analysis
Autoscale
When you filter a plot, you may want to
expand the scale to better display the remaining points. If you select Autoscale on the BioViz
context menu, the scale will readjust automati-
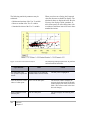
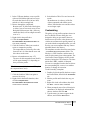
You can perform statistical analyses on plots
using the Analysis tab on the BioViz Plot Properties dialog box. The tab is available only for
two-variable plots.
ChemBioFinder & BioViz
User Guide
307
The following statistical parameters may be
calculated:
• Minima and maxima of the X or Y variable.
• Mean or median of the X or Y variable.
• Standard deviation of the X or Y variable.
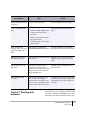
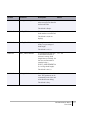
The following table describes how to perform
various functions in BioViz.
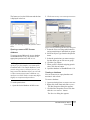
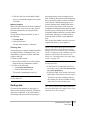
Figure 17.18 Plot with statistical analysis
if you want to...
When you select curve fitting, the R squared
value also becomes available for display. The
calculated values are displayed below the plot.
You may also display a linear, quadratic, or
cubic least-squares fit of the data points, with
or without a confidence interval of one to three
standard deviations.
then
result
See which data point
navigate to the record using the
corresponds to a particular ChemBioFinder Record Toolbar.
record...
The data point is highlighted.
View the structure or data mouse over the data point.
values of a data point...
The Structure window displays the
structure for the data point; the Details
window displays the values of selected
fields. (The current record in the form
does not change.)
Select a database record
from the plot...
The form displays the matching data
record.
308
Tutorials
Chapter 17
click on a data point.
if you want to...
then
result
Display plotted variable(s) select (or create) the query.
for a query...
Create a query from the
plot...
The plot displays the current query.
On the BioViz context menu:
1. If a check mark appears next
to Zoom on Drag, click to
deselect it.
2. Drag over the points of interest to select them.
3. Click Selection to List on the
context menu.
The selected points become a new
query.
The plot is locked to a given dataset.
Prevent a plot from
check the Lock option in the
changing when you select BioViz Plot Properties dialog box. Note that filters will be locked as well.
queries or change variables...
Expand the plot to view
individual data points...
Select Zoom on Drag on the BioViz Dragging over a section of the plot
context menu.
enlarges it, rather than selecting the
points.
Change the color of the
data points...
In the Queries control, select
The data points are displayed in the
Change Color on the Queries
color you select.
context menu. Note that you cannot
change the color of the Full List,
only of daughter lists.
Plot multiple datasets
(overlay)...
With the Full List selected, click
Color on Plot on the Queries
context menu for each query you
want to overlay. Alternately, click
the query or the colored box next to
it.
Tutorial 7: Working with
subforms
A check mark appears in the box next
to the query name, and the data points
are displayed in the color assigned to
the query.
Subforms allow you to display relational data.
If you have a database containing two or more
data tables, and these data tables share a com-
ChemBioFinder & BioViz
User Guide
309
mon, linking field, then you can display data
from both tables. Whenever the value of the
linking field changes in the main form, the subform only displays those records from its table
which have the same value in the linking field.
You can also use subforms to display data
from different databases.
In this tutorial, you open the CS_Demo database and display the MolTable in the main
form. Then you display the Synonyms table of
the CS_Demo database in a subform. By defining the MOL_ID field as the linking field, you
display the two sets of data relationally.
Creating a subform
To create a subform:
1. Open your ChemBioFinder 12.0 form
tut1.cfx.
Opening this form connects you to the
CS_Demo.mdb database.
2. Make some space on the right side of the
form by rearranging the data boxes and
making them smaller.
3. Click the Subform tool.
4. In the form, drag to create a large subform.
TIP: If you cannot make room on the right side
of your form, you can put the subform at the
bottom of the form.
When you release the mouse button the
Subform Properties dialog box appears.
5. Click the Form tab, then select Synonyms
from the hierarchical tree display.
6. Click the Generate form check box, then click
the Style button.
310
Tutorials
Chapter 17
7. Select the Plain form, deselect all of the
fields to be included except Synonym, and
click the OK button.
You are returned to the Subform
Properties dialog box.
8. Click the Subform tab.
9. SYN_ID already appears as the default in the
Link to SYNONYMS field section. Using the
drop-down menu, choose MOL_ID for the
Link from MOLTABLE field.
10.Click the OK button.
You have just selected the data source for
your subform and linked it to the main
form.
The MOL_ID field links the main form and
subform. Clicking in either form activates it.
To test this:
1. Click anywhere outside the subform box,
and browse your database using the Record
tools.
As each molecule record of the MolTable is
displayed, the subform shows the first
matching ID from the Synonyms table.
2. Click inside the subform box.
Now when you browse, you are browsing
only the entries in the subform.
To display all of the synonyms:
1. Toggle out of Layout mode.
Double-click in the subform box to switch to
Table view. Save and close the file:
1. Click File > Save.
2. Click File > Close.
Congratulations! You have completed the
ChemBioFinder 12.0 Tutorials.
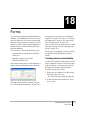
18
Forms
You use forms to interact with information in a
database. A ChemBioFinder 12.0 form is composed of data boxes for viewing or modifying
data items, such as structures, numbers, text, or
pictures. A form can also contain subforms for
relational access to different data tables and
different databases.
You can create a form in the following ways:
• Automatically, using the Form Generator
dialog box.
• Manually, using the Form tools.
• With the Database Tree.
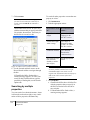
The example below shows a form displaying a
single record of information from a database.
Figure 18.1 Form, showing a single record.
and setting box properties (see “Setting box
properties” on page 318), tabs (see “Creating
and editing tabs” on page 318), and security
(see “Securing forms” on page 327).
You can edit your form at any time (see “Editing forms” on page 324 and “Changing form
layout” on page 327).
The first step in designing a form is selecting
the database and deciding which fields to
include.
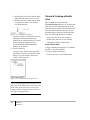
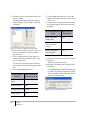
Creating forms automatically
Use the Form Generation dialog box to create a
form or change the layout of an existing form.
In the dialog box, you choose the form style
and properties from pre-defined options.
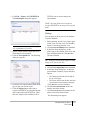
To begin creating a new form:
1. Right-click on a blank area of the current
form and select Data Source.
The Form Properties dialog box appears.
2. In the Form Properties dialog box, select
the Form tab.
Creating a form consists of creating a layout
(see “Creating forms manually” on page 313),
ChemBioFinder & BioViz
User Guide
311
3. Select the Generate form check box, then click
the Style... button.
The Form Generation dialog box appears.
In the left panel, all the fields are selected
by default.
7. Use the thumb wheel arrows to select the
number of columns, from one to four, in the
Columns: list.
8. Use the Grid size: drop-down menu to choose
the size and spacing of the boxes and grid
as follows:
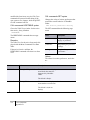
If you want the boxes Then, for Grid
to be
Size, choose
larger and spaced
further apart
Large.
medium, relative to the Medium.
Large and Small
settings
Figure 18.2 The Form Generation dialog box
4. Deselect those fields in the Choose fields to be
included section that you want to exclude
from the form.
5. To have a Structure box in the upper left
corner of the form, select the Structure in upper
left of form check box.
If you do not select this option, the boxes
are generated in the order they appear in the
list.
6. Select the Form style you want:
If you want the
boxes to
Then, in the Form
style section, click
smaller and spaced
closer together
Small.
Table 18.2 Grid size options
9. Click the OK button in the Form Generation
dialog box.
Your form settings are saved.
10.Click the OK button in the Form Properties
dialog box.
A warning dialog box appears allowing you
to create a new form or replace the existing
form. Click No to create a new form, Yes to
replace the existing form.
be surrounded by a Framed.
frame
be labeled above
Titled.
be labeled to the left Labeled.
not be labeled
Plain.
Table 18.1 Form style options
312
Forms
Chapter 18
Figure 18.3 New form warning box.
Saving a form
In most non-database applications—including
Chem & Bio Draw and Chem & Bio 3D—you edit
data on the screen, but your changes are not
made permanent until you click File>Save, or
type Ctrl+S.
In database programs such as ChemBioFinder
12.0, your changes are automatically and permanently saved to the database when you
switch records. This is “committing” the
changes. You then have the opportunity to
revert to the original data by clicking
Record>Undo Changes.
The File>Save menu command refers only to
changes made on the form itself, such as the
position of boxes. Choosing the File>Save
menu command has no effect on changes you
make to data stored in the database. Saving a
form also saves subforms and changes that you
make to subforms.
After you create a form, you can save it. When
you retrieve the saved form, it automatically
opens a connection to the database defined in
the forms.
To save a form as .cfx file:
1. Click File>Save. To save the form under a
new file name, use File>Save As.
The Save dialog box appears.
2. Choose the directory in which you want to
save the form, type a filename, and click the
Save button.
ChemBioFinder 12.0 saves the form with a
CFX extension
NOTE: While saving, if you select All Files in
the Save as type dialog box, you will see files
with .msf and .msk extensions. A file with the
extension .msf is a multiple sequence file. A file
with .msk extension is a mask file.
Creating forms manually
You create a form and define it by using the
Form tools to create objects and the Box Properties dialog box to set the form properties.
• To create a new form, do one of the following:
•
•
Click File>New.
Click the New File icon on the Main Toolbar.
• To create form with the database tree
The Database Tree is the same familiar tree as
in the Database Properties dialog, showing the
tables (or views) and columns of the currentlyopen database. When you open or activate a
form or subform, or change databases, the tree
updates to display the current database, and
expands to show the columns of the currentlyselected table.
To view the Database Tree (if it is not visible):
1. Select the View>Explorer Window menu
option.
2. Click the Database tab.
To use the Database Tree to build a form:
1. Open a new form.
ChemBioFinder & BioViz
User Guide
313
2. Right-click on the form and select Data
Source.
3. Click the Open Database... on the Database
tab.
4. Browse to a database, and click the Open.
5. Click OK in the Form Properties dialog box.
The Database Tree displays the database.
To display the Form tools, do one of the following:
• Click the Layout icon on the Main toolbar.
• Select the View>Toolbars>Form menu
option.
The Form toolbar appears providing tools
for you to create and edit a form.
Control Box
Selection
check box
Picture Subform
Frame
tool
Data
Box
Figure 18.4 Creating a form with the database tree
6. Double-click the Structure field in the Database Tree.
A structure box appears in the upper left of
the form.
Text
Framed Box
Button
Profile
Box
Grid
Figure 18.6 The Form toolbar
Using the grid
In a new form, the snap grid is turned on by
default. This grid helps you align boxes on the
form. Turning on the grid forces objects to
snap to the grid as they are drawn.
To toggle the grid on or off, do one of the following:
• Click the Grid tool on the Form toolbar.
• Select/deselect the View>Grid menu option.
Figure 18.5 Structure box created from the database
tree
7. Continue double-clicking the other fields.
8. Use the Selection tool to move the data
boxes to where you want them in the form.
Using the form tools
You must use the Form Tools toolbar to design
a form. Box creation commands are not available from the menu.
314
Forms
Chapter 18
NOTE: You can change the grid spacing using
the Preferences dialog box. See “Setting preferences” on page 451..
Creating boxes
A ChemBioFinder 12.0 form is composed of a
collection of boxes that display data from the
associated database, or other information. Each
box displays one data item of the current
record. To create a data box, use one of the
tools on the Form toolbar.
NOTE: The Form toolbar is not visible unless
the Layout button is selected.
The Data Box displays a data item or structure.
Use it to display any data from a database,
including text, numbers, dates, molecules,
reactions, or pictures. It is the only box that
allows you to edit data in the database. Data
boxes do not have labels, but you can label
them by adding a Frame or Plain Text. You can
also use the Data Box to display static data not
from a database.
To draw a Data Box:
1. Click the Data Box tool.
2. On the form, drag diagonally to create a
box.
To specify what type of data is displayed in the
box, See “Setting box properties” on
page 318.. If the form already has a database
open, you can right-click in the data box, select
Field... and choose from a list of the available
fields.
Creating frames
The Frame tool allows you to create an enclosure with a label surrounding a data box or
group of boxes. When you draw a new frame,
you are automatically prompted for a text label
to be attached to it.
To create a frame:
1. Click the Frame tool.
2. On the form, drag diagonally to create a
frame.
A framed box appears with the label Data.
To change the label:
3. Right-click on the label and choose Label
from the drop-down menu.
The Enter the label dialog box appears.
4. Type the label you want to attach to the
frame.
5. Click OK.
A fixed label appears on the frame.
To change a label:
1. Right-click on the edge of a frame and
select Label.
2. Enter the new label in the text box.
Another way to change a frame’s label is in the
Box Properties dialog. For more information,
See “Setting box properties” on page 318..
You can use a frame to show “live” data from
the database. If a frame is connected to a database field, it is updated automatically as you
browse or search. For example, you might
place a frame around a structure field, where
the label on the frame represents the name of
the current structure. The label changes every
time the structure does. You must use Box
Properties to set up a live data connection for a
frame.
Creating boxes with frames
The Framed Box tool allows you to create a
data box and a frame simultaneously. You
name the frame in the Enter the Label dialog
box.
To create a framed data box:
1. Click the Framed Box tool.
2. On the form, drag to create a box.
3. In the Enter the Label dialog box, type the
label you want to attach to the frame, and
click OK.
The framed data box is labeled.
To edit the label of a framed data box:
ChemBioFinder & BioViz
User Guide
315
1. Select the frame by carefully right-clicking
near the edge of the framed box and select
Label.
2. In the Enter Box Label dialog box, type the
new label. The label does not have to match
the name of the field displayed in the box.
3. Click OK.
1. Click the Plain Text tool.
2. On the form, drag to create an area to specify where the text will appear.
The Enter the Text dialog box appears.
3. Type the text you want to display.
4. Click OK.
When you create a data box and frame with the
Framed Box tool, these two items are connected. To manipulate them separately:
Select the Framed box, then click
Edit>Bring to Front.
Automatic labels
You can let ChemBioFinder 12.0 automatically label your framed box with the name of
the field from the data tree.
To automatically label a Framed Box:
Right-click inside the data box and select
the field from the drop down list.
The data appears in the data box and the
frame label changes to match the field
name.
You cannot automatically label a frame that
was created separately from a data box.
Non-data boxes
Boxes are not only used to display data. The
Form toolbar contains two tools, Plain text and
Picture, to create static displays (though they
may also used to display data) and three others
with special functions.
Adding plain text
The Plain Text tool allows you to display text
without a box or a frame. You can use it to
place a static label on the form, but, like a data
box, you can also use it to display live data if
desired.
To use the Plain Text tool:
316
Forms
Chapter 18
Figure 18.7 Creating text on a form
To change the font or color of the text, select it
with the Form toolbar Selection tool. Use the
text formatting toolbar to customize the text.
To use plain text to display data:
1. With the Select tool, right-click on the text
and select Properties.
The Box Properties dialog box appears
with the Box tab displayed.
2. Select a field from the data table.
The Data: text box becomes grayed out, and
the Data Source selection switches to Field.
3. Click OK.
The contents of the field are displayed in
plain text.
Adding pictures
The Picture tool allows you to create a Picture
Box to display a bitmap (BMP, GIF, etc.) or
Windows metafile (WMF, EMF) picture. It
can display a static file, or a live one stored in a
picture column of a database.
To create a static picture:
1. Click the Picture tool.
2. On the form, drag to create an area for the
picture to occupy.
The Open dialog appears.
3. In the Open dialog box, select the file you
want to display, then click the Open button.
The picture appears in your form.
NOTE: The file is not actually embedded in the
form. Only its filename is saved with the form.
If you move or rename the file, the form will not
display the corresponding picture. However, if
you make changes to the picture and keep its
filename the same, the picture in the form will
be updated.
To create a Picture box linked to a field.
You must have a picture field in the
database. See “Creating fields” on
page 343. for more information.
1. Click the Picture tool.
2. On the form, drag to create an area for the
picture to occupy.
The Open dialog appears.
3. Click the Cancel.
A blank box appears in the form.
4. Right-click in the box and click Properties.
5. In the Box Properties dialog box, select the
picture field you want to link to the box and
click OK.
The picture field item appears in the box.
To read in a picture file or to replace a picture
in a Picture Box:
1. Right-click a picture and click Read File.
The Open dialog box appears.
2. In the Open dialog box, select the file you
want to display in the Picture Data Box,
then click the Open.
The new picture is displayed in the Picture
Box.
NOTE: If the Picture box is linked to a Picture
field, you must click the Commit changes tool to
save the picture in the database.
To save a file from a Picture Data Box:
1. Right-click on the Picture Box and select
Save File.
2. In the Save As dialog box, type a file name,
then click the Save.
The picture is saved.
Adding a check box
The check box tool allows you to add check
boxes to your form. A check box can be
assigned to either a Boolean or an Integer field.
To add a check box:
1. Click the check box tool.
2. On the form, drag an area large enough for
the text next to the check box.
The Enter the label dialog box appears.
3. Type in the text and click OK.
4. Right-click, and select a Boolean or Integer
field from the field list to assign to the
check box.
Adding a button
Buttons on the form are used to activate
scripts.
To place a button on a form:
1. Write a script using the ChemBioFinder
12.0 Automation Language (CAL).
2. Click the Button tool on the Form toolbar.
3. On the form, drag to draw a button.
The Enter the Label dialog box appears.
ChemBioFinder & BioViz
User Guide
317
4. Enter a label. The text can be descriptive
(“Click to browse”) and does not have to
correspond to the name of the script.
5. Click OK.
For more information about using a button to
run a script, See “Using scripts” on page 467..
Adding a subform
The Subform tool is used to create a subform
box to display data from a related data table.
See “Relational Data and Subforms” on
page 399. for more information
Adding a profile
The Profile box tool creates a profile box on a
form. Compound profiles are a new feature in
ChemBioFinder 12.0. See “Compound Profiles” on page 405. form more information.
Adding a control
The Control box tool is used to embed an
ActiveX control in a form. You can use this to
display a calendar, spreadsheet, chart, spectrum, picture, web link, and so forth. See
“Embedding ActiveX controls” on page 458.
for more information.
Creating and editing tabs
If you have a large number of fields in a database, you can access information more easily,
and make the form less cluttered, by using tabs
to divide a long form into smaller parts contained on separate tabs.
To create tabs on a form:
Right-click an empty part of a form and
select Add Tab context.
Two tabs appear in the lower left corner of
the form. Clicking on the second tab will
present you with a new empty form.
To rename a tab:
318
Forms
Chapter 18
1. Right-click the tab and click Rename Tab.
The Tab Name dialog box appears.
2. Type a name for the tab and click OK.
The new name appears on the tab.
To remove a tab:
Right-click the tab and click Delete Tab
context.
The tab is removed.
Setting box properties
Use the Box Properties dialog box to set
ChemBioFinder 12.0 form attributes, including: data source, display type, font, and box
style.
To open the Box Properties dialog box:
Right-click on a data box and click
Properties.
The Box Properties dialog box appears.
NOTE: The “Properties” option is only available in Layout mode.
Setting data box styles
Use the Box Properties dialog box to change
the style of a data box on a form. For example,
you can change a data box to a frame or picture.
The Box Style menu only shows applicable
styles for each field. For example, you cannot
show a real number in a Picture.
For information about field types, See “Creating fields” on page 343..
Choose from the following styles:
• Data Box—displays alphanumeric data.
Can display multiple lines of data.
• Frame—displays alphanumeric data. Can
display a single line of data.
• Plain Text–displays alphanumeric data.
Text data can be displayed in multiple lines.
(Use Ctrl+Enter to start a new line.) You set
the field size when you create the field, up
to a maximum of 254 characters.
• Picture–displays Windows metafile data.
Pictures are scaled to fit within picture
boxes, with fixed height to width ratios.
• Formula–displays any kind of text but numbers are subscripted. Formulas are presented in modified Hill order, as follows: If
a substance contains both carbon and
hydrogen, the carbons are listed first, followed by the hydrogen atoms, followed by
other elements alphabetically by element
symbol. If a substance contains carbon, the
carbons are listed first, followed by other
elements alphabetically by element symbol.
Otherwise, all elements are listed alphabetically by element symbol.
• Button–used to create buttons to actuate
scripts. Buttons display button labels.
• Rich Text—displays styled data in multiple
lines. (Use Ctrl+Enter to start a new line.)
You can format the text with the Text Format toolbar. If the data in a field contains
rich text, markup characters are displayed.
• Structure (Chem & Bio Draw style)–displays
chemical structures or reactions. Reactions
are laid out for best fit with the box and the
layout may change if the box is reshaped.
The box defaults to using the Chem & Bio
Draw Control to create and edit structures,
but you can reset the preference. For more
information, See “Setting preferences” on
page 451.
• Structure (ChemBioFinder style)–as above,
but defaults to opening Chem & Bio Draw to
create and edit structures.
• Structure (Chem & Bio 3D style)–as above,
but defaults to display 3D structures.
To set the box style:
1. Right-click in the data box you want to
change and click Properties.
The Box Properties dialog box appears.
2. Choose the box style from the Box Style
drop-down menu.
3. Click OK.
Viewing structures
You can display structures in a structure box in
three styles:
• ChemBioFinder
• Chem & Bio Draw
• Chem & Bio 3D
In ChemBioFinder style, the Chem & Bio Draw
application opens when you want to edit structures or create a query. (This mode of operation was used in all earlier versions of
ChemBioFinder11.0.)
In Chem & Bio Draw style, you edit directly in the
structure box using the Chem & Bio Draw Control. (This mode of operation was introduced in
ChemBioFinder 8.)
The Chem & Bio 3D style is a display-only format that allows you to rotate and analyze structures within a ChemBioFinder 12.0 structure
window. See the Chem & Bio 3D User’s Manual for information on using the Chem & Bio
3D Control.
The Chem & Bio Draw format displays more
graphically-rich drawings than the ChemBioFinder 12.0 format. However, ChemBioFinder
12.0 does not use all of the Chem & Bio Draw
drawing features when searching. For example, textual annotations are ignored, and
R-group tables are not recognized. Certain
ChemBioFinder & BioViz
User Guide
319
graphics, such as rectangles and orbitals, are
not transferred., nor does ChemBioFinder 12.0
consider their chemical implications.
To choose how to view structures:
1. Right-click in a structure data box and
choose Properties....
The Box Properties dialog box appears.
2. On the Box tab, in the Box Style section,
select the structure format to view from the
menu:
Table 19 Structure box format options
If you want to
Then choose
edit in the Structure Structure (Chem & Bio
box using the Chem Draw style).
& Bio Draw Control
edit in Chem & Bio
Draw
insert 3D images
Structure (ChemBioFinder style).
Structure (Chem
Bio 3D style).
&
Viewing structures in Chem & Bio 3D
format
Unlike the Chem & Bio Draw and styles, Chem &
Bio 3D style is view only. You cannot edit the
structures in Chem & Bio 3D style.
To activate the Chem & Bio 3D Control:
Double click in the 3D Structure Box.
Click outside the box to deactivate the
control.
To rotate the structure:
Drag in any direction in the box.
Unlike in Chem & Bio 3D, you do not have
pure (locked) X- or Y- axis rotation, but you
can approximate them by dragging
horizontally or vertically.
320
Forms
Chapter 18
The Chem & Bio 3D Control displays different
context menus, depending on whether you
Right-click while pointing to the model or
while pointing elsewhere in the Structure Box.
Either can be used to change the display mode.
To change the display, method one:
1. Double click in the 3D Structure Box to
activate the Chem & Bio 3D display.
2. Point to an atom or bond in the model and
Right-click.
3. Select a display mode from the Display
Mode submenu.
Method two:
1. Double click in the 3D Structure Box to
activate the Chem & Bio 3D display.
2. Right-click anywhere in the 3D Structure
Box, but not on the model itself.
3. Select a display mode from the View>Model
Display>Display Mode submenu.
For more information on the Chem & Bio 3D
Control, see the Chem & Bio 3D User’s Manual.
Setting fixed and live data
In the Box Properties dialog box, you can designate whether the data source is fixed or from
a field. Fixed data is attached to the form and
does not change as you browse. Data from a
field is stored in the database and is different
for each record. As you browse, the record display updates according to the contents of the
field.
To specify live data for a data box:
1. In the Box tab, select the field to associate,
and then click the Field radio button.
2. Click OK.
The box display updates as you change
records.
To specify fixed data for a data box:
1. In the Box tab, select the field to associate,
and click the Fixed radio button.
2. Type a label in the text box. If you choose a
structure or picture field, click the browse
tool to browse to the file to display.
3. Click OK.
The box display is fixed.
Adding a data box menu
You can add a menu containing a list of
choices to a data box so you can choose an
item from it to appear in the data box.
To add a menu:
1. Right-click on a data box and click Properties.
The Box Properties dialog box appears.
2. On the Box tab, click the With drop-down
choices check box.
The Choices tab appears.
3. Take the appropriate action:
Table 20 Menu list options
If you want to
use a list from a
database table as
the data box menu
Then click
From table and
follow the instructions at the bottom
of the dialog box.
create your own list Fixed list of choices
for the data box
and follow the
menu
instructions at the
bottom of the dialog
box.
Table 20 Menu list options
If you want to
use a list from a
database table and
add your own items
to the data box
menu
Then click
a. From table.
A list appears.
b. Click Fixed
list of
choices,
and
edit the list.
4. Click OK to close the dialog box, then click
in the data box.
A button appears in the lower right corner
of the box when you click in the box.
5. Click the button to display the menu.
6. Select any item on the menu—the text
appears in the top left corner of the box and
the button disappears.
Click within the data box to make the
button reappear.
Adding a scroll bars
Scroll bars are used to accommodate lengthy
data when there is limited space for the data
box.
To add a scroll bar:
1. Right-click a data box and click Properties.
The box properties dialog box appears.
2. In the Box style section, select the With
scroll bars check box
3. Click OK.
The scroll bar appears on the bottom right
in the data box.
Hiding data boxes
You can show or hide boxes when switching
between query and browse mode. For example,
you can hide non-searchable data boxes during
query entry, or show only those data boxes that
display information useful for query entry.
ChemBioFinder & BioViz
User Guide
321
When you are in form layout mode, all boxes
are visible, regardless of the setting.
To hide data boxes:
1. Right-click on the box and click Properties.
2. In the Box Style area, select the Hidden in
Browse Mode check box or the Hidden in
Query Mode check box.
3. Click OK.
4. Deselect the Layout Mode to view the
results.
Customizing text
Use the Text Format toolbar to customize text
fonts, sizes, styles, colors, and alignment in
form boxes. All of the standard text formatting
options are available.
To display the Text Format toolbar:
Select the View>Toolbars>Text Format
menu option.
The Text Format toolbar appears.
NOTE: Text copied from a word processor
such as Microsoft Word retains its styles when
pasted into a Rich Text box.
The text format toolbar is active:
• When you are editing a memo field in a rich
text box. In this case, font changes apply
only to the current selection within the text.
• When you are editing in a regular data (or
structure) box. Font changes apply to the
entire contents of the box.
• When you are in form edit mode, with the
selector tool active, and one or more boxes
are selected. Font changes apply to all
322
Forms
Chapter 18
selected boxes (except frames around data
boxes).
Customizing fonts
All labels on ChemBioFinder 12.0 objects can
be edited to your specifications. You can edit
any label’s font, font style, size, and color.
To set the font for a label:
1. Click on the label to select it.
2. Right-click and select Properties.
3. On the Box tab of the Box Properties dialog box, click Font.
The Font dialog box appears.
4. Set the text font, style, size, and color.
The sample area previews the font.
5. Click OK to commit the changes.
NOTE: To change the color of the atom labels
in the structure box, you must use the Periodic
Table. See “Periodic table” on page 457.
Customizing numbers
Using the Box Properties dialog box, you can
specify how numeric data is displayed in forms
you can customize the following properties:
• Currency symbol
• Decimal position
• Scientific notation
To specify the numeric format:
1. Right-click in a data box containing
numeric data and click Properties.
The Box properties dialog box appears.
2. Click Format.
The Numeric Format dialog box appears.
4. Click OK.
The format is applied to the current data
box.
Setting color
You can set the following color options:
• The form background color
• The color of the form in query mode
• The default background for all forms
Figure 18.8 The Numeric Format dialog box
3. Select the appropriate option:
Table 21 Numeric format options
If you want to display
Then click
To set the form background and form query
colors:
1. Right-click in a data box and click Properties.
The Box Properties dialog box appears.
2. Click the Form tab to display the Form
properties.
a varying number of Unformatted.
decimal places
a currency symbol
Currency and select
the symbol from the
drop-down menu.
the currency
Symbol on right
symbol to the right when a currency
of the number
symbol is selected.
a standard
Fixed point and
floating-point value select the number of
with a selected
decimal places.
number of decimal
places
the numbers
displayed in scientific notation
Figure 18.9 Form properties dialog box
Scientific and select
the number of
decimal places.
An example of the format you select is
shown in the Sample area of the dialog box.
ChemBioFinder & BioViz
User Guide
323
3. Take the appropriate action:
Table 22 Background color options
To set the background color of
the...
Click...
database form
the Form Background.
query form
the Query Background.
The Color dialog box appears.
Figure 18.10 The Color picker dialog box
4. Select a color.
5. Click OK.
The Form or Query Background changes to
reflect the color you choose.
To set the default background color:
1. Click File>Preferences.
The Preferences Dialog Box appears.
2. Click the Color tab.
3. On the Color tab, click the Form Background.
4. In the Color dialog box, select a color and
click OK.
The color you choose becomes the default
form background color.
When the selection tool is active, the Edit
menu commands apply to the boxes themselves. When the selection tool is not active,
the Edit Menu commands apply to the contents
of the active data box.
To select an object on a form:
Click the Selection tool on the Form
toolbar, then click an object on the form to
select it.
A highlight appears around the object
indicating that it is selected.
To select multiple objects on a form:
1. Click the Selection tool on the Form toolbar.
2. Do one of the following:
• Press the Shift key and click on the multiple objects.
• Drag the Selection tool around the boxes
you want to select.
To select all the objects in the form:
Click Edit>Select All.
Moving objects
Use the Selection tool to move data boxes or
other objects to a different place on a form.
To move objects on a form:
Editing forms
1. Click the Selection tool on the Form toolbar.
2. Select the object to move.
3. Drag the object to a different place.
You can move or resize boxes and other
objects on your form with the Selection tool
and the items in the Edit menu.
NOTE: To move a subform, you must drag the
title bar of the subform, not its contents.
Selecting objects on a form
Use the Selection tool to choose data boxes
and other objects on a form that you want to
move, resize, or delete.
324
Forms
Chapter 18
If an object is nearly in the right place, you can
“nudge” it to get it exactly aligned.
To move an object one pixel at a time:
1. Select the object you want to move.
2. Press an arrow key in the direction you
want to move the objects.
The objects move one pixel in the direction
of the arrow key.
Resizing objects
Use the Selection tool to resize a data box or
any other object on the form.
Deleting objects
Use the Selection tool to remove data boxes
and other objects from a form.
To remove objects from a form:
1. Click the Selection tool on the Form toolbar.
2. Select the object you want to delete.
TIP: Use Shift+click to select multiple objects.
NOTE: You cannot resize more than one object
at a time or simultaneously resize a box and its
frame, unless you create a framed box using the
Framed Box tool. For more information, See
“Creating boxes with frames” on page 315..
3. Do one of the following:
• Click Edit>Clear.
• Use the Backspace key.
The object is removed from the form.
To resize objects on a form:
Reversing and restoring changes
1. Click the Selection tool on the Form toolbar.
2. Position the pointer over an edge or corner
of the object until the pointer is a doubleheaded arrow.
3. Drag in the direction you want to resize.
Use the Main Toolbar icons or the Edit menu
to reverse or restore recent changes to a form.
To reverse or restore changes:
Click Edit>Undo to reverse a change., or
click the Undo icon.
Click Edit>Redo. to reverse a change., or
click the Redo icon.
If an object is nearly the right size, you can
make small adjustments to get it exactly the
size you want.
To resize objects one pixel at a time:
1. Select the object you want to resize.
2. Place the mouse pointer over an edge or
corner of the object until it is a doubleheaded arrow.
3. Press an arrow key in the direction you
want to resize the object.
The edge of the object moves one pixel in
the direction of the arrow key.
NOTE: Undo and Redo work over multiple
changes. Either command can be used repeatedly to reverse multi-step operations.
Ordering objects
The Bring to Front and Send to Back commands
place data boxes in a specific sequence. They
have two effects:
• Select which overlapping data box is on
top.
• Set the order in which the cursor moves
when you press the Tab key.
ChemBioFinder & BioViz
User Guide
325
To put a box on top or bottom:
To line up objects on a form:
1. Click the box to select it.
2. Do one of the following:
• Click Edit>Bring to Front to put it on top,
or
• Click Edit>Send to Back to put it on the
bottom
The order in which data boxes are created is
the order in which the cursor moves as you
press the Tab key. You can set which data box
the cursor moves to first or last.
To set the cursor to move to a data box first:
1. Press the Shift key and click the objects to
align.
2. Use the Edit>Align submenu to take the
appropriate action:
1. Select the data box.
2. Click Edit>Send to Back.
3. Press the Tab key.
The cursor moves to the box you set.
To set the cursor to move to a data box last:
1. Select the data box.
2. Click Edit>Bring to Front.
The box you set is the last box the cursor
moves to when you press Tab repeatedly.
Aligning and distributing objects
You can line up objects relative to each other
by aligning them and space objects at an equal
distance apart by distributing them.
NOTE: In framed dialog boxes, the inner data
box is aligned, not the frame.
Table 23 Object alignment options
If you want to line
up along the
Then choose
top edge of the first Top.
object you place on
the form
middle of an object Vertical Center.
in a vertical line
bottom edge of an
object
Bottom.
left edge of an
object
Left.
middle of an object Horizontal Center.
in a horizontal line
right edge of an
object
Right.
The form objects line up according to your
choice.
To space objects on a form evenly:
1. Press the Shift key and click the objects to
distribute.
326
Forms
Chapter 18
2. Use the Edit>Distribute submenu to take the
appropriate action:
Table 24 Object spacing options
If you want to space
objects evenly
between the
Then choose
outer boxes of the
form
Vertically.
left and right of the
form
Horizontally.
The form objects are spaced according to
your choice.
Setting security options
To set what ChemBioFinder 12.0 form options
are available to users:
1. Right-click in the form you want to secure,
and click the Properties.
The Box Properties Dialog box appears,
with the Form tab displayed.
2. Click Security.
NOTE: The Security button does not appear if
the security on your form has been set to not
allow access to the Security options.
The Form Security dialog box appears.
Changing form layout
Changing a form layout is the same as automatically creating a new form. When you have
created a new form, you can use it to replace
the old form or save it as an alternate form. See
“Creating forms automatically” on page 311.
for details.
Securing forms
You can control the options available to users
of your forms by setting the security options.
You can also provide the database connection
information used to log on to an MS Access
database. MS Access provides a security system that allows the creation and management
of usernames and passwords, and the assignment of permissions to those usernames. MS
username password account information is
stored in the Workgroup Information file
(.mdw, .mda). For more information about
securing an MS Access database, See “Opening a secured MS Access database” on
page 335.
Figure 18.11 The Form Security dialog box
TIP: The lower left corner of the dialog box
indicates whether security is defined.
3. Type the Username to use for logon in the
Username box.
The Enable button becomes available.
4. Type the Password to use for logon in the
Password box.
NOTE: Use of a password is optional.
5. To enforce Workgroup Security in an MS
Access Workgroup Administrator database
ChemBioFinder & BioViz
User Guide
327
you must specify a Workgroup Information
File. Take the appropriate action:
NOTE: Enforcing workgroup security is
optional.
Table 25 Workgroup naming options
If you want to
Then
enter a workType the name of the
group file name MS Access Workgroup
database in the Workgroup Information File
box.
browse for the
workgroup file
Click File and select the
file.
The following steps refer to the options in the
Enable/Disable section of the dialog box.
1. Click the plus sign (+) next to Database
Security to display the options; take the
appropriate action:
Table 26 Database security options
If you want users
to...
be prompted to log
on with a username
password to open a
form
then select...
Password to open
form
use a username pass- Logon to MS
word to log on to the Access database
MS Access database
(MDB files)
328
Forms
Chapter 18
Table 26 Database security options
If you want users
to...
then select...
be prompted to log Prompt for dataon to a database with base logon
a username password when the form
is open
use a username pass- Protect molecule
word to open the
database
molecule database
(MST files)
be able to access the Security dialog
Form Security dialog available.
box
encounter all of the
above options
Database security.
2. Click the plus sign (+) next to Forms to display the options; take the appropriate
action:
Table 27 Forms security options
If you want users
to...
Then select...
open or create databases
Open/create database
create forms
Create new forms
open forms
Open other forms
edit forms
Save changed
forms
Table 27 Forms security options
If you want users
to...
Then select...
4. Click the plus sign (+) next to Edit to display the options; take the appropriate
action:
Table 29 Editing security options
change the layout of Change form
a form
layout
If you want users to
clear forms
use all of the above
options
Table 28 Automation security options
Then click
access OLE automa- Allow CAL/OLE
tion writing and
Automation access
programming
NOTE: Must be
checked to enable
export to Excel
use scripts
Clear
Forms
3. Click the plus sign (+) next to Automation
to display the options; take the appropriate
action:
If you want users to
Can use scripts
menu
delete relational and Cut
structural data
copy relational and
structural data and
multiple table rows
to the clipboard
Perform all of the
above functions
Cut/copy/paste
5. Click the plus sign (+) next to Browse to
display the options; take the appropriate
action:
Table 30 Browsing security options
Then click
Edit scripts
browse databases
use all of the above
options
Copy
paste relational and Paste
structural data from
the clipboard
If you want users to
edit scripts
Then click
Automation
Browse database
records
view data in forms in View form as table
a table
view data in contin- View in continuous
uous view
forms view
ChemBioFinder & BioViz
User Guide
329
Table 30 Browsing security options
If you want users to
Then click
edit and view struc- Edit/view structures in Chem & Bio tures in Chem & Bio
Draw
Draw
view structures in
Chem & Bio 3D
View structures in
Chem & Bio 3D
Table 31 Searching security options
If you want users to
use all of the above
options
Then click
Searching
7. Click the plus sign (+) next to Update
records to display the options; take the
appropriate action:
Table 32 Update security options
perform all of the
above options
Browse
6. Click the plus sign (+) next to Search to display the options; take the appropriate
action:
If you want users to
be able to
update database
records
Then click
Update records
Table 31 Searching security options
add database records Add new records
If you want users to
submit queries
Then click
Query database
records
use current hit list for Search over current
searching
list
search the entire data- Search over full
base
database
save and manipulate
hit lists
Enable hit list tools
delete database
records
8. To allow users to import data SDFiles or
RDFiles select Import data.
9. To allow users to export data, including
delimited text files select Export data
10.Click the plus sign (+) next to Print to display the options; take the appropriate
action:
Table 33 Printing security options
If you want users to
search exact structure Full structure
only
search substructures
only
Substructure
search similar structures only
Similarity
330
Forms
Chapter 18
Delete records
Then click
print a single record
only.
Single record
Print several records
Several records
Use print preview mode Print preview
Overriding security
Table 33 Printing security options
If you want users to
Then click
perform all of the above Print
functions
To complete setting security:
1. Click Enable.
2. Click OK.
The options you choose are applied to the
form.
Disabling security
To disable security and reset defaults:
1. Right-click in the form and click Properties.
2. In the Form tab of the Form Properties dialog box, click Security.
The Form Security dialog box appears.
3. In the Form Security dialog box, click Disable.
The Validate Security dialog box appears.
NOTE: This form only appears if you entered a
password when you enabled security. See
“Setting security options” on page 327.
4. Enter your password, then click OK.
Security is disabled and the defaults are
reset. “Security Disabled” appears in the
lower left corner of the Form Security
dialog box.
In order to edit security options, you must temporarily remove security. In this case, you
should use the Override option rather than the
Disable option.
To temporarily disable security:
1. Right-click in the form and click Properties.
2. In the Form tab of the Form Properties dialog box, click Security.
The Form Security dialog box appears.
3. In the Form Security dialog box, click Override Security.
The Validate Security dialog box appears.
NOTE: This form only appears if you entered a
password when you enabled security. See “Setting security options” on page 327.
4. Enter your password, then click OK.
You are allowed to edit the security options.
“Security Overridden” appears in the lower
left corner of the Form Security dialog box.
5. When you have completed your changes,
click Override Security to toggle security
back on.
“Security Enabled” appears in the lower
left corner of the Form Security dialog box.
ChemBioFinder & BioViz
User Guide
331
332
Forms
Chapter 18
19
Databases
You work with data within ChemBioFinder
12.0 by entering it into a database, editing it,
and interfacing with Chem & Bio Draw and Chem
& Bio 3D.
You can perform all of these functions on data
using the commands in the menus, or you can
use the buttons in the Record toolbar for most
of these functions.
Figure 19.1 Database functions on the Record
toolbar
Selecting a database
A ChemBioFinder 12.0 form does not store
data directly, but is simply the window through
which you look at data. When creating a form,
you need to specify the source of the data to
display. A form displays data from a single
table in a database. To specify the data source
for a form, you must open or create a database,
and then select a table.
If you want to view data from more than one
table, you must create a form for each table.
Typically, you create a main form for one main
table and a subform for each other table. For
more information, See “Relational Data and
Subforms” on page 399.
You can connect a database to the form before
creating boxes, or any time after. If the form is
already connected to a database, you can
change the database or the data source. If the
form has boxes with fields connected to them,
then the boxes automatically connect to fields
of the same name in the newly-opened database.
Opening an existing chemical
database
To open a database to associate with a form:
1. Right-click on the form and click Data
Source.
The Form Properties dialog box appears.
ChemBioFinder & BioViz
User Guide
333
2. Click Open Database.
The Open dialog box appears.
Figure 19.2 The Open dialog box
3. In the Open dialog box, choose a database
with an MDB file extension, then click the
Open button.
The Form Properties dialog box reappears
with a data source tree displayed. The
CS_Demo database is shown below.
Selecting the data to display
You indicated the source of the data to display
on the form, but the form is still blank. To see
the data, you need to indicate what data to
show in each box. You can use the Box Properties dialog box, as described in See “Setting
box properties” on page 318.
To choose the data box to display:
1. Right-click in a box or frame, then click
Field.
The Field properties appears.
2. From the data source tree, select the field to
display.
Figure 19.4 Selecting a field in the database tree
3. Click the OK button.
The field data is displayed in the box.
If you use this method with a framed box, the
box label will remain unchanged. If you want
to use the field name as the box label, you can
do it in one step as follows:
Figure 19.3 The CS Demo database Form properties
4. Click the OK button.
The database is associated with the form
334
Databases
Chapter 19
1. Right-click in a framed box.
2. Select the field name from the list at the
bottom of the right-click menu.
The frame receives the field name and the data
is displayed in the box.
Figure 19.5 Selecting a field name from the context
menu.
Opening a secured MS Access
database
To open a secured Microsoft Access database
in ChemBioFinder 12.0, you need to set the
appropriate permissions in MS Access.
NOTE: If your database was created in MS
Access 97 (as, for example, were some of the
ChemBioFinder 12.0 sample databases), and
you are using a newer version of Access, you
must convert the database before you can edit
it. These instructions assume a database created in Access 2002. Other versions may differ
slightly as to options and procedures.
To set the permissions:
1. Open the desired database in MS Access.
2. Click Tools>Security>User and Group Permissions.
Figure 19.6 User and Group Permissions dialog box
3. Select the Users or Groups radio button to
assign permissions to individuals or groups.
4. Select an Object Type from the drop-down
menu.
5. Select the permissions you want to assign
for that object type to each user or group.
6. Click the Apply button.
7. When you have finished assigning permissions, click the OK button.
8. Open the database in ChemBioFinder 12.0.
Creating a database
You can create a new, empty database and
associate it with a form.
To create a database:
1. Open an existing form, or create a new one.
2. Right-click in the form and click Properties.
The Box Properties dialog box appears.
3. Click the Box Properties Database tab, then
click the Create Database... button.
The Save As dialog box appears.
ChemBioFinder & BioViz
User Guide
335
4. In the File Name box, type a name for your
database, and then click the Save button.
A data source tree appears, containing the
database and its tables and fields.
5. Click the OK button.
The Box Properties dialog box closes.
Opening databases
When you open a database in ChemBioFinder
12.0 , you can access the data in any of three
ways:
• Normal access—you can read and write
data.
• Read-Only access—you can read but not
write data. The database is write-protected.
• Secured access—you must open the database with a user name and password. You
are subject to the security restrictions
applied to the database.
NOTE: Versions of ChemBioFinder earlier
than 7.0 cannot read .cfw files belonging to
ChemBioFinder 7 or greater. Versions of ChemBioFinder earlier than 11.0 cannot read .cfx
files.
• If you select Read-only in the File Open
dialog box when you open a form or database.
When you open a read-only database, the following conditions apply:
• READ appears in the status line.
• You can not modify data in text or structure
boxes.
NOTE: If only the form (CFX) file is set to
read-only, READ does not appear on the status
line and the database can be modified.
Multi-user access
If a database resides on a network, more than
one ChemBioFinder 12.0 user may access it at
the same time. Each user can view, print, or
modify records independently of the others.
The following table shows how the type of
user affects the other users in the group.
Table 19.1Multi-user access
User type
Affect on other users
Multiple readers
in read-only
access
User actions do not affect
each other.
Multiple writers
in normal access
All users can read and write.
A user may see another
user’s edits. If two users try
to edit the same area at the
same time, one is alerted
that the database is temporarily locked.
Read-only access
Any of the following conditions determine
whether a database opens in read-only mode:
• If the component files (extensions CFX,
MDB, LDB, MST, MSX) have read-only
attributes.
• If the files are on read-only media, such as
CD-ROM.
336
Databases
Chapter 19
Table 19.1Multi-user access
User type
One writer,
multiple readers
Affect on other users
The writer, in normal
access, is not affected by the
readers. The readers, in
read-only access, may see
the writer’s edits.
If two people are viewing the same record
within a database, and one person changes the
data in that record, the second person will not
see the changes immediately. The changes will
be visible when the second user switches to
another record, and then back to it.
Secured access
ChemBioFinder 12.0 supports the following
types of security:
• Form access—ChemBioFinder 12.0
enforces form access security by requiring a
user name and password, which are stored
in the form (CFX) file.
• Molecule file access—ChemBioFinder
12.0 enforces molecule file access security
by requiring a user name and password,
which are stored in the database’s MST file.
• Microsoft Jet Relational Database
Engine—the database engine that underlies
Microsoft Access enforces security. The
user names and passwords are stored in an
MS Access Workgroup Administrator database.
For more information on Form access, see
“Securing forms” on page 327. For more information on MS Access security, see “Opening a
secured MS Access database” on page 335.
When you open a form or database that has
security options applied to it, you are prompted
to enter a username and password to log on.
When you open a secured MS Access database
from within ChemBioFinder 12.0, a username,
password, and workgroup information file is
required. Contact your Access Database
Administrator for this information.
To open a secured form:
1. In the Validate Security dialog box, type
your username and password, and then click
OK.
If the form you access includes a secured
molecule database, the Database Logon
dialog box appears.
Figure 19.7 ChemBioFinder 12.0 Molecule Database Security dialog box
2. Type your user name, Password, and Workgroup Information File name (if applicable), then click OK.
The form opens.
ChemBioFinder & BioViz
User Guide
337
Browsing databases
You can browse a database using the buttons
on the Record toolbar.
done a search that found ten hits, then the only
valid record numbers are 1–10. If you want to
move to a specific absolute location in a database, you must run a search for a value in a
field that identifies that location.
The data table
Sometimes browsing through a data record set
is more convenient if the data is presented in
tabular format.
Figure 19.8 Browse functions on the Record toolbar
To Browse:
• Click First Record to display the first record
in the database.
• Click Previous Record to display the record
before the currently shown record.
• Click Next Record to display the record
after the currently shown record.
• Click Last Record to display the last record
in the database.
NOTE: You cannot add or modify records
while viewing data in a table.
To display data in a table:
Click View>Data Table>In Separate Window
(or type Ctrl+T).
A list window containing the fields and
records in the form appears.
NOTE: The current record number is displayed
in the Status Bar.
Go directly to a specific record as follows:
1. Click Record>Go To Record.
The Record Number dialog box appears.
2. Type the number of the record (within the
current list) to display, and click OK.
The specified record is displayed.
NOTE: Record numbers are temporary, referring only to positions within the current list in
its current sort order. For example, if you have
338
Databases
Chapter 19
Figure 19.9 Data Table view in a separate window
To display a particular record in the form:
Click the record’s entry in the list window.
By default, the fields in the Data Table are displayed in the order in which they were created.
To reorder the columns in the Data Table:
1. Click one of the column headers to select
the column.
1. Place the cursor on the dividers in the left
header.
The cursor changes to the icon shown
below.
Figure 19.10 Column selection indicator in the Data
Table view
2. Drag the header to a new position.
The cursor changes to the icon shown
below. The new position is indicated with a
red vertical line.
Figure 19.13 Changing the height of a row
2. Click-drag to adjust the row height.
NOTE: To resize all rows, right-click in a
column header and choose Resize Rows to Fit
from the context menu.
R-group tables
Figure 19.11 Moving a column
To resize the column widths in the Data Table:
1. Place the cursor on the dividers in the top
header.
The cursor changes to the icon shown
below.
Figure 19.12 Changing the width of a column
2. Drag to adjust the column width.
NOTE: To hide the column, right-click and
choose Hide Column from the context menu.
To resize the row heights in the Data Table:
In Data Table display, you can display a substructure search as table of R-group substituents.
1. Run a substructure search.
NOTE: You cannot prepare a table from a full
structure or similarity search.
Figure 19.14 Substructure query to set up R-Group
table
2. Switch to Data Table view.
3. Right-click in the Structure column, and
click R-Group Table.
The following changes occur:
• the topmost structure is replaced with the
template – similar to the query you used,
ChemBioFinder & BioViz
User Guide
339
but with Rs attached at all positions which
found substituents.
Figure 19.15 R-Group query and template
•
•
new columns are generated for all the Rs.
the other rows are populated with the Rs
hit.
NOTE: The data in this table is just for display.
It is not saved with the form. The table will continue to be displayed when you toggle the Table
view until you change the hit list by running
another query or restoring the full list.
R-Group plots
Once you’ve generated an R-group table, you
can then plot the various substituent groups
against any other plotable field.
1. With the table view still displayed, click the
View>BioVizPlots>New.
2. On the General tab, click the X or Y variable to display the drop-down menu.
The R-Group positions are now included in
the menus, and may be used like any other
numerical field to create a plot.
RGroupPlot.tif
To sort an R-Group Table:
1. Right-click the header of any R column
(R1, R2, etc.).
2. Click Sort Column>[command]. The options
are:
• Ascending
• Descending
• Multiple
Ascending and Descending sort by the molecular weight. Multiple opens a dialog box that
lets you sort by another parameter or group of
parameters.
To set up a multiple sort:
1. Select fields in the order in which you want
them to apply.
2. Right-click selected fields to change the
sort order (ascending, descending) or to
remove an unwanted parameter.
You can cut and paste R-group cells containing
either structures or text using the clipboard.
340
Databases
Chapter 19
Figure 19.16 Setting up an R-Group plot.
Figure 19.17 R-Group 2 vs. Molecular Weight
The R-Groups are along the X-axis as shown
in the preceding figure. The structure on the
upper right corner of the plot is the template.
Creating a database
Instead of opening an existing database, you
may want to create a new, empty one.
To create a new database using the automatic
form generation technique, See “Tutorial 3:
Creating a database” on page 296.. The following procedure results in a simple database with
one table for storing structures.
To create a database:
1. Right-click in the form and click Properties.
2. On the Database tab, click the Create Database.
The Save As dialog box appears.
3. Choose the directory to which you want to
save the database.
4. Specify a name for the database, and click
Save.
ChemBioFinder 12.0 creates the database containing one table (called MolTable) with four
fields:
•
Structure
•
Formula
•
Molecular weight
•
Mol_ID
The Mol_ID field corresponds to a column in
the table where a numeric ID is automatically
entered as each structure is registered. The
other fields represent information stored in the
structural portion of the database, linked to the
assigned ID.
The Formula and Molecular weight data are
automatically calculated from a structure.
These internal fields cannot be edited or
deleted.
After creating a database, you can create fields
for storing other types of data. It is not neces-
sary to create the entire set of fields before
working with the database. You may add more
fields later.
Creating tables
There is no limit to the number of tables a database can contain. You may want multiple
tables in a database in order to manage relational data, or simply to organize different collections of information in the same place.
A table must contain at least one column.
When you create a new table, ChemBioFinder
12.0 creates a numeric column called ID. You
can use this column to store integer data, or
delete it and replace it with your own columns.
Table names must:
• Begin with a letter
• Not contain punctuation characters
• Not be the same as a table already on display
To create a new, empty table:
1. Right-click in the form and click Properties.
The Box Properties dialog box appears.
2. Click the Table tab.
The Table tab appears:
3. Click the Create Table... .
The Create Table dialog box appears.
4. Type a name for the new table, then click
OK.
The table appears in the Data Source tree.
Deleting tables
To delete a table from the database:
1. Right-click in the form and click Properties.
The Box Properties dialog box appears.
2. Click the Table tab.
The Table tab appears:
ChemBioFinder & BioViz
User Guide
341
3. In the data source tree, select the table to
delete.
4. Click the Delete Table... .
A dialog box appears giving you the option
of completing the deletion or cancelling.
5. Click Yes to delete the table.
The table and all data it contains are
immediately deleted from the database.
CAUTION
You cannot undo a deleted table. Before you
delete a table, create a backup copy of the database to prevent accidental loss of data. For
more information, see “Backing up databases”
on page 346.
Attaching tables from other
applications
You can use ChemBioFinder 12.0 to add
chemical structures to a database you have
already developed. If your database was developed in Microsoft Access, you can open it
directly in ChemBioFinder 12.0.
can also work with data from other file-based
databases such as dBASE and xBase clones,
but in this case you must open or create a
ChemBioFinder 12.0 database and attach the
table to link to tables in the data source. After
you attach a table, it appears and functions as if
it were part of your local ChemBioFinder 12.0
database.
The procedure you use depends on whether the
tables you want to attach are from a file-based
(Access, FoxPro, dBASE) or non file-based
(Oracle) database system.
Attaching files from a file-based database
To attach a file-based database table:
342
Databases
Chapter 19
1. Right-click in the form and click Properties.
2. Click the Table tab, then click the Attach
Table.
The Attach Table dialog box appears.
3. Click the Open MS Access Database... .
The Open dialog box appears.
NOTE: The list of file types available in the
Attach Table Open dialog varies from one
computer to another. The files for which you
have drivers installed shown. For example, if
Paradox is not installed, you may not have
Paradox drivers on your system or in the
drop-down list.If the database type you wish to
access is not on the list, it may not be a filebased system, and you need to connect using
ODBC. For detailed instructions, see
“Attaching files from a non file-based
database” on page 342.
4. Choose the database to access, then click
OK.
5. In the tree diagram, click the table you want
to attach, then click OK.
The newly-attached table appears in the
tree diagram in the Form Properties dialog
box.
6. Click the Form Properties OK.
Attaching files from a non file-based
database
If the database you want to attach is not filebased, such as Oracle, you can attach it using
Microsoft's Open Database Connectivity
(ODBC).
To attach a non-file-based database table:
1. Right-click in the form and click Properties.
2. Click the Table tab, then click the Attach
Table.
The Attach Table dialog box appears.
3. Click the Open Oracle/ODBC Data Source.
The Select Data Source dialog box appears.
Figure 19.18 Select Data Source dialog box
4. From the Machine Data Source tab, select
the ODBC data source to access, then click
OK.
6. In the tree diagram, click the table you want
to attach, then click OK.
The newly-attached table appears in the
tree diagram in the Form Properties dialog
box.
7. Click the Form Properties OK.
The source of the data to display on the form is
indicated, but the form is still blank. To access
the data, you need to draw some data boxes,
and indicate what data to show in each of those
boxes.
Creating fields
Whether you created a new database or are
working in an existing one, you can add or
remove fields in the selected table.
You can choose from the following types of
fields:
NOTE: The ODBC data source dialog box
shows all data sources known to ODBC,
including ChemBioFinder 12.0 , Access, and
other file-based data sources. If you attempt to
open one of these through the ODBC dialog,
you get an error message. File-based data
sources must be opened using Open Database,
as described above.
If the ODBC data source dialog does not show
the database you seek, you may need to create a
new data source. You can do this using the New.
For details, click the Help button in the ODBC
dialog box.
5. If you are prompted for a user name and
password, enter it. If you don't know what
name and password to use, see your System
Administrator.
Text field—Allows you to enter text such
as names, comments, and references. A text
field is fixed in length, and requires that you
choose a maximum length (“width”) for any
data item to be stored in the field. If you enter a
width of 50, then you can’t store any item with
more than 50 characters in that field.
You can specify widths of text fields as large
as 254 characters. If this is insufficient, you
need to create a Memo/Rich Text field instead.
Because the text field width cannot be modified after a field is created, it is often wise to
err on the side of caution and make it longer
than you need initially. On the other hand,
larger field widths also create larger files and
slower search times.
NOTE: Non-ASCII characters will not display
correctly in a data table text field.
ChemBioFinder & BioViz
User Guide
343
Integer field—Used for whole numbers
such as ID's. All integers in ChemBioFinder
12.0 are long, so can accommodate billions of
values (232 of them).
Double field—Used for real numbers
such as physical constants and unit prices. Real
numbers in ChemBioFinder 12.0 are doubleprecision. In ChemBioFinder 12.0 12, double
fields can serve as ID fields.
Picture field—Allows you to store a bitmap file (BMP,GIF, JPEG, PNG, or TIFF) or
Windows metafile (WMF, EMF), such as a
spectrum or experimental setup, as a data item
in a database.
A Picture box on a form may be used to display a static picture attached to the form, such
as a logo, or it may be used to show pictures
stored in the database which change as you
move from record to record. If you import a
database containing pictures (type Long
Binary or BLOB) they will be interpreted as
pictures and the form generator will create a
picture box for it.
Memo/Rich Text field—Used to display
text. Memo fields can be of any length.
Because memo fields are less structured,
searching them can be slower than searching a
text field. Additionally, memo fields cannot be
sorted.
To search for text:
1. Right-click in a memo or plain text field
and select Find Text.
The Find Text dialog box appears.
2. Enter the text and the match conditions.
3. Click either the Forward or Backward to
search.
4. To search for the next occurrence, do one of
the following:
344
Databases
Chapter 19
• Click Find Next.
• Use the F3 key.
Memo fields can store Styled Text. For more
information, see “Styled text” on page 352.
m
Date field—Allows you to store dates.
The dates are displayed according to the settings in the Windows Regional Settings control
panel.
Structure field—Consists of four fields:
a numeric ID stored in the relational database,
plus three fields (Structure, Formula, MolWeight) that take data from the ChemBioFinder 12.0 structure database files.
Boolean—Used with check boxes. When
searching Boolean fields, you can only search
for ON. This is because ChemBioFinder 12.0
automatically clears all fields when activating
the Queries form.
You can create more than one set of structure
fields in a table. Each is assigned a unique set
of names, and each refers to its own ID column
in the table, although all structural data is taken
from the same structure database files.
To create a field:
1. Right-click in the form and click Properties.
The Box Properties dialog box appears.
2. Click the Field tab.
The Field properties appear.
3. Click the Create Field.
The Create Field dialog box appears.
4. In the Name box, type a name.
5. In the Type box, choose a data type from the
drop-down menu.
6. For text fields only, type a width (number
of characters) in the Width box, or use the
thumb wheels to select a value.
7. Click OK.
The name of the new field appears in the
data source tree.
Deleting fields
Just as you can create any field and assign it to
a data box at any time, you can modify the
database by deleting fields from the selected
table.
To delete a field:
1. Right-click in the form and click Properties.
The Box Properties dialog box appears.
2. Click the Field tab.
The Field properties appear.
3. In the field list, select the field to be
deleted.
4. Click the Delete Field.
5. When prompted whether you want to delete
the selected field, click OK to delete or click
Cancel to leave it unmodified.
CAUTION
When you delete a field, all data contained in
the field is also deleted. You are not warned
explicitly about this.
Adding multiple structures
You can include more than one structure on the
same form by creating multiple structure columns in a table. Each structure column you
create represents four types of data:
• The structure displayed as a diagram.
• The Molecule ID, which connects the structure to a record in a relational table.
• The formula derived from the structure.
• The molecular weight derived from the
structure.
To create multiple structure columns in a table:
1. Click File>Database.
The Form Properties dialog box appears.
2. Create or open a database.
3. Click the Field tab.
4. Select the Table in which you want to create
new structure columns.
5. Click the Create Field.
The Create Field dialog box appears.
6. Select Structure from the Type drop-down
list.
An uneditable name is assigned to the field.
7. Click OK.
Four new fields appear in the list and are
named to belong to the same set of structure
columns.
8. Connect the new fields to boxes by
right-clicking on the appropriate data box
and choosing the field from the context
menu field list.
Non-chemical databases
If you opened a database that you created using
a program other than ChemBioFinder 12.0 and
you want to add structures to it, you can create
structure fields in any modifiable (nonattached) table.
To create a structure field:
1. Open a database.
2. Right click and select Properties.
3. In the database tree, click the table to which
you want to add structures.
4. Click the Field tab.
5. Click the Create Field.
The Create Field dialog box appears.
6. Choose Structure from the Type drop-down
list, then click OK.
ChemBioFinder & BioViz
User Guide
345
You do not provide a name or other details
when you create Structure columns. ChemBioFinder 12.0 automatically creates four columns
and names them. These columns contain no
data until you enter structures into the database.
Backing up databases
To back up the current ChemBioFinder 12.0
database:
1. Click File>Copy Database.
A Save As dialog box appears. By default,
your copy is named YourDatabase_copy.cfx.
2. Rename your copy (if you wish), select a
location, and click OK.
A complete set of ChemBioFinder 12.0
database files is created in the selected
location.
Moving databases
ChemBioFinder 12.0 saves only the definition
of the form and information for connecting to
the database in the CFX file. The actual data
are stored in files with MSX and MST extensions for structure data, and in files with an
MDB extension for non-structural data. If you
want to move a database to another computer,
you must move (for a default ChemBioFinder
12.0 database) at least four separate files. This
number might be greater if you have several
forms that access the same database.
NOTE: The MSX, MST, and MDB files all have
the same file name, but the name of the CFX
files might be different depending on how you
saved them.
After you move the database to its new location, open your forms to make sure the data
346
Databases
Chapter 19
source links have been retained. If ChemBioFinder 12.0 cannot locate the data source and
displays an empty form, you will need to use
the File>Database menu command to reconnect
to the data source.
If the form is connected to a remote data
source on a network, you have fewer files to
move. The data source can remain on the
remote machine, and you only move the CFX
file that contains your form for accessing the
data. You may need to reconnect it to the data
source if it is not done automatically. This situation is common in large organizations where
several people access the same central data
source.
Creating a portal database
To carry out certain operations, such as sorting
structural data, ChemBioFinder 12.0 needs to
create temporary tables in a database. This cannot be done in a read-only source such as a
data CD.
Instead of accessing the read-only source
directly, you can create a portal database–a
local, writable database with attachments to the
external tables of interest. The portal looks and
behaves just like the target database, but without the limitations.
ChemBioFinder 12.0 creates a portal database
when needed. For example, if you are using a
database CD, perform a search, and attempt to
sort by formula, a message appears that offers
to create a local database, attach the current
table, save the form, and proceed with the sort.
If you create the local database, you can use
the new form to get the data with full functionality and performance.
20
Working with Data
Entering data
You enter data into a database by adding a new
record. Adding a new record consists of three
steps:
• Clearing the form
• Adding new data
• Committing the new entries
2. Do one of the following:
• Click Record>Add New Record.
• Click the Add Record icon on the Record
Toolbar.
3. All of the boxes in the form are cleared to
prepare for entering new data. The Status
Bar is updated to show that you are in
record addition mode:
Clearing the form
To begin adding a new record:
1. Create a form and link it to a database. For
more information, see “Creating forms
manually” on page 313.
The form should contain all the data boxes
you want to view and edit. The boxes
should be assigned to their appropriate
fields.
Figure 20.1 Status bar in record addition mode.
Adding new data
To add alphanumeric data:
Click in a box with an alphanumeric field
and type the data.
To add a structure:
1. Right-click in a box with a structure field.
ChemBioFinder & BioViz
User Guide
347
Committing the new data
2. Do one of the following:
Table 20:
If you want to...
Then...
draw a structure,
1. Double-click in the
structure box.
The Chem & Bio Draw
Control appears.
2. Draw the new structure
in the Structure box.
3. Click outside to box to
complete the structure.
Chem & Bio Draw
mode
draw a structure, ChemBioFinder 12.0
mode
import a structure, ChemBioFinder 12.0 or
Chem & Bio Draw
mode
1. Double-click in the
structure box, or Rightclick and select Edit in
Chem & Bio Draw.
Chem & Bio Draw opens.
2. Draw the new structure
in the Chem & Bio Draw
window.
3. Click File>Exit and
Return to, or type
Ctrl+W to return to
ChemBioFinder 12.0
and insert the structure.
1. Right-click in the structure box, and click Read
Structure.
The Open dialog box
appears.
2. Browse to a structure
file, then click OK.
The file is inserted into
ChemBioFinder 12.0.
NOTE: See the Chem & Bio Draw User’s Guide
for information about using Chem & Bio Draw.
348
Working with Data
Chapter 20
When you finish entering all of the data items,
do one of the following:
• Click the Commit button on the Add Record
Toolbar.
• Click the Commit Changes icon on the
Record Toolbar.
• Click Record>Commit Changes.
• Perform another action such as moving to
another record or printing.
The new record is added to the database.
NOTE: Selecting Commit Changes (or moving
to another record if you have two or more
records) saves the data to the database. Do not
use File>Save; clicking File>Save saves
changes to the form layout, not changes to data
in the database.
Duplicating records
You can create a new record by modifying an
existing one.
To duplicate a record:
Click Record>Duplicate Record.
You are in Add Mode and the form fills
with data from the previously displayed
record. When you commit the changes, you
create a new record whose fields contain
the data displayed. Before committing the
duplicate, you can modify fields or
structure and commit changes just as you
would with any other new record.
NOTE: When duplicating records, only those
fields that are visible on the form are duplicated. Data in fields present in the database but
not visible on the form are not copied into the
new record. The new record has a new Mol_ID.
Undoing data entry
Before committing a new data entry, you can
revert the contents of the form to its previous
unmodified state.
To undo your changes, do one of the following:
• Click Record>Undo Changes.
• Click the Undo Changes icon on the Record
Toolbar.
After you commit the changes, they cannot
be undone.
Editing data
Modifying the data in a database is performed
by directly changing the data items on the form
and committing those changes.
NOTE: The Formula and MolWeight fields are
automatically calculated by ChemBioFinder
12.0 from the Structure field and cannot be
edited by the user. The MOL_ID field is also set
automatically by ChemBioFinder 12.0 and
cannot be edited.
To edit data:
Click the data box whose data item you
want to edit.
If you click on a Structure data or a picture
box it is highlighted. If you click on a data
box containing alphanumeric data, a cursor
appears in the data box.
To edit alphanumeric data:
1. Replace it with the text or number you
want.
2. Do one of the following:
• Click Record>Commit Changes.
• Click the Commit Changes icon.
• Move to a different record.
NOTE: Moving to a different record always
commits changes first.
Editing structures
You can edit structures by using the Chem & Bio
Draw drawing tools. You can also neaten the
appearance of a structure by cleaning it up. The
Clean Structure command is used to neaten the
appearance of molecules by regularizing bond
lengths and angles. Since the degree of change
required cannot be determined a priori, the
Clean Structure command begins gently. You
may need to repeat the command to get the
changes you wish. For more details about how
the command works, see “Structure Clean Up”
in Chapter 4: Advanced Drawing Techniques
of the Chem & Bio Draw User’s Guide.
Before committing a data entry, you can revert
to the previous unmodified record by choosing
Undo Changes from the Record menu.
To edit structural data:
1. Do one of the following:
ChemBioFinder & BioViz
User Guide
349
•
In Chem & Bio Draw mode: Double-click
the structure box.
The Chem & Bio Draw Control appears.
• In ChemBioFinder 12.0 mode: Doubleclick the structure box.
Chem & Bio Draw opens and the structure
appears in the From ChemBioFinder 12.0
window.
• In either mode: Right-click in the structure
box and click Edit in Chem & Bio Draw.
Chem & Bio Draw opens and the structure
appears in the From ChemBioFinder 12.0
window.
2. Edit the structure.
3. Click in the ChemBioFinder 12.0 form or
close the Chem & Bio Draw window by typing
Ctrl+W when you are finished.
4. Click Record>Commit Changes. Click the
Commit Changes icon, or move to a different record.
The changes are stored.
To clean up a structure:
1. Right-click in the box containing the structure, and click Clean Structure.
2. To save the cleaned up structure, do one of
the following:
• Click Record>Commit Changes.
• Click the Commit Changes icon.
Working with structures using Chem & Bio
Draw
Enter or edit Chem & Bio Draw structures in data
boxes of the Structure field type. You can work
in Chem & Bio Draw directly, or work in the
Structure data box using the Chem & Bio Draw
Control. You choose the default in the Structure data box Box Properties.
350
Working with Data
Chapter 20
To set the preference:
1. Right-click in the Structure box.
2. Click Properties.
3. Use the drop-down menu in the Box Style
section to choose your default:
• Chem & Bio Draw style to use the Chem & Bio
Draw Control.
• ChemBioFinder 12.0 style to edit in Chem
& Bio Draw.
TIP: When Chem & Bio Draw style is the default,
you still have the option of editing directly in
Chem & Bio Draw. Just right-click in the Structure
box and choose Edit in Chem & Bio Draw.
To edit a structure:
Double-click in the structure data box.
Chem & Bio Draw opens or the Chem & Bio Draw
Control appears, depending on your
default.
If you already have a structure in a data box,
that structure appears in the edit window. You
can modify and manipulate the structure just
like any other Chem & Bio Draw structure.
If there is no structure in the Structure data
box, the edit window is blank. You can draw a
structure to store in the ChemBioFinder 12.0
database.
When you have finished, do one of the following:
• If you are editing in Chem & Bio Draw, click
File>Exit and Return to Structure or type
Ctrl+W.
• If you are editing with the Chem & Bio Draw
Control, click outside the Structure box.
The new or edited structure is now displayed,
but has not yet been added to the database.
Click Record>Commit Changes, then click
the Commit Changes icon, or move to a
different record.
The changes are stored.
With a few exceptions, you can store any
chemically meaningful structure or reaction
that can be drawn in Chem & Bio Draw. Within
Chem & Bio Draw, you can confirm that a structure is chemically meaningful by selecting it
and using the Structure>Check Structure menu
command. For more information, see the Chem
& Bio Draw User’s Guide.
Two exceptions are:
queries. For more information, see “Structural
Query Features” on page 483.
Chem & Bio Draw allows you to draw many
objects that have no chemical meaning. These
include boxes, circles, arrows, orbitals, and
others. It also allows you to assign non-chemical styles (color) to objects that have chemical
meaning. ChemBioFinder 12.0 ignores these
properties, and stores only objects with chemical meaning in structure fields.
To store a Chem & Bio Draw drawing exactly as
drawn, store it as a picture. You can copy and
paste a Chem & Bio Draw drawing into a Picture
field.
• ChemBioFinder 12.0 does not support
importing molecules with multiple or variable points of attachment such as ferrocene.
• ChemBioFinder 12.0 does not recognize
“bare” heteroatoms. For example, if you
draw the following structure:
Figure 20.2 Form with picture field
N
Chem & Bio Draw reports an illegal valence when
you choose the Check Structure command.
ChemBioFinder 12.0 automatically infers
hydrogen atoms to main-group elements as
necessary to fill their lowest acceptable
valence. The structure above is registered in as
methylamine, CH3NH2.
Structures and reactions drawn with query
properties are generally meaningful only in the
context of a query. Query structures can be
stored in a ChemBioFinder 12.0 database, but
they are not treated as Markush structures and
are not guaranteed to be hit by all valid search
NOTE: Objects stored in a Picture field have
no chemical significance and cannot be
searched.
Viewing models using Chem & Bio 3D
ChemBioFinder 12.0 also provides access to
the Chem & Bio 3D Control. This means a
Structure data box can be designated as Chem
& Bio 3D style.
To view the molecular model for a structure:
1. In the Database pane of the Explorer window, double-click the Structure field to add
another Structure field to the form.
2. Right-click in the field and click Properties.
ChemBioFinder & BioViz
User Guide
351
3. In the Box Style section, select Structure
(Chem & Bio 3D style) from the drop-down
menu.
The Structure field displays a 3D structure.
Styled text
Make changes to text fonts, sizes, styles, colors, and alignment with the tools on the Text
menu or the Text Format toolbar.
To display the Text Format toolbar, if it is not
visible:
Click View>Toolbars>Text Format.
The Text Format Tool appears.
.
Figure 20.3 Form with 3D structure field.
To rotate the model or modify the display, double-click in the field. The default tool is the
rotation tool, but it also can be used to select
atoms or bonds. If you right-click in the field,
the context menu displayed is the Chem & Bio
3D control context menu, giving you access to
Chem & Bio 3D commands.
See the Chem & Bio 3D User’s Guide for more
information about using Chem & Bio 3D.
NOTE: Unlike interaction with Chem & Bio
changes you make to a model within
Chem & Bio 3D are not transmitted back to
ChemBioFinder 12.0 , and thus are not saved.
You can put a picture of the Chem & Bio 3D
model into a database by saving the Chem &
Bio 3D model as a bitmap or metafile and
inserting it into a Picture field. The picture does
not retain a connection table and cannot be
edited.
Draw,
1- font
2- point size
3- bold
4- italics
5- underline
6- subscript
7- superscript
8- color
9- left alignment
10- center alignment
11- right alignment
12- bullets
Use the toolbar to format text in Plain Text or
Memo/Rich Text data fields.
Undoing changes
Before committing your text changes, you can
revert to the previous unmodified state.
To undo your changes, do one of the following:
• Click Edit >Undo.
352
Working with Data
Chapter 20
• Click the Undo icon on the Main Toolbar.
After you commit the changes, they cannot
be undone.
Redoing changes
When you undo an action, the Redo command
becomes active. You can reverse the effect of
the Undo command by choosing the Redo
command.
To redo the last action performed, do one of
the following:
• Click Edit>Redo.
• Click the Redo icon.
decreasing numeric order according to that
field. Sorting on the structure field arranges the
list by increasing number of atoms contained
in the structure. Implicit hydrogens are not
counted. Sorting on the formula field orders
the records by increasing C-H-N count (for
compounds containing carbon) followed alphabetically by any other elements. Formulas for
compounds without carbon are sorted in alphabetical order. Sorting by text fields such as
molecular name sorts the records alphabetically.
After sorting, the database must be reset to its
original state before you can update it.
The last action undone is reinstated.
Deleting data
You can delete the contents of individual fields
by using the Delete or Backspace keys. You
cannot delete a structure, formula, molecular
weight or Mol_ID.
To delete an entire record:
1. Move to the record that you want to delete
using the Record commands or toolbar.
2. Do one of the following:
• Click Record>Delete Record.
• Click the Delete Record icon.
The record is permanently removed.
NOTE: You can delete multiple records if you
use the Table view.
Sorting data
You can sort the database by most types of
data in a form. Sorting on the Mol_ID field, the
molecular weight field, or any other numeric
field arranges the current list in increasing or
NOTE: You cannot edit records sorted by formula or molecular weight. However, if you
attempt to sort on one of these fields, ChemBioFinder 12.0 offers to set up a database (a portal
database) which allows the operation. For
details, see “Attaching tables from other applications” on page 342.
To sort on a field:
• In the Form View, right-click in the field
you want to sort by, and click Sort>Ascending or Sort>Descending.
• In the Data Table View, double-click on the
table header of the field you want to sort by.
The table is sorted in ascending order by
the column you selected. Double-clicking
again will sort in descending order.
TIP: There is also a context menu option for
sorting in Data Table view. Right-click in a column and choose Sort Column.
ChemBioFinder & BioViz
User Guide
353
Sorting in languages other than
English
Changing the database
scheme
Text that you sort must be in the same language as the default language of the system on
which the database was created, or an incorrect
sort order can occur.
The ChemBioFinder 12.0 sample databases,
created in English, can be sorted correctly
using the following languages:
You can create or remove fields or tables in an
existing or new database as long as the database is not read-only and you have permission
to modify it. You may also attach, or link,
tables from external data sources.
Use the Box Properties dialog box to perform
the following procedures:
Do one of the following:
• Click File>Database.
• Right-click any empty space in the form
window and click Data Source.
The Box Properties dialog box appears,
with the Database tab displayed.
To add a field:
•
•
•
•
•
•
English
German
French
Portuguese
Italian
Modern Spanish
If you want to sort text in a different language
than the one in which the database was created,
perform the following procedure:
1. On a computer using the same language as
the text you want to sort, open MS Access.
2. Open the MDB file you want to sort.
3. Compact the database: click Tools>Database Utilities>Compact Database.
4. After the database is compacted, close MS
Access.
The correct sort information is written into
the database. When you perform a sort in
ChemBioFinder 12.0, the sort order will be
correct.
Resetting the database
To reset the database to its original state:
Click Search>Retrieve All.
1. Click the Field tab.
2. If there is more than one table, select the
table that will contain the new field.
3. click the Create Field... . The Create Field
dialog box appears.
4. Replace the default name (New_Field),
select a data type, and adjust the field width
(optional). Click OK when you have finished.
To delete an existing field:
1. Select a field.
2. Click the Delete Field... .
A warning box comes up, asking if you
really mean to delete a field.
3. Click Yes to delete the field.
CAUTION
All data entered in the field, will be lost as
soon as you click the YES button.
354
Working with Data
Chapter 20
To add a table:
1. Click the Table tab. Do one of the following:
2. Click the Create Table... .
3. Enter a name in the Create Table dialog box.
The new table is created, with a default
field named ID.
To remove a table:
1. Select a table.
2. Click the Delete Table....
3. Click YES in the warning box.
CAUTION
All data in all fields in the table will be lost.
To attach a table from another database:
1. Click the Table tab.
2. Click the Attach Table... .
The Attach Table dialog box appears.
3. Select the type of database – MS Access or
Oracle/ODBC.
4. For MS Access, browse to the MDB file
containing the table. Select a table, and
click OK.
ChemBioFinder & BioViz
User Guide
355
356
Working with Data
Chapter 20
21
Queries
You can search the database by querying any
field or combination of fields. You can specify
a chemical structure and/or text as the query.
When searching text or numbers, you can use
wildcards or specify a numerical range. When
structure searching, you can search by sub- or
full structure, search for an exact match, similarity, or tautomerism, and specify how stereochemistry will be matched. You can also
combine structure searching with text or
numerical searching. A Find Structure command performs “duplicate”, “error”, “isotopic
label”, and other special structure searches.
The chapter describes the different types of
searches and how to set up and manage
searches. It concludes with some examples of
advanced techniques.
Text searches
ChemBioFinder 12.0, like all databases, supports text searching. You can search any alphanumeric field for strings of text. Use text
searching, for example, to find chemical
names, or comments in a reference field.
For text searches, ChemBioFinder 12.0 interprets the query, then passes it as Structured
Query Language (SQL) to the relational database.
The following rules apply to these queries:
• When searching a normal text or memo
field, a plain text string is taken as an
“unanchored substring”, if you are not
doing Full Word search. An asterisk is
added automatically at each end of the
string, and the hits include any string containing the search string. Thus, if you
search for ‘benz’, it gets converted to
‘*benz*’ and returns benzene and flurobenzene.
• When searching a normal text or memo
field with wildcard, the string is taken as an
“anchored substring”. Thus, if you search
for ‘benz*’ it gets anchored to the left and
returns words beginning with ‘benz’.
• Text strings may contain wild cards or
Boolean operators. Standard wild cards are
% and *. These characters are equivalent
and hit any string. Other wild cards are also
possible. If wildcards are present, they
override the above defaults.
NOTE: Using wildcards or a “=” in memo
fields may lead to unexpected results. This is
because a memo field may contain formatting
information surrounding the text you see, so a
search like benz* may give no hits. Using
*benz*, however, will give the same results in a
memo field as in a plain text field.
• A check box in the Search Preferences dialog allows you to request a full-word
ChemBioFinder & BioViz
User Guide
357
match. When this box is checked, a hit must
contain the query as a complete word, not
embedded within a larger string.
• Boolean operators are NOT, OR, and AND.
They may be used to combine search terms
within one field.
TIP: Use NOT* to search for empty fields.
Examples of queries:
Table 21:
Entry
Possible hits
90
values from 89.5 to 90.5
90.1
values from 90.05 to 90.15
90–100
values from 90 through
100, inclusive
>=90 and <=100
values from 90 through
100, inclusive
>90 and <100
values from 90 through
100, exclusive
Examples of queries:
Entry
Possible Hits
Will Not Hit
benz
Benzene, Benzoic Bromobenzene
acid
benz OR
*bromo*
Benzene, Benzoic Azobenzene
acid, Bromobenzene, Dibromobenzene
=benzene
Benzene
Benzoic acid,
Benzene-d6,
Bromobenzene
Numeric searches
Searching numerical data allows you to find
information such as boiling points and molecular weights.
Ranges are specified using a hyphen between
the values at either end of the range.
For numerical searching, the query is a decimal
value or range. If a single value is given, the
number of significant digits determines the
precision of the search. A hit is any value that
rounds off to the query.
358
Queries
Chapter 21
Molecular formula searches
Formula searching allows you to search molecular compositions. Searches can be inclusive,
exact (designated with an equals sign) or with
the element range you specify.
ChemBioFinder 12.0 allows formula searching
based on special atoms, such as A, Q, X, and
M. The definitions for these atom types can
overlap. For example, the structure, BiCl3 will
be hit by the query, AX3, and it will also be hit
by the query, A4. However, it will not be hit by
the query, A4X3 even though it does indeed
have 4 atom that match A and 3 atoms that
match X.
The following table shows query examples.
Table 22:
Entry
C6H6
Possible hits
compounds with 6 carbons and
6 hydrogen atoms, plus any
number of other elements.
Table 22:
Entry
• Symbols may be repeated. For example,
CH3CH3 is interpreted as C2H6.
Possible hits
=C6H6
compounds with 6 carbons and
6 hydrogen atoms and no other
elements.
C6N0
compounds with 6 carbons, no
nitrogens, plus any number of
other elements.
C6 N1-3
compounds with 6 carbons and
one to three nitrogen atoms,
plus any number of other
elements.
Formula queries consist of element symbols
and element counts or ranges.
The following rules apply:
• Symbols may be one or two letters. Symbols may be in upper or lower case; if there
are ambiguities, the program resolves them
according to rules described in “Formula
Input Rules” on page 495.
• Capitalize the symbols properly and insert
spaces between elements.
• Use the Periodic Table to enter formulas.
For more information, see “Periodic table”
on page 457 and “Formula Input Rules” on
page 495
• Element counts are single integers or ranges
(two integers separated by a hyphen). If a
count is omitted, it is assumed to be 1.
• If the formula query is preceded by = (for
example =C6H6) then the search requires an
exact formula match, containing no elements other than those indicated. If there is
no =, then the search is a partial match:
other elements may be present in the hits.
NOTE: Formula searches are completely nonstructural: CH3CH2OH matches both dimethyl
ether and ethyl alcohol because both
compounds have the same condensed formula:
C2H6O.
• Parentheses may be used to group elements
and apply a count to the entire group. For
example, (CH2)3 is interpreted as C3H6.
• Spaces or non-alphanumeric characters
other than parentheses are ignored.
Date searches
Dates might be used to track individual reaction runs, purchasing histories, and so on.
Searching dates is very similar to searching
numerical data.
Ranges are specified using a hyphen between
the values at either end of the range. Ranges
may also be indicated using inequality operators (<, >) together with the AND operator.
Dates are always displayed according to the
preferences set in the operating system’s International control panel, but need not be input in
that format.
The following table shows query examples.
Table 23:
Entry
Possible hits
Apr 11, 1971
the exact date April 11,
1971
March 31, 1971–
July 1, 1971
any date in the second
quarter of the year 1971
>4/ 11/71,
>=4/11/71
any date after April 11,
1971 or on April 11, 1971
ChemBioFinder & BioViz
User Guide
359
Find list
Use the Find List command to retrieve records
having specific values in any non-structure
field.
Type parameters into the Find List box as follows:
• If the column you search is an integer type,
you can use hyphens to indicate ranges.
• If the column you search is a number or text
type, you cannot use hyphens to indicate
ranges; you must search for an exact match.
NOTE: To search for a list of records using
partial text (a “wildcard” search) or range of
numbers, do a search on the relevant field.
• If the column you search is a text type, you
must use quotes around any item that contains commas. For example, you must type
1,2-Pyran as “1,2-Pyran”.
• You may save a list as a text file and
retrieve it later with the File button.
To find a list:
1. Click Search>Find List.
The Find List dialog box appears.
2. Choose a field from the Column menu.
3. Paste or type a list of field parameters into
the Find List text box.
4. Click OK.
The list of matching records is retrieved.
Structure searches
You can search a ChemBioFinder 12.0 database by sub- or full structure. To define your
search more precisely, use the query functions
in Chem & Bio Draw. These are described in
Chapter 9 of the Chem & Bio Draw User Manual,
360
Queries
Chapter 21
and in “Structural Query Features” on page
483 in this manual.
ChemBioFinder 12.0 matches structures in
three ways:
• Search type (Normal/Exact/Similarity)
• Structure mode (sub- or full structure)
• Tautomerism
Figure 21.4 Structure search tree
Search types
ChemBioFinder 12.0 supports three structure
search types:
• Normal
• Exact
• Similarity
Normal and similarity searches may be in
either of two modes: full structure or substructure. Normal and exact searches may also
search for tautomerism.
Normal searches
A Normal search finds structures that either
contain (Substructure) or match (Full Structure) the query. When drawing a structure
query, you can attach different features to a
query, such as atom lists and variable bond
types, to perform a narrower or broader search.
You can also modify the results of a Normal
search by selecting options in the Details tab of
the Preferences dialog box.
The query structure is highlighted in red in the
hitlist structures to visualize the match.
Exact searches
The Exact search type, also known as an Identity search, is intended for use in compound
registration, when you must know if a perfectly
identical copy of your query compound is
already present in the database. The target
must be chemically identical to the query,
including stereochemistry, charges, and isotopy. It is a convenient shorthand for full structure, same-stereochemistry, and appropriate
settings of all the other options. Thus, generic
atom and bond types such as R, A, and Double-or-Aromatic in the query will match corresponding atom and bond types in the target
only if they are also of the same generic type.
In other words, an atom labeled “R” in the
query must find a matching atom labeled “R”
in the target to produce a hit. If the stereochemistry of the query is unspecified, it will only hit
targets which do not specify stereochemistry.
The only variable in an exact match search is
whether or not it is tautomerically flexible.
The Details tab in the Preferences dialog box is
unavailable for Exact searches.
Similarity searches
A Similarity search finds targets that “look
like” the query. Similarity searches are by their
nature “fuzzy”. What “looks like” means is
obviously subject to interpretation and depends
on the application. In medicinal applications
the drug absorption properties are relevant. In a
toxicological context the metabolism is of
interest. For database queries, the similarity in
functional groups is what is measured. A quantitative measure of similarity, know as the Tanimoto algorithm after its discoverer, is
calculated. For more information, see Appendix ChemBioFinder-C: .
Similarity searches may be either full- or substructure. In a substructure similarity search
there is no penalty if the target contains extra,
non-similar aspects. In a Full Structure similarity search, the results are guaranteed to include
all hits you would obtain from a substructure
search with the same query. Usually, they
include additional hits. For this reason, similarity searches are useful if you have a general
idea of the types of compounds you are looking for, but don’t have a precise conception of
the target compound.
Unlike exact searches, similarity searches do
not highlight matched portions of the target
compounds. Similarity searching matches general structural features and not specific atoms
and bonds, so highlighting specific areas
would not be appropriate.
You can adjust the degree of similarity (from
0 to 100%) necessary to produce a hit by using
the slider on the Search Type tab of the Preferences dialog box.
Structure modes
The term “Structure Mode” refers to whether
the query defines a substructure of the compounds in the database being searched, or the
full structure. In this context, it is important to
note that “full structure” does not mean the
same as “exact”. When you specify the
“Exact” search type, the structure mode is
always full structure, but you may choose the
full structure mode with any of the three search
types. See “Full structure searches” on page
362 and “Exact searches” on page 361 for
more details.
Substructure searches
A substructure search finds structures that contain the query, plus any additional attachments
at the open positions. This is the default search
mode. The substructure is highlighted in red in
the hit-list structures. Using the ChemDraw
ChemBioFinder & BioViz
User Guide
361
ActiveX toolbar, you can attach different features to a query, such as atom lists and variable
bond types, to perform a narrower or broader
search. For more information about what query
features you may use and how these features
affect a search, see “Changing the scope of a
search” on page 489.
NOTE: In searching substructures, ChemBioFinder 12.0 finds the substructure query
regardless of its orientation or drawing presentation in the targeted molecules. Bonds shown
in bold above are actually highlighted in red in
ChemFinder 12.0.
Full structure searches
A full structure search finds structures that
completely match the query. If you do not
specify stereochemistry, or use generic atom or
bond labels, you may get more than one hit.
You may also get more than one hit if there are
duplicates in the database. For more information, see “Stereochemistry” on page 363 and
“Exact searches” on page 361.
Fragment searches
You can draw more than one structure or structure fragment in your substructure search
query. In the Details tab of the Preferences dialog box, you may allow fragments to overlap in
the target structure.
For example, if you perform the following substructure query with Query fragments may overlap in target selected:
Figure 21.5 Fragment query
362
Queries
Chapter 21
The hit list will include the following:
Figure 21.6 Example of substance hit in a fragment
query
The dot indicates an atom shared between the
two fragments. The hit list will not include this
molecule if the overlap option is deselected.
Tautomeric searches
A tautomeric search is one in which the location of single and double bonds may vary from
query to target. A hit occurs if, in addition to
the atom types matching, the target possesses a
tautomeric form whose bond orders match the
query’s. Which tautomers are recognized is
under some degree of control. Tautomers of
the form:
Figure 21.7 Tautomeric structure
are always recognized when at least one of X
and Z is not carbon. The lone pair may include
a migrating proton. It is also possible to
include tautomers in which X and Z may both
be carbon. The choice must be made at the
time the database is created or upgraded,
because it affects how structures are stored.
Mesomers (resonance structures) are also
picked up in tautomeric searches. Tautomerism
involving formation or cleavage of sigma
bonds is not currently supported. The principal
categories are ring-chain tautomerism, as in the
open vs. cyclic forms of sugars, and valence
tautomerism.
Tautomeric searching is slower than non-tautomeric, but is the mode of choice when you
think the target might have a slightly different
layout of double bonds.
NOTE: If the database has not been indexed,
the tautomer searches may be slow.
Stereochemistry
You can specify whether or not you want a
structure search to consider stereochemistry.
Given a structure with one or more stereocenters, you can store four different possibilities:
• A given absolute configuration. To specify
this, centers must be drawn with stereo
bonds, and the entire structure marked Abs
(CHIRAL).
• A racemic mixture of the drawn configuration and its mirror image. This is drawn as
above, but without the Abs (CHIRAL) mark.
• An unmarked structure, representing
unknown stereochemistry, or a mixture of
all possible stereo-isomers.
• A given relationship between centers. That
is, a known orientation of the substituents
with respect to each other, rather than a
known absolute configuration. To specify
this, centers are drawn, not with the standard hashed and wedged bonds, but with
thick stereo bonds.
If these options are checked in the Search tab
of the Preferences dialog, then any stereochemistry indicated on the query must be
matched by the target. For more information
on changing searching preferences, see “Setting search details preferences” on page 370.
3D Properties
3D queries are particularly useful in pharmacophore searching where you are looking for a
particular 3D relationship among atoms and
bonds, for example in a series of potential
receptor ligands. You can create a 3D query in
Chem & Bio Draw Pro by adding geometries
(lines, planes, etc.) and constraints (specified
as ranges) to a query structure. For example,
you might specify that two atoms must be
between 4Å and 5Å apart, or that two planes
must be separated by 80-100°. ChemBioFinder
12.0 can then use these properties to refine a
search. See the Chem & Bio Draw User’s Manual
for information on how to add 3D properties to
structures.
NOTE: The 3D Properties feature is available
in Both Pro and Ultra 12.0, but not in Standard
version.
Searching with R-groups
ChemBioFinder 12.0 supports queries using Rtables, including multiple R-tables. Queries
containing large numbers of R-groups or large
numbers of R-values are not advisable however, because ChemBioFinder 12.0 pre-processing expands the query, substituting all
combinations from the R-group table(s).
Alternative groups
Instead of submitting multiple queries on
structures that share a common substructure,
you can submit a single query with the parent
structure and variable functional groups or
substructures. The parent structure is drawn
ChemBioFinder & BioViz
User Guide
363
with attachment point(s) that refer to a list of
alternative groups that you define.
Figure 21.8 Alternative groups
Defining an alternative group
To define an alternative group:
1. Click the query icon to begin the search.
2. Right-click in the structure window and
click the Edit in Chem & Bio Draw.
TIP: You want to open Chem & Bio Draw because
you will need more space than the structure
window provides.
opens to a new page.
3. Draw the parent compound.
4. Label the atom where the alternate groups
will attach with a generic label such as R.
Chem & Bio Draw
364
Queries
Chapter 21
5. Click the Alternative Group query tool.
6. Drag with the tool in an open part of the
page to create an area large enough to draw
the alternative groups.
7. Type a title in the Alternative Group Title
box. The title must match the atom label in
the parent structure, but we’ll use R in this
example).
1- Title box
Figure 21.9 Adding a title to an alternative group
8. Draw the substructure fragments in the
Alternative Group box. Use the single bond
tool to define a fragment, and the text tool,
atom HotKeys, or Nicknames to create
atom labels for each variable.
Figure 21.10 Adding the alternative groups
9. Add the Attachment Points:
a. Click the diamond shaped Attachment
Point tool on the Chemical Symbols palette.
b. Click the open atom position on each
substructure fragment.
TIP: Alternatively, the HotKey “.”(period) can
be used to add attachment points.
Figure 21.11 Completed alternative group query
NOTE: In the above procedure, the parent
structure was drawn, then the R-Group table
was added. In fact, the order doesn’t matter. You
may create the R-Group table first, then draw
the parent structure. In either case, as soon as
a generic atom label in the structure matches
the group title in the R-Group table, a hollow
attachment point symbol appears next to the
label in the parent structure.
10.Type Ctrl+W to return to ChemBioFinder
12.0.
The structure and the R-Group table appear
in the structure window.
11.Continue the query as usual.
ChemBioFinder & BioViz
User Guide
365
Reaction searches
You can search and store reactions. In a reaction, one or several compounds (reactants) are
transformed into other compounds (products).
Individual reactants (or products) are separated
from each other with plus signs. The reactants
are separated from the products with an arrow.
Reactions may have multiple steps, for example
(A)
(B)
(C)
(D). Here, (A) is the
reactant and (D) is the product. (B) and (C) are
intermediates for the complete reaction.
A multi-step reaction is actually a shorthand
notation for many related reactions. In the
example above, (B) is an intermediate for the
complete reaction, but it is also a reactant relative to (C) or (D). It is also a product relative to
(A). The complete reaction implies many subreactions, such as:
(B)
(D) and (A)
(B).
Reaction centers
The most important part of a reaction is the
part that actually changes from the reactants to
the products. This part, which probably
includes a number of atoms and bonds, is
called the reaction center. For example, only
the bold bond in the figure below (and the two
atoms on either side) is part of the reaction
center. The rest of the structure is unchanged
from the reactant to the product:
atoms and bonds that change in the query must
be part of the reaction center of the target.
For example:
does not hit
Figure 21.13 Query does not hit because it does not
contain the reaction center.
when the Reaction query must hit reaction center preference is selected. Even though there is
a C-F bond in the target reactant and a C-Cl
bond in the target product, these bonds do not
participate in the reaction, which really affects
another part of the compound. If you deselect
the Reaction query must hit reaction center
preference, this query hits the target above.
When creating reaction queries, it is important
to consider what sort of information you are
really looking for. Suppose you want to convert n-decanal to n-decanol:
Figure 21.14 Reduction of n-decanal
Are you really interested only in these two
compounds? You might be interested in any
reaction that converts a straight-chain aldehyde
to the alcohol:
Figure 21.12 Reaction center example
By default, ChemBioFinder 12.0 considers
reaction centers whenever you search for reactions. ChemBioFinder 12.0 assumes that any
366
Queries
Chapter 21
Figure 21.15 Generic aldehyde reduction query
Since the corresponding n-octanal
n-octanol reaction would probably occur under very
similar conditions, it is a reasonable thing to
look at. Generally, you want to use substructure queries that include little beyond the reaction center in question when you are searching
for reactions.
NOTE: ChemBioFinder 12.0 supports several
query properties to allow you to specify exactly
how a bond participates in a reaction center.
For more information about these properties,
see “Setting search details preferences” on
page 370.
Atom-to-atom mapping
The second most important part of reaction
searching is the atom-to-atom map. You can
specify maps in Chem & Bio Draw, where they
are stored as part of the data about a reaction.
Maps are used during searching to resolve certain types of structure search hits. Atom-toAtom mapping does not affect the search result
when a query reaction is done with or without
reaction map.
Consider a simple esterification reaction:
Figure 21.16 Esterification example
Does the ester oxygen come from the acid or
the alcohol? You specify the fate of individual
atoms through an atom-to-atom map. In reality, the ester oxygen in this reaction originates
in the alcohol, so the atom-to-atom map looks
like this:
Figure 21.17 Atom map of esterification
By matching numbers across the arrow, you
can see where atoms move during the course of
the reaction. The other reaction (not observed
experimentally), where the ester oxygen comes
from the acid, would be mapped like this:
Figure 21.18 Alternate possible atom map for esterification
ChemBioFinder 12.0 uses atom-to-atom map
information to determine reacting centers for
reactions. If only some atoms are mapped,
ChemBioFinder 12.0 uses that information and
does not worry about the specific fates of the
other atoms. For example, if you don’t know
(or don’t care) about the mapping of some
atoms, you can leave them unspecified in the
atom-to-atom map.
By default, atom-to-atom mapping is not displayed within ChemBioFinder 12.0. To turn on
this display, select Atom-to-Atom Map on the
Structure sub-menu of the View menu. For
more information, see “Changing options with
the view menu” on page 454.
NOTE: For information about specifying
atom-to-atom maps with Chem & Bio Draw, see
the Chem & Bio Draw User’s Guide.
ChemBioFinder & BioViz
User Guide
367
Searching for reactants
If you know what starting materials you are
interested in but don’t know their products,
you might perform a reactants query. A reactants query is very similar to a reaction search,
except that there is nothing to the right of the
arrow. For example, consider the query:
intermediate. An Intermediate Search is very
similar to a normal reaction search, except that
there are arrows on both sides of the target
structure. For example, consider the query:
R
C
C
O
Figure 21.21 Sample intermediates query
This finds any reactions containing the Ketene
structure shown as an intermediate.
NOTE: ChemBioFinder 12.0 cannot predict
products or intermediates of reactions. It finds
this information only if it is already present in
the database.
Figure 21.19 Sample reactants query
If you are doing a substructure search, this
finds any reactions in which maleic anhydride
or a compound containing a maleic anhydride
substructure is consumed or transformed.
Searching for products
If you know the desired end product but not
how to get there, you can do a products query.
A products query is similar to a reaction
search, except that there is nothing to the left of
the arrow. For example, consider the query:
Figure 21.20 Sample products query
If you are doing a substructure search, this
finds any reactions in which bicyclo[2.2.1]heptane or a compound containing this substructure is produced.
Searching for intermediates
Rarely, you may be looking for reactions for
which you only know something about an
368
Queries
Chapter 21
Combined searches
You can combine structure searching with text
searching to find a specific class of compounds. For example, you may want to find all
compounds in the database whose names end
in mycin and whose structures contain a phenyl
ring. Because you are entering multiple queries
in different data boxes, there is an implicit AND
condition between data items in different
fields.
To perform a combined search:
1. Do one of the following to clear the form:
• Click Search>Enter Query.
• Click the Enter Query icon on the Search
toolbar.
2. Enter the structural query, if any.
3. Enter the text and/or numeric queries in the
appropriate boxes.
4. Do one of the following:
• Click Search>Find.
• Click the Find icon on the Search Toolbar.
Combined searching example:
a valid query might be
Suppose you want to find all molecules in the
CS_Demo database that contain a benzene ring
and which have names related to penicillin.
\[molname] like 'benz*' and [bpoint] > 200.
A straight SQL query may be entered in any
box of the form which contains non-structural
data. The SQL query is not associated with the
box in which it is entered.
Click Search>Enter Query.
Draw a benzene ring.
Enter *penicillin* in the Molname field.
Check that the Search>Substructure option
is selected.
5. Click Search>Find.
1.
2.
3.
4.
You get 2 hits of molecules whose names contain penicillin and whose structures have an aromatic ring of six carbon atoms.
NOTE: In a combined search, progress reports
are given only during the structure search part.
When the counters at the bottom of the screen
are advancing, structures are being searched.
You can press Esc to end a search during the
structure searching. You cannot end a search
during the SQL searching by pressing Esc.
Query procedures
Searching includes the following steps:
• Setting the search type preferences (Structure searches only).
• Entering the query in the form.
• Submitting the query to the search engine.
To perform a search, use the Search menu or
the corresponding tools in the Search toolbar.
SQL searches
SQL (Structured Query Language) can be used
to create powerful searches. The details of the
language are not discussed here.
Queries beginning with a backslash (\) are
taken as straight SQL, and passed directly to
the database as the WHERE clause of the SQL
query. These must contain column names and
punctuation as dictated by SQL. For example,
Figure 21.22 The Search toolbar
The following procedures describe searching
with the Search menu. You may use the Search
toolbar instead for most procedures.
Setting search type preferences
You can set preferences for the type of structure for which you want to search.
To set Search Type preferences:
ChemBioFinder & BioViz
User Guide
369
1. Select Preferences from the Search menu.
The Preferences dialog box appears, with
the Search Type tab displayed.
If you want to
find structures having
features similar to the
query.
Then click
Similar and set
the degree of
similarity.
NOTE: The
higher the
value, the
fewer hits
found.
Figure 21.23 Search type preferences
2. Take the appropriate action:
If you want to
Then click
find structures containing Substructure.
a common structural
component
find structures that are
tautomeric forms of the
query
Tautomeric.
match bonds as drawn,
Non-tautowithout tautomeric forms meric
3. Click OK.
find a particular structure Full Structure.
search with variability in
the query
Normal
search for a precise match Exact
TIP: You don’t always have to access the Preferences dialog to change search preferences.
Switches on the Search menu allow you to toggle Substructure/Full Structure and Normal/Similarity.
Setting search details preferences
You can set preferences for the details of each
search.
To set search details preferences:
1. Click File>Preferences.
The Preferences dialog box appears.
370
Queries
Chapter 21
2. Click the Details tab.
The Details tab appears.
3. Take the appropriate action:
If you want to
Then click
Allow uncharged non- Hit any charge on
heteroatom.
carbon atoms in the
query to match charged
atoms in the target.
NOTE: Charged
atoms in the query
must always match
charged atoms in the
target, regardless of
this setting.
Allow uncharged
On carbon.
carbon atoms in the
query to match charged
carbon atoms in the
target.
NOTE: Charged
atoms in the query
must always match
charged atoms in the
target, regardless of
this setting.
Allow hits to contain
Permit extraneous
molecular fragments in fragments in full
addition to the structure structure searches.
hit by the query.
If you want to
Then click
Run a search that
ignores differences
merely due to salt state
and presence of
solvents.
• Ignore salts
and solvents.
• Hit any charge
on heteroatom.
• On carbon.
• Permit extraneous fragments in full
structure
searches.
Allow fragments in the Query fragments
query to overlap (share can overlap in
one or more atoms) in target.
the target.
Require that any reac- Reaction query
tion center present in
must hit reaction
the query overlap with center.
reaction centers in the
target. This preference
applies only to reaction
searching.
Prohibit generic struc- Generics hit only
tures from hitting any generics.
other structures in a
query.
Require full-word text Text: match full
matching. If you do not word only
check this box, the
query will hit any
matching text fragment.
ChemBioFinder & BioViz
User Guide
371
If you want to
Then click
Setting stereochemical search preferences
Require that the stereochemistry of the target
structure match that of
the query structure.
Match stereochemistry and click How
The Stereochemical Search Preferences dialog
box is activated from the Tuning tab of the Preferences dialog box.
To set Stereochemical preferences:
to set how the
stereochemistry is
matched.
Tuning
The Tuning tab of the Preferences dialog box
has settings for special query conditions. On
this tab, there are check boxes for:
• full word text matching
• case-insensitive matching (for Oracle)
• matching stereochemistry
1. Click File>Preferences.
The Preferences dialog box appears.
2. Click the How button on the Tuning tab of
the Preferences dialog box.
The Stereochemical Search Preferences
dialog box appears.
The only box that is checked by default is the
Match Stereochemistry box. See the figure
below:
Figure 21.24 Stereochemistry search preferences
372
Queries
Chapter 21
3. Set the Tetrahedral stereo center hits:
If you want a tetrahedral stereocenter in
the query to...
Then...
match the target exactly. in Tetrahedral stereo
center hits, click
Same.
match same or opposite in Tetrahedral stereo
configuration at the
center hits, click
Either.
center of the target.
4. Set the Double bond hits:
If you want the configuration of a double bond in the
query to
Then in
match the target struc- Double bond hits,
ture exactly.
click Same.
match any configuration in the target.
Double bond hits,
click Any.
5. Click OK.
match any target.
in Tetrahedral stereo
center hits, click
Any.
match a relative relaclick Thick bonds
tionship between centers represent relative
stereochemistry.
NOTE: When Thick bonds represent relative
stereochemistry box is cleared (default), thick
bonds are interchangeable with hash/wedge
bonds. When the box is checked, and
Tetrahedral stereo center hits is set to Same,
a query marked with thick bonds will only hit a
target that has the same relative relationship
between centers.
Entering query mode
To clear the form and enter Query Mode:
Click Search>Enter Query.
You are in Query mode.
In Query mode:
• The form background color changes.
• QRY appears in the status bar.
• Form boxes which do not permit data entry
become editable for entry of queries.
• Form boxes are displayed according to their
visibility properties. For more information,
see “Hiding data boxes” on page 321.
Entering and submitting a query
To enter the query:
1. Position the cursor over the field you want
to search and click to select it.
2. Enter the query in the data boxes.
ChemBioFinder & BioViz
User Guide
373
3. Click the Search on the Query Mode box.
ChemBioFinder 12.0 searches. The number
of hits is shown in the Status Bar at the
lower right corner of the window.
NOTE: If a search gets no hits or an error
occurs, an alert appears and you are returned
to Query mode to enter a different query or
modify the current one.
The hit list is a subset of the complete database. You can browse it as you would any
database using the Record commands in the
Record menu or toolbar.
For example, to view the hits in tabular form:
Click View>Data Table.
Stopping a search
To stop a structure search in progress, press the
Esc key. The query stops and you return to
browse mode.
NOTE: Only queries that involve structural
data (structure, molecular formula, and molecular weight searches) can be stopped in this
manner. SQL searches and searches that
involved non-structural data cannot be
aborted.
Refining a search
You can refine a hit list of one or more records
by entering a query that searches only the hit
list, not the entire database.
To refine a search:
1. Verify that the Search>Over Current List
menu option is selected.
374
Queries
Chapter 21
2. Do one of the following:
• Click Search>Enter Query.
• Click the Enter Query icon on the Search
toolbar.
ChemBioFinder 12.0 searches over the
previously retrieved hit list. If no hits are
found, a message appears asking whether
to search over the entire database.
As long as the Over Current List switch is on,
each search further refines the current list. Use
the Retrieve All command to reset. You may
also use the Restore Previous List command,
which acts like a “Back” button. Restore Previous List goes back one in the history, including
any “Retrieve All”s you might have done.
Entering a structural query
To begin a structural query:
1. Do one of the following to clear the form:
• Click Search>Enter Query.
• Click the Enter Query icon on the Search
toolbar.
2. Do one of the following to place a structure
into a data box:
• Double-click in the structure box and edit
with the Chem & Bio Draw Control.
• Right-click and click Edit in Chem & Bio
Draw.
• Right-click and click Read Structure to
open an existing molecule file.
• Use Edit>Paste to insert a structure from
the clipboard.
3. Click Search>Preferences.
4. Click the Search Type tab.
5. Select the appropriate options. Optionally,
select options on the Details tab as well.
6. Do one of the following:
• Click Search>Find.
• Click the Find icon on the Search Toolbar.
The status bar counters indicate search progress. When the search is complete, the form
displays the first hit. The list you can browse is
limited to the hits. For Normal or Exact
searches, the hit portion of each molecule is
highlighted in red. If a search doesn’t find any
hits, you are returned to query mode.
TIP: You can change the highlight color in the
preferences dialog. For example, to show no
highlighting, choose black as the highlight
color. See “Color preferences” on page 452 for
more information.
Using the current molecule as a query
As you browse through a database, you may
submit any structure on the screen as the structural query. Often, you use similarity or substructure searches (see above) with this type of
query to find related compounds.
To use the current molecule for a query:
1. Using the Record commands, go to the
record containing the structure that you
want to use as a query.
2. Click Search>Current Mol As Query.
All boxes of the form are cleared except the
structure so that the molecule on display
can be used as part of the query. You can
then continue with the query as if you had
drawn the structure from scratch.
Finding the current molecule
The Find Current Molecule command, located
in the Search menu and on the Search toolbar,
is similar to the Current Mol as Query command discussed above. As you browse through
the database you may find a molecule that
interests you, and want to find other related
records.
The Find Current Molecule feature lets you
perform a quick structural search of the structure currently being displayed on the form.
However, this feature does not allow you to
enter other search terms. The type of structure
search (complete structure, substructure,
and/or similarity) is determined by what you
have selected in the Search menu.
To find the current molecule:
1. Browse to the record containing the structure of interest.
2. From the Search menu, choose the type of
structure search you want to perform.
3. Do one of the following:
• Click Search>Find Current Mol.
• Click the Find Current Molecule icon on
the Search Toolbar.
ChemBioFinder 12.0 begins the search and
displays the search status on the lower right
corner of the status bar. When the search is
complete, the form displays the first hit, and
the list you can browse is restricted to the
records hit by the query.
Entering a reaction query
The general procedure for creating a reaction
query is very similar to creating a structural
query.
1. Do one of the following to clear the form:
• Click Search>Enter Query.
• Click the Enter Query icon on the Search
toolbar.
The form clears.
2. Enter the query:
• Double-click in the Structure box.
• The Chem & Bio Draw Control appears.
• Draw the structure or substructure or reaction in the From ChemBioFinder 12.0
window.
ChemBioFinder & BioViz
User Guide
375
•
Click somewhere in the form outside the
Structure box.
3. Optional: enter more query terms in the
other data boxes for a combined search.
4. Select or deselect the Search>Substructure
menu option, as appropriate for your query.
shows the menu options under Find Structures submenu:
NOTE: The Similarity option is not available
for reaction queries.
5. Do one of the following to search:
• Click Search>Find
• Click the Find icon on the Search Toolbar.
The search proceeds as with simple
structure searching.
Special structure searches
The Find Structures submenu on the Search
menu provides for several common types of
structure searches can not be efficiently conducted using regular means.
NOTE: The Special Structure Searches feature
is available in both Pro and Ultra 12.0, but not
in Standard version.
As with other searches, all of these searches
operate within the current record set if the Over
Current List option is in effect. Otherwise, the
whole list is searched, regardless of how many
records are currently displayed. Special structure searches are intended to apply to all data
sources, including Oracle, but presently only
work for MST sources. The following figure
376
Queries
Chapter 21
Figure 21.25 Find Structure menu
These are generic searches, made without
entering any query information. The options
are:
• Empty Structures—Locates records containing no structure. It is equivalent to specifying a molecular weight of zero in a
regular search. It is provided because the
latter method is a bit obscure.
• Reactions—Locates structures that are
reactions. The same effect can be achieved
by entering a bare arrow as a structure
query.
• With Stereo Centers—Finds structures containing tetrahedral stereochemistry.
• Missing Stereochemistry—Finds structures
with atoms capable of tetrahedral or double
bond stereochemistry, but drawn as
“unspecified”.
• Charged—Finds one or more atoms with a
charge.
• Radical—Finds one or more atoms with a
radical.
• With Isotopic Labels—Retrieves records
containing a structure with an atom that
either has a mass number, or has an Isotopic
Abundance attribute.
• Query Structures—Locates structures with
any generic variability such as atom types
(R, A, M, Q, X, Alkyl, Aliphatic, EDG, EWG),
bond types (single-or-double, etc.), variable
charge, element lists ([C,N,O]), ring bond
count, etc.
• 3D—Locates structures that could be targets in a 3D search. These are structures
scaled in Angstroms and having Z coordinates. Both conditions must be met. Structures that meet only one of these conditions
can be found by using the Check structures
search.
•
•
•
•
•
•
NOTE: The 3D feature is available in both Pro
and Ultra 12.0, but not in Standard version.
• Classes—Provides the following search
options (selectable from a submenu):
•
•
•
•
•
•
Hydrocarbons: Finds structures with Carbon and Hydrogen only. If there are more
than one fragments, they must all be
hydrocarbons.
Aliphatics: Finds structures with a carboncarbon bond (or methane) and no rings.
Alicyclics: Finds structures having a carbocyclic ring that is not aromatic or antiaromatic.
Aromatics (4n+2): Finds structures containing one or rings with a 4n+2 electron
system. Includes pyrrole and charged
rings.
Antiaromatics (4n): Finds structures containing one or more rings with a 4n electron system.
Aromatics (Cyclically alternating): Finds
structures containing one or more rings
that have 4n+2 bonds, distributed as alter-
•
•
nating single and double bonds. This is the
criterion for "delocalized" used since
ChemFinder 10.
Natural products: Finds structures containing a carbon and at least nitrogen or
oxygen.
Alkaloids: Finds structures with
MW>200, and containing carbon and
basic nitrogen.
Heterocycles: Finds structures having a
ring containing a heteroatom.
Metals: Finds structures containing a
metal bond.
Organometallics: Finds structures containing a metal-carbon bond.
Organics: Finds structures having a carbon atom.
Inorganics: Finds structures lacking carbon.
Salts: Finds structures that can be considered as salts.
• Rings—Finds any of the following types of
ring structures (selectable from a submenu):
• Bridged: Systems. For example, two rings
share more than one bond.
• Spiro: Systems. For example, two rings
sharing just one atom.
• Fusion: Systems. For example, structures
with a ring fusion (two rings sharing one
bond).
• Highly condensed—Rings sharing at least
four bonds with others in the group, where
the group has at least seven rings.
• Necklace—A ring bridging at least one
other ring half its size or less.
• Polyhedra—A group of rings each of
which is fused to at least two others in the
group.
ChemBioFinder & BioViz
User Guide
377
• Duplicates—Locates all records whose
structures duplicate at least one other.
If Clustered List is selected, the query will
be a list of duplicates only, clustered
together (that is, a sorted list). This makes
duplicates easier to compare, but you
cannot edit records displayed in a sorted
list.
If Unique Structures Only is selected, the
query will be the same as the parent list, but
with only one unique copy of each
duplicate structure.
record set, or until the scan is aborted. You
can change this by unchecking the box at
the bottom of the dialog box.
NOTE: The Duplicate search must be performed in Full Structure mode. If the Search
type is set to Substructure, you will get an error
message reminding you to reset the search type
preference to Full Structure.
• By date modified... — Locates structures
updated recently or some other point in
time. It applies to structures only, not to the
other database fields. It is not implemented
for Oracle at this time. Also, while it
applies to the last time a structure was
added or edited, it misses deletions. The
way it works is to read the modification
date written within the structure. Deleted
records have no such date.
• Check structures—Locates records by
checking the properties specified in the
Check structures in database dialog box.
Depending on the specified properties, and
whether the database is read-only, it may be
possible to automatically re-register the
structure with a corrected version. By
default, this scan begins at the currently displayed record and proceeds to the end of the
378
Queries
Chapter 21
Figure 21.26 Check structures in database dialog
box
The following properties can be checked:
•
•
•
•
Ambiguous stereochemistry—Flags structures with ambiguously drawn tetrahedral
or double bond stereochemistry. Not correctable.
Valence/charge—Flags structures containing an atom with an impossible valence or
charge. Sometimes correctable.
Net charge present—Flags structures containing a net charge. This option is not
checked by default because it is not normally useful. Not correctable.
Unrecognized atoms—Flags structures
containing an atom that was not interpreted by ChemBioFinder 12.0. Such
atoms typically have atom type R with a
greyed text label containing question
marks. Not correctable.
•
•
•
Mass imbalance—Flags reactions in
which the molecular formulae of reactants
is different from products. Not correctable.
Doubly drawn atoms—Flags structures in
which two atoms are very close together
and at least one of which lacks a label.
(Also, to qualify as a doubly drawn pair,
the combined valence of explicit bonds
must not exceed the capacity of either
atom.) You get this sort of structure when
attempting to draw a bond from an existing atom, but miss and accidentally create
a new atom. Chem & Bio Draw flags these
cases with a wavy red box.
3D not scaled in Angstroms—Flags structures with Z coordinates or 3D not scaled
in Angstroms. Such structures will not be
struck in a 3D search.
NOTE: The 3D not scaled in Angstroms feature
is available in both Pro and Ultra 12.0, but not
in Standard version.
•
•
•
Miscellaneous—Presently, this checks one
thing: that isotopic masses seem reasonable.
False stereomarks—flags stereochemical
indicators such as a wedged bond on an
atom that is incapable of stereochemistry
because of its geometry. In a normal
search, such indicators are ignored. The
option allows you to find all such stereochemical indications and correct any
errors.
CDX <-> Mst correspondence: Checks
whether the chemical interpretation of the
original CDX drawing remains same in
the latest version of the software. It also
checks whether the stored internal structures need to be regenerated from the
CDX.
•
•
•
Atom-atom maps: Checks whether the
quality of auto-generated maps is satisfactory. However, user-defined maps are not
checked, and are considered legitimate.
Locate deleted structures: Identifies structures that have been deleted from structure
boxes.
Representational Drift: Checks several
invisible aspects of stored chemical structures and ensures that the stored chemical
structures are up to date with the latest
software version.
NOTE: When the Interactive option is
selected, the application displays dialog boxes
with warnings and errors, if any. However, if
you select the To file option, you need to provide
the path for storing the log file containing
warnings and errors. In this case, errors and
warnings are not displayed in dialog boxes.
To perform a Check structures search:
1. Select the categories of interest.
2. Click the Scan.
When a structure is flagged, its record is
displayed, the offending atom or bond (if
any) is “flashed” and an alert offers the user
several choices.
The options are:
if you want to...
ignore the error and
continue checking the
same structure.
then click...
Don’t know or
Ignore
ChemBioFinder & BioViz
User Guide
379
if you want to...
then click...
rewrite the MST record,
thus correcting the
problem.
is unspecified or
has stereo
Continue the scan from
the next structure.
Skip to Next Structure
stop the scan.
Stop Scanning
This leaves you on the last
record that exhibited a
problem
“flash” the problematic
atom or bond.
Flash
To activate the Queries tree control:
View details about a
warning message.
Help
Fix the error automatically.
Auto-Fix
Managing queries
The Queries Tree Control in the Explorer window maintains a list of search queries from the
Queries
Chapter 21
CAUTION
Depending on your preference settings,
unnamed queries may be automatically discarded. See “Saving and restoring lists” on
page 382 for details.
This button only appears
when the error revolves
around an atom or bond.
Clicking the button
creates a circle that moves
toward the atom/bond,
drawing the eye to it.
380
current and previous sessions. Queries are
associated with forms, and the query list is
saved when you save the form. When you open
or activate an existing form, the tree updates to
show only the queries for that form.
Each time you carry out a search or list operation, a new query is generated in the tree. A
name is assigned to the query, and it is displayed in the tree along with the size of the list
(number of hits) and a brief description. The
generated name is “Q<n>*”, where n is a
sequential number, and * indicates that the
query has not been named or marked for saving.
1. Click the View>Explorer Window menu
option.
2. Click the Queries tab on the Explorer window to display the Queries tree.
Queries are listed as “children” of the database
(displayed as Full List). When you select
Search Over Current List from the Search menu
before performing a query, it is displayed as a
“child” of the previous list. (The current list is
indicated with a frame around the colored
box.).
if you want to...
database
(full list)
Current
List
(marked with
a frame)
Search over
Current list
query
(child list)
merge the hits of the selected Restore List
query with the current list. See
“Restoring a hit list” on page
383 for details.
apply the query’s color to a plot Color On Plot
of the intersection of the
selected query with the current
list. (This is the same as singleclick on the query.)
choose a different query icon
color from the color picker
dialog.
Figure 21.27 The Queries tree
then
choose...
Change Color
modify the query and/or rerun Restore Query
it.
To restore a query:
Double-click a query.
Restore Query goes to Query
TIP: Double-clicking the root item, Full List,
has the same effect as choosing Retrieve All
from the Search menu.
mode and displays the structure. You may modify the
query, then rerun it manually.
save the query to a separate
file, with extension .cfq.
Save Query...
mark the query so it will be
saved (as named) when the
form is saved.
Keep
The Queries context menu
When you right-click on a query, you display a
menu with commands to manage the query.
if you want to...
then
choose...
repeat the search using the
Rerun
selected query. (This is the
same as double-clicking on the
query.)
This has no effect unless the
Query Saving preference has
been set to Discard unnamed
queries. See “Saving and
restoring lists” on page 382.
ChemBioFinder & BioViz
User Guide
381
Domains
if you want to...
then
choose...
delete the selected query from Remove
the tree.
The next time you save the
form, this query will be lost. If
you delete by mistake, you can
close and reopen the form
without saving.
rename the query.
Rename
When the Query Saving preference has been set to Discard
unnamed queries, this has the
same effect as Keep.
for all queries at the same
Sort Folder
depth in the tree, sort alphabetically by name.
You also use the context menu to display the
Query Properties dialog box. In this dialog
box, you can modify the query name, add a
comment, or change the color used in plots.
Text entered in the Comments box will replace
the standard description displayed along with
the number of hits.
Figure 21.28 The Query Properties dialog box
382
Queries
Chapter 21
If you are browsing a list other than the full database, you can make it seem that the database consists only of the current “child” list.
Click Search>Domains>Set Domain to
Current List.
The current list acts like a full database. For
example, a Retrieve All command will
retrieve only this list; without selecting
Search Over Current List, searches will go
over it only, etc.
To reset searches to the full database:
Click Search>Domains>Reset to Full
Database.
NOTE: Set Domain to Current List remains in
effect until cancelled. If you save the form, it
will be saved with the form file and will still be
in effect when you open the form again.
Saving and restoring lists
You can save queries individually as .cfq files
or automatically when saving the form. The
old commands for saving and restoring lists (as
.cfq files) still appear on the Search menu, and
on the context menu displayed when you rightclick on a specific query. If you close a form
without having saved your queries (or other
changes), you are prompted to save or discard
changes.
On the General tab of the Preferences dialog
box, there is an option to save all queries (the
default), or only those that have been renamed.
If you select this option, there are two ways to
save a query with the form:
• Rename the query, either with the Rename
command in the context (right-click) menu,
or from the query properties dialog box
(also accessed from the context menu.)
• Mark the query with the Keep command on
the context menu. Query saved in this way
retain their standard name.
from the first. Thus, you can perform Boolean
operations on different searches.
There are two ways to integrate the results of
two searches:
Browsing to the saved list:
1. Perform a search and save the hit list.
2. Perform another search.
3. Click Search>Restore List.
The Open dialog appears.
4. Browse to the previously saved list you
want to integrate with the current hit list,
and click the Open button.
The Restore/Merge List dialog box
appears.
Figure 21.29 General preferences
Saving a hit list
Create a query and perform the search. See
“Entering and submitting a query” on page 373
and “Entering a structural query” on page 374
for more information.
1. When you have received the hit list, click
Search>Save List.
The Save As dialog appears.
2. Type a filename for the hit list, and click the
Save button.
The file consists of a list of values of the primary key of each record in the hit list. If there
is no primary key, the molecule ID is used.
To edit a saved hit list, open the text file with a
text editor such as Notepad and edit the values
you want changed.
Restoring a hit list
Once you have saved a hit list, you can perform another search and then integrate the
results from the second search with the results
Figure 21.30 The Restore/Merge List dialog box
5. Select the integration option and click OK.
• Replace—discards the current hit list and
displays the records from the hit list you
chose to open.
• Intersect—displays only those records that
appear in both the current hit list and in
ChemBioFinder & BioViz
User Guide
383
the saved hit list. This is a Boolean AND
operation.
• Subtract—displays only those records that
are in the current hit list but are not in the
saved hit list. For example, if the current
list contains records, 1, 2, 3, 4, and 5, and
the restored list contains records 4, 5, 6,
and 7, then only records 1, 2, and 3 will be
displayed. This is a Boolean NOT operation; it shows the records in the current list
that are not also in the restored list.
• Union—displays all records in either the
current list or the saved hit list. This is a
Boolean OR operation.
• Subtract from—displays only those
records that are in the saved hit list but are
not in the current hit list. This is the same
as Subtract, but with the order of the lists
reversed.
The hit lists are integrated. You can browse
and save this new hit list just as any other
hit list.
Drag and Drop list merge:
1. Perform a search and save the hit list.
2. Perform another search and save the list.
Two saved queries are shown in the figure
below:
3. Simply drag one query item in the tree on
top of another.
Restore/Merge dialog comes up allowing
you to choose the logic to be applied to the
merge: replace, intersect, subtract, union,
and subtract from.
A successful merge results in a new list.
NOTE: If you merge two lists and get an empty
result, an alert appears and the list reverts to
the previous list.
Search examples
The following are examples of searching
options. By specifying atom and bond properties, you see how to use the query functions in
Chem & Bio Draw to search the database more
effectively. All substructure search query properties recognized by ChemBioFinder 12.0 are
listed and described in “Structural Query Features” on page 483
Multiple hit lists
A detailed example of how you can use hitlist
management to perform specific, sophisticated
searches follows.
384
Queries
Chapter 21
Suppose you want to search for all compounds
in the CS_Demo database that contain a benzene substructure and have molecular weights
between 50 and 200. After you perform this
combined search, you want to find which of
these compounds do not contain a carbonnitrogen bond. By integrating hitlists, you can
perform this search.
To create the hitlist for the first part of this
search:
1. Open the CS_Demo database.
2. Create the first query by drawing benzene
in the Structure data box and entering 50200 in the Molecular Weight Data Box.
3. Search the query.
You get 75 hits.
4. Click Search>Save List.
5. Save the hitlist as benz.txt.
To create another hitlist for the second part of
the search:
1. Draw the query shown below in the Structure Data Box.
5. In the Open dialog box, open the c-n.txt file.
6. In the Restore List dialog, click the Subtract
radio button, then click OK.
The hit list is reduced to the 60 records with
compounds containing a benzene
substructure, not containing a C-N
substructure, and having molecular weights
between 50 and 200.
If you had chosen the Replace option in the last
step, then only the C-N records would be displayed. Choosing Intersect would display those
records in either list. Finally, choosing Union
would display all records from both lists.
Using atom lists
Using the text tool in Chem & Bio Draw, you can
enter in a structural query a list of possible
atom types, one of which must match in the
target compound.
If you want to search for molecules containing
a benzene ring with an ether, amine or phosphane group, a query might look like the following:
N
C
2. Search the query.
You get 103 hits.
3. Click Search>Save List.
4. Save the hit list as c-n.txt.
Integrate the two hitlists:
1. Click Search>Restore List.
2. In the Open dialog box, open the benz.txt
file.
3. In the Restore List dialog box, click the
Replace radio button, then click OK.
You return to your first list of 75 hits
4. Click Search>Restore List.
Figure 21.31 Atom list query
Atom types and bond types
To broaden or narrow a search query, you can
define the properties of the atoms and bonds in
a structural query. These properties are definable in Chem & Bio Draw Pro using the Atom
Properties and Bond Properties dialogs accessible from the Structure menu. See “Structural
Query Features” on page 483 for more information.
Suppose you want to find all molecules that
contain a non-oxygen chalcogenide bonded to
ChemBioFinder & BioViz
User Guide
385
another atom, not necessarily carbon. You also
want the bond type between the chalcogen and
the other atom to be a single or double bond.
The query, drawn in Chem & Bio Draw Pro, may
look like this:
Figure 21.32 Specifying bond and atom types in a
query
The “A” label denotes that the atom may
match any atom except hydrogen. The indicator near the bond indicates that the bond has
been defined; in this case, in the Bond Properties dialog of Chem & Bio Draw, you specified
that the bond type may be single or double,
S/D. Finally, by entering “S,Se,Te” enclosed in
brackets, you specified that one of these elements must match in the target molecules.
Searching fullerenes
A search of fullerenes can illustrate the restrictions you can place on a formula search. Suppose you want to find all fullerenes containing
20 to 80 carbon atoms, but you also do not
want to include large organic molecules.
The formula query could be:
C20-80 H0
By designating zero hydrogen atoms, you
exclude hydrocarbons from the hit list. By
clearly capitalizing the elements and spacing
the query, you avoid searching ambiguities,
386
Queries
Chapter 21
although there were no ambiguities in this
example.
Link nodes and multivalent Rs
A link node is a placeholder for zero or more
unspecified atoms. It is especially useful when
searching for targets with any of several ring
sizes, or chains substituted in particular ways
at either end. While link nodes are traditionally
divalent, ChemBioFinder 12.0 places no constraints on the upper limit of the range. Multivalent R (and A) atoms are functionally similar
to link nodes. They may be thought of as
“higher valent” link nodes.
Figure 21.33 Link nodes
The traditional representation of a link node is
CH2, but this is misleading because any atom
type can substitute for the link node. For this
reason, represents link nodes as R. R (without a
repeat count) can match any number of atoms,
including zero.
Although any atom type of a target atom
matches a link node, you can impose two
restrictions the on the link node:
• Unsaturation
• Ring topology.
Using Chem & Bio Draw's Atom Properties menu
to apply either of these properties to the link
node restricts the range of target atoms to the
specified topology. For example, specifying
the link node to be aromatic would give the
following results.
drawn in Chem & Bio Draw would look like
this:
:
Query
Results
Will hit
Figure 21.35 Structure query with two substructures
You should get five hits. Browse the hits. By
specifying the query as above, you obtain hits
such as benzyl chloride, shown below, where
the substructure units are not connected.
Will not hit
Figure 21.36 Benzyl chloride, hit by query with two
substructures
Figure 21.34 Results of a link node query
Searching more than one substructure
A substructure search may contain more than
one substructure unit. Suppose you want to
find all compounds in the CS_Demo database
which contain a benzene substructure and
another substructure unit containing chlorine
bonded to any atom. A structure query, as
The substructure units can overlap; they can
share a common atom. Examples of this overlap are shown below.
.
Figure 21.37 Overlapping substructures in the hit
list
ChemBioFinder & BioViz
User Guide
387
388
Queries
Chapter 21
22
Importing and Exporting Data
You can move data into and out of a database
if the data is in a supported file format. You
can import single files, import or export databases, or add data to an existing database.
Supported file formats
ChemBioFinder 12.0 allows you work with
individual chemical structures and reactions in
various file formats. The supported formats
are:
•
•
•
•
•
•
•
•
•
•
•
Chem & Bio Draw (cdx)
Chem & Bio Draw XML (cdxml)
Connection Table (ct)
Delimited text (csv, txt)
MDL Molfile and V3000 (mol)
MDL RXNfile and Rxn V3000 (rxn)
MDL RDFile (rdf)
MDL SDFile (sdf)
MDL Sketch (skc)
MDL Graphic (tgf)
SMD 4.2 (smd)
Supported formats for output files only:
•
•
•
•
Bitmap (bmp)
XML (cfxml)
Encapsulated Postscript (eps)
GIF (gif)
• Microsoft Word (doc)
• TIFF (tif)
• Windows metafile (wmf)
For information on the .cdx, .ct, and .cdxml file
formats, see the Chem & Bio Draw Users
Guide. For information on MDL file formats,
see http://www.mdli.com/ (A document describing the file formats is available in PDF format.)
Importing data
ChemBioFinder 12.0 allows you to import
Chem & Bio Draw structures, Structure Data
files (SDFiles) and Reaction Data files
(RDFiles) directly into a database. In addition,
you can import text files that are comma or tab
delimited.
Because ChemFinder 12.0 uses the Access
(Jet) database standard, names of fields, controls, and objects must conform to Access
rules. These are:
• May be up to 64 characters long.
• May include any combination of letters,
numbers, spaces, and special characters
except a period (.), an exclamation point (!),
an accent grave (`), or brackets ([ ]).
• Must not begin with leading spaces.
• Must not include control characters (ASCII
values 0 through 31).
ChemBioFinder & BioViz
User Guide
389
• Must not include a double quotation mark
(“) in table, view, or stored procedure
names.
Importing structures
ChemBioFinder 12.0 imports structure files
directly into a database. You can choose to
replace the existing records, append new
records, or merge the data, eliminating duplicates.
The general procedure for importing structures
is:
1. Use the File>Import submenu, to choose the
type of structure file to import. The Open
Chemical Structures dialog box appears.
2. Browse to a folder containing structures.
3. Select a file or files (using Ctrl+click or
Shift+click) and click the Open button. The
Data Import dialog box appears.
4. Click the File button, and select a database
to import into.
NOTE: You can also type in a name to create a
new database file.
5. Choose the type of import: Overwrite,
Append, or Merge. If you have selected
Merge, click the Merge tab and choose the
matching field, match options, and logging
options.
6. Select the fields to be imported with the
check boxes.
•
•
•
390
Optional: Double-click the field name to
change the name of the field, field type,
and width in the Data Field Import dialog
box.
Optional: Click the Logging tab to change
details of the log file.
Optional: Click the Form Style tab to
select the style of boxes that will be created for new fields.
Importing and Exporting Data
Chapter 22
•
Optional: Click the Advanced tab to set
the Advanced options. Import only part of
a file by setting the starting point. You
may indicate a starting point by line number, byte number, or record number. Also,
select the version of the ChemBioFinder
database to be created. Versions back to
7.0 are supported. In addition, import
structures only by selecting the check box
and enter duplicate reagent values by
checking the Store redundant reagents
check box.
NOTE: In SD and RD files, reagents and
catalysts are specified in each record.
ChemBioFinder 12.0 stores them in subtables.
Thus, if the same reagent appears in more than
one record, ChemBioFinder 12.0 only needs to
store it once. You can over-ride this default with
the check box.
7. When you have finished selecting your
options, click the Import button. The structures are imported to the specified database.
Structure and reaction
ChemBioFinder 12.0 allows you to import
Structure Data files (SDFiles) and Reaction
Data files (RDFiles) directly into a database.
Since these files contain both structures and
data, ChemBioFinder 12.0 creates fields in the
database to accommodate the incoming data.
In RDFiles, incoming data may be hierarchical
and complex. When loading RDFiles, ChemBioFinder 12.0 converts the data to a relational
form, creating new tables as necessary and
generating linking data.
NOTE: When importing RD files, boxes and
subforms are created and positioned automatically.
If you have a blank form when you import,
ChemBioFinder 12.0 creates boxes on the
main form. If you have a form with boxes
when you import, new boxes are created on
tabbed forms.
You can import with a form linked to a database, a blank form, or no form. If you import
with no form, ChemBioFinder 12.0 creates a
new form. Selections you make on the Form
Style tab of the Data Import dialog box determine what the form will look like.
To import structure and reaction data files:
To interrupt the scan, press the Esc key. A
message box appears to confirm whether you
really want to stop. The scan continues until
you click Yes.
To abort the scan, click Stop scanning.
1. Use the File>Import submenu, to choose the
type of structure file to import. The Open
dialog box appears.
2. Choose the file to import and click the
Open. The Data Import dialog box appears.
During the import, ChemBioFinder 12.0 creates a log file of the actions taken. The log file
(.log) is a text file that is created alongside the
input file and overwrites any previous log file.
The log records data of your choice form the
following options during the import.
NOTE: You should let the scan go to completion so that all needed fields are created in the
database before loading.
Using log files
• Errors: Errors and warnings
• General data: Information about the input
file and import process
• Records processed: Logs an entry for each
record of the input file
• Structures registered: Logs an entry for
each structure stored in the database
• Data registered: Shows each data item
stored in the database
• Database schema: Shows input fields found
and columns generated
The Import dialog box scans the file to determine what data fields are present and how
much space to allow for them in the database.
The number of records scanned is shown in the
status bar. If the input file is large, the scan
may take a while.
The log file for an RDFile import additionally
presents an overview of the data table hierarchy within the RDFile.
You can choose whether to create the log file
or not. If you choose to create the log file, you
can save it with a different name or append to
an existing log file.
ChemBioFinder & BioViz
User Guide
391
Importing from a specified location
You can start an import from an arbitrary location in an SDFile or RDFile, such as a byte or
line number.
To set the location from which to import:
1. Click the Advanced tab of the Date Import
dialog box.
2. Select the appropriate options.
Reading a structure
In addition to importing, ChemBioFinder 12.0
can read files of any of the supported structural
formats. For example, if you have structures
stored in Chem & Bio Draw format, you can
open them directly from ChemBioFinder 12.0
without having to import or redraw them.
To read a structure from a file into a structure
box:
1. Right-click in the structure box, and click
the Read Structure context menu command.
The Open dialog box appears.
2. Choose the file to read.
3. Click the Open. The structure is read into
the structure box. The database is not
affected by this operation until you choose
Commit Changes or move off of the record.
Drag and drop
You can drag certain types of files from the
Windows Explorer or Desktop onto ChemBioFinder 12.0. The following table summarizes
the ChemBioFinder 12.0 Drag and Drop
options.
Table 24:
To start from
Click
the beginning of the
SDFile or RDFile
beginning.
a specified line
number
line and type the line
number.
a specified byte
number
byte and type the
byte number.
a specified record
record and type the
record number.
3. Click Import.
392
Importing and Exporting Data
Chapter 22
type of file
Structure
supported file
types
•
•
•
•
CDX
SKC
MOL
MST
comments
Must be dropped into
a structure box.
To import text records into a new database:
type of file
Graphic
Form
supported file
types
•
•
•
•
•
•
WMF
EMF
BMP
GIF
PNG
TIF
• CFW
comments
Must be dropped into
a picture box.
Does not need to be
dropped onto an
existing form.
Multiple files can be dropped at once, but you
cannot mix types (as defined in column 1 of
the table). If several structure or graphic files
are dropped at once, they are loaded into successive ChemBioFinder 12.0 records. If only
one is dropped, you are asked if you wish to
append the structure/graphic in a new record or
overwrite the existing record. If more than five
structures/graphics are dropped, an alert will
ask you if you wish to proceed.
Dropping one or more form files opens the
forms, without affecting the current form and
database.
Importing text
You can import comma or tab delimited text
files. The Import Delimited Text command
uses the same dialog and has most of the same
features as Import SDFile. Delimited text (DT)
differs from SD files in that:
• DT files cannot contain structures.
• DT files are not as well defined, and require
interpretation in order to determine field
names and delimiter type.
1. Open a new, blank form.
2. Click the File>File Import>Delimited Text
menu command.
3. In the File Open dialog, browse to select the
input file.
• The input file is scanned to determine the
field delimiter. If the file extension is “.csv,”
the delimiter is taken to be comma. If the
extension is “.txt,” the first few lines of the
file are examined for the presence of commas or tabs. If one or the other is found, it is
taken as the delimiter. If not, an alert is presented.
• This alert will appear in two cases:
•
The input file contains only a single column.
The alert can be ignored (click OK).
• The input file has some delimiter between
fields other than tab or comma.
In this case you must specify the delimiter
using the File Export dialog box.
To specify the delimiter using the Role Export
dialog box:
1. Click Cancel to dismiss the alert and abort
the import.
2. Open a form containing data, and retrieve a
small hit list.
3. Click the File>Export>Other menu command.
The File Export dialog box appears.
4. Click the Text Options tab.
5. Choose the Other option, and specify a
delimiter.
6. Click the Export button to save the choice
(and carry out an export)
ChemBioFinder & BioViz
User Guide
393
7. Go back to step 1 of the import procedure to
begin the import again.
TIP: Once you have specified a delimiter, it
will be remembered and you will not have to
repeat this operation.
The input file scan also determines the names
and types of the data fields in the input file.
Field names must appear in the first line of the
file, in the correct order, separated by the same
delimiter as the data items. Field types are
determined by examining all the data in each
column, using the same rules as for SD import:
if all items in one column are integers, then the
field type is set to integer, and so on. Widths of
text fields are set to accommodate the largest
item in the file.
Exporting data
You can create a new SDFile, RDFile, ASCII
text, or MS Word file by exporting records
from an existing database. Text files can be
saved in text (*.txt) format, or in the Comma
Separated Value (*.csv) format readable by
most spreadsheets. When you export a file, all
records in the current hit list are exported. You
can include or exclude fields to be exported
from a checklist.
The Data Export dialog box is similar to the
Data Import dialog box. It gives you options
for file naming and file type selection, and lets
you select which fields will be exported. If you
save to an existing file, you have the option to
replace or append the records.
The Text Options tab of the dialog box contains options relevant to both text file export
and structured text export. It also has an option
394
Importing and Exporting Data
Chapter 22
(Prefix output filenames) relevant to Oracle
subform data, and an option to select only the
fields on the current tab (for tabbed ChemBioFinder 12.0 forms).
To export a file:
1. Use the File>Export submenu to select the
output file type.
The Data Export dialog box appears.
2. Type a name and path for the file, or click
the File button and browse to an existing
file.
3. Select/deselect the fields you want to
export.
4. Click the Text Options tab and choose
appropriate options.
NOTE: Choosing Comma delimited does not
automatically set the file type. Text files (*.txt)
may be either tab delimited or comma
delimited. If you want to export in the Comma
Separated Value (*.csv) format, you must name
your file accordingly–either by typing the name
or selecting the file type from the Save As dialog
box.
5. Click the Export button.
The file is exported.
Saving structures
Saving structures is similar to exporting them,
without the fuss.
To save the structure on display:
1. Right-click in the structure data box, and
click the Save Structure context menu command.
The Save As dialog box appears.
2. Choose the destination directory.
3. Type the file name and choose a file format.
4. Click the Save.
The structure is saved to the indicated file. You
can read these files with any application that
supports the specified file format.
NOTE: To save most of the file types listed
above, you must have ChemDraw ActiveX Control Pro installed.
Using copy-paste with structures
You can copy structures and paste them into
Chem & Bio Draw or ISIS/Draw. You can also
use the Copy As command to copy the structure
as a text string.
The structure Copy As command has three
options.
• The Name command invokes the CS
Struct>Name ™ utility. Struct>Name generates systematic chemical names with
proper CIP stereochemistry descriptors.
• The SMILES command creates a SMILES
string. A SMILES string is a standard way
to describe a chemical structure in a line of
text. Several software packages use
SMILES strings as a way to enter and store
chemical structure information.
• The InChI™ command invokes the
CambridgeSoft implementation of the
IUPAC InChI™ algorithm. The InChI™
algorithm takes a chemical structure and
converts it into an alphanumeric string. A
key aspect of the InChI™ algorithm is that
the generated string is independent of the
way that a structure is drawn, producing a
consistent alphanumeric representation of
different structural representations of the
same structural formula (canonicalization).
NOTE: InChI™ is a registered trademark of
the International Union of Pure and Applied
Chemistry. InChI™ Material in
ChemBioFinder 12.0 is © IUPAC 2008 .
All three commands place the data on the Clipboard, allowing it to be copied into other applications.
To copy a structure as a name or InChI™
string:
1. Click in the Structure box to select it.
2. Right-click, and click the Copy As>Name or
Copy As>InChI submenu command.
3. Paste the data into the other application
using Ctrl+V or the Edit>Paste menu command.
Exporting an ASCII file
Delimited text files may be the most universal
file format used by non-chemical applications.
In a delimited text file, each line represents a
record, and all fields in the record are listed in
order from left to right, separated by some
character such as a tab or a comma. Individual
records are separated by carriage returns.
ChemBioFinder 12.0 allows you to include a
header line at the start of the file that lists the
names of all of the fields. It also allows you to
append to, or overwrite, existing text files.
You can import a delimited text file saved by
ChemBioFinder 12.0 into many other applications, including spreadsheets and external database systems. Choose the .csv file format to
ChemBioFinder & BioViz
User Guide
395
export to spreadsheets, and the .txt format for
general export.
NOTE: In delimited text files, structures are
automatically exported as SMILES strings.
Exporting a Word file
The export to MS Word option is similar to the
other export options, however a couple of
points are worth noting:
• Export to Word is much slower than to
other formats. For this reason, you should
probably limit the use of this option to relatively short hitlists.
• You can speed up the export by not exporting the structure field.
• Structures are exported as OLE objects, and
can be edited in Word with the Chem & Bio
Draw Control.
• If you should, by accident, begin exporting
a large database, you can terminate the
export by bringing ChemBioFinder 12.0 to
the front and pressing the Esc key.
Exporting to SDFile
When you export to SDFile, you are allowed to
export subform fields. Each subform field is
exported to a separate record in the SDFile, but
separate subform records are concatenated into
a single multi-line text block.
396
Importing and Exporting Data
Chapter 22
To export subforms:
1. Click the File>Export>SDFile menu command.
The Data Export dialog box appears.
2. Click the Text Options tab, and select the
Export subform data check box.
3. Return to the Export tab. In the Field column of the Data Fields table, all subform
fields now appear with checks in the check
box next to the field name. Deselect any
subform fields you do not wish to export
(and select those main form fields you do
wish to export).
4. Click the Export button.
NOTE: Re-importing a file of this type will not
regenerate the original database! It will bring
back the data, but not in the subtables and subforms you started with. To do this, export to
cfxml.
When exporting to SDFile, you may append to,
or overwrite, existing SD files. This option is
only available for SD files and delimited text
exports.
Exporting to STATISTICA
To export data to STATISTICA:
1. Create or open a database.
2. Click File > Export > To STATISTICA.
The Data Export dialog box appears:
TISTICA can be used to analyse the
exported data.
NOTE: Structure fields are not exported
because STATISTICA can not process structure
fields.
Printing
You can print out all or part of your database.
To print a database:
NOTE: The preceding dialog box will appear
only if STATISTICA is installed.
3. Specify a name for the output .xml file to
which data is to be exported.
4. Click the Text Options tab. The following
dialog box appears:
1. Before printing, decide if you want to print
a table view or a form view. Set ChemBioFinder 12.0 to the appropriate view.
2. Click the File>Print Setup menu command.
3. In the Print Setup dialog box, set the
printer, paper size (default: US Letter), and
page orientation desired. Click OK when
you have finished.
TIP: Settings in this dialog box affect the Page
Setup, so it’s best to start here.
5. Set the text file export options based on the
type of data you need to export.
6. Click the Export button. Once data is
exported, STATISTICA is launched and the
data is imported into STATISTICA. Thereafter, the analysis tools available in STA-
4. Click the File>Page Setup menu command.
5. In the Page Setup dialog box, set the margins and units (cm/inch), layout, and other
options.
• The Header option prints the file path at
the top of the page.
• The Footer option prints the date, time and
record number at the bottom of the page.
Click OK when you have finished.
6. Click the File>Print Preview menu command to check the settings.
7. Click the File>Print menu command or the
printer icon on the main tool bar.
The Print dialog box appears.
ChemBioFinder & BioViz
User Guide
397
8. Set the print range and number of copies.
You may also select a different printer than
the default.
NOTE: ChemBioFinder 12.0 defaults to
printing a single page. This is indicated by the
option labeled “Selection”. If, for example, you
are printing in Form view and you set the layout
in Page Setup to three per page, you will print
398
Importing and Exporting Data
Chapter 22
the record selected and the next two records. If
your layout is one per page (the default), you
will print only the selected record. Note also
that if a subform is selected, the entire record
with the subform is printed.
9. Click OK when you have finished.
23
Relational Data and Subforms
Subforms allow you to work with multiple data
tables in a relational database. You should be
familiar with working with ChemBioFinder
12.0 forms and databases before proceeding to
subforms.
Access relational data
A subform is a special box within a form that
behaves like a separate form file. A subform is
used to display information stored within a
database, but it usually displays data from a
different database (or different table within the
same database) than the main form. A subform
is usually linked to the main form, so that
retrieval of data in the main form also retrieves
related records in the subform.
Like other types of boxes, you can move select
and resize a subform on the main form. However, you cannot select it by clicking inside it.
You must click the title bar. When you click
inside a subform, you activate the miniature
form inside the box and can work within it.
Below are examples of subform use:
• You have data that is associated in a
“one-to-many” relationship. For example,
you want to view a chemical structure
together with its physical properties, stored
in a separate table.
• You are running a stockroom and you want
to store package sizes and prices in the
same place because they are related. Each
chemical may be available in lots of package sizes, and you wouldn’t want to re-draw
the structure every time you added a new
package. You can use a subform so the
physical property information is entered
once in the main form and the package sizes
and prices are entered many times in the
subform.
By linking these two data tables with a
linking field you can make these tables
relational; one table can interact with the
other. The contents of a linking field are not
important, as long as they are different for
each record in the main form. Various
forms of ID numbers are often used as
linking fields. As you browse through the
main form, corresponding records in the
subform appear.
Creating a subform
You create a subform, place form objects on it,
and connect the subform to a database just as
you do a regular form. For detailed information
on these procedures, see “Forms” on page 311.
For users of version 8.0 and earlier
Creating and linking subforms in ChemBioFinder 12.0 was simplified in version 8.5.
ChemBioFinder & BioViz
User Guide
399
Users of previous versions should note the following changes:
• There is now a single dialog box which sets
properties of both the subform box and its
subform. You set all of the details in one
place, in a single operation.
• In the new dialog box, the Database, Table,
and Field tabs reflect the data source of the
subform, not the parent form. The database
tree control in the dialog box also shows
subform data source. You can use the
Explorer window to display the tree control
of the parent data source, if they are different.
As before, the Form tab shows properties of
the subform, while the Subform tab shows
properties of the box and the linkage
between the subform and its parent.
• When creating a new subform, you get the
same dialog box by clicking within the subform as by clicking on the box header.
• For convenience, the dialog box comes up
automatically whenever you create a new
subform box.
• After you have created a subform, the subform tool is deselected. This prevents the
frequent mistake of drawing a subform box,
then trying to draw a data box within it and
getting another subform.
Creating a subform manually
To create a subform:
1. Start ChemBioFinder 12.0 and open or create a form.
The form should have at least one data box,
and be linked to an existing database.
2. Click the Subform button on the Form toolbar.
400
Relational Data and Subforms
Chapter 23
3. Click somewhere in the form and drag to
create a data box.
When you release the mouse button the
Subform Properties dialog box appears.
By default, newly created subforms are associated with the same database as the main form.
To use a different database as the data source
for the subform:
1. Click the Open Database button.
The Open dialog box appears.
2. Choose a database and click the Open button.
3. Select the table to be linked (in this case,
Synonyms).
4. Click the Form tab. Select the Generate form
check box. If you want to set the style, click
the Style button. See “Creating forms automatically” on page 311 for details on Form
style.
5. Click the Subform tab. The tab should contain reasonable data (Link To SYNONYMS
(subform) = SYN_ID, Title = Synonyms)
based on the choices made so far.
6. Choose Mol_ID from the Link from MOLTABLE (main form) drop-down menu.
NOTE: To use the subform relationally to the
main form, the two forms must have one field in
common. This Linking Field must share the
same data type (text, integer, real) as a field in
the main form. The fields do not need to have
the same name.
7. Modify box properties as desired. You may
want to change the box title, font, or presence of scrollbars.
8. Click OK. The new subform appears showing one synonym.
9. Optional: double-click in the subform to
switch it to table view.
The Subform is connected to the database
you chose.
In this example, when a record is retrieved in
the main form, its Molname is used to search
the Synonym field of the Synonyms table of
CS_Demo. The subform displays the hits from
this search.
Subform generator
Automatic subform generation is part of automatic form generation (see “Creating forms
automatically” on page 311).
To generate a subform:
1. Right-click on a blank area of the current
form and click the Data Source... context
menu command.
The Form Properties dialog box appears.
2. In the Form Properties dialog box, select
the Form tab.
3. Select the Generate form check box, then
click the Style... button.
The Form Generation dialog box appears.
4. Click the Subforms button.
The Subform Generation dialog box
appears.
5. For each subform you want to include:
a. Choose a field in the Link from box to
specify the linking field of the parent
form.
b. Expand the table you want to display in
the subform in the Link to box, and
select the linking field of the subform.
c. Click the Add button to append the
selected subform to the list being generated.
6. When you have added all subform links,
click OK to close the dialog box and return
to the Form Generation dialog.
Change existing subform layout
You can use the Form Generator to automatically change the overall layout of an existing
subform.
To change the layout of an existing subform:
1. Right-click on the title bar of the subform
data box and click the Properties... context
menu command.
The Box Properties dialog box appears.
2. In the Box Properties dialog box, select the
Form tab.
3. Select the Generate form check box, then
click the Style... button.
The Form Generation dialog box appears.
In the left panel, all of the Fields are
selected by default.
4. Deselect those fields in the Choose fields to
be included section that you want to
exclude from the form.
5. In the Form style section, select the form
options you want. For a detailed description
of the options, see “Creating forms automatically” on page 311.
6. Click OK.
7. Click the Properties dialog box.
A warning dialog box appears allowing you
to create a new form or replace the existing
form. Click No to create a new form, Yes to
replace the existing form.
The subform is automatically changed.
Working with subforms
You must select a subform to work with it. The
subform title bar is highlighted when the subform is selected. After a subform is selected,
ChemBioFinder & BioViz
User Guide
401
the toolbars affect the subform. You can use
the Record tools to browse the subform and
add records.
To select a subform:
Click anywhere in the subform.
To return to the main form:
Click the main form.
To select a subform box:
With the selection tool, click in the title bar.
Searching a subform
You search a subform the same way you
search the main form. You can search a subform and the main form simultaneously.
To search a subform:
1. Click the Search>Enter Query menu command to clear the subform and main form.
main form, it may be more convenient to view
the subform as a table while you browse
through the main form. The table view shows
you the complete list of related records for
each entry in the main form.
To display a subform in Table view:
• Select the subform and do one of the following:
• Double-click on a record in the table.
• Click the View>Data Table>In Current
Window menu command.
• Type Ctrl+T
• Click the Switch to Table tool.
A table view of the records in the subform
appears.
To return to the Form view, repeat the above
action.
Subform plots
TIP: You can also click the Enter Query icon
on the Search Toolbar or type Ctrl+F.
2. Enter a query in the subform data box. See
“Queries” on page 357 for details on entering queries.
3. Click the Search>Find menu command.
If the subform is linked to the main form
the hit list contains the main form records
related to the matches in the subform
search. You can browse and save this hit list
just as you would a hit list from a main
form search.
If the subform is not linked to the main form, it
behaves independently of the main form and is
searched separately.
Viewing subform data in a table
If you have more than one record in the subform associated with a single record in the
402
Relational Data and Subforms
Chapter 23
A third type of view is the plot view. You can
use BioViz to create a 1-D, 2-D, or histogram
plot of any numerical field(s) of the data table
connected to the subform.
To create a subform plot:
You must be working with a form that has a
subform with at least one column of
numeric data.
1. Click the subform box to activate it.
2. Click the View>Subform Plot View toggle.
The BioViz Plot Properties dialog box
appears.
3. Set up the plot. See “Creating a plot” on
page 425 for more information.
NOTE: For 2-D plots, both numeric fields must
be in the data table associated with the subform
data box.
The plot appears in the subform data box.
Subform plots have less functionality than regular BioViz plots. While mousing over a point
will highlight it, selection, filtering, and coloring are disabled. Since selection is disabled,
subform plots are always in “zoom on drag”
mode.
Use Control+W to toggle between the form,
table, and plot views. The Switch to Table tool
only toggles between form and table, as does
double-clicking in the subform.
TIP: The subform remains selected until you
click the main form, so you can only browse in
the subform. If a plot is displayed, browsing
does nothing.
If you toggle the main form to table view when
a subform plot is displayed, the plot is displayed as a graphic rather than an active plot.
Using scripts in subforms
You can specify a CAL script to be executed
when you click an item in a subform in table
view. The subform can then be used as a list
selection box. The script can use CAL commands to retrieve the clicked item, and perform
an action on it. For more information about
CAL, see “CAL Commands” on page 499.
To specify a CAL script:
1. Right-click on the subform header and click
the Properties... context menu command.
The Subform Properties dialog box
appears.
2. In the Table script box, type the name of a
CAL script or click the Edit button and
select a script.
3. Click OK.
In Table view, the entries are blue and
underlined indicating that they are hot
linked to a script.
4. Click any of the hot links to run the script.
ChemBioFinder & BioViz
User Guide
403
404
Relational Data and Subforms
Chapter 23
24
Compound Profiles
Compound Profiles, a way of visually comparing and ranking structures based on values of
selected properties.
A compound profile is a graph, or, more typically, a series of graphs, each of which plots
the value of a numerical field in the database
on a vertical bar color-coded to show regions
of “cost”, or undesirability. These regions are
defined by a cost profile associated with the
field. In the profile, costs are normalized to
score between 0 and 1, where the ideal is
assigned the value of zero, and the slope of the
deviation to maximum (1) is user-defined.
NOTE: The function is a normalizing linear
spline.
Figure 24.1 IC50 profile.
The cost profile is designed by the user to
reflect their opinion of what constitutes a
“good value” for a property. The user can
adjust the cost profile to reflect how unhappy
they would be when a compound deviates from
the ideal value by changing the range of values
at zero and the slope of the line to one.
For example, a user might want a drug candidate to have a good solubility (in units of
ChemBioFinder & BioViz
User Guide
405
mg/ml) and good biological activity (in units
of nm). They might be willing to sacrifice
some activity to get better solubility, so the
cost function for solubility would be adjusted
to penalize any deviation from some “ideal”
range more severely than the corresponding
cost function for activity.
The default display preference is to have white
regions in the bars represent ideal values,
darker regions increasing deviation from the
ideal.
The normalization function permits properties
of different types to be compared. A score, the
total deviation from “ideal” of all fields, is displayed. Each property can be assigned a weight
to adjust its effect on the overall calculation.
The score is the same for a given compound
regardless of whether or not you’ve done a
sort, or where the compound appears within a
hitlist. A “bad” compound has a high score.
Figure 24.2 A compound profile for MW, LogP, and
IC50.
A compound profile is useful as a visual indication of the “quality” of each compound. As
such, it is most useful in table view, where you
can see and compare several profiles at once.
The highest benefit comes from using profiles
in sort/search operations. You can pose one
compound as the query, and then sort the
remaining ones by deviation from that query.
Creating a compound profile
Profiles are displayed on the form in a special
data box, created with the Profile tool.
To create a Profile box:
The database connected to the form or
subform you are working with must have at
least one numeric field.
NOTE: You can also include structure field in
profile.
score
1. Click the Profile tool on the Form toolbar.
406
Compound Profiles
Chapter 24
2. Drag a box on the form.
The Profile Wizard appears then click
Next.
• You may edit the Value Range.
The default display is the actual low/high
values for the first 1000 records in the
database.
• You may choose a log scale, if no part of
the Value Range is negative.
• You may weigh this profile relative to
other profiles; where 100 is important, 0 is
not.
4. On the Profile Choose page, choose a cost
profile.
Define Field dialog is displayed.
Choosing from this gallery is just for
convenience. Any pattern you choose can
be later modified to any other shape.
TIP: As you click each profile, a line of
descriptive comments is displayed below the
gallery window, to aid your selection.
3. On the Field page, choose a numeric field
from the drop-down menu of Source.
• You may edit the name automatically
entered in the Display As text box.
5. On the Cost Profile page, you may edit
your profile. See “To change a cost profile:”
on page 409 for details.
ChemBioFinder & BioViz
User Guide
407
6. The Profile page of the wizard has an “add
another field” check box that changes the
Finish button to a Next button. Click Next to
repeat the procedure for each profile you
want to add. When you have added all of
your profiles, click the Finish button.
The profiles are displayed in the data box.
Editing a compound profile
To add a new profile:
Right-click in the editor window, then click
the Add Field context menu command.
To delete a profile:
1. On the Profile tab, click one of the profiles
to select it.
2. Right-click in the editor window, then click
the <Move Left or >Move Right context menu
command.
1. On the Profile tab, click one of the profiles
to select it.
2. Right-click in the editor window, then click
the Remove Field context menu command.
To change the order of the profiles:
408
Compound Profiles
Chapter 24
You can edit any of the characteristics of a
compound profile with the Compound Profile
Editor.
To edit a profile:
Double-click in the profile data box.
The Compound Profile Editor appears.
To change the field associated with a profile:
1. On the Profile tab, click one of the profiles
to select it.
2. Click the Field tab. Change the Source with
the drop-down menu. Change any of the
other variables as required.
3. Click the Cost Profile tab and select a new
profile.
NOTE: You must select a new profile when you
change the source field. If you forget, you will
be prompted with an error message.
4. Click OK.
The cost profile is displayed, and may be
edited.
5. Click OK to complete the change.
To change a cost profile:
1. On the Profile tab, click one of the profiles
to select it, then click the Cost Profile tab.
ideal value
3. To add a new inflection point, right click on
the line segment where you want the new
point, and click the Add point here context
menu command.
4. To delete a point, right-click on the point
and click the Remove point context menu
command.
5. To change the ideal value, drag the pink
dashed line on the grid to a new location.
6. To choose a different template, right-click
anywhere in the editor window, click the
Choose context menu command, and select
a new template.
7. Click OK to save changes and exit the editor, or Cancel to exit without saving.
Display preferences
You can change display characteristics of a
profile with the Profile Display Preferences
dialog box. Changes you make apply only to a
selected profile box, unless you choose to reset
the defaults.
To change the profile display preferences:
Figure 24.3 Cost profile, showing the drag points
and ideal value line.
2. To change an inflection point, drag it to a
new location.
As you drag, the X and Y coordinates of the
point are displayed on the grid.
TIP: You cannot drag past a neighboring
point.
1. Right-click a profile box and click the Compound Profile > Preferences... context menu
command.
The Profile Display Preferences dialog box
appears.
2. To change the base color of the cost band
(default = red), select a primary color in the
Cost Shading Color section.
3. To reverse the “polarity” of the cost band,
deselect the Ideal = white check box. When
checked, light shades are “good”, dark are
“bad”; when unchecked, the reverse is true.
4. To change the color of the value marks and
the lines between them, click the Values
button and select a color from the color
picker.
ChemBioFinder & BioViz
User Guide
409
5. To change the color of range labels, click
the Labels color button and select a color
from the color picker.
6. To turn off the range labels (to the right of
the cost band), deselect the Labels check
box.
7. To use the current settings as the defaults
for all subsequent profile creations, click
the Use As Defaults button.
8. When you have finished editing the settings, click OK to save the changes, or Cancel to discard.
3. For easiest comparison, switch to Table
View.
score
dist
Search/sort
You get the most advantageous use of profiles
in comparing compounds by using the
search/sort function. Select one compound as
your base (for example an “ideal” compound
with an overall score of zero), then sort the
database by increasing deviation from that
score.
To use Search/Sort to compare profiles:
You must be in Form View to begin this
procedure.
1. Browse to the compound you want to use as
your base.
2. Right-click in the Profile data box, then
click the Compound Profile>Search/Sort>Sort relative to current
context menu command.
ChemBioFinder 12.0 sorts the database.
Figure 24.4 Profiles in the table view
The dist value in the profile (displayed in red at
the bottom of the chart) changes when you
sort. Before sorting, it matches the score value.
After sorting, it displays the deviation of that
compound from the base. If you sort relative to
a compound, then that compound gets dist = 0
since it defines the reference point. The dist
value for other compounds will increase as
they become less similar to the base. You can
also sort relative to the ideal value. In this case,
the dist value for each compound is the same
as its score, and the records are ordered on that
basis.
TIP: To reset the database, right-click in the
Mol_ID field and click the Sort Column>Ascending context menu command.
Example:
Do the following:
410
Compound Profiles
Chapter 24
1. In the CS Demo database, create a profile
with one field, Molweight, and a cost profile such that values below 100 are ideal,
and above 100 increasingly bad.
2. Browse through the compounds.
Benzene (mw 78) falls in the ideal region,
so it has a cost of zero and a score of zero.
Buckyball fullerene (mw 800+) falls way
outside the ideal, so it has a high cost and a
score of 1.
3. Right-click in the profile box.
4. Click the Compound Profile>Search/Sort>Sort relative to ideal context menu command.
5. Click the Switch to Table icon to make it
easier to compare the profiles.
The compounds are ordered by dist value
from 0.00 to 1.00. Note that the score and
dist values are the same.
6. Browse to bromobenzene (mw 157).
The score for this compound is not ideal. It
will be approximately 0.1, depending on
how you set the profile.
TIP: You can sort by Molname or MW to find
the compound more easily.
7. Click the Switch to Table icon again to
return to form view.
8. Right-click in the Profile data box, then
click the Compound Profile>Search/Sort>Sort relative to current
context menu command.
9. Switch back to Table View are browse the
results.
Bromobenzene is at the top of the list.
Other compounds with similar scores
follow. Note that the score and dist values
are no longer equal.
Customizing
The gallery of cost profile templates shown in
the Cost Profile Chooser dialog box was
designed to help you get started. Some are
based on user experience, other chosen to provide the most common cost profile patterns. As
you work with the compound profiler, you will
develop your own templates and may want to
substitute them in the chooser.
The templates are taken from files stored in the
...\ChemBioFinder\system\profiles\ folder. The
files have a CPX extension, and the name of
each file is the name given to the template. The
Cost Profile Chooser displays all files in this
directory having the CPX extension. The internal format is XML, readable in Notepad.
To remove a template from the chooser, delete
the corresponding file, or move it to another
location, or change its extension.
To add or modify a template:
1. Double-click in the profile data box to open
the Profile Editor, then click the Cost Profile
tab.
2. Edit the profile until it looks the way you
want.
3. Right-click in the edit window, then click
the Save... context menu command.
4. When prompted, enter a line of descriptive
comments to be displayed underneath the
chooser window, and click OK.
5. Type the name you want to appear in the
chooser, and click the Save button.
ChemBioFinder & BioViz
User Guide
411
412
Compound Profiles
Chapter 24
25
ChemBioFinder/Oracle
Users familiar with ChemBioFinder 12.0 will
find that, for the most part, ChemBioFinder/Oracle operates the same way. You
should be able to open a database, browse,
search, register, load and so forth, without worrying about what sort of database is on the
back end. In practice, however, there are several visible differences and a lot of invisible
ones.
When you open an Oracle database in ChemBioFinder/Oracle, you enter a new body of code
which connects directly to Oracle, and carries
out all searches and transactions on the server.
This new mode of operation requires a different underlying technology, based on Microsoft
ActiveX Data Objects, and a different philosophy in some aspects of usage, such as the handling of lists, and new features, such as index
management. All of these are described in this
document.
In ChemBioFinder/Oracle:
• Searches are carried out on the server,
including structure searches.
• Search results are automatically deposited
directly into tables in the Oracle database.
• Hitlists are not saved in files, but to other
tables in Oracle.
• Saved lists can be annotated, and on restore
can be selected from a pick-list directory.
• When working with large databases, you
can choose a new mechanism which eliminates certain slow operations associated
with large record sets (e.g., Move Last).
This is a user choice because there are
trade-offs involved.
• You cannot create an Oracle database, but if
you have the privileges you can create a
table within one. This causes import operations to work somewhat differently.
• To improve performance, you can create
indexes on selected columns.
Other more subtle differences are noted in the
sections below.
Structure search speed is very fast in ChemBioFinder. The fast speed comes from two factors: improvement of the SQL so that hits are
added much faster to the hitlist table, and an
optimization of certain frequent operations and
improved screening efficiency that improves
structure search speed in all CambridgeSoft
products.
Setup
Before you can make use of the ChemBioFinder/Oracle, your machine must be configured as an Oracle client. If you are already a
user of the CS Oracle Cartridge, you are probably all set. If not, you will need to enlist the
ChemBioFinder & BioViz
User Guide
413
help of an Oracle administrator to set up the
server and set you up as a client.
For ChemBioFinder 12.0 installation instructions, see the readme.txt included on the distribution media.
Ideally, ChemBioFinder/Oracle should access
any existing Oracle database in any format. In
practice, there are some limitations. See “Presetup procedures” on page 541 for notes and
recommendations about preparing an Oracle
database for use with ChemBioFinder/Oracle.
Opening an Oracle database
To open an Oracle database:
1. Right-click in the form and click the Data
Source... context menu command to open
the Database tab of the Box Properties dialog box.
2. Click the Oracle Database button.
The CS Oracle Connection dialog opens.
NOTE: The Oracle Database button is
available to any user. There is no check to see
whether the machine is a valid Oracle client.
3. Enter values for Host name, User name, and
Password — the same values you use to log
in from any Oracle client. OR:
• Choose a name from the drop-down list of
recently-used items. When you choose an
item from this list, it automatically fills in
the user name, and the password if Save
password was checked when the item was
created.
NOTE: The first time you bring up the Oracle
Connection dialog box there is no list of recent
items, so ChemBioFinder 12.0 offers to create
one for you. If you accept, it generates a list of
all available hosts, as found in the file
tnsnames.ora created during Oracle client
configuration.
• The database is opened and the list of tables
displayed.
NOTE: The list of tables shown in the tree
consists of all tables and views owned by the
current user, plus those to which the user has
been granted certain privileges. To see the
details, you can turn on SQL tracing while a
database is being opened.
4. Proceed as you would for any ChemBioFinder 12.0 database: click to select the
table you want to display, set other desired
options, and check the box on the Form tab
if you want to generate a form automatically.
The Oracle tab of the dialog, described in
“Setting Oracle preferences” on page 417.
The features on this tab are mainly for
advanced users and do not require
adjustment.
NOTE: The Oracle tab appears in the
Properties dialog only when an Oracle
database is open.
5. Click OK.
The database opens, in a display form if
you requested one.
The Database Wizard can also be used to open
an Oracle database. A button on the Wizard
labeled CS Oracle Cartridge brings up the
appropriate Oracle parts of the process.
When you have opened an Oracle database,
note that some Properties dialog tabs show
entries not available in ChemBioFinder 12.0,
including:
• Database tab: CS Oracle Cartridge version
if any.
414
ChemBioFinder/Oracle
Chapter 25
• Table tab: Table owner name; name of primary index if any.
• Field tab: Oracle native data type name;
name of associated index if any.
When you open an Oracle database and select
a table, ChemBioFinder/Oracle gathers information about the columns. If you open a table
you know to contain structures, and ChemBioFinder/Oracle does not show a structure (or
formula or molweight) column, then it may be
necessary to set up some configuration information about the table. For details, see “Configuring via CF_SETTINGS table” on page
542.
Searching
From the user's point of view, searching in
ChemBioFinder/Oracle works basically the
same way as in ChemBioFinder 12.0: you
enter a query, search, then work with the
hitlist. Internally, however, the ChemBioFinder/Oracle machinery is quite different.
There are three types of table involved in handling hit lists. All are created in your own
tablespace. One is global, applying to all lists
saved from any table; others are connected to
the particular table or view being searched.
• CF_HITLISTS. The directory of all saved
lists. This table is created the first time any
list is saved.
• SAVED_tablename: All lists which have
been explicitly saved from a given table or
view. This is created the first time a list is
saved.
• HITS_tablename: All lists automatically
saved after every search over a given table
or view. This table is created the first time a
search or list operation is carried out and is
deleted at the end of the session.
Here's what happens when you present a query
to ChemBioFinder/Oracle:
1. If the query contains a structure, it is converted to a text representation and copied to
a temporary table.
NOTE: The table is called temp_queries. It is
created in the CSCartridge tablespace, and
removed as soon as the search is finished or
interrupted. ChemBioFinder 12.0 does not yet
handle the case of multiple structure boxes
where more than one contains a query.
2. The query is converted to a SQL select
statement. Query components in form
boxes are ANDed together (just as in ChemBioFinder 12.0), where the structural parts
are calls into the CS Oracle Cartridge structure search functions.
3. The hits table is created, if it does not
already exist.
4. A unique ID is assigned to the new list
which will result from the search.
5. The select statement is wrapped in a larger
SQL statement which will cause the results
to be deposited directly into the hits table.
6. The SQL is executed.
7. When the search is complete, the results are
new rows in the hits table. Each row contains the new list ID alongside the ID of a
record from the searched table.
8. The final list is prepared by a join, selecting
rows from the main table which have record
ChemBioFinder & BioViz
User Guide
415
ID's matching those of the new list in the
hits table.
The resulting list is ready to browse, save,
export, etc.
NOTE: Text searches in Oracle are case sensi-
5. Go back to your original form and repeat
the sort.
TIP: You may have to click Refresh Session
Data on the Oracle tab before the sort will
work.
tive. You will get different hits from the query
“benz*” than from “Benz*.”
Subform value aggregate
Certain sort operations require a ChemBioFinder 12.0 system table, CF$_SORT, that
may not exist in your current form. If the table
does not exist, you will be alerted the first time
you attempt such a search in an Oracle database.
To create the CF$_SORT table:
In an Oracle database, ChemBioFinder 12.0
allows sorting the main list over subform field
aggregate values. If, for example, you have a
subform showing a column of test values
where there are multiple records in the subform for each main record, you can sort the
main hitlist based on the sum or average of the
set of test values for each record.
To sort by aggregate:
1. Open a new form, then click the File>Database menu command.
The Form Properties dialog box opens.
2. On the Database tab, click the Oracle Database... button.
3. Log in as the owner of the schema where
your ChemBioFinder 12.0 system tables are
located. Typically this will be ChemBioFinder
1. Click the Record>Sort menu command to
bring up the Sort Multiple dialog box.
2. Click a subform value in the left-hand box
to sort by.
3. In the right-hand box, right-click the Fxn
column and choose a function from the
popup menu: MIN, MAX, AVG, or SUM.
4. Click OK.
The hitlist is sorted by the selected value(s).
Sorting
NOTE: If you do not have privileges to log in
as this user, consult a system administrator.
4. Click the Oracle tab of the dialog box, then
click the Prepare Schema button.
ChemBioFinder 12.0 will create the one
new table needed, without modifying any
of the others.
NOTE: If this button is dimmed, it means you
are not logged in as the owner of the current
schema.
416
ChemBioFinder/Oracle
Chapter 25
NOTE: AVG and SUM are available only for
numeric fields; MIN and MAX can also be used
for text fields.
Handling lists
There are differences between ChemBioFinder
12.0 and ChemBioFinder/Oracle in working
with hitlists:
• Save List does not bring up a file dialog in
ChemBioFinder/Oracle; instead, it presents
a dialog in which you enter a name and a
line of comments for each list.
• Restore List presents a dialog in which you
choose from the available saved lists (see
screen shot below).
• Restore Previous List is no longer dimmed
after you have done a single search; it is
available, and will return you to the full list.
(This is true also in ChemBioFinder 12.0.)
• Over Current List, Omit From List, and Find
List work as before.
Setting Oracle preferences
When you are working with an Oracle database, the Properties dialog contains a tab for
Oracle settings. Items currently in this tab are
as follows:
• Auto-sort on. Displays the default sort field.
All lists will be sorted in ascending order
over this field if no other sort criterion has
been specified. At present, the auto-sort
field is always the primary key, and cannot
be changed.
• Primary key. Names the primary key of the
current table, if any.
• Saved hits. Displays the name of the table
in which saved hitlists are stored for the
current form, if one has been created.
• Records per retrieve. Sets the size of the
ADO recordset cache, that is, the number of
records brought to the client for each
retrieve operation. This value can be
adjusted for better performance, but in
practice it does not have much effect.
• Cache ID's for faster moves. Checking this
box enables a new record-retrieval scheme
designed for more efficient browsing of
large lists; details are given in “Fast-move
caching scheme” on page 542. The state of
this check box is saved with the formfile.
Currently, when you check or uncheck this
box, you must save and reopen the form
before proceeding.
• SQL Trace to file. Check this box to generate a text file of the SQL being sent from
ChemBioFinder 12.0 to Oracle. To specify
an output file, enter a pathname or use the
browse button. The file is never overwritten: new data are always appended. Tracing
begins when this box is checked, and ends
when it is unchecked. If you exit ChemBioFinder 12.0 with tracing in effect, it will be
in effect the next time you start up, and you
will be given a quick warning about it on
the status bar.
CAUTION
The trace file can become very large if you turn
on this feature and forget about it.
Updating and adding data
If you have privileges to add, update, and
delete in the table connected to your form, then
ChemBioFinder & BioViz
User Guide
417
you should be able to do these operations on
records in the database just as in ChemBioFinder 12.0. However, there are some cautions:
• Do not modify data in an existing Web
Server, RegDB, or E-Notebook database.
ChemBioFinder/Oracle does not automatically prevent you from doing this, but you
are sure to foul up those systems unless you
go through their normal registration procedures, or know exactly what you're doing.
Most database alterations are possible, as in
ChemBioFinder 12.0: you can add, modify,
and delete tables and fields, assuming you have
the appropriate privileges. Differences include:
• When you create a structure field, you can
give it any name you like.
• Structure columns in tables managed by the
CS Oracle Cartridge can be in any of several formats, but ChemBioFinder/Oracle
does not allow you to choose one: it
defaults to a character (CLOB) column
storing text-encoded CDX.
• ChemBioFinder/Oracle does not allow you
to create an Oracle database in the same
way ChemBioFinder 12.0 creates an
Access MDB file. The equivalent in ChemBioFinder/Oracle is to create a table.
1. On an empty form, right-click and choose
Data Source....
2. Click Oracle Database and proceed as
described under “Opening an Oracle database” on page 414. It doesn't matter what
table you select, since you will be creating a
new one.
3. Click OK to return to the blank form.
You are now ready to import.
NOTE: When you click OK to dismiss the
properties dialog, you will get a warning if the
selected table does not have a primary key
defined. You can ignore this if you are about to
create or load a new table. Otherwise, you
should consider using an Oracle tool to define
a primary key for the table.Choose Import
SDFile or Import Structures and select the
source file(s).
The Data Import dialog appears:
Loading
You can build ChemBioFinder/Oracle databases by loading from SDFiles or using Import
Structures. (RDFiles should work also, but
have not been tested.) However, because you
cannot actually create a new database, the procedure is somewhat different from ChemBioFinder 12.0. You must already have a database
open, and then you can import to an existing
table or have a new one created.
To import data and structures into a new table:
418
ChemBioFinder/Oracle
Chapter 25
1- Import tab
2- Output database text box
4. In the Output database box, you see the
name of the database followed by the table
name in brackets. To specify the table to
load, edit the table name by typing between
the brackets. If you want to create a new
table, enter the name you wish to give it. If
you want to append to an existing table,
enter its name.
5. Set other options as desired, and click
Import to begin the process.
TIP: for text fields being imported, make them
wider than the value determined by the input
scan. (To do this, double-click the name under
Input Field and enter a larger Width value.) Otherwise you might have problems if you append
more records later.
6. After importing, you should create a primary key and index; see “Indexing” on
page 419.
To append to an existing table follow the procedure above except:
• Step 1: You can start with an existing form
instead of a blank one
• Step 2: You should select the target table.
When you do, there will be no need to edit
the table name in Step 5.
• Structure indexes. Any column containing
structures should have an index created by
the CS Oracle Cartridge. If there is no
index, searching is still possible, but very
slow.
• Primary keys. A table containing a column
of structures should also have a column of
unique record identifiers for use in various
list-handling operations. Preferably this
column is of type INTEGER and is designated as the primary key of the table.
ChemBioFinder 12.0 provides information
about these indexes, and allows you to create
or recreate them if necessary.
To create a structure index:
1. Right-click on the structure box of an Oracle-connected form, and choose Properties....
2. Go to the Field tab of the dialog.
If the selected field is indexed, the index
name is shown in the properties box. In the
example below, the index is named IX50.
Indexing
As every Oracle administrator knows, a key to
good performance is to index certain columns
so that searches over them become fast lookups. If you intend to create, load, or manage
tables, then you are an administrator, and need
to know something about indexing. ChemBioFinder/Oracle provides a few tools to assist
you.
There are two types of index of interest to
ChemBioFinder/Oracle:
1- Field name
ChemBioFinder & BioViz
User Guide
419
2- Index name
NOTE: If there is no index, or the field is not
indexable, the Index line does not appear in the
list.
3. If there is no index, click Create Index.
NOTE: If this button does not appear, it means
the selected field is not a candidate for
indexing.
4. In the Create Index dialog, provide a name
for the new index and click OK.
The index is created.
You will get an error message from Oracle if:
• You provide an index name which is
already in use, OR...
• The column already has an index.
ChemBioFinder/Oracle does not provide a
direct way to delete or overwrite an index, but
the CAL SQL command can be used for this
purpose.
To create a primary key index:
The process is the same as for a structure
index, except that you carry it out on a field
of type Long. This creates an index on the
field and also designates it as the primary
key. It will fail unless the column already
contains unique, non-null values.
NOTE: A new button, Set As Structure, may
appear if you have selected a certain type of
column. This is an advanced feature described
in “Configuring via CF_SETTINGS table” on
page 542.
TIP: If you want to create a primary key, but
don't have a column of unique integer values,
you can create one using a CAL script. For
example (assuming you've already created a
column and form box called “ID”):
loop
putdata ID $index
record commit
record next
endloop
CAL
Some new features have been introduced into
ChemBioFinder 12.0 Automation Language
(CAL) to support Oracle. Some are not specific
to Oracle, but of general utility:
• SQL command. When you are connected to
an Oracle database, you can pass any SQL
command which does not return records.
The format is simply SQL <command>
where the command is not quoted.
Example:
SQL create table mytable (id integer).
• CURR_TABLE variable. This variable contains the name of the table connected to the
420
ChemBioFinder/Oracle
Chapter 25
current form. This works whether or not
you are in Oracle.
Example:
MSG Current table is
$CURR_TABLE
• OPENDB allows change of table. Normally
this command takes the name of a database,
followed optionally by the name of a table
in angle brackets. In ChemBioFinder 12.0,
it can now take just the table name, and
causes the form to become attached to a different table in the current database — as if
you had brought up Properties and clicked a
different table name.
Example:
OPENDB <CHEM_STRUCTS>
causes the current form to be connected to
the table CHEM_STRUCTS.
• STATMSG command displays a message
on the status bar. Format: STATMSG <message>.
Example:
STATMSG Search is now in
progress...
• SEARCH SAVE LIST, RESTORE LIST
work with Oracle. Normally you can follow
either of these commands with the name of
a file; in ChemBioFinder/Oracle you can
instead provide a list name.
ChemBioFinder & BioViz
User Guide
421
422
ChemBioFinder/Oracle
Chapter 25
26
BioViz
With BioViz, you can identify trends and correlations in your data, and within subsets of
your data, without the extra step of exporting
to another application. You can have as many
plot windows as you like, each showing a different visualization of data from the current
form.
BioViz is designed to be used with the Structure Window and the Queries Tree. While not
necessary to creating visualizations, they offer
considerable convenience when working with
plots. Before working with BioViz, go to the
View menu and activate the Structure and
Explorer windows. The Structure window
gives you a way to display structures without
taking up room on the form. The Queries Tree
in the Explorer Window gives you an easy way
to track multiple hitlists.
To create a new plot, view an existing plot, or
delete a plot, use the BioViz Plots submenu of
the View menu. Plots are saved with the form
and will come back when it is opened, though
they may be hidden.
or star. Selected or moused-over points retain
the same display as in earlier versions: the
selected point is displayed as a double hollow
red circle, and points being moused-over
(pointed at) are displayed as red solid with a
black circle.
Point shape selection is from the Display tab of
the BioViz Plot Properties dialog box.
Axes
You can set both the content and the font used
for each axis. The default X and Y labels are
the names of the fields plotted, but you can
now enter any text in any font to override the
default. You may also choose whether or not to
display the X and/or Y grids by using the
check box next to each label.
TIP: Labels are “sticky”, that is, the labels
used for the previous plot are the defaults for
the next plot created. If you entered axis labels
for Plot 1 and want to use default labels for Plot
2, you must go to the Display tab to delete the
label entries when you create Plot 2.
Changes in version 11
User-customizable styles
Point shapes
Legend
You can add a legend or comments to be displayed on the plot.
You can select one of six shapes for data
points: square, circle, triangle, diamond, cross,
ChemBioFinder & BioViz
User Guide
423
1. Right-click in the plot, then click the Properties... context menu command.
The BioViz Plot Properties dialog box
appears.
TIP: You must right-click either in the plot
area or in the top border. Clicking any other
border brings up different context menus. See
“Changing the display” on page 433 for
details.
2. On the Display tab, enter your legend in the
Comment text box. You may also enter a
font and point size for the legend.
3. Click OK to display the legend.
Changes in version 10
Removal of empty points
In version 9, a point which has an X value, but
not a Y value, is represented as a so-called
“empty” point on the plot with a distinctive
marker. If there is a Y value, but no X value,
the point is simply omitted (though noted).
Version 10 omits both “empty” X and “empty”
Y points. All omitted points are noted, and
may be reviewed by clicking the Notes button
at the bottom of the chart.
Selection and mouse-overs
The default position for the legend is in the
upper right corner of the plot. After you have
created it, you may position it where you want
by dragging it.
To remove the legend, open the BioViz Plot
Properties dialog box and delete the text in the
Comment box.
To facilitate viewing selected points when queries are displayed, the selected point is displayed as a double hollow red circle. Points
being moused-over (pointed at) are displayed
as red solid with a black circle. Mousing over a
selected point displays a double hollow red circle surrounded by a black circle. Points
belonging to queries are displayed as solid colored points without circles.
Background color
Details window
You can choose any background color you
want for a chart. A Color...button on the Display tab of the BioViz Plot Properties dialog
box opens a color picker dialog box.
Other changes
Extended state saving. Filter slider positions
and colored-by state of plots are now saved
with the form.
Improved Filter display. See “Filtering” on
page 430 for details.
Improved statistical display. See “Statistical
analysis” on page 428 for details.
Improved Histogram bar coloring. See “Histograms” on page 425 for details.
424
BioViz
Chapter 26
The Details Window displays field values
(other than Structure) when viewing a BioViz
plot. To display the Details window, select it
from the View menu.
The window floats by default, but can be
docked with other windows.
To add new fields to the Details Window:
1. Right click in the Details Window.
2. Select the field to be displayed.
A check mark appears next to the selected
field. Fields display in the order you select
them.
3. To remove a field from the Details Window,
right-click and deselect it.
Creating a plot
To begin working with BioViz, select a set of
data to work with. You can plot an entire database or the results of database queries. You can
filter the plot to limit the data range within a
given dataset.
To create a new plot:
1. Click the View>BioViz Plots>New menu
command.
The BioViz Plot Properties dialog box
appears.
2. Select a Dimension (one or two variables)
and a Style (line, scatter, or histogram).
3. Select the variable(s) from the drop-down
list(s).
4. Optional: select other options, change the
name.
5. Click OK to view the plot.
The plot appears in a separate window.
In a 2D plot, you may plot any numeric field
on the X axis and any other on the Y. For a 1D
plot, you choose only the value to be plotted on
the Y axis, where the X axis represents record
number. For a histogram, choose a single
value to be plotted on the X axis, with the frequency plotted on Y.
Another way to select a field to be a variable,
or create a 1-D plot is to right-click in a property field and select BioViz Plot from the context menu.
When you right-click in a numeric data box,
you may choose that value to be plotted on
either axis, or as a 1D plot against record number. In the latter case, the plot appears immedi-
ately when you release the mouse button. For a
2D plot, you must first select a data box for the
other axis. Use the Reset X,Y command to clear
both X and Y settings and start again.
Histograms
Histogram plots are only available when you
select a one-variable plot. When you select a
Histogram plot in the BioViz plot properties
dialog box, the plotting axis switches to X, and
the Bins section becomes available.
Each bin in a histogram is labeled with its
high-low cutoff points. Note also that the data
for the bin is displayed in the status bar as you
mouse over it.
When you overlay queries, the histogram bins
display the partial membership of the selected
queries within the bars of the histogram.
Figure 26.5 Histogram display with overlaid
queries
Plot options
BioViz options are available from the BioViz
Properties dialog box and from the context
(right-click) menu. Some of the context menu
ChemBioFinder & BioViz
User Guide
425
commands repeat options in the Properties dialog box.
Dialog Option
Dimension
Description
Dialog Option
Locked
Number of variables
plotted. One and two
dimensional plots are
currently supported.
changes in the current list
list coloring
Currently supported plot
styles are Line, Scatter, and
Histogram.
Bin
BioViz Plot Properties
dialog box options (except
Name) are blocked. The
Display and Analysis tab
options are all blocked,
even though they are not
grayed out.
By number: Sets up n bins
evenly spread across the
whole range of values. n
must be <=500.
By size: Sets up bins of size
Selection and mouse-overs
are not affected.
n. The number of bins will
be as many as are necessary
to cover the range.
Log scale
Select this option to display
a log scale.
Base
Base of the log scale. You
must enter a number, thus
for a base e log scale, you
would enter 2.718281828.
Name
BioViz automatically
names plots with sequential
numbers (BioViz1, etc.)
Edit this field if you want to
give your plot a different
name.
426
BioViz
Chapter 26
Locks the display. When the
display is locked, the
following have no effect:
filters
Table 25 BioViz preferences, General tab
Style
Description
Point limit
Sets the maximum number
of points in the plot. Used to
limit the plotting time with
very large datasets.
Table 25 BioViz preferences, General tab
Dialog Option
Description
Point shape
Selects the point shape –
circle, square, diamond,
triangle, cross, or star.
Point size
Selects the point size.
Values from 2 - 20 may
be dialed in.
Comment
Text box for a comment
or legend.
Background
Selects the background
color of the plot.
Label
Text box for custom
label for both X and Y
axes.
Show grid
Option to display a grid.
X and Y axes may be
selected separately.
Font
Selects the font.
Different fonts may be
used for the Comment, X
and Y axes.
Menu option
Description
Zoom on Drag
A toggle which selects the
mode of operation when
you drag a rectangle on the
plot. If Zoom On Drag is
checked, the rectangle
defines the area you want to
examine, and releasing the
drag will cause the plot to
zoom in on that area. When
unchecked, dragging a rectangle selects the points
within it without changing
the scale. You can use zoom
to reset the scale even on
locked displays.
Unzoom
Resets the scale after a
zoom, or a series of zooms.
Rescale to All
Points
Scales the plot so that the
visible points fill the plot
window.
Autoscale
Automatically rescales
every time you change the
list (that is, perform a
search, restore a list, etc.).
Locked
Locks the display. See
Table 25 for details.
Copy Image
Copies the plot to the Clipboard, allowing it to be
pasted into other documents.
Table 26 BioViz options, Display tab
Menu option
Description
Properties...
Opens the BioViz Properties dialog box.
Filter Window
Opens a filter window. See
“Filtering” on page 430.
Table 27 Context menu options
Table 27 Context menu options
ChemBioFinder & BioViz
User Guide
427
Menu option
Description
Selection to List
Creates a hitlist from
selected data points. The list
is displayed in the Queries
Tree and is treated and
saved like any other search
query.
You cannot use Restore
Query on a list selected this
way, but you can use
Restore List to retrieve the
records.
Table 27 Context menu options
Statistical analysis
You can perform statistical analysis on BioViz
plots. When you specify two variables, a third
428
BioViz
Chapter 26
tab appears on the BioViz Properties dialog
box.
Figure 26.6 The Analysis tab appears when two
variables are specified.
For descriptive statistics, minimum, maximum,
mean, median, and standard deviation can be
calculated for both X and Y variables. R-
Squared is available only when curve fitting is
chosen.
Figure 26.8 Displaying Statistical Analysis Results
NOTE: R-square is available when curve fitting is selected.
You may choose from linear, quadratic, or
cubic curve fitting. A confidence interval of
one to three standard deviations may also be
displayed. Both descriptive statistics and the
curve fit update dynamically when the recordset changes or filters are applied.
Figure 26.7 BioViz Analysis
In Version 12, results of descriptive statistics
are displayed on the plot.
Version 10 plot
NOTE: Curve fitting gives incorrect results if
one of the axes is logarithmic. For example, you
do a linear fit on the original data and then
transform that fit to the log plot thereby creating a curve.
Once you have created a plot, you might want
to clean up the display. There are two ways to
do this: sorting the data on a field, and using
filters.
Sorting
The standard ChemBioFinder 12.0 sort feature
is the first step in cleaning up a graph. You
may sort into ascending or descending order.
There are two ways to sort a dataset on a given
field:
• Right-click in the field box and click the
Sort context menu command.
Version 11 plot
ChemBioFinder & BioViz
User Guide
429
• Display the Data table view, and doubleclick on the table header of the field you
want to sort.
Filtering
BioViz filters limit the display of a variable by
trimming either end of the range, that is, you
can eliminate high points, low points, or both
from the display. Filters can be set for either or
both plotted variables. You may also filter the
dataset on other variables, up to a total of 31
filters per chart.
New filter style
Old filter style
Figure 26.9 Filter sliders
430
BioViz
Chapter 26
Filters are set in the filter window. If the window is
not visible, check the box next to Filter Window on
the View menu. When a filter is set:
• All plots associated with a given form are
affected, unless the plot is locked before
applying the filter.
• Points missing a value for a given field are
hidden whenever the filter for that field is
visible.
The range is displayed in black below the
slider, and the set points in red above the
slider. Filter name is centered, rather than on
the right. Operation of the sliders is
unchanged.
a variable from the list. When you view the
context menu again, the variable will
appear with a check mark next to it.
To remove a filter:
Right-click in the Filter window to display
the context menu, then click the variable to
deselect it.
The following bio-assay example shows two
plots of the octanol/water partition coefficient
(CLogP) plotted against an activity measure
called Fold_Above_Control. The second is filtered on molar refractivity. Note that the upper
chart has been locked to prevent the filter from
affecting it.
Figure 26.11 Locking a chart
To apply the filter:
• Press the thumb at one end of the slider and
drag along the slider.
Figure 26.10 Filter window, stacked with details and
structure windows
To activate a filter:
Right-click in the Filter window, and select
ChemBioFinder & BioViz
User Guide
431
• In the bottom diagram, the plot is limited to
Molar_Refractivity from 10 to 33.
attached to your form, the BioViz plot displays
the results of the current hitlist. You can display overlays by selecting hitlists rather than
making them current.
For example, the following figure shows
results of a screening test relative to a control.
Figure 26.12 Histogram Filtering
Filter slider adjustment
Once the top and/or bottom of the range has
been set, you can move the entire range. For
example, the Boiling Point filter has been set to
display a range of about 250° —from 501.3°K
to 753°K.
A
B
Figure 26.13 Filter Slider Adjustments
By dragging the blue part of the slider, you can
view any 250° range of the chart that you want.
The range being displayed has been moved to
651.5°K—903.2°K. The size of the range
hasn’t changed, just its location.
Plotting queries
When you perform queries (see “Queries” on
page 357), and have one or more hitlists
432
BioViz
Chapter 26
Figure 26.14 Screening test results
To remove outliers more than 2.5SD from the
control:
• Search for “<2.5 and >-2.5” in the SDs Above
Control field.
• The plot displays the results for the hitlist.
NOTE: By default, the hits are shown on the
same scale as the original list, which may cause
them to cluster in one sector of the window. If
this happens, right-click the plot and choose
Rescale to All Points or Auto-scale. Rescale to All
Points operates on the current datapoints only;
Auto-scale sets a switch so that all subsequent
searches and list operations will automatically
rescale the plot.
To display the results of an overlay on the full
list:
1. Open the Queries pane of the Explorer Window.
2. Double-click on the Full List to make it the
current list.
3. Click the query to select it for display, over
the current list.
Selecting a list by single-clicking in the queries
tree (or choosing Color On Plot from the tree
context menu) causes points on the plot to be
recolored. The recolored points are those
which are on both the selected list and the plotted one. You may color more than one list at a
time. When a list is colored on the plot, its item
in the queries tree is shown with a check mark;
clicking it a second time uncolors it and
removes the check mark.
Synchronization of plots
Multiple plots attached to a form are synchronized. If you select (mouse over) a point in one
plot, the same point is highlighted in all other
plots (and the related structure is displayed in
the Structure Window).
This behavior is slightly modified if one of the
plots is a histogram. You must select (not
mouse over) a histogram bar to highlight
points in other plots. Mousing over a point in a
line or scatter plot will highlight the point in
the center of the corresponding histogram bar.
Figure 26.15 Synchronized histogram
Changing the display
Once you have selected data points and produced a plot, there are several options for modifying the display.
• Changing Colors–to change the color of a
plot:
a. Open the Queries pane of the Explorer
window.
b. Right-click a list and click the Change
Color... context menu command.
c. Select a new color from the color menu.
•
Selection and Zooming–to select a part of
the plot and zoom in:
To select part of the plot:
a. Drag a rectangle across a portion of the
plot. The portion of the plot is displayed
in red.
b. To select more than one section, use
Shift+drag or Ctrl+drag.
To zoom-in on part of the plot:
a. Right-click in the plot and click the
Zoom on Drag context menu command.
ChemBioFinder & BioViz
User Guide
433
This is a toggle switch–choose it again
to deselect.
b. Drag a rectangle across a portion of the
plot.
This time, when you release the mouse
button, the plot display zooms in to show
only the points selected. When the plot is
zoomed, scrollbars appear. Use these to
reposition your view of the zoomed plot.
Click the “circled-point” icon on a scrollbar
to restore that axis to the previous zoom.
Right-click and click the Unzoom context
menu command to restore to the full view.
• Changing the Style–you can change the
style of an existing plot. For example, you
can turn a scatter plot into a histogram.
a. Right-click in the plot and click the
Properties... context menu command.
434
BioViz
Chapter 26
b. In the properties dialog box, select the
style and click OK.
The plot displays in the new style.
• Changing Fields—you can change the field
plotted on the X or Y axis with the context
menu.
a. Point in the area of the numbers just
below or to the left of an axis.
b. Right-click. The context menu displays
a list of plottable fields.
c. Select a different field to plot on that
axis.
NOTE: You can only change fields when the
chart is not locked.
In Data Table display, you can display a substructure search as table of R-group substituents.
27
BioSAR
This section explains how to export a data
form from BioSAR and view it as an equivalent form in ChemBioFinder. Once in ChemBioFinder, you can manage the form using a
variety of features.
Starting the BioSAR browser
To use BioSAR, you must have Internet
Explorer 5.5 (with SP2) or greater installed.
To start BioSAR:
1. In Internet Explorer, log into the ChemOffice Enterprise portal.
2. In the Enterprise screen, under BioSAR
Enterprise, open a query form using either
of these links:
• Open Form
• Manage your forms
Performing searches in BioSAR
Before exporting a BioSAR data form to
ChemBioFinder, you need to search on the
data in the BioSAR database.
1. In BioSAR, open a query form of your
choosing.
2. In the form, enter your search criteria and
click the Search button.
Exporting the data form to
ChemBioFinder
After the search is complete, you are ready to
export the data form to ChemBioFinder.
To export the form:
1. Click the Display In BioViz button. If the
button is not visible, you may need to edit
the BioSAR form properties. See your
administrator.
2. When prompted to either save the form file
or open it, select Open. ChemBioFinder
will launch.
3. At the Oracle login, provide your user name
and password.
NOTE: If you don’t want to view the form now,
simply save the file. You can open the file in
ChemBioFinder at any time.
ChemBioFinder file types
Whenever you export a data form, BioSAR
creates a file with the extension .bsbxml.
ChemBioFinder reads this file, and opens the
form, linking it directly into the database.
The .bsbxml file is read-only. Although ChemBioFinder doesn’t allow you to modify the
.bsbxml file itself, you can still edit the form
and save your changes. When saved, the form
file is assigned the ChemBioFinder extension
ChemBioFinder & BioViz
User Guide
435
cfx. Unlike .bsbxml files, cfx files are not readonly. You can open any cfx file in ChemBioFinder, edit it, and save it again. Meanwhile,
the .bsbxml file is still available whenever you
need to open the original form.
Setting “save password”
If an Oracle-connected form contains an
invalid (or blank or no) password, the program
prompts you for a name and password on
opening the form. The same is true if the Save
password box has not been checked in the form
properties dialog. This is now the default when
a form comes from BioSAR. You are
prompted for username and password every
time, until you check the Save password box
and save the form.
Subforms and autolinks
When you create a form in BioSAR, you select
from the database which fields you want to
include in the form. Those same fields appear
in the form when you import it into ChemBioFinder. After you import your form, you can
continue to build on it in ChemBioFinder using
additional fields. The fields you use can also
include child tables and their fields. Child
tables that you add appear as subforms; fields
from child tables are displayed as autolink
boxes.
To add a subform:
1. In the Explorer Window, select the BioSAR
tab.
2. Select a child table from the Child Tables
directory.
3. Double-click the child table. The child table
appears in the form as a subform.
NOTE: Not all fields in the child table are
necessarily displayed in the subform. The
subform fields are limited to the same fields you
selected in BioSAR and defined in the default
form group.
To add an autolink box (automatically):
1. Select a child table from the Child Tables
directory
2. In the child table, double-click an individual field. The child table field appears in the
form as an autolink box.
To create an autolink box (manually):
Assume you have a structure table Moltable with a column of non-unique integers
Chemist_ID. In a separate table Chemists
there is a text column to be displayed
Name and a column of unique integer
record identifiers ID. Each Chemist_ID in
MolTable matches one ID in Chemists. To
set up an auto-link box on the main form
which shows, for each structure, the name
of the associated chemist.
1. Create a data box.
2. Right click on the data box and connect it to
the ID field to be retrieved. In this example,
connect the form box to the Chemist_ID
field.
3. To connect the box to the ID field, rightclick on the box and choose Properties.
Box Properties dialog box appears.
436
BioSAR
Chapter 27
4. Check the option"With choices or autolink". Checking this will automatically
brings up the Choices tab.
and the “Auto-link via”check box becomes
available.
NOTE: An auto-link cannot be set up if you are
entering a fixed list of choices.
7. Check the "Auto-link via" box. From the
drop-down menu, choose the column of the
subtable ( in this case “Name” under
“Chemist”) which is to be matched against
the column ID.
In the Choices tab:
•
•
If the "Auto-link via" box is unchecked,
the dialog lets you define a set of choices
for data input.
If the box is checked, then you have to
define both a set of input choices and an
auto-link connection.
TIP: To prevent the drop-down choice menu
from appearing, check the "Hide menu" box.
This applies only if you have set up auto-link.
5. Select the "From table" radio button. In the
data source tree, locate the subtable and
click the column of data to be displayed in
the box (in this case, "Name" under "Chemists").
6. The label, Name, after the radio button,
From table, updates to show your choice,
NOTE: The columns shown in the drop-down
menu should match the type of the fields to be
linked, i.e., if the ID is numeric, then only
numeric fields may be linked.
8. The form box displays a chemist's name.
Multiple sort
ChemBioFinder’s multiple sort feature lets you
rearrange the hitlist based on one or more form
fields you specify. For example, you can first
sort the list by Reg number and then further
arrange the list in order of Full reg number.
Sorting by main form fields
To sort the hitlist using fields in the main form:
1. Click the Record>Sort... menu command.
The Sort Multiple window appears.
2. In the Sort Multiple window, select from
the left pane the field by which you want to
sort. To sort by multiple fields, select the
fields in the order you want to sort.
3. By default, each field is sorted in ascending
order. To reverse the order, right-click the
field name in the right pane and click
Descending in the pop-up menu. To remove
ChemBioFinder & BioViz
User Guide
437
a field, right-click the field and select
Remove.
4. Click OK when finished.
and previous sessions. Queries are associated
with forms. So, the query hitlist is saved when
you save the form.
Sorting by subform fields
Viewing the query list
Just as in the main form, you select in the subform the fields you want and the order you
want them to be sorted. You also indicate
which value in each field you want ChemBioFinder to sort by–the minimum value, the maximum, average of the values, or the sum.
To sort the main form using subform fields:
When you open an existing form, the tree
updates to show only the queries for that form.
The Explorer Window must be visible to view
the Queries control. If it isn’t visible, do the
following:
1. Click the Record>Sort... menu command.
2. In the Sort Multiple window, select from
the left pane the subform field by which
you want to sort the hitlist. The subform
field is displayed in the format, subform
name: field name.
To sort the hitlist by more than one field,
select the fields in order of priority.
3. To reverse the order in which values will be
sorted, right-click the field name in the
right pane and select Descending in the
pop-up menu.
4. Also in the pop-up menu, select the value in
the field you want ChemBioFinder to sort
by–max, min, average, or sum. The default
is Min.
5. Click OK when finished.
Query hitlists
The Queries tab in the Explorer window maintains a list of search queries from the current
438
BioSAR
Chapter 27
1. Click the View>Explorer Window menu
command.
2. Click the Queries tab to display the Queries
tree.
Query list operations
Each time you perform a search or list operation, a new query is generated in the tree.
ChemBioFinder assigns a name to the query
and displays it in the tree along with the size of
the list (number of hits) and a brief description.
The generated name is Q<n>*, where n is a
sequential number and * indicates that the
query has not been renamed or marked for saving. (See “Saving query lists” on page 441.)
To perform list operations, begin by performing a simple search. For example, you can
search the database for all compounds that
have a molecular weight less than 250g/mol:
1. Click the Enter Query icon on the Search
toolbar or menu. The form goes into query
mode.
2. Enter <250 in the MolWeight field of the
query form and click the Search button.
A query labeled Q1 appears as a child of the
Full List.
Changing the display color
The color of the box next to the query name is
the same color to be used to display the points
should you plot the results. You may change
any query to any color so that the plots look the
way you want.
To change the display color:
1. Point to the query and right-click. The context menu is displayed.
2. Click Change Color on the context menu.
The color picker context menu appears.
3. Select a new color and click OK. The color
in the box changes.
If you have plotted data with BioViz, you will
see that the points that correspond to the query
also change color.
Child lists
Figure 27.16 The Queries control after a typical
search
Changing the query name
If you want, you can change the name of a
query to one that is more descriptive. Renaming a query also ensures that the query is saved
with the form. (Depending on your Preferences
settings, queries not renamed may be automatically discarded when you save the form).
To rename a query:
1. Point to the query and right-click.
The context menu is displayed.
2. Click Rename on the context menu.
The name (Q1) is highlighted.
3. Enter a new name and press the Enter key.
You can add a new query either by searching
the Full List or searching another query. When
you create a new query from another one, the
result is a child list. For comparison purposes,
it is often an advantage to create multiple child
lists, each from a single search attribute, rather
than one child list based on multiple attributes.
You can create a child list for only the currently selected list. If you are not sure that the
list you want is selected, double-click it.
Before you create a child list, select Over Current List on the Search menu. Note that, once
selected, Over Current List has a check mark
next to it.
You are now ready to create a child list query.
The following sample procedure describes
how to create a child list by searching for carboxyl structures:
1. Click the Query icon to put the form in
query mode.
ChemBioFinder & BioViz
User Guide
439
2. Double-click in the Structure window. The
ChemDraw toolbar appears.
3. Using the bond tool, create a carboxyl
structure.
4. When you have finished creating the structure, click outside the Structure window.
5. Click the Search button.
The new list is created as a child of the previous list.
Figure 27.18 Several child lists of the parent list MW
Filter.
To create another child list, you must first
select the parent list. To select the parent, do
either of the following:
• Double-click the parent list
• With a child list selected, click Restore Previous List on the Search menu or toolbar.
You can verify that you have selected the parent list by viewing the status bar information.
With the parent list selected, you can add
another child list to your query.
Figure 27.19 The value “1187” in the status bar
indicates that the parent list in figure 5 has been
selected. “38547” is the number of entries in the full
list.
Merging lists with drag-and-drop
In some situations you might want to merge
two lists using drag-and-drop. The result is a
new list that has attributes based on the merged
lists.
Figure 27.17 In this example, Q1 is a child list of a
parent list named MW Filter.
Creating multiple child lists
You can run similar queries, each with different attributes and displayed as a child of the
parent query.
440
BioSAR
Chapter 27
1. Select a list and drag it onto another list.
The Restore/Merge List dialog opens.
2. Select the type of merge you want, in the
Restore/Merge List dialog box.
3. Click OK. A new list is displayed with the
merged criteria you selected.
which you want to work. This subset becomes
the domain.
TIP: If you want your domain to have a particular order, sort before creating the domain. The
order will be preserved for all subsequent use.
To create a domain:
1. Select a query by double clicking on it.
2. Click the Search>Domain>Set Domain to
Current List menu command.
Query control display
Figure 27.20 Restore/Merge List dialog
Saving query lists
When you transfer data to ChemBioFinder
12.0 from BioSAR Browser, ChemBioFinder
12.0 opens a file of type .bsbxml and creates a
form to simulate the BioSAR setup. At the
same time, it restores whatever hitlist was in
effect in BioSAR. In ChemBioFinder 12.0, the
BioSAR hitlist is automatically saved when
you save, close and reopen a file. This is different from the default in previous versions.
Domains
The Domain feature in ChemBioFinder allows
you to create a subset of a database. Once created, a domain acts as if it is a full database.
Any database searches you perform are limited
to only the domain. Any hitlists you create will
be added to the query tree as if you are working with the full database.
Creating a domain
Before you create a domain, you must run a
query to define the subset of the database with
When you run queries in a domain, they will
not be displayed as child queries of the domain
unless you select Over Current List on the
Search menu and specify the domain as the
active list.
Cancelling the domain
If you no longer want to use a domain, click
the Search>Domain>Reset to Full Database
command again to cancel it.
Creating an mdb database
When working with a large, Oracle-based database on a server, it is sometimes convenient to
store a subset of the database (dataset) as a
local database. ChemBioFinder local databases
are Microsoft Access-based (file extension:
MDB), so the exported dataset must take into
account Access naming rules and limitations.
Access database rules
Because ChemBioFinder 12.0 uses the Access
(Jet) database standard, names of fields, controls, and objects must conform to Access
rules. These are:
• May be up to 64 characters long.
ChemBioFinder & BioViz
User Guide
441
• May include any combination of letters,
numbers, spaces, and special characters
except a period (.), an exclamation point (!),
an accent grave (`), or brackets ([ ]).
• Must not begin with leading spaces.
• Must not include control characters (ASCII
values 0 through 31).
• Must not include a double quotation mark
(“) in table, view, or stored procedure
names.
Creating a local copy of a database
If you frequently use a set of data that never
changes, consider exporting the data as a local
ChemBioFinder database. Having a local database often makes many common tasks run
faster; tasks such as browsing, searching, plotting, and analyzing.
Creating a local database requires two steps:
1. Exporting the dataset as a CFXML file and
2. Importing the file back into ChemBioFinder. Once you import the file, save it as a
CFX file. It will then be available for you to
use whenever you need it.
Exporting the dataset
To export a dataset:
1. Run a query to create the dataset.
2. Click the File>Export>CFXML menu command.
The Data Export window opens.
3. Select the options you want to apply to the
exported dataset:
• In the Data Export dialog box, select a
path and file name for the new database.
Use the File button to browse for a location.
• In the lower half of the dialog box, all data
fields are selected for inclusion in the
442
BioSAR
Chapter 27
exported database by default. Clear the
appropriate check boxes to deselect fields
you want to omit.
• Check the field names to ensure each one
complies with Access database rules (If
necessary, edit the field name by doubleclicking it).
• On the Text Options tab, select a delimiter
and other options you want to include:
subform data, empty records, and headers.
You also have an option to save structures
in CDX or CDXML format.
4. After you have made your selections, click
the Export button.
Importing the cfxml file
Once you have saved the dataset in CFXML
format, you must bring it back into ChemBioFinder to save it as an MDB file.
NOTE: To avoid conflicts with field name/type
definitions, close the master database before
importing and open a blank form.
1. In a blank form, click the File>Import>
CFXML menu command and open the file.
The Data Import dialog is displayed.
2. Select/deselect the fields you want to
import and the options you want to apply to
the file.
3. After you make your selections, click the
Import button. Your dataset is imported into
an Access database.
Exporting to an Excel spreadsheet
When you export a BioSAR-derived form with
multiple subforms into an Excel spreadsheet,
you must take precautions to get all of the subforms correctly exported. This is because the
exporter normally uses only the field names,
and the BioSAR subforms show the same set
of fields from different assay tables. On export,
they will collide, and the data will not come
over correctly.
To prevent this, ChemBioFinder 12.0 has an
option on the Text Options tab of the Data
Export dialog box — Prefix output fieldnames.
When this box is checked, the output names
will match the input names, which are prefixed
for subform fields.
Tips for optimizing performance
When working with a large data base or multiple forms, you will want to ensure that you can
still work efficiently. To do so, there are a few
techniques you can use to improve ChemBioFinder’s performance, even when you are
working with a lot of data.
Use domain-linked forms
Using a domain offers a significant speed
advantage compared to working with the full
database. If you choose Retrieve All after performing some queries, you will get only the
domain as the full database. Since the domain
is typically much smaller than the database it
was created from, the query and restore commands are executed much faster.
Another advantage is that the domain is “nonvolatile”, that is, the view remains on the
server until you delete it. If you routinely work
with a particular subset of a large database,
creating a domain eliminates the need to perform the initial routine query or create a local
database. You only need to save the domain
information by saving the form. The next time
you open that form, you see only the domain.
A third advantage is that the sort order at the
time of creation is preserved. Sorting is a time
consuming operation. By using a domain, you
can sort once and save the preferred order.
To more information, including how to create a
domain, see Saving query lists.
Minimize child tables on a single tab
Whenever a subform appears on screen, ChemBioFinder automatically updates the data from
the server. If you have a lot of subforms on a
single tab, ChemBioFinder must update all of
them at once, potentially slowing down your
work. So, if you have subforms you need to see
only occasionally, put them on other tabs of the
form, so they will not be updated until you
activate those tabs.
Remove plots that you are not using
Plots that are visible all take at least some processing and closing a plot window still doesn’t
remove it from memory. If you have generated
plots you no longer need, use the View>BioViz
Plots>Remove menu command to delete them,
then save the form.
ChemBioFinder & BioViz
User Guide
443
444
BioSAR
Chapter 27
28
Clustering in BioViz
Clustering in ChemBioFinder/BioViz is a
method for analyzing biological and chemical
data.It is smoothly integrated with ChemBioFinder databases and forms, and presents to the
user visually appealing, highly interactive display.
Features
• One-click clustering over current hitlist on
any numeric field or structure box.
• Multi-dimensional clustering via compound
profile; allows detailed specification of
fields and conditions.
• Fast new clustering and projection algorithms from the core chemistry group.
• Resizable, zoomable two-pane display
showing dendrogram and cluster visualization.
• Drop-down control panels for display and
behavior customization.
• Unique cluster window allows visualization
by adjustable partitioning of dendrogram
tree.
• Dendrogram tree may be oriented in any
direction.
• Sliding adjustment varies dendrogram node
spacing between linear and log scale.
• Shaded coloring may be applied to clusters
based on value of a selected field.
• User choice of text labels may be applied
independently in each pane.
• Tooltips provide full information about
nodes and clusters.
• Intuitive highlight and selection mechanisms are synchronized between the two
panes.
• Selected set of nodes or clusters can be converted with one click to ChemBioFinder
hitlist.
• Pop-up structure window displays structures and data of highlighted nodes.
• Structure clustering based on Tanimoto
similarity between structure screens.
Working with Clustering
This section describes the steps for carrying
out clustering operations.
Clustering on single field:
1. Connect your form to the CS_Demo database.
On the form there are four fields: Mol_ID,
Molname, MolWeight, Structure and Formula.
ChemBioFinder & BioViz
User Guide
445
In this section clustering is performed on MolWeight.
NOTE: You can perform clustering on any
numeric or structure field.
2. Perform search on C6. You will get 42 hits.
TIP: Perform analysis on fairly small set of
records otherwise the display becomes cumbersome.
3. Right click the MolWeight box and then
click Cluster by MolWeight.
It takes few minutes for the operation to perform as it gathers the data, perform clustering
and data projections then calculates the display
co-ordinates.
You will get screen as shown below displaying
the results of clustering operation.
Figure 28.1 CS Clustering dialog
In the above figure, the display is divided into
two parts. On the left is the dendogram, a
standard graph for displaying the results of the
clustering operation. Each point along the
446
Clustering in BioViz
Chapter 28
baseline (“leaf”) represents one of the input
records.
In the clustering figure, you get 42 hits and 42
of them are evenly spaced along the x-axis. A
horizontal line above the base represents a
“node” or a merge of the two objects underneath it. The position of the node under y-axis
is proportional to the distance between its children, where distance is the measure of similarity between two objects. Thus the node just
above the baseline connects pairs of compounds with very similar (in this case usually)
identical molecular weights.
On the right is the cluster window, which provides another way of viewing the data.
The cluster window screen depends on the
position of the dotted pink cutoff line across
the dendogram. Every node directly below the
line is represented as a single ball in the cluster
window, with its size scaled to the number of
leaves it contains. Thus a large ball represents
a large group of compounds with similar
molecular weights, where the smallest ball is a
single compound of a weight all its own. By
moving the cut off line up and down, you vary
between a coarse-grained view with few clusters, to a more detailed view with many.
To modify the cluster dialog, click the black
drop down arrow in the lower right corner. See
“Dendogram Properties” on page 448 and
“Cluster Properties” on page 449 for more
information.
Clustering on multiple fields:
To perform clustering on multiple fields, you
need to create a profile box, which contains
user defined set of fields and conditions for
comparing data records. See “Creating a compound profile” on page 406.
After the profile box is created on the form,
save the form.
Figure 28.2 Profile box form
Each field in the profile box form is assigned a
cost and weight. Right-click on the profile box,
CLOGP, and choose Cluster By Profile, the
clustering engine uses all the three values of
each record in the hitlist together with their
weight and cost and displays a normalized distance in the records.
Modifying Clustering
To modify the cluster dialog, click the black
drop-down arrow that appears below the 3D
structure in the CS Clustering dialog. This drop
down control panel has two tabs: Dendogram
and Clusters.
NOTE: The Dendogram and Clusters tabs may
appear by default as well in the CS Clustering
window.
ChemBioFinder & BioViz
User Guide
447
Dendogram Properties
Figure 28.3 Dendogram options
• In the Style Frame, you can change the orientation of the diagram using the Invert X,
Invert Y, Horizontal check boxes. In Teepee style, lines moves from nodes to subnodes i.e. it displays the dendogram in a
non-standard way.
• Click the Line color, Highlight, or Background button, Colors dialog box will
open. By default, the dendogram lines are
in navy blue color, highlighted items are in
•
•
•
•
448
Clustering in BioViz
Chapter 28
red color, and background is in light grey
color.
Show cutoff line is the pink line. It
describes the relationship between the dendogram an the cluster window.
Linear-Log scale adjusts the attenuation of
the tree by plotting the vertical/horizontal
node position on the scales.
In the Label frame, click the drop down
arrow and select the label to be displayed
on the dendogram nodes or leaves.
Choose the Font for the label display.
Cluster Properties
Figure 28.4 Cluster properties
• In the color frame, Solid and Shaded specifies how balls to be colored in the display.
For Shade By, select the data type from the
drop down menu and choose a range of colors using a button at the end of the color
gradient bar.
• Ball Size, adjusts relative sizes of the ball.
• In Labels frame, click the drop down
arrow and select the text to be displayed on
the ball.
• Choose the Font for the label display.
CS Clustering Dialog features
The various actions that you can perform on
the CS Clustering dialog to make the dendogram and cluster window look the way you
want, are as follows:
1. Hover: As you move mouse across the
cluster dialog, the nodes or the balls it
touches gets highlighted like the lines in
dendogram are highlighted to red and the
ball in the Cluster window to blue.
2. Click: As you move the mouse across the
two panes, click on any node or ball. This
click will freeze the selected node or the
ball (color changes on freeze) and you an
easily move your mouse across the dialog.
ChemBioFinder & BioViz
User Guide
449
To unfreeze the selection, click on any
empty space in any of the window (get original color).
3. Drag: You can change the shape and size of
the dialog.
4. Re-project cluster: When you move the
pink dotted line up or down in the left window (dendogram pane) the cluster window
(right pane) will change the diagram
accordingly.
5. Show Properties: Click the black arrow in
the lower right corner of the cluster dialog.
You will see the properties of the dendogram and the cluster.
450
Clustering in BioViz
Chapter 28
6. Right click: On freezing any node/ball you
can easily perform actions on that particular
node/ball. Right click on it, it shows menu
options: Zoom, Show structure window
and Selection to list.
•
Zoom: It changes the size of the data display beneath the viewing window.
•
Show structure window: The highlighted
or freezed node/ball structure is displayed
correspondingly.
•
Selection to list: It generates a hitlist of the
selected node/ball.
29
Customizing ChemBioFinder 12.0
You may customize ChemBioFinder 12.0 in
the following ways:
• Customize display of your molecules, fonts,
pictures and forms.
• Customize the Favorites tree
• Design the toolbars to your specifications.
• Perform automated tasks, such as interfacing with Microsoft Excel, or by using CAL,
the ChemBioFinder 12.0 Automated Scripting Language.
Structure display
To display carbon atoms on methyl groups or
on interior aliphatic or aromatic chains, check
the relevant check boxes in the Carbon labels
section.
To display hydrogen atoms on heteroatoms or
on terminal carbons:
Select the Fill valence option in the Hydrogen
Labels section.
Setting preferences
The Preferences dialog box allows you to customize the display of molecules, pictures, and
forms, and set options for searching and
exporting.
General instructions for using the Preferences
dialog box:
1. Click the tab containing the preferences to
set.
2. Select the preferences, and click OK.
Select No H atoms in the Hydrogen Labels
section.
Display preferences
To set the Display preferences:
Click the File>Preferences... menu
command.
The Preferences dialog box appears with
the Display tab on top.
ChemBioFinder & BioViz
User Guide
451
To display all structures with a constant bond
length:
1. Click the Uniform bond length radio button
in the Structure Scaling section of the Display tab.
2. Select the bond length percentage.
With Uniform bond length selected,
structures may be reduced in size if they are
too large to fit within the structure box, but
they will never be enlarged.
Framing pictures
NOTE: Selecting No implicit means these types
are displayed without implicit hydrogens.
Using keyboard shortcuts
When using a form, you can use keyboard
shortcuts to show or hide atom-to-atom maps,
reaction centers, atom numbers, and bond
numbers.
To use keyboard shortcuts:
Select the Enable keyboard shortcuts check box
on the Display tab of the Preferences dialog
box.
When keyboard shortcuts are enabled, the following keys toggle these properties:
•
•
•
•
•
A:
show/hide atom numbers
B: show/hide bond numbers
M: show/hide atom-to-atom maps
R: show/hide reaction centers
S: show/hide stereochemistry
Scaling structures
To scale each structure so that it is as large as
possible within its structure box:
Click the Fit to box radio button in the
Structure Scaling section of the Display tab.
452
Customizing ChemBioFinder 12.0
Chapter 29
To select whether the pictures in a form are
surrounded by a border:
Select the Framed radio button in the
Pictures section of the Display tab.
Grid spacing
To set the grid spacing (in pixels) on a form:
Type in a number, or press the up and down
arrows to change the current value by one
unit in the Grid Spacing section of the
Display tab.
Choosing a small grid spacing allows you to
place objects more precisely by snapping to a
tighter matrix.
Color preferences
To set the color preferences:
Click the Color tab of the Preferences
dialog box.
The color tab allows you to specify the color of
various interface elements.
To set a color:
1. Click the button corresponding to the interface element you want to change.
The color dialog box appears.
2. Select the new color.
3. Click OK.
2. Click the General tab.
The General tab appears.
TIP: Some users prefer not to see red highlighting because it masks the atom colors. You
can change the highlight color on the Color tab
of the Preferences dialog box. Selecting
“black” will effectively cancel highlighting,
leaving atoms to display in their normal colors.
Structural query matching
Search Type, Search Details, and Tuning help
you define a query to give the kind of hits you
are looking for. The settings are discussed in
the chapter on queries under “Search types” on
page 360, “Setting search details preferences”
on page 370, and “Tuning” on page 372.
General preferences
The general preferences let you set:
• Recent file list size
• Startup defaults
• Frame styles
• Query save defaults
To set the general preferences:
1. Click the File>Preferences... menu command.
The Preferences dialog box appears.
Figure 29.5Setting general preferences
Structure registration options
To have ChemBioFinder 12.0 present an alert
when attempting to enter a structure with an
atom in a non-standard valence state:
Click the Check valences check box in the
Registration section.
To have ChemBioFinder 12.0 confirm when
you are about to modify data in the database:
Click the Ask to commit changes check box
in the Registration section.
ChemBioFinder 12.0 opening options
You can set ChemBioFinder 12.0 to open with
the ChemBioFinder 12.0 Opening dialog box
or to open the last form you were using.
To set the options for what ChemBioFinder
12.0 displays when it starts up:
1. On the General preferences tab:
Table 28 Startup options
If you want to...
...then
start with the
check the box next to
opening dialog box... Show startup dialog.
start by opening the check the box next to
last form you used... Reopen last form.
ChemBioFinder & BioViz
User Guide
453
Changing options with the view menu
Table 28 Startup options
If you want to...
...then
use a default script... check the box next to
Check for external
scripts
change which
select an entry from
window is on top in the Explorer tab:
the Explorer window drop-down menu.
select a different
theme
Several structure display options can be set
from the View menu, including Atom Numbers, Reaction Centers, Stereochemistry, and
Atom Maps in reactions.
To display reaction centers:
Select the View>Structure>Reaction
Centers menu option.
select an entry from
the Frame style:
drop-down menu.
2. Click OK.
Setting the recent file list size
You can set the number of files you opened
recently that ChemBioFinder 12.0 shows.
To set the list size for the most recent files
opened:
Type in a number (from 0 to 16), or press
the up and down arrows to change the
current value by one unit in the Recent file
list size: option on the General preferences
tab.
Figure 29.7Visualization of reaction centers
454
Customizing ChemBioFinder 12.0
Chapter 29
Figure 29.6Viewing reaction centers
With reaction centers shown, any bond that
changes in the course of a reaction is
colored. Additionally, any atoms that
participate in reaction centers are circled if
none of their adjacent bonds participate in
the reaction center.
To display atom-to-atom maps:
Click the View>Structure>Atom-to-Atom
Map menu option.
With atom-to-atom maps shown,
equivalent atoms in reactants and products
are colored the same.
Figure 29.8Atom-to-atom maps
These two preferences affect only the
display of reactions. Not checking the
boxes means these types are displayed as
all other atoms and bonds.
organize, and access the data and documents
you use regularly.
Favorites tree
The Favorites Tree is a user-constructed collection of file system objects. It may include
folders, subfolders, ChemBioFinder 12.0
forms, structure files, and documents of all
kinds. Its purpose is to allow you to collect,
Figure 29.9The Favorites tree
ChemBioFinder & BioViz
User Guide
455
You can open items in the Favorites Tree from
within ChemBioFinder 12.0 by double-clicking them:
Table 29 Favorites tree options
if the file is…
double-clicking will…
a ChemBioFinder
12.0 form,
open it.
a ChemBioFinder
12.0 script,
execute it.
an SD- or RDFile,
load it.
a ChemBioFinder
12.0 query,
restore it.
any other type of
document,
open it in its source
application.
3. Browse to the file you want to add, select it,
and click the Open button.
The item is added to the folder.
To rearrange items or folders in the tree:
Drag the item to a new location.
To resort a folder or subfolder alphabetically:
Right-click on the folder and click the Sort
Folder context menu command.
Toolbars
ChemBioFinder 12.0 lets you format your toolbars. You can Customize the toolbars by dragging buttons on or off.
To open the Customize dialog box:
Click the View>Toolbars>Customize menu
command.
The Customize dialog box appears.
There are two ways to add items to the Favorites Tree:
• Drag one or more files from Windows
Explorer into the Favorites window.
• Use the context menu.
To create a new folder in the Favorites Tree:
1. Point to the “parent” folder. (The new
folder will be a subfolder of this folder.)
2. Right-click and click the New Folder context menu command.
3. Type in a new name for the folder.
To add an item to a folder:
1. Point to a folder.
2. Right-click and click the New Item... context
menu command.
A File dialog box opens.
456
Customizing ChemBioFinder 12.0
Chapter 29
Figure 29.10Customizing toolbars
To add an option to a toolbar that is already in
the ChemBioFinder 12.0 window:
1. Click the Commands tab in the Customize
dialog box.
2. Locate the command and drag an option
from the Commands window to a toolbar in
the ChemBioFinder 12.0 window.
The option appears where you drop it on a
toolbar.
You can delete a button by dragging it off the
toolbar.
To return a toolbar to the default settings:
1. Click the Toolbars tab in the Customize dialog box.
The Toolbars tab appears and shows all of
the toolbars that currently appear in the
ChemBioFinder 12.0 window.
2. Click the Reset All button.
Periodic table
ChemBioFinder 12.0 features a periodic table
for data display and formula entry. Selecting
an element displays physical and historical
data.
To display the Periodic Table window:
1. Click the View>Periodic Table menu option.
Figure 29.12
2. Click an element to display its name, mass,
and other properties in the top box, and to
display its symbol in the bottom edit box.
Figure 29.11
2. Click the toolbar you want to return to
default settings, and then click the Reset
button.
The toolbar in the ChemBioFinder 12.0
window changes to the default settings.
To return all the toolbars to the default settings:
1. Click the Toolbars tab in the Customize dialog box.
The Toolbars tab appears and shows all of
the toolbars that currently appear in the
ChemBioFinder 12.0 window.
By clicking different elements and numbers
sequentially, you can create a molecular formula in the bottom editable text box. You can
then paste this formula into the form for a formula query.
To copy a formula from the Periodic Table to
the form:
1. Drag the text to copy, and then press
Ctrl+C.
2. Click OK in the Periodic Table window to
close it.
3. In the form, click the formula box into
which you want to paste the text and press
Ctrl+V.
ChemBioFinder & BioViz
User Guide
457
To display data about the selected element in
the Element Editor, do one of the following:
• Display the desired element and click the
display box at the top of the Periodic Table
window.
• Double-click the desired element button.
can be easily edited with a text editor or spreadsheet program if you want to change default
data values.
Embedding ActiveX controls
You can embed most windowed ActiveX controls on a form. For stand-alone controls, you
can embed the control and use it immediately.
If the control needs programming, or if you
want the control to manage ChemBioFinder
data, you will need to customize its behavior
using Python scripts.
To embed a control:
Figure 29.13
The Element Editor displays properties of the
selected element. The color of the element is
shown in the periodic table for that element
and in any structure data boxes in which that
element is present.
To change the color of an element:
1. Click the Color button in the Element Editor
2. Select a color from the Color dialog box
and click OK.
3. Click OK in the Element Editor.
To reset an element’s color to the default:
Click Revert to Default in the Element
Editor.
NOTE: The data of the Periodic Table is stored
in a tab-delimited ASCII file called CS ChemBioFinder 12.0 Custom Elements.txt located in
your ChemBioFinder 12.0 system directory. It
458
Customizing ChemBioFinder 12.0
Chapter 29
1. Select the Control box tool on the Forms
toolbar.
2. Drag a rectangle on the form.
The Insert Control dialog box appears.
3. Select a control from the list.
The control appears in the Control box.
Figure 29.14Adding a spreadsheet to a form
NOTE: Not all controls listed are suitable for
use in a Control box, but appropriate error
messages should be displayed in such cases.
Customizing controls
The behavior of an embedded control can be
customized by adding Python scripts to the
form to perform custom actions at given times.
The control can be accessed via the Automation interface through the Control property of
the corresponding Box object, which is
obtained from the Boxes collection of the Document object.
Contact CambridgeSoft support at
http://www.cambridgesoft.com/services
for information on using the Automation interface.
Scripting
CAL
ChemBioFinder 12.0 is equipped with its own
scripting language, the ChemBioFinder Automation Language (CAL). CAL is used to operate the program from the keyboard, or to create
custom scripts for automating simple operations such as switching between forms or sending data to Microsoft Excel.
CAL scripts are stored in text files, with their
pathnames stored in forms. In ChemBioFinder
12.0, you have the option of storing scripts
directly in form files. Scripts created in ChemBioFinder 12.0 are stored internally by default.
When you open a form which references external script files, you will be prompted to store
the script internally.
If you choose to convert the external script
files to internal, the scripts will be saved when
the form is saved, and the original script files
may be deleted. Scripts originally saved as
internal may be also be saved externally.
If you choose to leave the form unmodified,
the alert will continue to show up every time
the form is opened.
To suppress the prompt:
1. Click the File>Preferences... menu command.
2. Click the General tab.
3. Deselect the Check for external scripts
check box, then click OK.
To execute CAL commands:
1. Click the Scripts>Command Line menu
command.
The Enter CAL Command dialog box
appears.
2. Type in a single CAL command.
Click the Help button to see CAL Scripting
Help.
3. Click the Execute button to run the command.
You can keep entering commands, one by
one.
4. When you have finished running commands, click the Done.
The Command drop-down list contains previously entered commands.
To rerun a previously entered command:
1. Select the command from the list.
2. Click the Execute button.
For detailed information about the command
language, see “CAL Commands” on page 499.
TIP: You can save the form with a different
name, and the original will remain untouched
(in which case deleting the script files would
not be a good idea).
ChemBioFinder & BioViz
User Guide
459
Getting CAL help
To display information about the CAL scripting language:
Click the Help button in the Enter CAL
Command dialog box.
The CAL Scripting Help window appears
containing commands, variables, and
syntax notes.
3. Right-click and click the Edit Script context
menu command.
The CAL editor appears.
Figure 29.16The ChemBioFinder 12.0 script editor
4. Type in your script commands, or use the
Import button to import an existing script.
5. Click OK to create a new file.
Figure 29.15CAL help window
TIP: In ChemBioFinder 12.0 this window is
resizable.
Creating a script
To create a script:
1. Create a button on a form.
2. Label the button.
460
Customizing ChemBioFinder 12.0
Chapter 29
TIP: You can still create scripts in Notepad or
another text editor if you wish. Save the file with
extension .cfs in the …C:\Documents and Settings\All Users\Application
Data\CambridgeSoft\ChemOffice 2009\ChemBioFinder\System (windows) and C:\Program
Data\CambridgeSoft\ChemOffice 2009\ChemBioFinder\System(Vista) subdirectory if you
want the name of the script to appear on the
Scripts menu.
The CAL editor is a simple, resizable textentry window. It accepts carriage returns and
tabs. To copy /paste, use Ctrl+C/Ctrl+V. To
undo or redo (last change only) use Ctrl+Z.
The Verify button runs the script through the
CAL command parser. The parser checks only
that lines begin with recognized keywords, so
just because a script is parsed without error
does not mean it will run correctly.
The Properties button displays a dialog box
used to specify whether the script is to be
stored in an external file or internally, and to
provide a file path or script name. You can
assign a script any name you like, but the name
must be unique among scripts on the current
form.
The OK button saves the script. The Run button
saves the script and runs it.
To execute a script not assigned to a button:
Choose the script from the Scripts menu.
NOTE: To execute a script that does not
appear on the menu, use the Command line and
enter “Call <script filename>”.
Debugging a script
You can step through a script line-by-line
when debugging it.
To view a script line-by-line:
1. Click the Scripts>Command Line menu
command.
The Enter CAL Command dialog box
appears.
2. Type “step on” and click Execute. This
turns on the step mode, where each step is
displayed.
3. Run a CAL script by doing one of the following:
Table 30
If your script
appears in the
Scripts menu.
Then
choose the appropriate script.
Table 30
If your script
does not appear in
the Scripts menu.
Then
type call and the name
of your script in the
Enter Script
Command dialog box,
then click Execute.
4. Press any key except Escape to execute the
command and go to the next command.
As each step is encountered, it is displayed
in the status line.
5. Press the Esc key to stop debugging the
script.
6. Type step off in the Enter Script Command
dialog box, to exit the debugging mode.
Trigger scripts
Trigger scripts run in response to certain predefined events. A trigger script can, for example, automatically load a box with data
calculated from the contents of another box
whenever you move to a new record.
You access a trigger script from the Run script
on listbox in the Form tab of the Properties dialog box. The listbox shows the available trigger events, and allows you to create, edit,
enable, or disable scripts for each event.
To run a script on an event:
1. Right-click in the form and click the Properties... context menu command.
2. Click the Form tab.
3. Click the check box of the desired event in
the Run script on: list box. If an event is not
checked, no script will run on that event,
even if one is available.
ChemBioFinder & BioViz
User Guide
461
4. Click the event name to highlight the row of
the listbox. (Clicking in a check box does
not select the row.)
5. Click the Edit button to write or edit the
script in the CAL Editor.
6. Click OK to return to the form.
The script will automatically be executed at
the specified event.
7. Click OK in the Box Properties dialog box.
8. Save the form if you wish to keep the
changes.
Python™
A Python interpreter is embedded in ChemBioFinder 12.0— the language components reside
outside ChemBioFinder 12.0 as well as available from within it and appear to be built in. In
the same way you can develop complex macros inside Microsoft Word or Excel using
Visual Basic, you can develop scripts inside
ChemBioFinder 12.0 using Python.
The Output window facilitates Python in
ChemBioFinder 12.0 The script editor is used
with either CAL or Python. It’s default configuration is Python interactive.
About Python
Python is a full-featured, cross-platform programming language used to develop applications, controls, DLLs, command-line utilities,
and so forth. The language is Open Source,
maintained and supported by a large community of developers.
Python is available in ChemBioFinder 12.0 in
the same ways as CAL. In both cases, a script
can:
• be connected to and activated from a button, form trigger event, or hyperlink in a
subform table.
462
Customizing ChemBioFinder 12.0
Chapter 29
• be developed and executed in command
mode, one line at a time.
• provide direct access to data in boxes on the
ChemBioFinder form.
• be saved to an external file or stored internally in the form.
But Python is far superior to CAL in many
ways:
• Python is a complete programming language, not just a set of commands. It allows
calls to system functions, access to databases, OLE Automation, file I/O, program
flow control, data structures, object-oriented and structured programming, and all
other features offered by a modern language.
• Python can be developed interactively in
the ChemBioFinder 12.0 Script Editor, a
development environment similar to IDLE,
PythonWin, and others. This environment
combines line-by-line execution with program construction, convenient for development and debugging.
• Python scripts can operate ActiveX controls
that is also available in ChemBioFinder
12.0 form boxes.
• Python communicates with ChemBioFinder
12.0 via OLE Automation, allowing it to
access documents, record sets, data, form
boxes, structures, CAL commands.
• Python in ChemBioFinder 12.0 is integrated with ChemScript®, the chemical
structure processing language from
CambridgeSoft. ChemScript is an extension
to Python which allows carrying out
detailed analysis or manipulation of molecules, reactions, and models.
Creating a script
A ChemBioFinder 12.0 form can contain a collection of scripts, both CAL and Python. Each
is connected to the form in one of three ways,
depending on how the script will be executed.
To create a script, first decide how it will be
called.
To create a script activated by a button:
1. Create a button on the form.
2. Right-click the button and click the Edit
script context menu command.
The script editor window opens for script
entry.
3. Click OK when you have completed the
script.
The script is executed when the button is
clicked.
TIP: You must toggle out of layout mode to use
the button.
To create a script connected to a trigger event:
1. Open the Box Properties dialog box, and
click the Form tab.
2. Select an event in the Run script on: box by
clicking the check box next to it.
3. Click the Edit... .
The script editor window opens for script
entry.
4. Click OK when you have completed the
script.
The script is executed when the event
occurs.
To create a script linked to a subform table:
1. Right-click on the subform name to open
the Subform Properties dialog box.
2. Enter a name in the Table script: text box,
then click the Edit... button.
The script editor window opens for script
entry.
3. Click OK when you have completed the
script.
The subform contents are displayed in
hyperlink style (blue, underlined). Clicking
any link executes the script.
The script editor
There is a single script editor for all scripts,
CAL and Python. The contents change to
match the script being edited. This is a change
from the CAL editor in earlier versions, where
you could have a separate window for each
script. The editor is modeless, that is, it stays
on the screen when you switch to work in
ChemBioFinder 12.0. To close the script editor, click OK or Cancel.
The editor has three modes:
• CAL – for developing CAL scripts. Use the
Verify button to check syntax; Run to test
the script.
NOTE: To work with CAL interactively, do not
use the script editor. Use the command box that
appears when you click the
Scripts>Command Line menu command.
• Python – for editing Python scripts. As in
CAL mode, you can view or edit a script
and click Run to test it. When you switch
into this mode, prompts are removed.
• Python Interactive – for interactive development of Python scripts. In this mode, you
can enter Python commands and execute
them one at a time, or click Run to test the
script.
The buttons on the script editor are as follows:
ChemBioFinder & BioViz
User Guide
463
• Verify – checks a CAL script for syntax
errors. This button does not apply to
Python.
• Run – executes a script; used for testing.
• Import... – loads a new script from a text
file.
• Properties... – Opens a dialog box with two
options: save script internally (with the
ChemBioFinder 12.0 form) or save script as
an external text file.
• Help – opens the CAL Help window or
Python manual.
Interactive mode
The Python Interactive Mode is modelled on
standard Python environments such as IDLE
and PythonWin. In this mode:
• Type cfhelp for a page of tips and samples of
ChemBioFinder 12.0-specific programming.
• At each new line, the window shows the
Python prompt (>>>). After the prompt,
you can enter any Python command, then
press Enter. The command is executed
immediately, and a new prompt is displayed
on the next line.
• The first time you execute a command in
the window, there is a short delay while
Python is initialized. If it is not already visible, the Output Window then opens, showing a ChemBioFinder header and the output
of your command.
• If the line you enter ends with a colon, then
it is taken as the beginning of a compound
(multi-line) statement. After you press
Enter, the next line begins with the continuation prompt (...) and is indented. The statement is not executed until you press Enter
twice in a row, that is, you must enter a
464
Customizing ChemBioFinder 12.0
Chapter 29
blank line to terminate the compound statement.
• You can execute commands other than the
one you just typed. Position the cursor on
any line and press Enter. The command
under the cursor is executed. If the line is
part of a compound statement, the entire
statement executes. Afterwards you are not
given a new prompt, and the cursor does
not move (unless it was positioned at the
end of the line, in which case it inserts a
new line and moves to it).
• If you copy text into the window, it is not
automatically executed. You can execute
pasted code a line at a time by positioning
the cursor on each line and pressing Enter.
• If you switch from interactive to standard
Python mode, all prompts are removed and
the text is shifted left. Line-by-line execution is then disabled, and you can edit the
text freely.
The output window
The output window is a dockable window for
displaying output from scripts. The window
comes up automatically the first time it is
needed. The text in the window is not editable,
but can be copied to the Windows Clipboard
for pasting into other applications. Standard
keyboard accelerators such as select all
(Ctrl+A) or copy (Ctrl+C) can be used.
To generate output in the window from a CAL
script, use the OUTPUT_STR command.:
OUTPUT_STR string or phrase
which echoes string or phrase into the window, followed by a carriage return. The string
should not be quoted.
The string goes through the CAL translator and
may be modified with regard to spacing or
internal quoting. To prevent translation and
have the string taken verbatim, precede it with
a backslash character:
OUTPUT_STR \use this
as written
Output from a Python script uses the same
mechanism.
To copy text or clear the output window:
Right-click anywhere in the window and
choose the desired command from the
context menu.
# Created Wednesday, November 01,
2006, 10:55 AM
# Loop records printing name and
formula
from win32com.client import GetActiveObject
cfapp = GetActiveObject("ChemFinder11.Application")
Programming in Python
A description of the Python language is
beyond the scope of this manual. However, to
learn more about Python, you will find numerous books and Internet resources on Python, as
well as the Python Help file. This section covers programming topics with specific application to ChemBioFinder.
Python operates on your data through the
ChemBioFinder OLE Automation interface.
This interface provides external access to a
library of the objects you work with in ChemBioFinder – application, document (form),
recordset, fields, boxes, and others. The interface is documented on the ChemBioFinder
SDK site. You may find it more convenient,
however, to use an object browser to see the
library in its current form.
To illustrate, we will develop an example
Python script. Suppose you have a form open,
you perform a search, and get a hitlist. You
would like to generate a report that contains a
set of records in formatted blocks showing specific data items.
You can perform this task using the script
shown below. You can copy and paste the
script into the Script Editor to try it or use it as
a template:
# ChemFinder Python script 'Generate Report'
cfdoc = cfapp.ActiveDocument
cfrset = cfdoc.Recordset
namefield = cfdoc.Fields("molname")
fmlafield = cfdoc.Fields("formula")
recno = 1
cfrset.MoveFirst()
while (not cfrset.EOF):
molname = cfrset.Value(namefield.index)
formula = cfrset.Value(fmlafield.index)
print 'Rec',str(recno),': Name
=',molname,'; Formula =',formula
cfrset.MoveNext()
recno = recno + 1
namefield = 0
ChemBioFinder & BioViz
User Guide
465
fmlafield = 0
cfrset = 0
cfdoc = 0
cfapp = 0
Notes
• Lines 1-2: Comments beginning with # are
ignored. ChemBioFinder generates lines
like these whenever you create a new script.
• Line 3: It's a good idea to add your own
comment telling what a script is designed to
do.
• Line 4: Import statements are used to
declare and execute code from external
Python modules. This one says we want to
use a specific routine (GetActiveObject)
from a module in the Win32 extension
library (win32com.client).
• Lines 5-7: Obtain the currently-running
ChemBioFinder application object -- the
one from which the script was launched -along with its active document and recordset. Assign them variable names.
• Lines 8-9: Identify the fields to be included
in the report, and get corresponding field
objects from the document.
• Lines 10-11: Prepare to loop records. Calling MoveFirst ensures that you loop the
entire list. If you omit this or comment it
out, the loop begins at the current record.
• Line 12: Begin the loop, go until the recordset reaches EOF after the last record. A
colon at the end of a line indicates it is the
first of a compound statement.
466
Customizing ChemBioFinder 12.0
Chapter 29
• Lines 13-14: Retrieve data, using the Value
method of the recordset.
• Line 15: Format and output the record data.
Our simple example just prints a line to the
output window.
• Lines 16-17: Proceed to the next record.
• Lines 18-22: Objects created in a script
must be freed before leaving. Without this,
you may find it impossible later to exit
ChemBioFinder. An object can be freed by
setting it to zero.
Rec 1 : Name = Bromobenzene ; Formula = C6H5Br
Rec 2 : Name = 3-Bromobenzoic acid
; Formula = C7H5BrO2
Rec 3 : Name = 6,6'-Dibromoindigo ;
Formula = C16H8Br2N2O2
Rec 4 : Name = 3-Bromophenol ; Formula = C6H5BrO
Caveats
• Subforms are not supported by the CF
Automation interface. If you need to work
with subform data, you will have to use
CAL for the time being.
• Running Python scripts cannot currently be
interrupted. Be warned before trying the
above script on a long hitlist! Once it starts
running, it will not stop until finished or
until you kill ChemBioFinder in Task Manager. We are working on this problem.
• If after you have run a script, you try to exit
ChemBioFinder and it refuses to exit, it
means the script created a ChemBioFinder
object and failed to release it.
Methods of communication
There are two general methods of communicating with other Windows applications such
as Microsoft Excel: by using a script within
ChemBioFinder 12.0, or by using a Visual
Basic procedure within the other application.
The following is an overview of each method.
Using scripts
A ChemBioFinder 12.0 (CAL) script can communicate with other Windows applications
using either of two commands:
EXEC—to start an application and possibly
pass information on the command line.
DDE—to communicate using Dynamic Data
Exchange with a DDE-ready application.
Using EXEC is straightforward, but limited.
You can start all Windows applications by this
command. Most can be passed a filename on
the command line, such that the specified file
is opened (or printed) on startup. A few applications can accept more detailed instructions.
Consult the application’s manual for information about how it can be operated using the
command line.
If you have Visual Basic or similar programming language, you can extend the power of
EXEC. You can write an application using the
advanced features of Visual Basic, and then
call the application from within ChemBioFinder 12.0 using the EXEC command.
Using DDE is more complicated. You can
operate most Microsoft Office components and
many other programs to varying extents with
DDE. For example, practically every command on the Excel menu can be executed by
DDE. The syntax is rather difficult, but can
usually be worked out by experimenting and
consulting ChemBioFinder 12.0 help. An
example is given below.
DDE is the most direct way of using Excel to
view data from ChemBioFinder 12.0.
To use MS Excel to view ChemBioFinder 12.0
data:
1. Start MS Excel. You can start it manually
using a CAL script or by starting the application in Windows.
2. In ChemBioFinder 12.0, obtain the hit list
you want to transmit to Excel. If you want
to work with the entire database, click the
Search>Retrieve All menu command.
3. Execute a short CAL script (below) which
exports the hit list as comma-delimited text
to a temporary file, then instructs Excel
with DDE to load that file into a spreadsheet.
4. Activate Excel to work with the data in the
spreadsheet.
This procedure takes data one way, from
ChemBioFinder 12.0 to Excel. Returning modified data from Excel to ChemBioFinder 12.0
can be done using other techniques described
in this chapter.
Here is a script to start up Excel:
*RUNEXCEL.CFS – script to start
Excel
*
EXEC
“c:\msoffice\excel\excel.exe”
If the Excel program is on your search path,
you can eliminate the complete pathname and
just give the executable name (“exec
excel.exe”); if not, you may need to modify
this script to indicate where EXCEL.EXE is
located on your system.
Here is a script to transfer the current hit list
from ChemBioFinder 12.0 to Excel:
*TOEXCEL.CFS – script to send data
*to Excel
ChemBioFinder & BioViz
User Guide
467
*
WRITETEXT C:\DATA.TMP
DDE Excel System
[OPEN(“C:\DATA.TMP”)]
DDE Excel
System
[COLUMN.WIDTH(1,”C1:C4”,,3,1)]
The first line writes out the current ChemBioFinder 12.0 hit list as a temporary delimited
ASCII file. By default, all fields that appear in
boxes on the current form—except structure,
but including formula and molecular weight—
are written. The second line instructs Excel to
open the file. Excel can automatically recognize the file format as tab-delimited. The third
line instructs Excel to auto-size column widths
1–4 to fit their contents.
NOTE: This example requires that the text
export delimiter be set to TAB. otherwise Excel
may not read the file correctly. To check this,
click the File>Export menu command then
open the Text Options tab of the Data Export
dialog box.
You can include either or both of these scripts
on the Scripts menu, and you can activate them
with buttons on the form. To include a script
on the Scripts menu, give it a filename with
extension CFS, and place it in the ChemBioFinder 12.0 System directory, or in the directory containing the ChemBioFinder 12.0
application. To activate a script from a button,
label the button with a script filename or string
which can be converted into a filename. For
example, if TOEXCEL.CFS exists in the ChemBioFinder 12.0 System directory, label a button
“ToExcel” to start the script. For more information, see “Adding a button” on page 317.
468
Customizing ChemBioFinder 12.0
Chapter 29
Using Visual Basic
The second method of communicating
between ChemBioFinder 12.0 and other applications such as Excel is using OLE Automation. ChemBioFinder 12.0 is an OLE
Automation server, meaning that it offers a
collection of data management capabilities to
outside programs capable of communicating
with OLE objects. While this collection is currently fairly small, it is adequate for a variety
of data retrieval and search tasks. This feature
allows you to write a custom Visual Basic procedure that directly retrieves and manipulates
data from ChemBioFinder 12.0.
The general procedure for accessing ChemBioFinder 12.0 data from within a Visual Basic
script is as follows.
1. Create a ChemBioFinder 12.0 Document
object, typically passing a filename so that
you open a form complete with its database
connection.
2. Use methods of the Document object to
move through the database, search, and
access data. Document methods include
some that access Field objects, used to
query the data in the database, and Molecule objects, for accessing details of molecular structures.
For more information, see the CambridgeSoft
SDK web site:
http://www.cambridgesoft.com/services/documentation/sdk/
Using Microsoft Access
The methods described above for communicating between ChemBioFinder 12.0 and Excel
apply also to Access. You can start Access
using the EXEC command. You can send it
DDE commands contained in a CAL script,
although Access provides fewer capabilities
with DDE than does Excel. Or you can write
programs using Access Basic that rely on the
OLE Automation methods found in ChemBioFinder 12.0. In addition, you can use Access
directly to operate on a ChemBioFinder 12.0
database.
A ChemBioFinder 12.0 molecule database
consists of three components: the structure
storage files (with file extensions MST and
MSX), the data storage files, which include a
Microsoft Access database (file extensions
MDB and LDB), and the forms (with file
extension CFX) used to view the structures and
the data. For more information, see “Database
File Types” on page 469.
If you have Access on your system, doubleclicking an MDB file in Explorer starts up
Access and opens the specified database.
When you open a ChemBioFinder 12.0 database in Access, you will see the same tables as
displayed in the ChemBioFinder 12.0 Database
dialog box, including the main structure table
(usually named “MolTable”), but you will not
see columns for structure, formula, or molecular weight. These fields cannot be manipulated
directly using Access.
The following are some of the operations you
can perform on a ChemBioFinder 12.0 database using Access. Most of these capabilities
are not available through the current version of
ChemBioFinder 12.0:
•
•
•
•
•
•
Compress or repair the database.
Change column (field) or names or formats.
Change table names.
Add or delete columns or tables.
Import or export tables.
Load non-structural data from various file
types, including delimited ASCII, Excel, or
Word.
• Move quantities of data from one column or
row to another.
• Carry out complex queries on non-structural data.
• Permanently change the sort order of a
table.
For more information about these actions,
please consult the Microsoft Access User’s
Guide.
Do not add or delete records to the MolTable
within Access, because the data component of
the database will become out of synchrony
with the structure component.
Database File Types
ChemBioFinder 12.0 databases are supported
by a library called MstLib. This library contains a number of files for supporting the structure column. In addition, ChemBioFinder 12.0
uses additional screening files for improving
performance of search operations.
ChemBioFinder & BioViz
User Guide
469
The following table lists the various file types
used by ChemBioFinder 12.0:
Extension
Purpose
.MST
Structure Storage
.MSI
Screen: Traditional
.MSX
Screen: Traditional
.MSF
Screen: Full Exact
.MSK
Screen: Skeletal
.MSS
Screen: Similarity
.MS3
Screen: 3-D
.MSH
Screen: Hash
.CFW
ChemBioFinder Form
.CFX
ChemBioFinder Form
.CFS
ChemBioFinder Script
.MDB
MS Access database
.LDB
Locks on database
NOTE: When .MSS extension is missing, the
.MSX extension is used, but the quality of the
search is lower.
470
Customizing ChemBioFinder 12.0
Chapter 29
30
ChemFinder/Office
Overview
ChemFinder/Office lets you search data
sources (documents and databases) to find
chemical structures so that you do not need to
search manually.
Using ChemFinder/Office, you can browse the
following types of files for chemical information:
•
•
•
•
•
•
MS Word documents
MS Excel spreadsheets
ChemFinder databases
ChemDraw files
SD files
Isis/Draw files
In addition to browsing, ChemFinder/Office
can search files by:
•
•
•
•
Chemical structure
Chemical formula
Molecular weight
Draw structures you want to find with the
ChemDraw plug-in. ChemFinder/Office
can search for the whole structure, a substructure, or a structure similar to the one
you draw.
When searching by structure, you can specify a
search by:
•
•
•
•
Substructure
Full structure
Similarity
Identity
You can save frequently-used collections of
data sources (documents and databases) in
Data Source Definition (.dsd) files. Instead of
checking many data sources that you want
ChemFinder/Office to search, ChemFinder/Office can search one DSD file.
You can also generate and store combinatorial
libraries from experiments performed with
generic reactions. For more information, see
“CombiChem” on page 495.
ChemFinder/Office helps you to build databases by extracting information from various
sources and exporting to another source.
The user interface (UI)
ChemFinder/Office is installed when you
install ChemOffice Ultra. The UI window,
titled “Find Chemical Structures”, is shown in
the following illustration:
Selecting files to search
Use the File menu or the Look In tab to tell
ChemFinder/Office where to look for structures.
Chem & Bio Office 2010 User Guide 471
ChemBioFinder
Selecting files from the file menu
Use the File menu to look for a structure in a
specific file or data source:
1. Click the Look In tab.
The files and data sources appear in a tree
directory.
Administrator
1. From the File menu, choose Open.
The Open dialog box appears.
2. Select a file or data source you want to
search by doing one of the following:
• In the File Name text box, type the name
of the file to search.
• Use the directory tree in the Open window
to browse to a file to search.
3. Click Open.
When you select a single file, the first structure
in the file appears in the Structure window as
soon as you open the file. You can browse
through the file using the forward and back
arrows in the Search Record toolbar.
Selecting files with the look in tab
Use the Look In tab window to search for a
structure in multiple files. The Look In tab
window shows all the documents and databases (data sources) on your mapped network,
CD-ROM, floppy, and hard drives. You can
select entire folders to search, or multiple individual files, by using the check boxes next to
the file names.
To look for a structure in specific files or data
sources:
Figure 30.1 Files and data sources tree
NOTE: You can set Preferences to keep the file
names hidden in the directory tree. For more
information, see “Changing preferences” on
page 481.
2. In the Select files of type box, use the dropdown menu to choose types of files in
which to search.
• You can select all data sources or files with
the following extensions:
• .cdx and .mol
• .doc and .xls
• CFX
• .sdf
472
ChemFinder/Office
Chapter 30
3. Click the box next to the file(s) or data
source(s) that you want to search.
For example, you want to find a specific benzene file you saved. However, you are not sure
what part of ChemDraw you saved it in. Click
the ChemDraw box and all of the ChemDraw
files are searched.
When you have selected your data sources,
return to the Structure window by clicking the
Structure tab.
Searching by chemical
structure
From the File menu select Open, or
choose a file name from the most recently
used list of files.
For more information about opening files
to search through, see “Searching DSD
files” on page 476.
3. Click New Search.
4. Click Edit Structure.
The ChemDraw plug-in tools palette
appears.
5. Selecting appropriate ChemDraw tools,
click in the Structure window and draw the
structure you want to search for.
•
You can find chemicals based on their structure with ChemFinder/Office.
NOTE: Any search method that you use in
ChemFinder you can also use in ChemFinder/Office
N
To search by chemical structure only:
1. Open ChemFinder/Office.
The Find Chemical Structures - Data
Source window, appears.
2. Do one of the following:
• From the Look In tab, select files to
search.
Figure 30.2 Drawing a query structure
For more information about using the
ChemDraw plug-in, see the ChemDraw
User’s Guide.
6. Alternately, you can select a structure from
ChemDraw or from a ChemFinder database
and paste it in the Structure window using
the right-click menu.
Chem & Bio Office 2010 User Guide 473
ChemBioFinder
7. Click Find Now.
Administrator
NOTE: If the Find Now button is grayed out,
you have not selected a file or directory to
search. Click the Look In tab and make a
selection.
ChemFinder/Office shows all of the files
with the structure that you specify in the Hit
List window shown below. Each entry in
the Hit List is a record or a hit.
To search for other properties or more than one
property at a time:
1. Click New Search.
2. Take the appropriate action:
If you want to search then in the Structure
for...
window...
a specific molecular type a molecular
weight,
weight (g) in the
Mol. Wt. text box.
a molecular weight
within a range,
type a range of
molecular weights
(g) with < or > in the
Mol. Wt. text box.
a chemical formula,
type a chemical
formula in the
Formula text box.
more than one crite- enter the appropriate
rion (structure,
criteria.
formula, or molecular weight),
Figure 30.3 Data source window with hit list
8. Use the forward and back arrows on the
Record Search toolbar to navigate through
the hits.
If ChemFinder/Office finds no hits, a
warning message appears. To refine your
search so that ChemFinder has a greater
possibility of finding hits, use the Search
Options tab.
Searching by multiple
properties
You can search for a chemical structure, chemical formula, molecular weight, or any combination of these properties simultaneously.
474
ChemFinder/Office
Chapter 30
NOTE: When you search by chemical
structure, formula, and molecular weight,
ChemFinder/Office uses all the criteria
together. The information about each property
adds to the search criteria of the other
properties.
3. Click Find Now.
a. ChemFinder/Office shows all of the files
with the properties that you specify in
the Hit List window below the Structures window.
b. If ChemFinder/Office finds no hits, a
warning message appears.
c. To refine your search so that ChemFinder has a greater possibility of finding hits, use the Search Options tab. To
expand your search, use the Look In tab.
For more information, see “Refining
your search” on page 478.
Browsing search results
You can view the search results in the Hit List.
The Hit List displays all of the files in which
your search found matching structures.
Figure 30.4 A ChemFinder/Office hit list
To view the search results:
• To view the entire Hit List, use the scroll
bars.
• To display each hit in a given file in the
Structure window, select the file in the Hit
List and use the arrows in the Search
Record toolbar.
Figure 30.5 The Search Record toolbar
• To display the actual file double-click on a
file name in the Hit List, or right-click and
select Activate, with any of the following
extensions:
• .doc—MS Word
• .xls—MS Excel
• .cdx—ChemDraw
• CFX—ChemFinder
• The application in which the structure was
saved opens. In MS Word, the application
opens directly to the first hit in the document.
• When you view the structure in the original
application, the Hit List record is not copied
to the other application.
You can use the Hit List menu to add or
remove Hit List records.
To add or remove Hit List records with the Hit
List menu:
1. In a Hit List with records, right-click a
record.
The record is selected and the Hit List
menu appears.
2. Select Add.
The Open Chemical Structures window
appears.
3. Double click the file you want to add to the
Hit List, or type the name of the file in the
“File Name” text box.
4. Click Open.
The file appears as a record at the end of the
Hit List.
To take a record off the hit list, right-click and
select Remove.
Saving files or data sources
A data source, or file, can be any of the following:
• A document, like an MS Word document or
an MS Excel spreadsheet.
• A database, like a ChemFinder database.
• Any combination of documents or databases.
You can save search results as a file to search
through again.
Chem & Bio Office 2010 User Guide 475
ChemBioFinder
Saving search results as sdf files
Administrator
The SDF file format saves the Hit List records
as complete structures in MDL SDFile format.
You can import SDF files from ChemFinder/Office into applications like ChemFinder.
To save search results in the .sdf format after a
search:
1. From the File menu, choose Export SDFile.
The Save As dialog box appears.
2. In the “File Name” text box, type a name
for the file.
3. Click Save.
The file is saved with an .sdf extension.
For more information about exporting files to
other applications, see “Sending a file to
another application” on page 477.
Saving data sources as dsd files
After you complete a search, you can save all
the records from the Hit List as a Data Source
Definition (.dsd) file so that you can search
through them again.
You can use .dsd files to search for structures,
substructures, or structures similar to your previous search through the .dsd file.
To save the results of a search as a .dsd file:
1. After completing a search, go to File>Save
Source As. The Save As dialog box
appears.
2. In the File Name text box, type a name for
the group of files.
3. Click Save.
The files are saved with a .dsd extension.
476
ChemFinder/Office
Chapter 30
Saving lists of directory paths as dsd
files
NOTE: Only advanced users familiar with text
editors should use this procedure.
You can save lists of directory paths that you
search as .dsd files. You can create these lists
with a text editor such as Notepad. Saving a list
of directory paths as a .dsd file saves the directories in which you search frequently.
To save a list of directory paths:
1. Open Notepad or some other ASCII text
editor.
2. Type the directory or database paths you
want to search.
3. From the File menu in Notepad, choose
Save As.
The Save As dialog box appears.
4. In the “File Name” text box, type a name
for the file and include a .dsd extension.
For example, type a File Name like
“search1.dsd.”
5. Click Save.
6. Close Notepad.
Searching DSD files
To search for a structure in a DSD file:
1. From the ChemFinder/Office File menu,
choose Open.
The Open dialog box appears.
2. In the “Files of type:” text box, select Data
source definitions (*.dsd) from the dropdown menu.
3. In the “File Name” text box, type the .dsd
file name, or select the file from those
listed.
4. Click Open.
The first structure associated with the last
saved version of the .dsd file appears in the
Structure window.
5. Click New Search.
ChemFinder/Office clears the Structure
window.
6. Click Edit Structure, and draw a structure to
search for.
7. Click Find Now.
ChemFinder/Office searches through the
files specified in the DSD file. Any hits
appear in the Hit List.
Sending a file to another
application
You can send a structure or a file of structures
(like SDF files) to another application. You
can cut a single structure from an application
and paste it into another, or you can send more
than one structure directly into another application.
Use the items in the Send To menu to send
files to these applications:
•
•
•
•
•
MS Word
MS Excel
CS ChemFinder
CS ChemDraw
ChemACX.Com Search
To send a file to another application:
1. In the Data Source - Find Chemical Structures window, click the Send To menu.
The Send To menu appears.
2. From the Send To menu, choose an application to send a file to.
The Send To box dialog box appears.
NOTE: When you send files to
Chem.ACX.Com, The Send To dialog box does
not appear. The structure associated with the
file is sent directly to ChemACX.Com.
3. From the Molecules section, select one of
the following:
If you want to
Then click
send the structure
displayed in the
Structure window,
Send current molecule.
send all the strucSend all molecules
tures listed in the Hit in current hit list.
List,
4. From the Document section, select one of
the following, if available:
If you want to...
then click...
send structures to a Send molecule(s) to
new (untitled) docu- a new document.
ment in an application,
send structures to a Send molecule(s) to
a currently open
document you
already have open in document.
an application,
5. In the Document section select the name of
the file from the drop-down list, if necessary.
If the text box in the Document section is
not available, skip this step.
Chem & Bio Office 2010 User Guide 477
ChemBioFinder
6. Click OK.
Administrator
If you choose Send To MS Word or MS Excel,
the document type opens a new file or the file
whose name you entered. The structures you
send to the application appear in that application as follows:
• If you select Send all molecules in current
hitlist, ChemFinder/Office will create a
table in your document, and the molecules
in the current hitlist, along with their
molecular formulas, weights, and source
file paths, will be entered into the table.
• If you select Send current molecule, ChemFinder/Office will export only the structure.
NOTE: If you need to interrupt a long Send To
Word operation, bring ChemFinder/Office to
the front and click Stop.
To send a file to ChemFinder or ChemDraw,
you must save the file you want to send:
1. Click the Send To menu.
2. Select CS ChemFinder... or CS ChemDraw
Files.
3. Select the appropriate radio button in the
Molecules section, and click OK.
A Save As dialog box appears.
NOTE: If you have a ChemFinder CFW file
open, you have the option of selecting it in the
Document section of the Send To dialog box.
4. Type in a name in the “File Name:” text
box.
NOTE: If you are sending multiple structures
to ChemDraw, choose a base name for the files–
for example, if there are three molecules in the
current hitlist and you specify the base name
478
ChemFinder/Office
Chapter 30
“molecule”, the files will be saved as
molecule1.cdx, molecule2.cdx, and
molecule3.cdx.
5. Click Save.
If you send a file to ChemFinder,
ChemFinder opens and the file you save
appears as a form.
If you send a file to ChemDraw, a warning
appears to tell you the path of the file you
saved.
Refining your search
You can refine your search so that you have a
greater chance of finding the structure you
want. Use the Search tools and the Search
Options tab to change your query to refine
your search.
To refine your search:
1. From the Search menu, choose Restore Previous Query or click.
2. Change your query with the Search
Options.
3. Select the files and data sources you want to
search.
4. Click Find Now.
ChemFinder/Office shows all of the files
with the structure that you specify. These
files appear in the Hit List window below
the Data Source - Find Chemical Structures
window.
If ChemFinder/Office finds no hits, your
search may be too narrow and you should
broaden your search options.
Using the search tools
Some ChemFinder tools used to refine your
search can also be used in ChemFinder/Office.
To use the search tools:
• From the Search menu or Search toolbar,
take the appropriate action:
If you want to...
then click:
begin a new search,
Enter Query
1. Click the Search Options tab.
The Search Options window appears.
search for the current Find Current Query.
properties (chemical
structure, chemical
formula, molecular
weight),
see all the records in Retrieve All.
the search, including
records without a
match to your
search,
Figure 30.6 Search options
search for the struc- Find Current Structure.
ture currently
displayed in the
structure window,
but ignore any other
search properties
like molecular
weight,
restore the previous
search, so you can
modify the search
criteria,
Restore Previous
Query.
For more information about the Search tools,
see the “Searching” chapter in the ChemFinder
User’s Guide.
Refining your query
You can refine your ChemFinder/Office search
with the Search Options.
To use the Search Options:
2. Take the appropriate action:
If you want to...
then click:
require that the tetraheMatch tetrahedral
dral stereochemistry of
stereo.
the target structure match
that of the query structure,
Match double bond
require that the double
bond stereochemistry of stereo.
the target structure match
that of the query structure,
allow fragments in the
Fragments may
query to overlap (share
overlap.
one or more atoms) in the
target,
Chem & Bio Office 2010 User Guide 479
ChemBioFinder
If you want to...
then click:
Administrator
require that any reaction Hit must overlap
reaction center.
center present in the
query overlap with reaction centers in the target.
This preference applies
only to reaction
searching,
allow hits to contain
Extra fragments may
be present in hit.
molecular fragments in
addition to that which was
hit by the query,
allow uncharged carbon
atoms in the query to
match charged carbon
atoms in the target,
Match any charge on
carbon.
Charged atoms in the
query must always match
charged atoms in the
target, regardless of this
setting.
ChemFinder/Office
Chapter 30
match a relative relation- Relative tetrahedral
ship between tetrahedral stereo
stereocenters.
Changing ChemFinder/Office
settings
You can change ChemFinder/Office settings
so that ChemFinder/Office appears the way
you want. You can customize the way the
ChemFinder/Office window appears with the
items on the View menu. You can change
some of the ChemFinder/Office display features with the Preferences window.
Use the View menu to change the appearance
of the ChemFinder/Office window.
To use the View menu:
allow uncharged atoms in Match any charge on
the query to match
heteroatom.
charged atoms in the
target,
480
then click:
Customizing the window
Charged atoms in the
query must always match
charged atoms in the
target, regardless of this
setting.
allow a query drawn as
absolute (hash/wedge
bonds) to hit a target
stored as relative.
If you want to...
Absolute center hits
relative
1. In the Data Source - Find Chemical Structures window, click the View menu.
The View menu appears.
2. Take the appropriate action:
If you want to...
then, from the View
menu,...
show the Standard
toolbar,
make sure the box
next to the Toolbar
option is checked.
show the Status bar, make sure the box
next to the Status bar
is checked.
If you want to...
then, from the View
menu,...
2. Take the appropriate action:
If you want to...
hide the Status bar,
click Status bar.
The status bar disappears.
click Show List.
show the Hit List,
which shows all of
the places that
ChemFinder/Office
has found the structure you want to find,
This option only
appears when the list
is hidden.
hide the Hit List,
click Hide List.
choose a specific
directory for the
Look In tab to open, type the path in the
Startup directory text
This setting does not box or click to
browse to a file in the
affect any query
Startup directory.
properties.
specify the number
of most recently
open files to show in
the File menu,
This option only
appears when the list
is showing.
customize features,
including:
Commands, Toolbars, Menu, and
Keyboard options,
then...
click Customize.
The Customize
window appears.
This is a standard
Windows feature.
For more information, see the MS
Word online Help.
Changing preferences
To change the ChemFinder/Office preferences:
1. From the File menu, choose Preferences.
The Preferences window appears.
type the number or
click the Up and
Down Arrows in the
“Number of recently
used files to show on
File menu:” box to
set a whole number
from zero to 10.
open the last file you click Reopen last
used when you start source on startup.
ChemFinder/Office,
show all files in the
directory tree,
click Show files in
directory tree.
use the ChemDraw
ActiveX control to
draw and edit structures,
click the ChemDraw
style radio button.
open ChemDraw to
draw and edit structures,
click ChemFinder
style radio button.
3. Click OK.
The Preferences window closes.
Chem & Bio Office 2010 User Guide 481
ChemBioFinder
Administrator
482
ChemFinder/Office
Chapter 30
A
Structural Query Features
To perform a substructure search in
ChemBioFinder, you must first draw the query
structure itself. Query structures can be drawn
in many different programs, but we recommend using ChemDraw, and this Appendix is
focused on using ChemDraw to draw query
structures. For more information about the
structure drawing and query capabilities of
ChemDraw, please consult the ChemDraw
User’s Guide.
ChemBioFinder does its best to follow your
instructions even if those instructions are contradictory. For example, you can create a query
such as the following:
•
•
•
•
•
•
Bond
Substituents
Charges and radicals
Isotopes
Stereochemistry
Normalization
Atoms
Atom types specified in the query must match
atoms at corresponding positions in the target.
Hydrogen is an exception—see “Substituents”
on page 484.
Bonds
All bonds explicitly drawn in the query must
match in the target. For certain caveats, see
“Stereochemistry” on page 486 and “Normalization” on page 488. ChemBioFinder recognizes the following standard bond types:
1- This bond must not be in ring
That bond is already in a ring, so ChemBioFinder returns no hits for this query.
Bond Type
Description
Single
target must have single bond
here
General properties
ChemBioFinder allows the following general
properties to be assigned to a query:
• Atom
ChemBioFinder & BioViz
User Guide
483
Bond Type
Description
Dashed
same as Single
Hashed
same as Single
Thick
same as Single
Wedged
Hashed
specifies stereochemistry
down from the point end to the
wide end
Wedged
specifies stereochemistry up
from the point end to the wide
end
Wavy
specifies stereochemistry
“either” at both ends
Hollow
Wedged
same as Wedged
Dative
same as Single
Double
target must have double bond;
stereo dictated by geometry
Double Either
target must have double bond;
any stereochemistry ok
Double Bold
same as Double
Triple
target must have triple bond
here
Substituents
In ChemBioFinder, a substituent is defined as a
non-hydrogen atom connected by a bond of
any order. For example, a carbonyl oxygen is a
substituent of the carbonyl carbon.
484
Structural Query Features
Appendix A
All unfilled valences in the query may be filled
by hydrogen atoms or by non-hydrogen substituents. The normal valence of an atom is
determined from data in the Periodic Table
window. For example, carbon has a valence of
4, while sulfur has valences of 2, 4, and 6. Any
explicit charges, radicals, or query properties
modify the normal valence. For example, a
carbocation has a valence of 3.
Hydrogen atoms in the query may match nonhydrogen substituents in the target if the hydrogen in the query is implicit on an unlabeled
carbon atom or heteroatom. This is the default
setting.
Hydrogen atoms in the query must match
hydrogens in the target when the query hydrogen is at the end of an explicit bond. The
matched hydrogen in the target may be implicit
in an unlabeled carbon atom.
The following query with explicit hydrogens:
Finds any of:
Does not find any of:
Finds any of:
Charges and radicals
Does not find any of:
Charges or radicals specified on atoms in the
query must match those in the target.
Uncharged atoms in the query may or may not
match charged atoms in the target, depending
on the state of the appropriate check box in the
Search tab of the Preferences dialog.
The valence of a charged atom is taken to be
the valence of the isoelectronic neutral atom.
With a substructure search, the query with
charge or radical:
Isotopes
Isotopic labels specified in the query must
match the target. Unlabeled atoms in the query
match unlabeled or isotopically labeled atoms
in the target. Additionally, D is treated interchangeably with 2H, and T is treated the same
as 3H.
With a Substructure Search, the Isotopic query:
ChemBioFinder & BioViz
User Guide
485
Finds any of:
When evaluating a possible match, the following rules are applied:
• Unspecified stereochemistry (a plain bond)
may match any stereochemistry (either a
wedged, hashed, bold, or a plain bond).
• Specific bond types need not match as long
as the overall stereochemistry at a given
atom does match.
• Implicit hydrogens are taken into consideration in both the query and the target if
doing so helps to determine the chirality of
a stereocenter.
Does not find any of:
With a full structure search and the Match Tetrahedral stereo option selected, the query with
stereochemistry:
Finds any of:
Stereochemistry
Stereochemistry specified on the query must
match the target if the relevant Match Stereo
item is selected in the Search tab of the Preferences. Stereochemistry is specified at a tetrahedral site by using stereo bonds (up, down,
either). Stereochemistry about a double bond is
specified by the geometry of the drawing.
ChemBioFinder cannot currently interpret
other stereochemistry types (allenic, square
planar, octahedral, etc.) and ignores them during a search.
Does not find any of:
486
Structural Query Features
Appendix A
reochemistry is specified in the query must
match that of the target. If the query has relative bonds and RTS is activated, a hit must
have the same relationship between centers.
You can use the following three flags in
searches based on relative stereochemistry:
• Abs: Refers to the Absolute flag. It matches
the exact stereoisomer, as drawn.
Example:
Relative tetrahedral stereochemistry
Relative Tetrahedral Stereochemistry, or RTS,
specifies a given relationship between the centers. That is, a known orientation of the substituents with respect to each other, rather than a
known absolute configuration. To specify this,
centers are drawn, not with the standard hashed
and wedged bonds, but with thick (bold) stereo
bonds.
Relative and absolute configurations may be
registered separately in ChemBioFinder, and
can be distinguished by various search options.
The basic ChemBioFinder search philosophy
can be summarized as follows: a more specific
query is a more precise request, and should get
fewer hits than a more general query. If the
query represents a particular absolute configuration, it should hit only that; if it represents a
mixture, it should hit any of the components.
If you choose Same in the stereo search
choices, you are requesting that whatever ste-
• Rel: Refers to the Relative flag. It matches
the exact stereoisomer, as drawn, or its
enantiomer.
Example
ChemBioFinder & BioViz
User Guide
487
• Rac: Refers to the Racemic flag. It matches
a mixture of the exact stereoisomer, as
drawn, and its enantiomer.
Example
MDL file formats
All bond styles available in ChemDraw are
retained in CDX files. The same is not true of
major MDL structure files: MolFiles, SDFiles,
and RDFiles. In these formats, only three stereo bond types are available: hash, wedge, or
either (squiggly bond); thick bonds are not recognized. This presents a problem for the
ChemBioFinder user wishing to import or
export structures having relative stereocenters.
ChemBioFinder addresses this problem by
using a proprietary tag in the file, recognized
only by ChemBioFinder. The tag is
BOND_RELS, and is applied to every stereo
bond of thick type. For example, here is an
excerpt from the bond table of a molfile with
relative bonds.
...
4510000
2611000
<- bond 5, marked as UP
4711000
<- bond 6, marked as UP
488
Structural Query Features
Appendix A
M CFW 5 BOND_RELS
<- overrides type
of bond 5 to be UP/THICK
M CFW 6 BOND_RELS
<- same for bond
6
The consequences of having a ChemBioFinder-only tag are:
• When any of the MDL file formats is saved
from within ChemBioFinder, the tag is
written. Reading these files back into
ChemBioFinder will retain the thick bond
types.
• If a structure is drawn in ChemDraw and
saved as MDL Molfile, thick bonds are lost,
and are converted to normal hash/wedge
bonds. (This is not true if the file is saved as
CDX).
• If a structure is saved as molfile from
ChemBioFinder, reading it into ChemDraw
loses the thick bonds.
• Mol- or SDFiles obtained from ISIS or
other programs do not know about this tag,
and thus cannot convey thick bonds. However, such files may be edited by hand to
include the ChemBioFinder tag.
• An MDL file written by ChemBioFinder,
containing tags, should in principle be readable by any program which can import such
a file. The unrecognized tags should simply
be ignored.
Normalization
Closed rings of alternating single and double
bonds are “normalized”. This is required to
make their substituents equivalent. (Orthodimethylbenzene is remains same whether
there is a single or double bond between the
two substituted ring atoms.)
In a substructure, non-tautomeric query, the
following query:
Atom properties
ChemBioFinder allows special atom properties
to be assigned to an atom in a query. These
properties are usually only meaningful during
a search. They generally serve to broaden or
narrow the scope of the search.
Special atom types
will get the following hits:
and will NOT hit the following:
ChemBioFinder recognizes six special atom
types that can match any one of a predefined
set of elements:
• A matches any non-hydrogen atom.
• Q matches any heteroatom (non-hydrogen,
non-carbon).
• R matches any atom, including hydrogen.
Also used to indicate a link node. See “Link
nodes and multivalent Rs” on page 386 for
details. A link node may be any number of
atoms, including zero.
• X matches any halogen (F, Cl, Br, I, At).
• M matches any metal atom, shaded in the
periodic table below:
Table 31 Normalized query
Changing the scope of a search
When preparing a chemical structure to be
used in a query, there are two ways to broaden
or narrow the scope of the search:
• Specify atom or bond properties
• Specify atom or bond Special Types
In general, properties narrow a search and special types may either narrow or broaden the
search.
Figure A.1 Metals in the periodic chart
ChemBioFinder & BioViz
User Guide
489
Atom lists
Finds any of:
As with the predefined special atom types, an
atom list is a list of atoms, one of which must
match the target atom.
For example:
[Cl,Ag,N] atom must be Cl or Ag or N
Atom lists may contain only elements. Special
atom types, nicknames (Ph), and structural
fragments (NH2, OCH2CH3) may not be
included in an atom list. ChemBioFinder recognizes a maximum of five atoms in an atom
list.
Atom not-lists
The opposite of an atom list is a list of atoms,
none of which must match the target atom. For
example:
[NOT O,S,Se] atom must not be O or S or Se
(but may be any of the 100 other elements)
Atom not-lists have the same restrictions as
atom lists.
Does not find any of:
Substituents: exactly
This property specifies a precise value for the
number of substituents on an atom, including
those explicitly drawn. This property is only
meaningful in a substructure search.
With a substructure search, the query:
Substituents: up to
1- This atom is marked with the atom property,
Substituents Exactly:3.
490
Structural Query Features
Appendix A
This property specifies a maximum value for
the number of substituents on an atom, including those explicitly drawn. This property is
only meaningful in a substructure search.
With a substructure search, the query with substituent up to property:
1- This atom is marked with the atom property
Substituents Up to:2.
Finds any of:
Substituents: free sites
The Substituents: Free Sites property specifies
the maximum number of additional substituents that may be present on an atom. This property is only meaningful in a substructure
search.
TIP: Specifying Free Sites: 0 is a quick way to
indicate that you want no further substitution at
a site. Target structures will match the query
structure as drawn, with no additional ligands.
With a substructure search, the query with free
sites property:
1- This atom is marked with the atom property
Substituents Free Sites:2.
Finds any of:
Does not find any of:
ChemBioFinder & BioViz
User Guide
491
Does not find any of:
This property is only meaningful in a substructure search.
With a substructure search, the query:
1- This atom is marked with the atom property
Unsaturation: must be present.
Finds any of:
Implicit hydrogens
This atom property may have either of two values: Allowed (default) or Not Allowed. If
implicit hydrogens are Not Allowed, the atom
must be fully substituted in the target.
This property is only meaningful in a substructure search.
NOTE: This atom property does not affect the
display of implicit hydrogens, only their presence in a search. For more information about
displaying implicit hydrogens, see “Setting
preferences” on page 451.
Does not find any of:
Unsaturation
Sometimes it is useful to specify that an atom
must or must not be attached to unsaturated
(aromatic, double, or triple) bonds. ChemBioFinder allows searches for atoms whose unsaturation Must Be Absent (all bonds to the atom
are single). It also allows searches for atoms
with at least one multiple (double, triple, or
aromatic) bond. The default value, Undefined,
finds targets without regard to the hybridization of the atom.
492
Structural Query Features
Appendix A
Bond properties
ChemBioFinder allows special properties to be
assigned to bonds in a query. These properties
usually will only be meaningful during a
search. They generally serve to broaden or narrow the scope of the query.
Special bond types
Bond Type
Description
Aromatic
target bond must be aromatic as
defined by the Hückel 4n+2 rule
Any
target can have any bond type
here
S/D
target must have a single bond or
a double bond here
Tautomeric
same as S/D
D/A
target must have a double bond
or an aromatic bond here
S/A
target must have a single bond or
an aromatic bond here
The table below describes the special bond
types that ChemBioFinder allows.
Topology
If Ring or Chain is chosen, the target bond
must or must not be in a ring, respectively.
Reaction center
The reaction center refers to those bonds that
are directly affected by a reaction. This property allows you to specify just how a given
bond is affected.
Property
Description
Unspecified
target must have a bond
here, but the bond can
participate in the reaction in
any fashion, or not at all
ChemBioFinder & BioViz
User Guide
493
Property
Description
Property
Description
Center
target must have a bond
here that directly participates in the reaction in
some way
target must have a bond
here that is either made (if
in a product) or broken (if
in a reactant)
Not Center
target must have a bond
here, and that bond must not
participate in the reaction
Not Modified
target must have a bond
here, and regardless of
whether it is part of the
reaction center or not, its
order must not change over
the course of the reaction
Make/Break
Change
Make&Change
494
target must have a bond
here whose bond order
changes over the course of
the reaction, but is not made
or broken
target must have a bond
here that is either made (if
in a product) or broken (if in
a reactant) or whose bond
order changes over the
course of the reaction
Structural Query Features
Appendix A
This property is only meaningful when searching a reaction database.
B
Formula Input Rules
When you type a formula in ChemBioFinder,
you are not required to enter symbols in any
particular case. This can give rise to ambiguities. This appendix describes how ChemBioFinder interprets formulas and resolves these
ambiguities.
Consider an example. In entering a formula
query, you type “cooh”
Most chemists recognize this as a carboxyl
group: carbon, two oxygens, hydrogen. However, it might be interpreted as cobalt (Co),
oxygen, hydrogen. Similarly, “CLI” might be
carbon-lithium or it might be chlorine-iodine.
“PHE” might be phosphorus-helium or, since
ChemBioFinder allows 3-character amino-acid
symbols as special atom types, it might be phenylalanine (Phe).
One way to avoid ambiguity is to separate letters with spaces. For example, the string “c o”
cannot possibly be interpreted as cobalt.
Another way to avoid ambiguity is to enter formulas using the Periodic Table instead of typing them. ChemBioFinder allows free-format
input, and attempts to make the most reasonable interpretations of them by using the rules
described below.
Rules
If a symbol is properly capitalized (first letter
upper case, followed by zero, one, or two
lower-case letters), then the longest valid symbol which matches is preferred. Thus “Phe”
matches phenylalanine rather than phosphorus;
“Co” matches cobalt.
Because of this rule, if you properly capitalize
all symbols, no ambiguities will arise.
If symbols are not properly capitalized (such as
all lower-case), then, with the exception noted
below, the shortest symbol which matches is
preferred. Thus “co” is taken as carbon-oxygen
instead of cobalt.
The exception is: if two characters represent a
valid two-letter symbol and also a valid oneletter symbol followed by an invalid one, then
the two-letter symbol is favored. Thus “cl” is
not taken as carbon followed by the (invalid
symbol) L, but instead is taken as chlorine.
Examples
There is an easy way to experiment with formula interpretation: use the Periodic Table.
Type a formula into the text box at the bottom,
then click anywhere outside that box. ChemBioFinder interprets the formula and redisplays it
with correct capitalization.
ChemBioFinder interprets some ambiguous
formulas as follows:
Formula
ChemBioFinder Interpretation
cooh
COOH
ChemBioFinder & BioViz
User Guide
495
Formula
ChemBioFinder Interpretation
Cooh
CoOH
cnosi
CNOSI
cNoSi
CNoSi
bru
BrU
b ru
BRu
496
Formula Input Rules
Appendix B
C
Similarity Rules
A common situation is that you are not looking
for a specific compound, but any compound
that is “close enough” will do. ChemBioFinder
uses the Tanimoto equation to determine if
compounds are similar. You can specify “how
similar” in the Searching tab of the Preferences
dialog.
Exact searching relies on the notion of an
atom-and-bond table: a specific set of atoms
joined to each other in a certain order by a
given set of bonds. If some atoms or bonds are
missing, added, or different, the query structure and the target structure do not match.
Most similarity searching, on the other hand,
relies instead on the notion of molecular
descriptors. Each compound can be represented by a collection of qualitative terms that
describe general aspects of the structure.
For example, benzoic acid might be described
as:
•
•
•
•
organic acid
contains 6-membered ring
contains delocalized ring
contains C-double-bond-O
As you can see, the descriptors can be very
broad, and they can overlap. The set of
descriptors used by ChemBioFinder is very
large.
When you draw a compound, ChemBioFinder
compares it against all of the descriptors it
knows about. Some descriptors will be present
in your compound and some will not. Since
each descriptor for a given compound is either
Present or Not Present, they are often stored as
bits, and another name for a compound’s set of
descriptors is its bitscreen.
Consider the following query and target compounds:
Bitscreen
Desc.
#
Name
Query
23 Q
Target
24 T
Q and T 17 Q ∩ T
Q or T
30 Q ∪ T
Both have similar numbers of descriptors present - the query has 23, while the target has 24.
But are they “close enough”?
Complete structure similarity
One of the hallmarks of a good similarity algorithm is whether it is commutative. That is, two
compounds should have the same similarity
ChemBioFinder & BioViz
User Guide
497
value no matter which you compare to which.
The full structure Tanimoto similarity test is
commutative. It compares the number of
descriptors they have in common (in the intersection of the query and the target) to the number of descriptors they have in total (in the
union of the query or the target). The ratio of
these two values is known as a Tanimoto coefficient, and is always a value between 0% and
100%.
Q∩T
Q∪T
Tanimoto Coefficient
For the two compounds above, the Tanimoto
coefficient is 17/30, or about 57%. This is not
very similar. Although ChemBioFinder will
allow you to specify any Tanimoto value down
to 0%, for most cases you will likely be look-
498
Similarity Rules
Appendix C
ing for compounds that have Tanimoto coefficients of 90% or higher.
Substructure similarity
Unlike full structure similarity, substructure
similarity is not commutative: you are comparing a portion of one structure against the entire
other structure, and so it does matter which you
compare to which. In considering substructure
similarity, ChemBioFinder finds what percentage of descriptors in the query are also present
in the target.
This value will always be at least as large as
the complete-structure Tanimoto coefficient
for the same two compounds, and usually it
will be larger. The two compounds above are
17/23, or about 74% similar by substructure
similarity. For a given coefficient value, a substructure similarity search will always return
all of the hits in a full structure similarity
search, and will often return additional ones as
well.
D
CAL Commands
ChemBioFinder Automation Language (CAL)
is a set of commands that control many ChemBioFinder operations.
You invoke CAL commands in either of two
ways:
2.In the Enter Cal Command dialog box, click
the Help.
The CAL Scripting Help window appears:
• Interactively —Type commands and execute them one at a time on a command line.
• Scripts—Use ASCII files containing a
series of CAL commands to be executed
automatically in sequence.
Arguments to commands consist of numbers
and text strings. You can enter a text string
without punctuation unless the argument is not
the last one on the command line and contains
multiple words or spaces. In this case, you
must enclose the argument in quotation marks.
CAL help
Information about the CAL command and
variables is available in the CAL Scripting
Help window.
To access CAL Help:
1.From the Scripts menu select Command Line.
The Enter Cal Command dialog box
appears.
Figure D.1 The CAL scripting window
Menu commands
CAL commands MENU syntax
Menu commands consist of a two-word command from the main menu and in some cases
an optional argument.
Following are examples of commands:
file new
edit paste
search find
record next
ChemBioFinder & BioViz
User Guide
499
You do not need to spell out menu commands.
You can enter just enough letters to uniquely
identify the menu option. For example, to execute the Record Next command, type:
rec n
Some menu commands open a dialog box and
wait for user feedback. To avoid this, a limited
number of menu commands can take explicit
arguments:
FILE OPEN [filename]
FILE SAVE [filename]
RECORD GO TO RECORD [recno]
The following commands accept a value for
param, and suppress the appropriate dialog if it
is present
.
Command
Param
File Open
Name of the file to open.
File Save
Name of the file to save.
Record Go to
Index of the destination
record within the current
list.current_list_definition
The command:
menu menuitem [param]
executes any menu command as if
selected from the menu.
The menu commands have the following arguments
:
Part
Description
menu
Stringstring_definition
containing the name of the
menu in which the command
resides.
menuitem
Stringstring_definition
containing the name of the
specific command within the
menu.
param
Stringstring_definition
containing additional information required by the
command.
Settings
The settings for param vary depending on the
specific menu command Most menu commands use no param and ignore it if present.
500
CAL Commands
Appendix D
Search Substruc- ON or OFF, corresponding to
ture
the checked/unchecked state
of the menu.
Search Similarity
ON or OFF, corresponding to
the checked/unchecked state
of the menu.
Search Match
Stereo
ON or OFF, corresponding to
the checked/unchecked state
of the menu
Remarks
Menu commands need not be spelled out in
full; you can enter just enough letters to identify the menu option. For example, to execute
the Record next command, you can enter “rec
n”.
For File Open, if the file to be launched is in
ChemBioFinder’s standard search path, only
the actual file name (CS_DATA) is required.
Otherwise, the complete file path
(c:\some\long\path\CS_DATA.CFX) is necessary.
For File Save, if the specified file does not
exist, it will be created; otherwise it will be
overwritten.
For File Save, if the path is omitted from the
file name, the file will be saved in the current
directory.
Example 1
LOOP Example
This example uses the LOOP command and the
Menu Command Record Next to display all of
the records in the current list.
The PAUSE command keeps each record on
screen long enough for people to see it.
loop
rec next
pause 2
endloop
Example 2
Different Form Example
This example shows how you can use a script
to open a second form with some of the same
fields as the original form but, for example, a
different layout. This same sort of procedure
can be used to display related records if you do
not want to use an explicit subform.
The APPEND, SETVAL, and GETDATA commands build a search string based on the contents of the link_field field on the original
form. The Menu Command File Open opens
the second form, or switches to it if it is already
open. Finally, the Menu Command Search
Enter Query enters search mode, the PUTDATA command enters the search string generated earlier in the script, and the Menu
Command Search Find executes the search.
append off
setval 1 "="
append on
getdata 1 link_field
append off
file open
d:\chemfndr\otherform.cfx
search enter query
putdata link_field $v1
search find
Example 3
Saving Compounds Example
This example uses the LOOP...ENDLOOP
commands and the Menu Command Record
Next to step through each record in the current
list. For each record, it builds a unique file path
based on the current $INDEX using SETVAL
and APPENDVAL commands. Finally, it saves
each compound to disk with the WRITEMOL
command. Since the file path ends in .cdx, this
script saves all of the compounds in ChemDraw format.
append off
loop
setval 1 c:\mydir\
appendval 1 $index
appendval 1 .cdx
writemol $v1
rec next
endloop
Example 4
GOTO Example
This example allows the user to batch-enter
several new compounds and input one field for
each. It starts with a MSG command to tell the
user what to do. Then it has a line starting with
a colon (:) that serves as a label to start the
loop. The INPUT command gets the name of
the new entry from the user. The IF command
tests to see if the user entered a blank string,
and EXITs the script if so. After the Menu
Command Record Add creates a new record,
the PUTDATA command enters the user’s
string into the molname field.
ChemBioFinder & BioViz
User Guide
501
Closing the loop, the GOTO command jumps
execution back to the start label.
msg Enter new compound names.
Enter a blank name when complete
:start
input 1
if $v1 = "" exit
record add
putdata molname $v1
goto start
Box Type
String
Picture
pathname of a Windows
metafile
Button
pathname of a script file, or
name as it appears on Scripts
menu
Subform
<nothing>
Arrowbox
<nothing>
Framedbox
name of database field to be
displayed in the box, and
static label for upper left
Box creation commands
DBOX coords [fieldname]
FRAME coords [text]
TEXT coords [text]
PICT coords [filename]
BUTTON coords [scriptname]
SUBFM coords
ARROWBOX coords
FRAMEDBOX coords [fieldname]
[text]
To create a new box on the form:
1.Specify the box type with the appropriate
keyword.
2.Type four integers giving the rectangular
coordinates of the box after the keyword.
3.If desired, type a text string giving further
information appropriate to the box type, as
shown below
:
Box Type
String
Data box
name of database field to be
displayed in the box
Frame
static label for upper left
Text
static text
502
CAL Commands
Appendix D
If the text string is omitted, you can supply it
later using SETFIELD or SETTEXT. For a
button, you must use SETTEXT if you want its
visible label to be different from the name of
its script.
Box coordinates are specified in this order:
left, top, right, bottom. Units are in pixels; the
origin is at the upper left, with coordinates
increasing from left to right and top to bottom,
so that coordinates will range from left = 0 to
right = 640 or 1024 or whatever fits your
screen, and from top = 0 to bottom = 480 or
768 or similar.
When a new box is created, it adopts the current font. To specify a particular font for a box,
use the FONT command prior to creating the
box.
When specifying a script name, give one of the
following:
• The complete pathname of the script file.
• A simple name without extension, if the
script is stored in the standard scripts subdirectory with the standard file extension. If
the script name appears on the Scripts
menu, you can use the name from the menu.
The table below shows examples of Box Creation Commands
:
Part
Description
left
Integer value representing the
distance, in pixels, between
the left edge of the box and
the left edge of the active
form.
top
Integer value representing the
distance, in pixels, between
the top edge of the box and
the top edge of the active
form.
right
Integer value representing the
distance, in pixels, between
the right edge of the box and
the left edge of the active
form.
bottom
Integer value representing the
distance, in pixels, between
the bottom edge of the box
and the top edge of the active
form.
fieldname
Database field name definition that will provide the data
that is displayed in the data
box.
:
COMMAND
ACTION
Frame 10 10
create frame with label at
300 60 Molec- upper left
ular Formula
DBOX 20 20
290 50
formula
create data box for formula in
above frame
TEXT 100 100 create static text string
300 150 “A
Label”
PICT 500 300 put specified picture at lower
600 400
right
C:/LOGO.WM
F
BUTTON 500
10 550 40
DEMO
create button at upper right to
run script DEMO.CFS
CAL commands DBOX syntax
DBOX creates a new data box on the active
form.
DBOX left top right bottom
[fieldname]
The DBOX command has the following arguments
Remarks
When a new box is created, it adopts the current font settings. These settings can be controlled with the FONT command.
You can assign a fieldname even if there is no
data source for the form. If a data source is
assigned at a later point and a field within that
data source has the same name as assigned to
the data box, the data box will automatically
display the contents of that field.
ChemBioFinder & BioViz
User Guide
503
After a box is created, its field name can be
changed with the SETFIELD command.
DBOX and FRAME example
This example uses the DBOX command to create a short, wide data box near the top left of
the form, and display the Formula field within
it.
It then uses the FRAME command to label the
data box with a slightly-larger frame.
DBOX 10 20 210 50 Formula
FRAME 5 5 215 55 Formula
CAL commands FRAME syntax
Creates a new frame on the active form.
FRAME left top right bottom [text]
The FRAME command has the following arguments
:
Part
Description
left
Integer value representing the
distance, in pixels, between
the left edge of the frame and
the left edge of the active
form.
top
right
504
Integer value representing the
distance, in pixels, between
the top edge of the frame and
the top edge of the active
form.
Integer value representing the
distance, in pixels, between
the right edge of the frame
and the left edge of the active
form.
CAL Commands
Appendix D
Part
Description
bottom
Integer value representing the
distance, in pixels, between
the bottom edge of the frame
and the top edge of the active
form.
text
String displayed as a label on
the top left corner of the
frame.
Remarks
When a new frame is created, it adopts the current font settings. These settings can be controlled with the FONT command.
After a frame is created, its label can be
changed with the SETTEXT command.
CAL commands TEXT syntax
Creates a new static text box on the active
form.
TEXT left top right bottom [text]
The TEXT command has the following arguments
:
Part
Description
left
Integer value representing the
distance, in pixels, between
the left edge of the text box
and the left edge of the active
form.
top
Integer value representing the
distance, in pixels, between
the top edge of the text box
and the top edge of the active
form.
Part
Description
right
Integer value representing the
distance, in pixels, between
the right edge of the text box
and the left edge of the active
form.
CAL commands PICT syntax
Creates a new picture box on the active form.
bottom
text
Integer value representing the
distance, in pixels, between
the bottom edge of the text
box and the top edge of the
active form.
PICT left top right bottom
[filename]
The PICT command has the following arguments
:
Part
Description
left
Integer value representing the
distance, in pixels, between
the left edge of the box and
the left edge of the active
form.
top
Integer value representing the
distance, in pixels, between
the top edge of the box and
the top edge of the active
form.
right
Integer value representing the
distance, in pixels, between
the right edge of the box and
the left edge of the active
form.
bottom
Integer value representing the
distance, in pixels, between
the bottom edge of the box
and the top edge of the active
form.
filename
Name of the Windows metafile to display in the picture
box.
String displayed as the static
text.
Remarks
When a new static text box is created, it adopts
the current font settings. These settings can be
controlled with the FONT command.
After a static text box is created, its contents
can be changed with the SETTEXT command.
Text will wrap to fit within the dimensions
specified. If all text cannot be displayed within
the bounds of the text box, only the first part
will be displayed. However, all text is still
present and will appear if the box is resized to
larger dimensions.
FONT and TEXT example
This example uses the FONT command to set
the font to be large, bold, and bright (24-point
Arial bold, in red), then uses the TEXT command to create a short, wide data box near the
top middle of the form.
FONT Arial 24 1 255 0 0
TEXT 200 40 450 70 My Compound
Database
Remarks
If the Windows metafile is in ChemBioFinder’s standard search path, only the actual
file name and extension (BUTTRFLY.WMF) is
ChemBioFinder & BioViz
User Guide
505
required. Otherwise, the complete file path
(c:\some\long\path\BUTTERFLY.WMF) is
necessary.
Part
Description
bottom
Integer value representing the
distance, in pixels, between
the bottom edge of the button
and the top edge of the active
form.
filename
Name of the CAL script file
to display in the button
PICT example
This example uses the PICT command to create a large picture field toward the right of the
form, and display in it the BUTTRFLY.WMF
picture in the ChemBioFinder System directory.
PICT 300 100 500 300 buttrfly.wmf
CAL commands BUTTON syntax
Creates a new button on the active form.
BUTTON left top right bottom
[filename]
The BUTTON command has the following
arguments
:
Part
Description
left
Integer value representing the
distance, in pixels, between
the left edge of the button and
the left edge of the active
form.
top
right
506
Remarks
If the CAL script file is in ChemBioFinder’s
standard search path, only the actual file name
(BROWSE) is required. Otherwise, the complete file path
(c:\some\long\path\BROWSE.CFS) is necessary.
When a new button is created, it adopts the
current font settings. These settings can be
controlled with the FONT command.
By default, the name of the CAL script file (for
example, BROWSE) is shown on the button.
This can be changed with the SETTEXT command.
BUTTON example
Integer value representing the
distance, in pixels, between
the top edge of the button and
the top edge of the active
form.
This example uses the BUTTON command to
create a button near the bottom of the form,
and assign to it the REGISTER.CFS script in
the same directory as the form.
Integer value representing the
distance, in pixels, between
the right edge of the button
and the left edge of the active
form.
CAL commands SUBFM syntax
CAL Commands
Appendix D
BUTTON 50 300 200 330 Register
Creates a new subform on the active form.
SUBFM left top right bottom
The SUBFM command has the following arguments
:
Part
Description
left
Integer value representing the
distance, in pixels, between
the left edge of the subform
databox and the left edge of
the active form.
top
Integer value representing the
distance, in pixels, between
the top edge of the subform
databox and the top edge of
the active form.
right
Integer value representing the
distance, in pixels, between
the right edge of the subform
databox and the left edge of
the active form.
bottom
Integer value representing the
distance, in pixels, between
the bottom edge of the
subform databox and the top
edge of the active form.
Remarks
It is not currently possible to set the data
source or link fields of a subform using CAL.
SUBFM example
This example uses the SUBFM command to
create a large subform in the middle of the
form.
SUBFM 50 50 600 300
Box manipulation commands
FORMEDIT ON|OFF
SELECT box
UNSELECT box
DELBOX box
SETFIELD box fieldname
SETTEXT box text
ACTIVATE subform
DEACTIVATE
SCALE
SCALE_TO_FIT
To work with a box or subform on the form,
you specify a keyword followed by a box identifier. A box is identified in one of two ways:
• By point—Give the coordinates of a point
anywhere within the box. When coordinates fall in more than one box, the most
recently created box is used.
• By text—The text you enter to identify a
box may be:
• The field name, if the box contains data
from a database.
• The text label, if the box contains static
text, such as frames or text labels.
• The box name assigned in Box Properties.
• For subform boxes, the table name.
In all cases, you need not spell out the entire
name, just enough to be unique.
Often, more than one box matches the text
you enter, for example a box displaying
field “molweight” within a frame labelled
“MolWeight.” In this case, preference is
given to the box connected to the database.
FORMEDIT controls the behavior of the
SELECT command. With FORMEDIT ON,
SELECT affects boxes. With FORMEDIT
OFF, SELECT affects the contents of those
boxes.
SELECT and UNSELECT choose boxes to be
modified by editing operations. DELBOX is a
shortcut for FORMEDIT ON, followed by
SELECT, followed by Edit Clear. SETFIELD
connects a database field to an existing box;
ChemBioFinder & BioViz
User Guide
507
for a button, it attaches a script name (see
above regarding script names). SETTEXT
attaches a text string to a box or replaces the
one currently attached; see box creation commands (above) for a list of what the text strings
mean for various box types.
ACTIVATE and DEACTIVATE are the same
as SELECT and UNSELECT, but work on
subforms. Following an ACTIVATE command, all subsequent commands apply to the
active subform and any boxes it contains. The
DEACTIVATE command is required to once
again refer to the main form and its contents.
SCALE scales all items in the current form by
the percentage factor you specify. Use this to
fit your forms to different size screens. See
SCALE_TO_FIT below.
SCALE_TO_FIT scales all elements in the
form such that the string you specify will fit in
the form at the currently selected font size. See
FONT below.
The table below shows examples of Box
Manipulation Commands
:
Command
Action
SELECT 11
11
select formula frame created
above
SELECT
formu
select formula data box
created above
SETFIELD 21 change field for formula data
21
box to molweight
molweight
The DELBOX command has the following
argument
:
Part
Description
box
Box identifier indicating the
box to delete.
Remarks
The DELBOX command is a shortcut for
FORMEDIT ON, followed by SELECT, followed by the Menu Command Edit Clear.
The DELBOX command deletes only the box,
not its actual contents. For example, deleting a
button does not delete the CAL script file from
your disk.
CAL commands SETFIELD syntax
Connects a database field to an existing data
box or a CAL script name to an existing button, or replaces one already connected.
SETFIELD box fieldname
The SETFIELD command has the following
arguments
:
Part
Description
box
Box indicating the target.
fieldname
String containing the database field name (if the target
is a data box) or CAL script
name (if the target is a button)
to assign to the target.
CAL commands DELBOX syntax
Deletes a data box, frame, static text box, picture box, button, or subform the active form.
DELBOX box
CAL commands SETTEXT syntax
Attaches a text string to a frame, text box, or
button, or replaces one already attached.
SETTEXT box text
508
CAL Commands
Appendix D
The SETTEXT command has the following
arguments
:
Part
Description
box
Box identifier indicating the
target.
text
String to attach to the target.
Depending on the box type, the text is attached
to different places
:
Box type
Text location
data box
Within the text box, wrapped
to fit.
frame
On the top border, aligned to
the left.
text box
Within the text box, wrapped
to fit.
button
Centered within the button.
CAL commands ACTIVATE syntax
Marks a subform on the active form to become
the new active form. It is equivalent to clicking
on the subform with the pointer tool.
:
Part
Description
subform
Box identifier indicating the
subform to activate.
NOTE: This command will change the active
form.
Remarks
The ACTIVATE command acts only on subforms. The similar command SELECT is used
for data boxes, frames, text boxes, buttons, and
picture boxes.
CAL commands FORMEDIT syntax
Determines whether the active form is in form
edit mode or data edit mode.
FORMEDIT value
The FORMEDIT command has the following
settings
:
Setting
Description
ON
Form is set to form edit
mode.
OFF
Form is set to data edit mode.
ACTIVATE subform
The ACTIVATE command has the following
argument
Remarks
When the form is in form edit mode, the
SELECT command affects data boxes themselves. When the form is in data edit mode, the
SELECT command affects the data within the
data boxes.
ChemBioFinder & BioViz
User Guide
509
CAL commands SELECT syntax
Marks a box on the active
formactive_form_definition for further manipulation. It is equivalent to clicking in the box
with the pointer tool.
SELECT box
The SELECT command has the following
argument
:
Part
Description
box
Box identifier indicating the
box to select.
Remarks
The SELECT command acts only on data
boxes, frames, text boxes, buttons, and picture
boxes. The similar command ACTIVATE is
used for subforms.
The behavior of the SELECT command is
modified by the FORMEDIT command. When
the form is in form edit mode, the SELECT
command affects data boxes themselves. When
the form is in data edit mode, the SELECT
command affects the data within the data
boxes.
CAL commands UNSELECT syntax
Reverses the action of the SELECT command,
making sure that no boxes are marked for further manipulations. It is equivalent to clicking
in the form background with the pointer tool.
UNSELECT
The UNSELECT command takes no arguments.
Reverses the action of the ACTIVATE command, making sure that the main form is the
active form. It is equivalent to clicking in the
main form background with the pointer tool.
510
CAL Commands
Appendix D
UNSELECT
The UNSELECT command takes no arguments.
NOTE: This command will change the active
form.
Program execution commands
CALL scriptname
DOS doscommand
EXEC wincommand
EXEC_BUTTON boxname
DDE ddecommand
LAUNCH filename
OUTPUT_STR string
Program execution commands call up external
processes and pass data to them. All require an
argument, which may need multiple components.
CALL executes a specified CAL script. If the
call is made from within another script, when
the called script finishes executing it returns
control to the caller. CALL must be followed
by a scriptname, as described above.
DOS executes a DOS command line. Follow
the DOS keyword with any string you might
type at a DOS command prompt. If you do not
type any arguments after the DOS command,
you get an interactive command prompt window. You can use this feature to manipulate
files, execute programs or batch files, get
directory listings, format disks, etc. During
execution of the command, a command prompt
window appears on the screen; when finished,
the window goes away and control returns to
the calling script.
EXEC starts a Windows program and optionally passes it command-line arguments. Follow
the EXEC keyword with any string you might
use in the Program Manager’s File Run command. This command starts a program, but
does not return from it. To return to ChemBioFinder, you need to use Task Manager or click
in the ChemBioFinder frame window.
EXEC_BUTTON transfers execution to the
script connected to a particular button, where
boxname is the button’s box name in the Box
Properties dialog box, usually the same as the
text on the button.
DDE sends a Dynamic Data Exchange message to a specified application. Follow the
DDE keyword with three arguments:
• The service name—usually the name of the
recipient application.
• The topic name—a string recognized by the
recipient, identifying the nature of the message. It is typically SYSTEM.
• The command—an instruction to the service indicating what you want it to do.
OUTPUT_STR gives CAL access to the output window used by Python, where string
writes a string into the output window, followed by a new line. The command brings the
window up on the first call, if necessary. The
string need not be quoted, even if it contains
multiple words.
Details of these components depend on the service you are addressing.
The table below shows examples of Program
Execution Commands
:
Command
Action
CALL
myscript
execute script file located in
scripts directory
Command
Action
DOS erase
junkfile.dat
execute DOS command to
delete a file
EXEC notepad execute Windows program
myfile.txt
DDE CHEM3D
CFWIN "open
benz.mol"
send DDE message to qualified service
CAL commands CALL syntax
Executes the specified CAL script
CALL scriptname
The CALL command has the following argument
:
Part
Description
scriptname
String containing the name of
the CAL script file to
execute.
Remarks
If the CAL script file is in ChemBioFinder’s
standard search path, only the actual file name
(BROWSE) is required. Otherwise, the complete file path
(c:\some\long\path\BROWSE.CFS) is necessary.
If the CALL command is executed from within
another script (as opposed to from the Command Line), the calling script will continue to
execute with its next command after the called
script finishes executing.
A CALLed script inherits all user variables
from its calling script. The calling script also
ChemBioFinder & BioViz
User Guide
511
inherits the user variables back from the called
script when it has completed executing.
CAL commands DOS syntax
Part
Description
filename
String containing the file
name of any Windows application
Executes a standard DOS command line
DOS doscommand
The DOS command has the following argument
:
Part
Description
doscommand
Any string that might be
typed at a DOS command
prompt.
Remarks
This command may be used to manipulate
files, execute programs or batch files, get
directory listings, format disks, etc.
During execution, a DOS command prompt
window appears on the screen; when finished,
the window goes away and control returns to
the calling script.
CAL commands EXEC syntax
Starts a Windows program and optionally
passes it command-line arguments.
EXEC filename [commandargs]
The EXEC command has the following arguments
:
Part
Description
commandargs
String containing arguments
to be passed to that application.
512
CAL Commands
Appendix D
Remarks
If the file to be launched is in ChemBioFinder’s standard search path, only the actual
file name (CHEMDRAW) is required. Otherwise, the complete file path
(c:\some\long\path\CHEMDRAW.EXE) is
necessary.
The EXEC command starts a program, but
does not return from it; in order to return to
ChemBioFinder, you need to use the Task
Manager or click in the ChemBioFinder frame
window.
EXEC example
This example uses the EXEC command to start
Microsoft Excel.
The first line starts with an asterisk (*) and so
is not executed. It serves only to make the
example more readable for the user.
* RUNEXCEL.CFS -- script to start
Excel
EXEC
"c:\msoffice\excel\excel.exe"
CAL commands DDE syntax
Sends a Dynamic Data Exchange message to a
specified application
DDE [timeout] servicename topic
command
The DDE command has the following arguments
:
Part
Description
timeout
An optional time in seconds
to try establishing the
connection
servicename
String containing the identifier of the recipient application; often but not always the
application name.
topic
String identifying the nature
of the message
command
String containing instructions
to recipient application indicating what you want it to do.
Remarks
DDE commands are highly specific to each
application. Please consult the documentation
for the desired recipient application for information on service names, topic names, and
commands it supports.
The DDE command is always sent as an EXECUTE instruction.
Communicating with Excel example
This example uses the WRITETEXT command to write the current list to a file, then
sends two DDE commands to open that file in
Microsoft Excel and resize the columns to a
nice size. Finally, it uses the DOS command to
delete the temporary file.
The first line starts with an asterisk (*) and so
is not executed. It serves only to make the
example more readable for the user.
* TOEXCEL.CFS -- script to send
data to Excel
WRITETEXT C:\DATA.TMP
DDE Excel System
[OPEN("C:\DATA.TMP")]
DDE Excel System
[COLUMN.WIDTH(1,"C1:C4",,3,1)]
DOS erase C:\DATA.TMP
General commands
MSG message
STATMSG message
TIMEDMSG [n] <msg>W
FONT fontname [size [style r g b]]
SEEPTAB [decisecs]
QUIETCLOSE
HIDETABLE
SET
CLEAN [cleanup, tidy, redraw,
denovo]
HELP
GET [v] section number, itemnumber
SOUND filename.wav
SYSMETRIC [v] index
MSG displays a message box with the specified text, and waits for the user to click.
STATMSG displays information on the status
line.
TIMEDMSG displays a message box similar
to the MSG command, but the message disappears automatically after a specified number of
seconds. For example: TIMEDMSG 10 ˝This
message will disappear automatically after 10
seconds.˝
FONT changes the current font. Any boxes
created subsequently adopt this font. Follow
the keyword with a name from your Windows
font list, followed optionally by:
• Font size in points (default is 8).
• Style from the list below (default is 0, or
plain text).
ChemBioFinder & BioViz
User Guide
513
• Color; three values for red, green, and blue,
each ranging from 0 to 255 (default is 0,0,0,
or black).
Font styles are sums of bold (1), italic (2), and
underline (4). Thus a style value of 1 means
bold, 3 means bold+italic, 6 means
italic+underline, and so on.
SEEPTAB briefly displays the periodic table
window, then closes it. The window will be
displayed for the amount of time specified (1
decisecond = 0.1 second). If the duration is
omitted, it will be displayed for four seconds.
QUITECLOSE closes the active form. This
command is similar to FILE CLOSE, but automatically discards any changes instead of
prompting the user what to do.
HIDETABLE closes the Table View window
for the current form. If a subform is active, it
returns the subform to form view.
SET allows you to modify basic ChemBioFinder settings, including most of those found
in the Preferences dialog and several that cannot be accessed in any other way. See the
online help for a complete listing of parameters
that can be SET.
CLEAN will attempt to standardize the bond
lengths and angles of the current molecule. It is
the same as opening the molecule in ChemDraw, and selecting the Clean Up Structure
command. The arguments are optional.
HELP displays a list of all valid CAL commands. The valid parameter types are listed for
each command, as is a brief description.
GET retrieves a value from the ChemBioFinder.ini file. Follow the keyword with a variable name and the section and item number of
the value you want to retrieve.
SOUND plays a .wav file you specify.
514
CAL Commands
Appendix D
SYSMETRIC retrieves the specified system
metric into a variable.
The table below shows examples of General
Commands
:
Command
Action
MSG ˝Click
OK to continue˝
display message, wait for
click
FONT Times
change font to red 12-point
12 1 255 0 0 Times bold
GET V1,4,5
place the value of item number 5 in section 4 into the
variable V1
SOUND
beep.wav
play the sound in the files
beep.wav
CAL commands MSG syntax
Displays a message in a dialog box, and waits
for the user to dismiss the dialog.
MSG message
The MSG command has the following argument
:
Part
Description
message
String displayed as the
message in the dialog box.
CAL commands FONT syntax
Changes the current font, size, style, and color
used for all subsequent box creation.
FONT fontname [size [style [r g
b]]]
The FONT command has the following arguments
:
Part
Description
fontname
String containing the name of
a font from your Windows
font list
size
String containing the size of
the font, in points.
style
String containing the style in
which to display the font, as
described in Settings.
Setting
Description
4
Underline
5
Bold and underline.
6
Italic and underline.
7
Bold and italic and underline
CAL commands SEEPTAB syntax
Displays the Periodic Table window, then
closes it.
SEEPTAB [decisecs]
The SEEPTAB command has the following
argument
:
r
String containing the red
component of the font color,
in the range from 0 to 255.
Part
Description
g
String containing the green
component of the font color,
in the range from 0 to 255.
decisecs
Amount of time to display the
Periodic Table window
before closing it.
String containing the blue
component of the font color,
in the range from 0 to 255.
Remarks
b
Settings
The settings for style are:
10 decisec = 1 second.
If the decisecs argument is omitted, the Periodic Table window will be displayed for 4 seconds.
CAL commands QUIETCLOSE syntax
Setting
Description
0
Plain text.
1
Bold
2
Italic
3
Bold and italic.
Closes the topmost form immediately, without
checking to see if it has been modified.
QUIETCLOSE
The QUIETCLOSE command takes no arguments.
Remarks
This command is similar to the Menu Command File Close. However, if the user has
ChemBioFinder & BioViz
User Guide
515
modified the form in any way, the File Close
command will present an alert asking if the
user wants to save changes, while the QUIETCLOSE command will not.
CAL commands SET syntax
Changes the values of various preferences that
control the overall behavior of ChemBioFinder.
CAL commands HIDETABLE syntax
SET section preference setting
Closes the Table View window for the active
form.active_form_definition
The SET command has the following arguments
:
HIDETABLE
The HIDETABLE command takes no arguments.
Remarks
The Table View for the active form can be displayed with the Menu Command View Data
Table.
If the active form is a subform, the
HIDETABLE command will return it to form
view.
Part
Description
section
String describing the general
category of preference.
preference
String naming the preference
to change.
setting
String describing new value
of preference.
Values
The values for section, preference, and value
are
:
Section
Preference
Description
Values
DISPLAY
ATOM_LABEL_COLOR
The color in which to display color
atom labels that cannot be
interpreted by ChemBioFinder.
The default is Purple.
DISPLAY
ATOM_NUMS
0 or 1
Whether or not to display
atom numbers on each atom.
The default is 0 (do not
display)
516
CAL Commands
Appendix D
Section
Preference
Description
Values
DISPLAY
ATOM_SPECIAL_COLOR
The color of query atoms and color
other atom types not listed in
the Periodic table.
The default is Purple.
DISPLAY
BOND_NUMS
Whether or not to display
0 or 1
bond numbers on each bond.
The default is 0 (do not
display)
DISPLAY
BOND_SPACING
Spacing between double
bonds, as a percentage of
bond length.
0 ... 100
The default is 12 (%).
DISPLAY
FONT_ADJUSTMENT
A correction to the font size -50 ... 80
of atom labels based on a
structure's average bond
length. More specifically, the
font size of atom labels is:
(nominal value +
(FONT_ADJUSTMENT/10
0) * average bond length).
The default is 20 (%).
DISPLAY
FORM_COLOR
The background color of the color
form. This parameter can be
set manually in the Color tab
of the Preferences dialog.
The default is Grey.
ChemBioFinder & BioViz
User Guide
517
Section
Preference
Description
Values
DISPLAY
FRAME_PICTURES
Whether or not to display
0 or 1
borders around pictures. This
parameter can be set manually in the Display tab of the
Preferences dialog.
The default is 1 (display).
DISPLAY
GRID_SPACING
The spacing, in pixels,
0 ... 100
between hash marks on the
grid. This parameter can be
set manually in the Display
tab of the Preferences dialog.
The default is 10 (pixels).
DISPLAY
MAX_BND_LEN
The scaling factor by which 10 ... 500
the maximum bond length is
modified. This value is only
applicable when the Fit to
box option is deselected.
The default is 100 (%).
DISPLAY
MOL_HIGHLIGHT_COLO The color in which substruc- color
R
ture search matches are
displayed. This parameter
can be set manually in the
Color tab of the Preferences
dialog.
The default is Red.
518
CAL Commands
Appendix D
Section
Preference
Description
Values
DISPLAY
NET_OUTSIDE
Whether or not to move
0 or 1
bracketed text to the outside,
where possible, in the display
of net reaction changes in
molecular formulas and
molecular weights.
The default is 1 (move to
outside).
DISPLAY
NET_RXN_CHANGE
Whether or not to display net 0 or 1
reaction changes in brackets
in molecular formulas and
molecular weights.
The default is 1 (display
changes).
DISPLAY
PICTURE_BACKGROUND The background color of
Picture boxes. This parameter can be set manually in
the Color tab of the Preferences dialog.
color
The default is White.
DISPLAY
QUERY_BOND_COLOR
The color in which bonds
color
with query properties should
be displayed. This parameter
can be set manually in the
Color tab of the Preferences
dialog.
The default is Green.
ChemBioFinder & BioViz
User Guide
519
Section
Preference
Description
Values
DISPLAY
RXN_CTR_COLOR
The color in which reaction color
centers should be highlighted, if highlighting is
turned on. This parameter can
be set manually in the Color
tab of the Preferences dialog.
The default is 33023
(purplish).
DISPLAY
SHOW_AAMAP
Whether or not to highlight 0 or 1
matching mapped atoms in a
reaction in color. This parameter can be set manually in
the Display tab of the Preferences dialog.
The default is 0 (do not highlight).
DISPLAY
SHOW_H_CHARGED_AT
OMS
Whether or not to display
implicit hydrogens on all
atoms bearing a charge or
radical.
0 or 1
The default is 1 (display).
DISPLAY
SHOW_H_ON_HET
Whether or not to display
0 or 1
implicit hydrogens on all
heteroatoms. This parameter
can be set manually in the
Display tab of the Preferences dialog.
The default is 1 (display).
520
CAL Commands
Appendix D
Section
Preference
Description
Values
DISPLAY
SHOW_H_TERM_C
Whether or not to display
0 or 1
implicit hydrogens on all
terminal carbons. This
parameter can be set manually in the Display tab of the
Preferences dialog.
The default is 0 (do not
display).
DISPLAY
SHOW_RXN_CENTER
Whether or not to highlight 0 or 1
reaction centers. This parameter can be set manually in
the Display tab of the Preferences dialog.
The default is 0 (do not highlight).
OPTIONS
CFW_METAFILES
Whether to generate pictures 0 or 1
using ChemBioFinder or
using ChemDraw when
copying a structure to the
clipboard.
The default is 0 (use ChemDraw to generate).
OPTIONS
DDE_TIMEOUT
0 ... 60
Number of seconds to wait
for a response to a DDE
transaction.
The default is 30 (seconds).
ChemBioFinder & BioViz
User Guide
521
Section
Preference
Description
Values
OPTIONS
EXPLICIT_METAL_H
Whether or not to require that 0 or 1
metals have hydrogens drawn
implicitly. If this parameter is
off, ChemBioFinder will
automatically add hydrogens
to fill each metal's minimum
valence. This parameter can
be set manually in the
General tab of the Preferences dialog.
The default is 1 (require
explicit drawing).
OPTIONS
EXPORT_HEADER
ASCII value of the delimiter 0 ... 255
to use when exporting delimited text files. This parameter
can be set manually in the
General tab of the Preferences dialog.
The default is 9 (tab).
OPTIONS
LOAD_LAST_FORM_ON_ Whether or not to load the
0 or 1
STARTUP
last-active form file the next
time ChemBioFinder is
launched.
The default is 0 (do not load).
522
CAL Commands
Appendix D
Section
Preference
Description
Values
OPTIONS
NON_INTERACTIVE
Whether or not to suppress
0 or 1
non-critical dialogs. Principally useful when ChemBioFinder is being used unattended, such as over the
WWW. It is not recommended to have this option
on when using ChemBioFinder directly.
The default is 0 (interactive
mode).
OPTIONS
VALIDATE_VALENCE
Whether or not to provide a 0 or 1
warning when attempting to
enter a substance containing
an element in a non-standard
valence. This parameter can
be set manually in the
General tab of the Preferences dialog.
The default is 0 (do not
warn).
PRINT_OPTIO
NS
PRINT_BORDER
Whether or not to display a
border around forms when
printing
0 or 1
The default is 1 (print a
border).
ChemBioFinder & BioViz
User Guide
523
Section
Preference
Description
Values
PRINT_OPTIO
NS
PRINT_FOOTER
The contents of the footer to string
be printed at the bottom of all
pages containing forms. Any
text is valid, as well as the
following special codes:
%D current date
%F name of the CFX file
%P page number
%T current time
The default is “ChemBioFinder %D %T Record %P”
PRINT_OPTIO
NS
PRINT_HEADER
The contents of the header to string
be printed at the top of all
pages containing forms. Any
text is valid, as well as the
same special codes recognized for the footer.
The default is “%F” (file
name)
SEARCHING
EXACT
Whether or not to allow a
0 or 1
substructure match when
searching. This parameter
can be set manually in the
Search tab of the Preferences
dialog.
The default is 0 (substructure).
524
CAL Commands
Appendix D
Section
Preference
Description
Values
SEARCHING
FIND_CHARGED_CARBO Whether or not to allow
0 or 1
N
uncharged carbon atoms to
match charged ones when
searching. This parameter
can be set manually in the
Search tab of the Preferences
dialog.
The default is 1 (allow the
match).
SEARCHING
FIND_CHARGED_HET
Whether or not to allow
0 or 1
uncharged heteroatoms to
matched charged ones when
searching. This parameter
can be set manually in the
Search tab of the Preferences
dialog.
The default is 1 (allow the
match).
SEARCHING
MATCH_STEREO_DB
Whether or not to match
0 or 1
cis/trans stereochemistry
around double bonds. This
parameter can be set manually in the General tab of the
Preferences dialog.
The default is 1 (match
stereo).
SEARCHING
MATCH_STEREO_TET
Whether or not to match
0 or 1
tetrahedral stereochemistry.
This parameter can be set
manually in the Search tab of
the Preferences dialog.
The default is 1 (match
stereo).
ChemBioFinder & BioViz
User Guide
525
Section
Preference
Description
Values
SEARCHING
MAX_HITS
Maximum number of hits to
be returned by a search.
1…
The default is 2500 (hits).
SEARCHING
SIMILARITY
Whether or not to allow a
0 or 1
similarity match when
searching. This parameter
can be set manually in the
Search tab of the Preferences
dialog.
The default is 0 (require exact
match).
SEARCHING
SRCH_TANIMOTO_PCT
Cutoff percentage below
which two compounds are
not considered similar. This
parameter can be set manually in the Search tab of the
Preferences dialog.
0 … 100
The default is 90 (%).
SEARCHING
SRCH_USE_RXN_CTRS
Whether or not to require that 0 or 1
query substructures have at
least one atom or bond in the
reaction center of the target.
This parameter can be set
manually in the Search tab of
the Preferences dialog.
The default is 1 (require in
center).
526
CAL Commands
Appendix D
Section
Preference
Description
Values
SEARCHING
STOP_AFTER_MAX_HITS Whether or not to stop
0 or 1
searching after the maximum
number of hits have been
found. If this preference is
turned off, ChemBioFinder
will report the total number
of hits, but will still display
only the maximum number.
The default is 1 (stop).
CAL commands CLEAN syntax
CAL commands HELP syntax
Attempts to standardize the bond lengths and
angles of the current molecule.
Displays a list of all valid CAL commands.
The valid parameter types are listed for each
command, as is a brief description.
CLEAN [param]
The CLEAN command takes the following
optional arguments
:
Part
Description
cleanup
(default) Progressively
stronger drawing modes,
starting with Tidy, until
something changes.
tidy
Minimum redrawing, if any.
redraw
License to redesign rings
denovo
Complete redesign from
scratch.
Remarks
This command is equivalent to opening the
structure in ChemDraw, selecting the Clean Up
Structure command, and returning to ChemBioFinder.
HELP
Remarks
This command is not of much use during the
execution of a CAL script, but can be a quick
syntax aid when entered into the ChemBioFinder Command Line.
File commands
READMOL filename
READPICT boxname filename
WRITEMOL filename
WRITEPICT boxname filename
WRITETEXT filename
READMOL and WRITEMOL operate on the
current molecule. These commands will work
only if there is at least one structure-related
box (structure, formula, or molweight) on the
form, and you are positioned to a valid entry in
the database. READMOL reads a specified
structure file and replaces the current molecule
in the form. WRITEMOL saves the current
molecule to a specified structure file; if the file
ChemBioFinder & BioViz
User Guide
527
doesn’t exist, it is created, otherwise it is overwritten. For both READMOL and WRITEMOL, the format of the file is determined by
its extension; for example, benzene.cdx is a
ChemDraw file.
READPICT and WRITEPICT transfer pictures
into or out of picture boxes, where boxname is
the name of the picture box on the form and
filename is a pathname to a graphics file, with
extension .bmp, .jpg, .gif, .png, .emf, or .wmf.
WRITETEXT exports the current list as delimited text with whatever delimiter is specified in
the Preferences dialog.
The table below shows examples of File Commands
Command
Action
READMOL
benz.mol
read specified file to become
current molecule
WRITEMOL
saved.mol
write current molecule to
specified file
WRITETEXT
hits.txt
export current list to a text
file
OPENDB [R/E/RE] dbname
CRETABLE tablename
DELTABLE tablename
SELTABLE tablename
CREFIELD fieldname
DELFIELD fieldname
SORT [D] fieldname
Oracle database commands:
SQL <SQLStatement>
SQLSELECT [v]
<SQLSelectStatement>
528
CAL Commands
Appendix D
OPENDB opens a standard molecule database.
Specify a pathname to the MDB file, or a name
from the ODBC Data sources list. When connected to an Oracle database, OPENDB takes a
table name instead of a database name. You
can specify the mode of database opening:
• R—read-only
• E—exclusive
• RE—read-only and exclusive
CRETABLE creates tables in the current database.
DELTABLE deletes tables in the current database.
SELTABLE selects a table form the current
database and makes it the current working
table for subsequent field actions.
CREFIELD creates fields in the current table
in the current database. You can specify the
field type and width in the CREFIELD command. The default text field is 50 characters
wide.
DELFIELD deletes fields in the current table
in the current database.
SORT sorts the database contents on the specified field. The default sorts the database in
ascending order. You can specify descending
order with D.
SQL allows SQL to be passed directly from
CAL. SQLStatement is a SQL statement that
returns no results. It is therefore useful for data
manipulation operations. Available only when
connected to an Oracle database.
SQLSELECT returns a one-row recordset. It is
useful for calculations or lookups. v is the
name or number of a variable to receive the
results of a Select statement; SelectStatement
is a SQL Select statement designed to retrieve
a single result. If v is omitted, results go in V1.
Available only when connected to an Oracle
database.
If you omit the password from the connection
string, and you will be prompted for it when
running the command.
The table below shows examples of Database
Commands
Command
Action
CRETABLE
MyTable
creates a new table
DELTABLE
MyTable
deletes a new table
CAL commands OPENDB syntax
Opens a database and assigns it as the Data
Source of the active form.
OPENDB dbname
The OPENDB command has the following
argument
:
Part
Description
dbname
String containing the file
name of a database, which
could be a *MDB file or a
name from the ODBC Data
Sources list.
Remarks
If the file to be launched is in ChemBioFinder’s standard search path, only the actual
file name (CS_DATA) is required. Otherwise,
the complete file path
(c:\some\long\path\CS_DATA.MDB) is necessary.
OPENDB example
This example uses the OPENDB command to
assign a new data source to the current form.
OPENDB c:\data\mydb.mdb
Variable commands
SETVAL [v] text
READVAL [v] filename
WRITEVAL [v] filename
INPUT [v] [prompt]
PASSWORD [v] [default]
GETDATA [v] box
PUTDATA box text
FROM_CANON [str]| CLIPBOARD
TO_CANON [v]| CLIPBOARD
FROM_SMILES [str]
TO_SMILES [v]
APPEND ON|OFF
APPENDVAL [v] [text]
INCREMENT [v]
DECREMENT [v]
LET v v op v
SUBSTR [v] <str> <from> [<to>]
CAL has nine variables called V1, V2, ..., V9.
These are temporary storage locations you can
use to move information between form boxes
and other data sources.
Variable names can be substituted in any CAL
command. Any item shown in italics in a command description may be replaced by the name
of a variable, prefixed with a dollar sign.
For example:
MSG message may be either:
MSG "An explicit message"
—a message explicitly coded into the script—
or
MSG $V2
—a message taken from variable 2 at run time
ChemBioFinder & BioViz
User Guide
529
You may concatenate variables, and variables
and literals together in CAL commands. You
must add both a leading and trailing dollar sign
to the variable name.
For example:
MSG$V2$$V1$
Displays a message box with the value of V2
immediately followed by the value of V1.
Most commands for manipulating variables
take an optional variable number as the first
argument. If the number is omitted, it is
assumed to be 1.
SETVAL puts the specified text into a variable.
READVAL reads the contents of a text file into
a variable. WRITEVAL copies the contents of
a variable to a file.
INPUT displays a text input dialog, accepts
data from the user and stores it in a variable.
An optional prompt string is displayed in the
box when it appears.
PASSWORD is the same as INPUT, but displays all characters as asterisks.
GETDATA retrieves the contents of a form box
(as long as it is not a structure) into a variable;
see above for how to identify a box. PUTDATA copies specified text into a form box.
Form names are case-sensitive. Be sure to use
the same case as the form box name into which
you want to store data.
TO_CANON retrieves the contents of the current structure as a canonical string (or puts the
canonical string on the clipboard).
FROM_CANON generates a structure from
the canonical string.
TO_SMILES retrieves the contents of the current structure as a smiles string.
FROM_SMILES generates a structure from a
smiles string
530
CAL Commands
Appendix D
APPEND determines whether data in a storage
location is kept if other data is being moved
there. This setting is also consulted when you
do a File Export to SD or delimited text file.
APPEND ON causes any subsequent data
movements to append new data to old;
APPEND OFF causes old data to be overwritten. This applies to all variable commands
except PUTDATA. The default at program
startup is APPEND OFF.
APPENDVAL is a shortcut designed to make it
easier to build string values. It is the same as
setting APPEND ON, doing a SETVAL, and
then restoring APPEND to its original state.
TIP: The difference between APPEND ON and
APPENDVAL is that APPENDVAL does not
add a carriage return to the string being
appended, whereas APPEND ON does. If you
want to insert a carriage return at the end of the
string, use APPEND ON.
INCREMENT adds 1 to the value of a variable. Use INCREMENT in loops.
DECREMENT subtracts 1 from the value of a
variable. Use DECREMENT in loops.
LET allows you to perform mathematical operations on variables that contain integer or realnumber values. Only one operator per line is
supported. It recognizes the following operators:
•
•
•
•
+ for addition
- for subtraction
* for multiplication
/ for division
SUBSTR extracts a substring from a variable.
The extracted substring extends from a speci-
fied character to the end of the string, or from
one specified character to another.
The table below shows examples of Variable
Commands
Command
Action
SETVAL "some store text in V1
text"
SETVAL 2
store text in V2
"other text"
READVAL 9
tmpdata.txt
read text from file into V9
APPEND ON
turn on append mode
WRITEVAL
output.txt
append contents of V1 to file
SETVAL 2
"append me"
append text to contents of V2
APPEND OFF
turn off append mode
INPUT 2
"enter new
data"
prompt and get user input to
V2
GETDATA 3
molname
copy data from molname box
to V3
PUTDATA mol- store given string in molname
name ˝bebox
nzene˝
LET 3 $V1 +
$V4
sets V3 equal to the value
stored in V1 plus the value
stored in V4
SUBSTR 2
abcdef 3 5
stores cde in V2
ChemBioFinder & BioViz
User Guide
531
CAL commands SETVAL syntax
Assigns the specified string to a user variable.
SETVAL [variable] text
The SETVAL command has the following
arguments:
Part
Description
variable
User variable to which the
text is assigned.
text
String that is assigned to the
variable
Remarks
If variable is omitted, the text will be assigned
to V1.
If the file is greater than 32K in size, only the
first 32K is read.
READVAL example
This example uses the READVAL command to
assign the contents of a file to a variable. This
might be the first step, for example, in writing
the data to a database.
READVAL d:\reports\status.txt
CAL commands WRITEVAL syntax
Copies the contents of a user variable to a text
file.
WRITEVAL [v] filename
If variable is omitted, the text will be assigned
to V1.
CAL commands READVAL syntax
Reads the contents of a text file into a user
variable.user_variable_definition
The WRITEVAL command has the following
arguments
:
Part
Description
variable
User variable from which the
text is obtained.
filename
String containing the file
name in which to store the
text.
READVAL [v] filename
The READVAL command has the following
arguments
:
Part
Description
variable
User variable to which the
text is assigned.
filename
String containing the file
name from which to read the
text.
Remarks
The complete file path
(c:\some\long\path\TEMP.TXT) is necessary
when saving files
If the specified file does not exist, it will be
created; otherwise it will be overwritten.
Remarks
WRITEVAL example
The complete file path
(c:\some\long\path\TEMP.TXT) is necessary
when reading files
This example uses the WRITEVAL command
to write the contents of a variable to a text file.
532
CAL Commands
Appendix D
WRITEVAL 2 f:\formulas\mydata.txt
CAL commands INPUT syntax
Remarks
Displays a text input dialog, accepts data from
the user, and stores it in a variable
If variable is omitted, the text will be assigned
to V1.
INPUT [variable] [input]
The INPUT command has the following arguments
:
Part
Description
variable
User variable to which the
user’s data is assigned.
input
String presented as the
default input.
Remarks
Password entry example
This example uses the MSG command to
prompt the user for a password, then the PASSWORD command to retrieve it. After using the
IF command to test whether the password is
correct, it either EXITs or continues with the
rest of the script.
msg Please enter the secret
password...
password 1
if $v1 <> "the secret password"
exit
* ...etc.
If variable is omitted, the text will be assigned
to V1.
CAL commands GETDATA syntax
CAL commands PASSWORD syntax
Reads the contents of a data box into a user
variable.
Displays a text input dialog, accepts data from
the user, and stores it in a variable. Each character entered by the user is displayed as an
asterisk to conceal its identity.
PASSWORD [v] [default]
The PASSWORD command has the following
arguments:
Part
Description
variable
User variable to which the
user’s data is assigned.
default
String presented as the
default password.
GETDATA [v] box
The GETDATA command has the following
arguments
:
Part
Description
variable
User variable to which the
text is assigned.
box
Box identifier indicating the
source of the text.
Remarks
GETDATA accepts only boxes that contain
text or data that can be represented as text
(including numbers, formulas, or dates). You
cannot GETDATA from a data box containing
a structure or a picture.
ChemBioFinder & BioViz
User Guide
533
If variable is omitted, the text will be assigned
to V1.
CAL commands PUTDATA syntax
Copies the contents of a user variable to a data
box.
Settings
The settings for value are
:
Setting
Description
ON
New data is added to the end
of existing data.
OFF
New data replaces existing
data.
PUTDATA box text
The PUTDATA command has the following
arguments
:
Part
Description
box
Box identifier indicating the
destination of the text.
text
String containing the text to
store.
Remarks
If PUTDATA attempts to store text in a data
box that contains a non-text data type (such as
a number, date, or formula), the text will automatically be converted to the correct type.
CAL commands APPEND syntax
Determines whether data in a user
variableuser_variable_definition is kept if
other data is being moved there.
APPEND value
The APPEND command has the following
argument:
Part
Description
value
Value describing whether
new data should be added to
the end of existing data or
whether it should overwrite
the existing data.
534
CAL Commands
Appendix D
Different form example
This example shows how you can use a script
to open a second form with some of the same
fields as the original form but, for example, a
different layout. This same sort of procedure
can be used to display related records if you do
not want to use an explicit subform.
The APPEND, SETVAL, and GETDATA commands build a search string based on the contents of the link_field field on the original
form. The Menu Command File Open opens
the second form, or switches to it if it is already
open. Finally, the Menu Command Search
Enter Query enters search mode, the PUTDATA command enters the search string generated earlier in the script, and the Menu
Command Search Find executes the search.
append off
setval 1 "="
append on
getdata 1 link_field
append off
file open
d:\chemfndr\otherform.cfx search
enter query
putdata link_field $v1
search find
CAL commands APPENDVAL syntax
writemol $v1
rec next
endloop
Concatenates a new string to the end of an
existing user variable.
APPENDVAL [v] text
Environment variables
The APPENDVAL command has the following arguments
:
Part
Description
variable
User variable to which the
text is concatenated.
text
String that is concatenated to
the variable.
Remarks
APPENDVAL is a shortcut designed to make it
easier to build string values. It is the same as
setting APPEND ON, doing a SETVAL, and
then restoring APPEND to its original state.
If variable is omitted, the text will be assigned
to V1.
Saving compounds example
This example uses the LOOP...ENDLOOP
commands and the Menu Command Record
Next to step through each record in the current
list. For each record, it builds a unique file path
based on the current $INDEX using SETVAL
and APPENDVAL commands. Finally, it saves
each compound to disk with the WRITEMOL
command. Since the file path ends in .cdx, this
script saves all of the compounds in ChemDraw format.
append off
loop
setval 1 c:\mydir\
appendval 1 $index
appendval 1 .cdx
$INDEX
$RECNO
$NUM_RECS
$DTBA_NAME_LONG
$DTBA_NAME_SHORT
$FORM_NAME_LONG
$FORM_NAME_SHORT
$CFW_DIR
$FORM_DIR
$SYSTEM_DIR
NOTE: To view a complete list of variables,
click Help on the Enter Cal Command dialog
box.
ChemBioFinder provides several variables to
allow you to retrieve information about the
current ChemBioFinder environment. They
cannot be set directly, but are modified as a
consequence of other commands.
For example, the menu command:
Record Next
increments the current RECNO by 1.
The table below shows examples of Environment Variables
:
Command
SETVAL 1
$RECNO
Action
V1 now equals the
number of the current
record
ChemBioFinder & BioViz
User Guide
535
Command
Action
SETVAL V1
$NUM_RECS
V1 now equals total
number of records in the
current list
SETVAL V1
$DTBA_NAME_
LONG
V1 now equals, for
example “c:\ChemBioFinder\mydb.mdb”
SETVAL V1
$FORM_NAME_
SHORT
V1 now equals, for
example “mydb”
SETVAL V1
$SYSTEM_DIR
V1 now equals, for
example, “c:\chemfndr\system”
Script-only commands
*text
:label
label:
GOTO label
IF v1 op v2 stmt
IF v1 op v2
<stmt(s)>
[ELSE
<stmt(s)>]
ENDIF
LOOP [count]
ENDLOOP
PAUSE [dseconds]
EXIT
INTERACTIVE ON/OFF
STEP ON/OFF
Script-only commands are useful only in script
files, not interactive CAL.
An asterisk (*) is used to mark a line as a comment and not a command that should be executed.
536
CAL Commands
Appendix D
Labels and GOTO give a mechanism for jumping backwards or forwards in a script. A label
may be any text string starting or ending with a
colon. It may appear anywhere in the script.
(Prior to ChemOffice 2005, it had to appear
prior to any GOTO that referenced it.)
IF is a standard conditional statement. It compares two values according to an operator, and
then executes its final statement if the result is
true. In the IF/ELSE format, it executes the
ELSE statement when the IF statement is false.
Valid operators are:
Table 32:
=
<>
<
>
LOOP begins a section of code that will execute repeatedly, until ENDLOOP is reached.
By default, the number of times the code executes is equal to the number of records in the
current list, but you can provide a specific
count in the LOOP statement.
TIP: ENDLOOP can be used anywhere within
a loop clause to mean “continue to the next
iteration”. Example:
LOOP
RECORD NEXT
IF $HAS_MOL = 0
ENDLOOP
ENDIF
CLEAN
ENDLOOP
In this example, if a record has no structure, the
program goes to the next record and skips the
CLEAN.
PAUSE temporarily stops the script from executing for a specified number of tenths of a
second. If no number is given, the duration of
the pause is 2 seconds.
EXIT ends the script immediately.
INTERACTIVE turns interactive mode on or
off.
STEP toggles single-step (debugging) mode on
and off.
The table below shows examples of ScriptOnly Command.
Command
Action
start:
a label
IF $V1 =
"" MSG
Empty
value!
provide an error message if the
variable V1 is empty
PAUSE 100
pause 10 seconds
GOTO start go to specified label
*[text]
The * command has the following argument
Part
Description
text
String containing the
comment.
Remarks
The * character must be the first character in a
line to mark it as a comment.
This command is useful only in a script file,
and has no effect when entered on the Command Line.command_line_definition
CAL commands: syntax
Labels a line with the preceding or following
text.
:label or label:
The **command has the following argument
:
LOOP 10
begin loop to repeat ten times
PAUSE
Part
Description
pause the default time: 2
seconds
label
Text to be used as a label.
return to LOOP statement
until done
Remarks
ENDLOOP
NOTE: Script commands are subject to
change. See the Readme for up-to-date information.
CAL commands * syntax
Marks a line as a comment, and not a command to be executed.
This command is useful only in a script file,
and has no effect when entered on the Command Line.
CAL commands GOTO syntax
Unconditionally transfers execution to a specified line in the current script.
GOTO label
The GOTO command has the following argument
ChemBioFinder & BioViz
User Guide
537
:
IF variable operator value command
Part
Description
label
String indicating the destination line.
Remarks
The label must be correctly specified with a
“:CAL_:”.
This command is useful only in a script file,
and has no effect when entered on the Command Line.
GOTO example
This example allows the user to batch-enter
several new compounds and input one field for
each. It starts with a MSG command to tell the
user what to do. Then it has a line starting with
a colon (:) that serves as a label to start the
loop. The INPUT command gets the name of
the new entry from the user. The IF command
tests to see if the user entered a blank string,
and EXITs the script if so. After the Menu
Command Record Add creates a new record,
the PUTDATA command enters the user’s
string into the molname field.
Closing the loop, the GOTO command jumps
execution back to the start label.
or
IF variable operator value
command
[ELSE
command]
ENDIF
The GETDATA command has the following
arguments
:
Part
Description
variable
User variable that is the basis
of the comparison.
operator
Comparison function.
value
String that is to be compared
to the variable.
command
Any valid CAL command.
Settings
The settings for operator are
:
Setting
Description
<
Command will be executed if
value is less than variable.
>
Command will be executed if
value is greater than variable.
=
Command will be executed if
value is equal to variable.
!=
Command will be executed if
value is not equal to variable.
msg Enter new compound names.
Enter a blank name when complete
:start
input 1
if $v1 = "" exit
record add
putdata molname $v1
goto start
CAL commands IF syntax
Conditionally executes a command depending
on the value of an expression
538
CAL Commands
Appendix D
Setting
Description
<>
Command will be executed if
value is not equal to variable.
Remarks
Only one CAL command may be executed by
each IF statement. However, that one command may be a GOTO that skips over many
other commands.
CAL commands LOOP...ENDLOOP
syntax
Executes a block of statements repeatedly.
This example uses the LOOP command and
the Menu Command Record Next to display all
of the records in the current list.
The PAUSE command keeps each record on
screen long enough for people to see it.
loop
rec next
pause 2
endloop
CAL commands PAUSE syntax
Temporarily stops the script from executing.
PAUSE [decisecs]
The PAUSE command has the following argument
:
LOOP [count]
[statements]
ENDLOOP
The LOOP...ENDLOOP commands have the
following arguments
:
Part
Description
count
Number of times the statements are to be repeated.
statements
LOOP example
Commands that are repeated
a number of times.
Remarks
If count is omitted, the statements will be
repeated a number of times equal to the number of records in the current list.
This command is useful only in a script file,
and has no effect when entered on the Command Line.
Part
Description
decisecs
Amount of time to suspend
script execution.
Remarks
10 decisec = 1 second.
If the decisecs argument is omitted, the script
will be suspended for 2 seconds.
CAL commands EXIT syntax
Immediately halts execution of a CAL script.
EXIT
Remarks
This command is useful only in a script file,
and has no effect when entered on the Command Line.
ChemBioFinder & BioViz
User Guide
539
540
CAL Commands
Appendix D
E
CS Oracle Cartridge
Pre-setup procedures
Prerequisites for connecting ChemBioFinder/Oracle to an Oracle database:
• ChemBioFinder Ultra
• Oracle Client
• Oracle OLEDB Provider
ChemBioFinder Ultra: We recommend Version
10.1 or newer.
Oracle Client: We recommend version 9i or
newer. This is available as a free download
from
http://www.oracle.com/.
1.Download and install the Oracle Client software (version 9i). This is available free from
Oracle. Note that there are different versions
for 32 bit, 64 bit, and Itanium systems.
The minimum install alone (called
“Runtime”) is not adequate to provide
support for ChemBioFinder/Oracle. In
addition, you must subsequently choose the
“Custom” install, and select “Oracle
Windows Interfaces.” If you do not have
the requisite components installed, an
attempt to open an Oracle database will
generate the error: “Provider cannot be found.
It may not be properly installed.”
2.Have the Oracle administrator install CS
Oracle Cartridge (9 or 10). You can use
ChemBioFinder/Oracle to access any Oracle
database, but one without the CS Oracle Cartridge cannot be used to store or search
chemical structures.
3.Have the administrator set up a user account
for you. ChemBioFinder/Oracle requires that
you log in to a tablespace in which you have
write privileges. For access to corporate
files, the administrator needs to grant you
read-only privileges to tables and views of
interest outside your tablespace.
4.On your machine, use Oracle Net Configuration Assistant to establish a connection to
each Oracle database you intend to use.
In principle, ChemBioFinder/Oracle can
access any Oracle database and make sense of
it. In practice, some preparations are recommended:
• You can access data in Oracle databases
which do not have the CS Oracle Cartridge
installed — for example, biological databases — but you cannot search or sort by
structure or structure-related properties.
ChemBioFinder/Oracle has been developed
with CS Oracle Cartridge version 9 or 10,
and is not likely to work with earlier versions. (To display the Cartridge version,
look in the Database tab of the Properties
dialog. The version is listed, or “None” if
unavailable.)
ChemBioFinder & BioViz
User Guide
541
• Any table containing structures should have
a unique primary key. If you connect to a
table without a unique primary key, you get
a warning message. You can set up a primary key in ChemBioFinder (see “Indexing” on page 419.)
• ChemBioFinder/Oracle users must have
sufficient privileges to create tables in their
own tablespaces.
Fast-move caching scheme
Normally, when you open a database or do a
search, ChemBioFinder issues a select statement. The server then processes the statement,
prepares a set of records, and provides a “cursor” for navigating through them to retrieve the
data. Unfortunately, when the cursor is asked
to move to a position N records from the current one, it requires all N to be downloaded to
the client. In the worst case, you open a large
table and use Move Last to see the last record,
and the entire table is sent down from the
server.
To get around this problem, an alternative
mechanism is available in ChemBioFinder/Oracle. In this scheme, instead of
requesting complete forms-full of data over a
list or query, ChemBioFinder/Oracle retrieves
only the ID or primary key field, and stores
(“caches”) the results in an array in memory. It
then need not rely on the normal recordset cursor. When a request is made to move to record
N, the key for that record is looked up in the
array, and a new select statement is issued to
retrieve only the corresponding record. Thus,
Move Last takes no more time than Move Next.
There are tradeoffs between the two schemes:
• The new scheme takes time to retrieve the
set of ID's during a database open, or after a
search or sort. Normally, this is quite fast
542
CS Oracle Cartridge
Appendix E
even for a large table, and steps are taken to
avoid repeating the operation unless necessary. A message on the status bar indicates
when this caching process is taking place.
• In the new scheme, moving from one
record to the next is somewhat slower, since
each move involves a (fast, one-hit) search.
This is not very noticeable during list
browsing, but slows down multi-retrieve
operations such as filling table view.
Because of these drawbacks, the new caching
scheme is OFF, by default. To turn it ON for an
Oracle-connected form:
1.Click the File>Database menu command, or
otherwise bring up the Properties dialog.
2.Go to the Oracle tab of the dialog.
3.Check the Cache ID's for faster moves box.
4.Click OK.
You will get an alert instructing you to:
5.Save the form, close it, and reopen it. This is
currently necessary in order to reinitialize the
database connection with the caching
scheme.
Configuring via CF_SETTINGS
table
When you select a table in an Oracle database,
ChemBioFinder determines and displays the
types of columns in the table. Here’s how it
decides whether a particular column contains
structures:
• The column must be of type CLOB or BLOB.
• If the column has been indexed by the CS
Oracle Cartridge, then it is a structure column.
• If there is no index, then ChemBioFinder/Oracle looks for a table of configuration info called CF_SETTINGS. If the
column is listed in that table as being of
type STRUCTURE, then it is a structure column.
The CF_SETTINGS table is also used to determine whether a particular column of type BLOB
contains ChemBioFinder pictures (Windows
metafiles).
To designate an unindexed column as a structure column:
1.In the Field tab of the Properties dialog,
select a column of type BLOB or CLOB.
2.Click Set As Structure.
If the CF_SETTINGS table has not yet been
created, an alert indicates that it is about to
be created.
3.Click OK to proceed and create the table, or
Cancel to abort without creating.
If the table already exists and there is
already an entry for the selected column,
you are given an alert and a chance to
cancel.
4.Click OK to proceed.
A new entry is created in the table, marking
the selected column as a structure column.
To designate a BLOB column as a picture column:
1.If the CF_SETTINGS table does not exist, create it using steps 1-3 of the above procedure.
2.Edit the table one of two ways:
• with an Oracle client tool such as
SQL*Plus, OR...
• by opening it in ChemBioFinder and creating a form.
3.Add a row containing the table name, column name, and a column of type PICTURE.
Searching
Here’s what happens when you present a query
to ChemBioFinder/Oracle:
1.If the query contains a structure, it is converted to a text representation and copied to a
temporary table.
NOTE: The table is called temp_queries. It is
created in the CSCartridge tablespace, and removed as
soon as the search is finished or interrupted.
ChemBioFinder does not yet handle the case of multiple
structure boxes where more than one contains a query.
2.The query is converted to a SQL select statement. Query components in form boxes are
ANDed together (just as in ChemBioFinder),
where the structural parts are calls into the
CS Oracle Cartridge structure search functions.
3.The hits table is created, if it does not already
exist.
4.A unique ID is assigned to the new list which
will result from the search.The select statement is wrapped in a larger SQL statement
which will cause the results to be deposited
directly into the hits table.
5.The SQL is executed.When the search is
complete, the results are new rows in the hits
table. Each row contains the new list ID
alongside the ID of a record from the
searched table.
6.The final list is prepared by a join, selecting
rows from the main table which have record
ChemBioFinder & BioViz
User Guide
543
ID's matching those of the new list in the hits
table.
The resulting list is ready to browse, save,
export, etc.
NOTE: Text searches in Oracle are case sensitive. You will get different hits from the query
“benz*” than from “Benz*.”
544
CS Oracle Cartridge
Appendix E
Index
Symbols
, in query 359
parentheses symbol 359
query operators
parentheses 359
\, in query 369
Numerics
1D plot 304
2D plot 306
3D properties 363
3D searching 363
3D structure display 320
A
A (any), special atom type 489
Access
attaching tables from 342
manipulating MDB files 469
multi-user 336
read-only 336
secured 337
Access database, opening 335
accessing relational data using subforms
399
ActiveX control 481
ADD indicator 347
ADD indicator, description 286
ADD indicator, when displayed 289
add new record command 347
adding
buttons 317
checkboxes 317
data 347
data box menu 321
fields 343
menu to a data box 321
pictures 316
plain text 316
records 289 297 347
scroll bars 321
structures 347
tables 354 403
adding multiple structures to forms 345
adding structures to non-chemical databases 345
aligning
objects 326
aligning and distributing objects 326
alternate groups
searching with 363
alternative groups
attachment point symbol 365
defining 364
description 363
anchored substring text queries 357
AND operator, hit lists 384
AND operator, queries 358 359 368
annotations, showing 452
ASCII file, exporting 395
assigning fields to data boxes 296
atom
lists 385
atom lists 490
atom not-lists 490
atom properties 489
atom types
A (any) 489
and bond types 385
link node 386
,
,
,
,
,
ChemBioFinder & BioViz
User Guide
545
M (metal) 489
overview 385
Q (heteroatom) 489
X (halogen) 489
atoms 483
atom-to-atom mapping 367
attaching
files from a file-based database 342
tables from other applications 342
attaching files from a non file-based database 342
attachment points
defining 365
tool 365
automatic labels 316
autoscale 307
autoscale, see also rescale
B
backing-up databases 346
bin, definition 426
BioViz
changing fields 434
curve fitting 428
description 285
details window 424
empty points 424
filter sliders 432
histogram plots 425
selecting points 424
setting display range 432
statistical analysis 428
bitscreen 497
bond
length, uniform 452
types, overview 385
bond properties 493
in queries 493
ring/chain 493
546
Index
bond types
double either 484
in queries 483
special 493
bonds 483
boolean field, fields
boolean 344
boolean operations, in queries 358
boolean operations, on hit lists 383
box creation commands, CAL 502
box manipulation commands, CAL 507
boxes
changing styles 319
creating 314
deleting 325
font 322
hiding or showing 321
moving 324
properties 318
resizing 325
selecting 324
style 318
bring to front command 325
browsing
databases 338
browsing search results 475
browsing with the record tool 338
Btrieve 342
buttons, creating 317
C
CAL
box creation commands 502
box manipulation commands 507
environment variables 535
execute with button 317
file commands 527
general commands 513
help 460 499
,
menu commands 499
overview 459
program execution commands 510
script-only commands 536
variable commands 529
CAL syntax
ACTIVATE 509
APPEND 534
APPENDVAL 535
BUTTON 506
CALL 511
CLEAN 527
DBOX 503
DDE 512
DELBOX 508
DOS 512
ENDLOOP 539
EXEC 512
EXIT 539
FONT 514
FORMEDIT 509
FRAME 504
GETDATA 533
GOTO 537
HELP 527
IF 538
INPUT 533
LOOP 539
MENU 499
MSG 514
OPENDB 529
PASSWORD 533
PAUSE 539
PICT 505
PUTDATA 534
QUIETCLOSE 515
READVAL 532
SEEPTAB 515
SELECT 510
SET 516
SETFIELD 508
SETTEXT 508
SETVAL 532
SUBFM 506
TEXT 504
UNSELECT 510
WRITEVAL 532
CF$_SORT table 416
CFS file format 468
CFX file format 313
chain bonds 493
changing
box style 319
database scheme 354
layout of an existing subform 401
changing colors 433
changing the display 433
charges and radicals 485
charges, in queries 485
check valences 453
checkboxes 317
Chem3D
viewing models 351
ChemDraw
editing structures 350
ChemDraw ActiveX control 481
ChemDraw format, viewing in 319
ChemFinder
opening options 453
toolbars 287
UI 285
ChemFinder/Office
customizing 480
look In tab 471
overview 471
preferences 481
ChemBioFinder & BioViz
User Guide
547
search options tab 479
send to menu 477
settings 480
UI 471
cleaning structures 350
clearing forms 347 373
color
preferences 452
color, setting 323
combined searches see searching, combined
combined searches, see searching, combined
commands
add new record 347
bring to front 325
commit changes 348 350 351
current Record 289
current record 285
data source 333 342
delete record 353
enter query 373
Find 373
find current molecule 375
Find List 360
find text 344
first record 338
go to record 338
Intersect with current list 384
last record 338
next record 338
previous record 338
read structure 392
redo 353
replace current list 383
restore list 383
save list 383
Save Structure 394
,
,
,
548
Index
,
search over list 303
send to back 325
undo changes 349
commit changes command 348 350 351
committing changes vs. saving 313
committing new data 348
communicating with other applications using DDE 467
communicating with other applications using OLE automation 468
communicating with other applications using scripts 467
commutative principle 497
complete structure similarity, see Tanimoto
similarity
compound profiles 405
creating 406
customizing 411
display preferences 409
dist 410
editing 408
score 406
search/sort 410
concurrent access 336
connection table file format 389
controls, embedding 458
counterions 351
create database button 341
create table dialog box 341
creating
and editing tabs 318
boxes 314
boxes with frames 315
button 317
data box menu 321
data boxes 294 315
databases 335 341
fields 343
,
,
,
,
forms 313
forms automatically 311
forms with the database tree 313
forms, manually 313
forms, tutorial 293
frames 315
multiple tables 354 403
picture boxes 316
portal databases 346
scripts 460
subforms 310 399 400
tables 341
tabs 318
text 316
creating a database, tutorial 296
creating a plot 304 425
creating and editing forms 311
creating and saving forms 295
current list
counter 289
description 285
size 289
current mol, as query command 375
current record command 285 289
curve fitting, see BioViz
customizing
ChemFinder 451
favorites tree 455
fonts 322
numbers 322
text 322
toolbars 456
customizing fonts 322
,
,
,
,
,
D
data
adding 347
committing 349 352
deleting 353
,
displaying 314
editing 349
entering 354
exporting 394
items 290
sorting 353
data box tool 315
data boxes
editing 294
read-only 289
data boxes, creating 315
data boxes, hiding or showing 321
data source
command 333 342
ODBC 342
selecting 333 342
data source - find chemical structures window 471
data table
displaying 338
moving columns 338
resizing columns 339
resizing rows 339
sorting 353
subforms 402
data tables 338
data, importing 389
database
creating 335
database model, description 290
database size display, description 287
database tree, using 313
database, connecting to a form 295
database, definition 291
databases
adding structures 345
cells 290
creating 341
,
,
ChemBioFinder & BioViz
User Guide
549
data items 290
flat-file 341
logon 337
model 290
moving 346
multiple tables 342
non-chemical 342 345
opening 333 336
read-only 289
resetting 354
selecting 333
size 289
vs. forms 292
date fields 344
date queries, see searching, for dates
dates, display preferences 359
dBASE 342
DDE, to communicate with other applications 467
debugging scripts 461
delete record command 353
deleting
boxes 325
contents of fields 353
data 353
fields 345
objects 325
records 353
tables 341
delimited text files 395
demo database 298
details window 306
details window, description 286
details window, see BioViz
dimension, definition 426
disabling security 331
display preferences 451
distributing objects 326
,
550
Index
,
domains 382
double either bond type 484
drag and drop 392
duplicate reagents, in RD or SD import 390
duplicating
records 348
E
editing
data 349
data boxes 294
fields 349
forms 324
labels 315
redo 325
structures 349
structures with ChemDraw 350
tabs 318
undo 325
element editor 457
element ranges in queries 359
elements
color 458
physical data 457
selecting 457
embedded controls 458
embedded controls, customizing 458
empty points, see BioViz
enter label dialog box 317
enter query command 373
enter script command dialog box 459
entering
data 354
queries 289 369 373
reaction queries 375
structural queries 374
structures 347
environment variables, CAL 535
equals symbol (=), in query 359
,
,
exact searching 361
exact searching, see also normal searching
exact searching, see also similarity searching
Excel
communicating with, using CAL 459
communicating with, using DDE 467
security setting when importing 329
explorer window
description 286
exporting
ASCII files 395
current hit list 383
data files 394
delimited text files 395
security settings 330
subform fields 396
Word files 396
exporting to another application 477
extraneous fragments, permitting in full
structure searches 371
F
fields
creating 343
date 344
deleting 345
deleting contents 353
editing 349
formula 341
integer 344
memo 344
Mol_ID 341
molecular weight 341
picture 344
read-only 289
real 344
sorting 353
structure 341 344
,
text 343
fields, assigning to data boxes 296
file commands, CAL 527
file formats
MDL 488
file formats, supported 389
file-based databases, attaching tables 342
files
DSD 476
log 391
SDF 476
selecting with look in tab 472
selecting with open file menu 472
filter window 306
filter window, description 286
filtering 430
filters 307
find command 373
find current molecule command 375
find list command 360
find text command 344
first record command 338
fit to box 452
fixed labels 315 320
flat-file databases 341
fonts, customizing 322
form
tool 314
toolbar 314
form toolbar, description 286
form, definition 291
forms
adding multiple structures 345
clearing 373
creating automatically 311
creating manually 313
editing 324
moving 346
,
ChemBioFinder & BioViz
User Guide
551
saving 313
setting security 327
vs. databases 292
forms, creating and saving 295
formula field 341
formula input rules 495
formula searching see searching
formula, searching by 474
formulas
input rules 495
sorting 353
FoxPro 342
fragments
in full structure searches 371
searching 362
frame tool 315
framed box tool 315
framed boxes 315
framed boxes, creating 315
framed boxes, description 286
frames 315
frames, creating 315
framing pictures 452
free sites, in queries 491
full structure searching 362
full structure searching, see also substructure searching
full strucuture searching 362
G
G groups, see alternative groups
general
properties 483
general preferences 453
generic groups, see alternative groups
generics, hitting in queries 371
go to record command 338
grid 314
spacing 452
552
Index
tool 314
H
headers, delimited text files 395
help, CAL 460
hiding
annotations 452
data boxes 321
histogram plots 306 425
hit any charge on carbon 371
hit any charge on heteroatom 371
hit lists
boolean operations 383
current 289
intersecting 384
joining 384
merging 383
replacing 383
restoring 383
saving 383
saving as text files 383
hydrogens
in queries 484
hydrogens, added to structures 351
,
I
ID queries 360
identity searching, see exact searching
implicit hydrogens 492
in queries 492
on metals 453
implicit hydrogens, added to structures 351
importing
data 389
duplicate reagents from RD or SD files
390
from a specified location 391
hit lists 383
log files 391
partial RD or SD files 390
RDFiles 390
SDFiles 390
security settings 330
structure data and reaction data files
390
structures 390
structures only, from RD and SD files
390
text files 393
importing and exporting data 389 396
inequality symbols (), in query 359
integer fields 344
intermediates, in queries 368
Intersect with current list command 384
ISIS/Graphic files 389
ISIS/Sketch files 389
isotopes 485
–
L
labels
editing 315
fixed 315 320
fonts 322
live 320
labels, formatting 289
languages other than English, sorting 354
last record command 338
layout tool 314
link node 386
linking subforms to main forms 399
live labels 320
LN (link node), special atom type 386
489
locking plots 426 427
log files 391
logon, database 337
,
,
,
M
M (metal), special atom type 489
main form, description 286
main toolbar, description 286
managing
queries 380
mapping atoms in reaction queries 367
Markush structures 351
matching stereochemistry 372
mathematical operators, in CAL commands
530
MDL file format 488
MDL molfiles 389
MDL rxnfiles 389
memo fields 344
menu bar, description 286
menu commands, CAL 499
menu, adding to data box 321
minus symbol (-), in query 359
models
viewing with Chem3D 351
modifying data 349
Mol_ID field 341
molecular formula queries, see searching,
for formulas
molecular formula searches, see searching,
for formulas
molecular weight field 341
molecular weight, searching by 474
moving
boxes 324
objects 324
moving forms and databases 346
MS Access see also Access
MS Access, workgroup information 327
MSI molfile 389
multiple structures, adding to forms 345
multi-step reactions 366
ChemBioFinder & BioViz
User Guide
553
multi-user access 336
N
name searching 300
new form, creating 313
new record indicator, description 286
next record command 338
non file-based databases, attaching 342
normal searching 360
normal searching, see also exact searching
normal searching, see also similarity
searching
numbers, customizing 322
numeric format 322
numeric searches 300 358
,
O
objects
aligning 326
deleting 325
distributing 326
spacing 326
ODBC, adding structures to existing sources 345
ODBC, selecting data sources 342
OLE automation, communicating with other applications 468
OLE automation, overview 468
open database button 334
open last form on startup 453
opening
databases 333 336
existing chemical databases 333
hit lists 383
secured MS Access databases 335
opening a database, tutorial 295
opening options see preferences
options 425
OR operator, hit lists 384
,
554
Index
OR operator, queries 358
Oracle
attaching tables 342
case-insensitive query matching 372
handling lists in 416
indexing 419
loading 418
opening a database 414
searching in 415
setting preferences 417
setup 413
updating and adding data 417
using CAL with 420
Oracle Cartridge
configuration via CF_SETTINGS table
542
fast-move caching scheme 542
pre-setup procedures 541
ordering objects 325
other applications
attaching tables from 342
other applications, communicating with using DDE 467
other applications, communicating with using OLE Automation 468
other applications, communicating with using scripts 467
Output window 464
output window, description 286
overlay 309
overlay, with scatter plots 432
overriding security 331
P
Paradox 342
password, for secured forms 337
periodic table 457 484
picture box, description 286
picture boxes, creating 316
,
picture fields 344
picture tool 316
pictures 316
framing 452
of structures 351
preferences 452
saving 317
saving ChemDraw drawings as 351
searching 351
updating 317
plain text tool 316
plot properties
point limit 305
plots
histogram 306
single variable 304
two variable 306
plotting options 304
portal database 346
precision, in numerical queries 358
preferences
color 452
date display 359
display 451
general 453
grid spacing 452
picture display 452
recent file list size 454
registration 453
search details 370
search type 369
setting 451
stereochemistry 372
structure display 451
tuning 372
preferences in ChemFinder/Office 481
previous record command 338
printing 397
products
in queries 368
searching for 366
profile box, description 286
profiles, see compound profiles
program execution commands, CAL 510
Python 462
Python interactive mode 464
Python, script creation 463
Q
Q (heteroatom), special atom type 489
QRY indicator 289
QRY indicator, description 286
queries
anchored substring 357
atom lists 385 490
atom not-lists 490
atom properties 483
atom properties in 489
atom types 385 483
bond properties 493
bond types 385 483
booleans 358
charges 485
context menu 381
creating from BioViz plot 309
dates 359
entering 289 369 373
exact structure 362
finding current structure 375
formulas in 358
free sites 491
full structure
hydrogens in 484
ID 360
identity 361
implicit AND between fields 358 368
implicit hydrogens 492
,
,
,
,
,
,
ChemBioFinder & BioViz
User Guide
555
inequalities 359
intermediates 368
isotopes 485
multiple fields 368
multiple fragments 362
multiple substructures 387
no highlighting 375
numbers in 358
overlapping fragments 371
plotting with BioViz 309
precision 358
products 368
progress display 368 374
radicals 485
ranges 358 359
reactants 368
reactions 366
red highlighting 368 374
refining 374
similarity 361
similarity rules 497
special atom types in 489
special bond types 493
SQL 369
stereochemistry 363 486
stopping 374
structural similarity 361
structures 360
subforms 402
submitting 373
substituents 484 490
tuning 372
unsaturation 492
using current structure 375
query operators
\ 369
equals (=) 359
greater than (>) 359
,
,
,
,
,
556
Index
less than ( 359
minus (-) 359
query properties
conflicting 483
overview 483
Questel F1D files 389
Questel F1Q files 389
R
r groups, see alternative groups
R, special atom type 489
radicals, in queries 485
ranges, in queries 358
RDFiles 330 390 394
reactants, in queries 368
reactants, searching for 366
reaction centers 366 493
bond type 497
bond types 493 495
display preferences 454
overview 366
reaction queries 366
atom-atom mapping 367
creating 375
hitting reaction centers 366 371
intermediates 368
products 368
reactants 368
reaction queries, tutorial 301
reaction searches 366
reactions
multiple-step 366
READ indicator 289
READ indicator, description 287
read structure command 392
reading a structure 392
read-only access 336
read-only fields 289
real fields 344
,
,
,
,
,
recent file list size, setting 454
record number dialog box 338
record tool 338
record toolbar
browsing with 338
description 287
illustration 333
records
adding 289 347
current 285 289
deleting 353
duplicating 348
moving between 338
redo command 325 353
redoing changes 353
redundant reagents, in RD files 390
refining queries 374
refining your search
overview 478
refining your search, search options 479
refining your search, search tools 478
registration preferences 453
relational data and subforms 399
relational database, definition 291
relational databases 342 399
relative tetrahedral stereochemistry 373
487
renaming
tabs 318
replace current list command 383
rescale 307
rescale, see also autoscale
resetting the database 354
resizing
boxes 325
objects 325
restore list command 383
restoring a hit list 383
,
,
,
,
,
restoring changes 325
reversing and restoring changes 325
R-group tables 339
R-group tables, persistence 340
R-group tables, sorting 340
ring bonds 493
rules 495
S
sample databases 293
save command 348
save command, effect on changes 313
save dialog box 313
save list command 383
save structure command 394
saving
and restoring lists 382
data sources 475 476
directory paths to search 476
files 475
forms 313
hit lists 383
pictures 317
search results 476
structures 394
subforms 313
vs. committing 313
scaling structures 452
script-only commands, CAL 536
scripts
communicating with other applications
467
debugging 461
executing 461
in subforms 403
writing 460
scroll bars, adding 321
SDFiles
exporting 394 396
,
,
ChemBioFinder & BioViz
User Guide
557
,
SDFiles, importing 330 390
search
examples 384
toolbar 369
type 360
search details preferences 370
search options 479
search over list command 303
search results 475
search toolbar, description 287
searching
by chemical formula 474
by chemical structure 473
by molecular weight 474
by multiple properties 474
by reaction type 303
by selected files 475
case-insensitive 372
combined 368
directory paths 476
DSD files 476
enter query 479
for dates
for formulas 299
for intermediates 368
for names 300
for numbers 300 358
for products 302 368
for reactants 301 368
for substructures 300
formula element ranges 359
formula query rules 359
full word 372
fullerenes 386
ISIS style 372
loose delocalization 372
more than one substructure 387
parentheses in formulas 359
,
,
,
558
Index
procedures 369
refining 478
restore previous query 479
save results 476
search options 479
search tools 478
start 479
subforms 402
tuning 372
searching a database, tutorial 298
searching, combined 301
searching, for dates 359
searching, for formulas 358
secured Access 337
securing forms 327
security
disabling 331
MS Access workgroup information
327
overriding 331
setting options 327
selecting
boxes 324
data to display 334
databases 333
objects on a form 324
selection tool 324
send to back command 325
sending to another application 477
setting
alerts 453
box properties 318
color 323
data box styles 318
fixed and live data 320
numeric format 322
preferences 451
recent file list size 454
search details preferences 370
search type preferences 369
security options 327
stereochemistry search preferences 372
showing
annotations 452
data boxes 321
opening dialog 453
reaction centers 454
similarity rules 497
similarity searching 361
similarity searching, see also exact searching
similarity searching, see also normal
searching
SMD files 389
Sorting 429
sorting
by subform aggregate (Oracle) 416
data 353
data tables 353
fields 353
formulas 353
from the data table 353
in reverse order 353
languages other than English 354
Oracle databases 416
structures 353
text 353
special atom types, list of 489
special bond types 493
special structure searches 376
SQL searches 369
statistical analysis 307
statistical analysis, see BioViz
status bar 289
status bar, description 287
stereochemistry 486
allenic 486
cis/trans double bonds 486
octahedral 486
overview 363
queries 486
relative tetrahedral 373 487
search preferences 372
square planar 486
tetrahedral 486
trigonal bipyrimidal 486
stopping
queries 374
Struct>Name(TM) 395
structural query features 483
structure
columns 345
display preferences 451
queries 360
registration options 453
searches 360
structure box, description 287
structure field 341 344
structure mode 361
structure window 306
structure window, description 287
structures
adding 347
adding to non-chemical database 345
as pictures 351
checking chemistry 351
chemically-significant text 351
cleaning 350
copying as text strings 395
editing 349 350
entering 350 453
file formats 389
importing 390
query properties 483
,
,
,
,
ChemBioFinder & BioViz
User Guide
559
,
red highlighting in queries 368 374
scaling 452
sorting 353
structures, importing only 390
style, box, changing 319
style, definition 426
styled text 352
subform fields, exporting 396
subform, description 287
subforms
changes in ChemFinder 9 399
creating 400
data table 402
linking fields 399
overview 399
searching 402
switching between forms and data tables 402
tutorial 310
using scripts 403
subforms, tutorial 309
submitting queries 373
substituents 484
exactly 490
free sites 491
in queries 484 490
up to 490
substructure searches 361
substructure searching 300
substructure searching, see also full structure searching
substructure searching, see also similarity
searching
substructure similarity 498
supported file formats 389
synchronization 433
,
T
tables
560
Index
,
adding 354 403
creating 341
deleting 341
tabs, creating and editing 318
tabs, renaming 318
Tanimoto similarity 497
tautomers, searching for 362
temporary database 346
tetrahedral stereo center hits 373
text
as structures 351
creating 316
customizing 322
fields 343
format toolbar 322 352
sorting 353
styled 352
text box, description 287
text boxes, formatting 289
text files, importing 393
text format toolbar, description 287
themes 289
themes, selecting 454
toolbars
customizing 456
form 288
main 287
record 288
search 288
text 352
text format 288
tools
alternative group 364
attachment point 365
data box 315
frame 315
framed box 315
grid 314
,
layout 314
picture 316
plain text 316
record 338
topology 493
transferring information
to other computers 346
trigger scripts 461
Tutorial 6
Creating a BioViz chart 304
two-variable plot 306
U
understanding forms and databases 292
undo 325
undoing changes 352
undoing data entry 349
uniform bond length 452
union with current list 384
unsaturation 492
unsaturation, in queries 492
username, for secured forms 337
using
atom lists 385
ChemFinder with databases 290
current molecule as a query 375
form tools 314
grids 314
keyboard shortcuts 452
log files 391
periodic table 457
scripts 467
scripts in subforms 403
Visual Basic 468
V
valence
charged atoms 485
checking 453
non-standard state 453
unfilled 484
variable commands, CAL 529
view format for structures, selecting 319
viewing
models with Chem3D 351
results 374
structures 319
structures in Chem3D format 320
viewing subform data in a table 402
Visual Basic 468
W
,
,
Windows metafiles 315 316 317
WMF file format 317
Word files, exporting 396
working with
multiple hit lists 384
subforms, tutorial 309
Working with Clustering 445
working with structures using ChemDraw
350
working with subforms 401
X
X (halogen), special atom type 489
Z
zoom 433
zoom on drag 427
ChemBioFinder & BioViz
User Guide
561
562
Index